Article

Genetic Responses and Aflatoxin Inhibition during Co-Culture of Aflatoxigenic and Non-Aflatoxigenic Aspergillus flavus

by
Rebecca R. Sweany
1,2,*,
Brian M. Mack
1,2,
Geromy G. Moore
1,2,*,
Matthew K. Gilbert
1,2,
Jeffrey W. Cary
1,2,
Matthew D. Lebar
1,2,
Kanniah Rajasekaran
1,2,* and
Kenneth E. Damann, Jr.
2
1
Food and Feed Safety Research Unit, Southern Regional Research Center, US Department of Agriculture, New Orleans, LA 70124, USA
2
Department of Plant Pathology and Crop Physiology, Louisiana State University, Baton Rouge, LA 70808, USA
*
Authors to whom correspondence should be addressed.
Toxins 2021, 13(11), 794; https://doi.org/10.3390/toxins13110794
Submission received: 24 September 2021 / Revised: 30 October 2021 / Accepted: 5 November 2021 / Published: 11 November 2021
(This article belongs to the Special Issue Current Status and Challenges of Aflatoxin Biocontrol Strategies)

Abstract

:
Aflatoxin is a carcinogenic mycotoxin produced by Aspergillus flavus. Non-aflatoxigenic (Non-tox) A. flavus isolates are deployed in corn fields as biocontrol because they substantially reduce aflatoxin contamination via direct replacement and additionally via direct contact or touch with toxigenic (Tox) isolates and secretion of inhibitory/degradative chemicals. To understand touch inhibition, HPLC analysis and RNA sequencing examined aflatoxin production and gene expression of Non-tox isolate 17 and Tox isolate 53 mono-cultures and during their interaction in co-culture. Aflatoxin production was reduced by 99.7% in 72 h co-cultures. Fewer than expected unique reads were assigned to Tox 53 during co-culture, indicating its growth and/or gene expression was inhibited in response to Non-tox 17. Predicted secreted proteins and genes involved in oxidation/reduction were enriched in Non-tox 17 and co-cultures compared to Tox 53. Five secondary metabolite (SM) gene clusters and kojic acid synthesis genes were upregulated in Non-tox 17 compared to Tox 53 and a few were further upregulated in co-cultures in response to touch. These results suggest Non-tox strains can inhibit growth and aflatoxin gene cluster expression in Tox strains through touch. Additionally, upregulation of other SM genes and redox genes during the biocontrol interaction demonstrates a potential role of inhibitory SMs and antioxidants as additional biocontrol mechanisms and deserves further exploration to improve biocontrol formulations.
Key Contribution: This research is the first to report upregulation of different secondary metabolite gene clusters by a non-aflatoxigenic isolate during a biocontrol interaction that reduces acutely toxic and carcinogenic aflatoxin production by Aspergillus flavus. These secondary metabolites and other proteins likely alter the extracellular redox state and inhibit growth and aflatoxin production of A. flavus.

1. Introduction

Aflatoxin is a deadly, acute and carcinogenic toxin to humans, livestock and wildlife [1,2,3,4,5]. Aflatoxin is produced by several different plant pathogenic fungi in Aspergillus section Flavi and contaminates corn, cottonseed, groundnuts and other oil-rich seeds [1,3,4,5]. Aspergillus flavus is blamed for most aflatoxin contamination events because it is most frequently isolated from affected grain [1,4,6]; however, closely related small sclerotia species including A. agricola, A. texensis, A. toxicus, A. minisclerotigenes and the Lethal Aflatoxicosis clade and more distant A. parasiticus, can also be isolated from crops and lead to aflatoxin contamination [7,8,9,10,11,12]. Aflatoxin contamination is especially common during hot and dry growing seasons [1,4]. Globally, aflatoxin is a major food concern and leads to deadly aflatoxicosis outbreaks in Africa [13,14]. It is estimated that aflatoxin contamination of corn costs the US between $50 million and $1 billion a year depending on the severity of the outbreak [2].
Currently, one of the most effective and widespread management tools to mitigate aflatoxin contamination is a pre-harvest biological control utilizing non-aflatoxigenic (Non-tox) isolates of A. flavus [15,16,17,18,19,20,21]. Sterilized grain coated with Non-tox A. flavus isolates are deployed on the soil surface in furrow to outcompete and overtake resident toxigenic (Tox) isolates both in/on the soil and crop. The first single-strain formulations of this type of biocontrol were developed for use on Arizona cotton (Af36 Prevail, Arizona Cotton Research and Protection Council, Phoenix, AZ, USA) and for use on Georgia peanuts (AflaGuard®, Syngenta Global, Basel, Switzerland) by scientists at the U.S. Department of Agriculture [17,18,19]. Now Non-tox biocontrol formulations are labeled for use on corn, almonds, pistachios and figs and recent research efforts are investigating the use in peppers [22]. Worldwide, biocontrol formulations are being developed and registered for use in Italy, Serbia, Argentina, and several African countries, including Nigeria, Kenya, Senegal, Gambia, Burkina Faso, Ghana, Tanzania, Mozambique, Malawi, and Zambia [16,20,23,24]. Many new formulations use multiple, locally-adapted Non-tox A. flavus strains, citing improved effectiveness over single-strain formulations [16,20,21,23,24].
The biocontrol is reported to competitively exclude Tox isolates primarily via direct replacement [17,25,26,27,28]; however, there are additional mechanisms that deserve further study [29,30,31]. When biocontrol is applied to soil surfaces, Non-tox isolate(s) germinate and produce copious conidia (asexual spores) [17,25,26,27,28]. Higher Non-tox inoculum load increases probability of Non-tox flower/seed infection and directly replaces or outcompetes the Tox [17,25,26,27,28]. Direct replacement with Non-tox results in substantial reduction in aflatoxin contamination [16,17,20,21,23,24,25,26,27]. Additionally, in both field and lab experiments, there is greater aflatoxin reduction than would be expected by a one-to-one replacement by Non-tox [15,32,33,34,35]. It is speculated the Non-tox outcompetes or occupies the niche faster, thereby excluding Tox isolates and there is an inhibition of aflatoxin production. Studies have shown that co-inoculation of Non-tox and Tox isolates on both artificial medium and corn, as Non-tox conidium abundance shifts from 20% to 80% [15,32,35], and relative abundance of Tox DNA to Non-tox DNA within kernels [33], the reduction in aflatoxin production is much more substantial than expected by direct replacement alone. This reduction in aflatoxin production is attributed to either plant responses to the Non-tox fungus [15,36] or interference from a different thallus preventing full colony development and delaying secondary metabolism [32]. Since separating Non-tox and Tox cultures by a 0.2 µm porous membrane does not alter aflatoxin production, but aflatoxin production decreased when pore sizes are larger than conidia and hyphae, it was hypothesized that direct contact between Non-tox and Tox isolates leads to an inhibition of aflatoxin production [34]. Recent evidence suggests that several other biocontrol Non-tox isolates and Aspergillus oryzae also produce diffusible chemicals that lead to a reduction in aflatoxin production [33,34,35,36,37,38,39,40]. Additionally, Non-tox isolates can degrade and use aflatoxin as a substrate [41]. The biocontrol may lower aflatoxin contamination by any number of possible mechanisms: directly replacing Tox with Non-tox, inhibiting toxin production by direct contract or touch, secreting diffusible inhibitory and/or degradative chemicals. However, it is still unclear exactly how the Non-tox isolates interfere with aflatoxin production.
Since little is known about how Non-tox isolates reduce aflatoxin production during the biocontrol interaction, an RNA-seq experiment was conducted to determine how gene expression of Tox and Non-tox isolates changed during co-cultivation. A highly inhibitory Non-tox isolate [39,40] from Louisiana was co-cultured with a widely distributed Tox isolate in Louisiana corn [42]. We present evidence of differences in expression of genes presumptively involved in oxidation/reduction reactions and production of proteins that are secreted outside the cell between Tox and Non-tox isolates. Additionally, expression of genes associated with secondary metabolite gene clusters was upregulated before and after contact between Tox and Non-tox isolates. We also present evidence that the Tox isolate grows less in the presence of the Non-tox isolate.

2. Results

RNA sequencing was conducted to better understand changes in gene expression during the biocontrol interaction between non-aflatoxigenic (Non-tox) and toxigenic (Tox) Aspergillus flavus isolates. During this in vitro interaction, aflatoxin production was inhibited. Tox isolate 53 and Non-tox isolate 17 were grown in mono-culture and together in co-cultures for 30 and 72 h, followed by aflatoxin extraction and quantification with HPLC, and total RNA extraction for mRNA library preparation and sequencing using Illumina NextSeq RNA sequencing technology.

2.1. Aflatoxin

Non-tox 17, Tox 53 and their co-cultures produced different quantities of aflatoxin B1 after growing in liquid medium for different time points (30, 72 and 96 h) as indicated by significant interactions (F4,29 = 207, p-value < 0.0001). Tox 53 started producing significant quantities of aflatoxin at 72 h of growth (Table 1). Very limited aflatoxin (<2 ppb) was detected in the biocontrol interaction samples consisting of Tox 53 and Non-tox 17 co-cultures, suggesting the presence of Non-tox 17 severely limited aflatoxin production by Tox 53. Additionally, aflatoxin degradation by Non-tox 17 may have resulted in lower aflatoxin [41], despite the addition of citrate buffer to limit aflatoxin degradation [39,40,43]. Non-tox 17 alone did not produce aflatoxin, thereby confirming its non-aflatoxigenic phenotype.

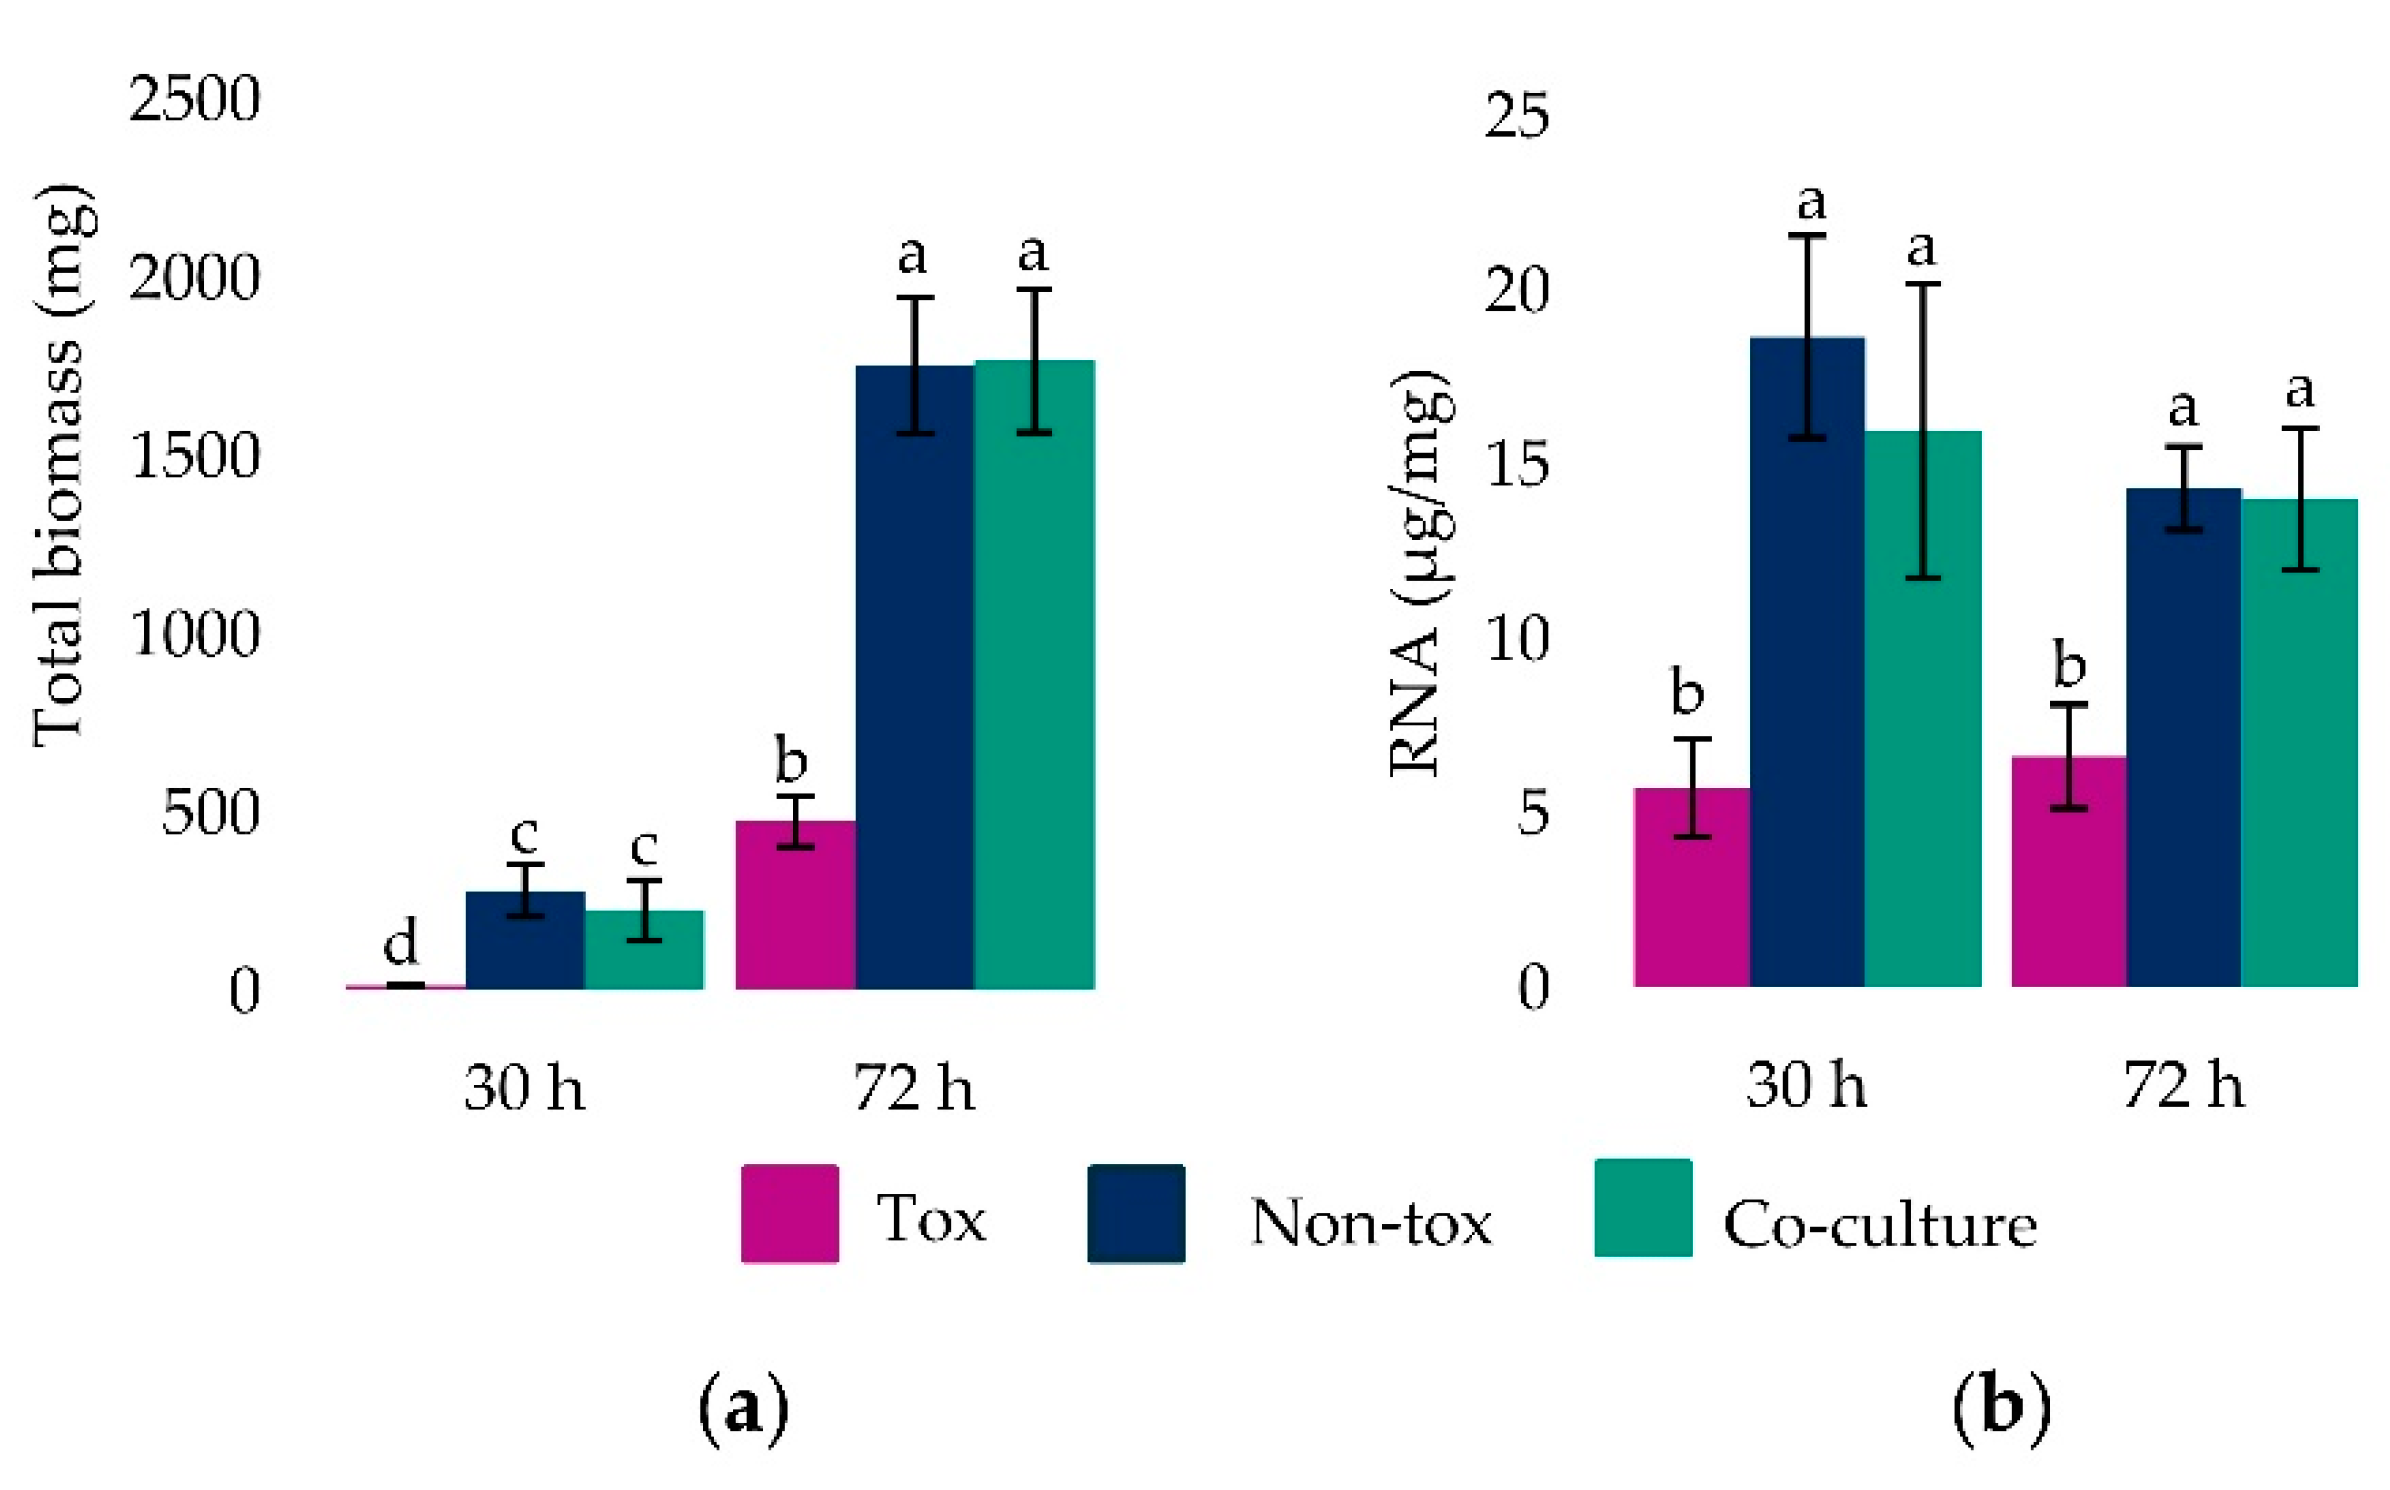
2.2. Fungal Biomass and Total RNA

Tox 53, Non-tox 17 and their co-cultures produced different amounts of mycelial biomass at 30 and 72 h (F2,21 = 58.0, p-value < 0.0001). For each mono- and co-culture, there was more mycelial mass after 72 h (Figure 1). At both 30 and 72 h culture ages, Tox 53 produced less mycelia than Non-tox 17 and the co-cultures. Very little Tox 53 tissue was harvested at 30 h and the least squares estimate was not different from 0 (t21 = 0.38, p-value = 0.71). In contrast to the amount of mycelial tissue harvested, the differences between Non-tox 17, Tox 53 and their co-cultures in amount of total RNA extracted did not vary between 30 and 72 h (F2,18 = 1.82, p-value = 0.19) and culture age alone did not affect total RNA (F1,18 = 2.54, p-value = 0.13). This suggested there were no differences in RNA extraction efficiencies or in RNA production within older tissue. Isolate type affected the total RNA (F2,18 = 32.64, p-value < 0.0001) as less total RNA was extracted from Tox 53 than Non-Tox 17 and co-cultures.

2.3. RNA Sequencing

Between 11 and 30 million paired-end reads were sequenced for Non-tox 17, Tox 53 and co-cultures (Table 2). On average 37% of sequence reads mapped to genes with single-nucleotide differences between Non-tox 17 and Tox 53. In co-culture, only 3% of the unique reads were assigned to Tox 53, which would indicate very little presence or gene expression by Tox 53. That 3% was slightly more than 1% of reads misaligned to Tox 53 in Non-tox 17 pure cultures, suggested as little as 2% of the reads uniquely aligned to Tox 53 in co-culture.

2.3.1. Equating Growth with RNA Production

The observed proportion of reads that uniquely aligned to Tox 53 in co-culture was very low (approximately 0.03 or 3%). Therefore, the observed proportion of Tox 53 reads in co-culture was compared to the expected proportions of Tox 53 based on differences in growth (biomass) or RNA production between Tox 53 and Non-tox 17. The expected proportion of Tox 53 biomass in co-culture was based on mono-cultures and calculated as:
p53 biomass = (Tox 53 biomass (mg)) ÷ total biomass (Tox 53 biomass (mg) + Non-tox 17 biomass (mg))
Total biomass was an estimate of co-cultures’ total biomass that assumed Tox 53 or Non-tox 17 do not influence the growth of either isolate. Expected proportion of Tox 53 was also calculated using RNA (µg/mg mycelium). Multicategorical data analysis (i.e., multiple contingency tables) compared the observed proportion of reads that uniquely aligned to Tox 53 in co-culture to the expected proportion based on Tox 53 biomass or RNA (Figure 2). There was a significant interaction between the proportion of Tox 53 as determined by reads, biomass, total RNA and 30 or 72 h time points (F4,22 = 9288, p-value < 0.0001). At 30 h, 3% of the reads were not significantly less than would be expected based on the growth of Tox 53, but at 72 h there were significantly fewer reads aligned to Tox 53 than would be expected based on both biomass and RNA production (Figure 2). This indicated that co-culturing Tox 53 with Non-tox 17 decreased both RNA transcription and growth of Tox 53. Growth medium was buffered with citrate to maintain pH~4 [39,40,43] and avoid acidification from fungal growth which reduces aflatoxin production and fungal growth, suggesting the reduced Tox 53 growth and transcription during co-culture is unlikely solely from acidification by Non-tox 17.

2.3.2. Differential Gene Expression

Based on principle component analysis, the biological reps clustered closely together; however, 72 h co-cultures had the most variation (Figure 3a). Expression patterns differed between 30 and 72 h cultures and for each time point the co-cultures clustered closely with Non-tox 17. The Non-tox 17 mono-cultures and co-cultures expressed between 1500 and 2000 genes more than Tox 53 with similar amounts of gene downregulation in Tox 53 (Figure 3b). However, very few genes differed in expression between the co-cultures and Non-tox 17 mono-cultures because Non-tox 17 growth dominated Tox 53 growth in co-cultures.

2.3.3. Functional Analysis of Differentially Expressed Genes

Like overall gene expression, gene ontology functional categories differed between Tox 53 and both Non-tox 17 and co-cultures, and very few categories differed between co-cultures and Non-tox 17, likely due to Non-tox 17′s growth dominating the co-cultures (Table 3). Hundreds of genes involved in oxidation/reduction reactions and encoding proteins localized to apoplastic or extracellular spaces were more differentially expressed than any of the other categories between Tox 53 and Non-tox 17. Genes that were typically upregulated in Non-tox 17 were also downregulated in Tox 53. Those trends were mostly consistent between co-cultures and Tox 53 as well. More than 50 zinc finger transcription factor genes were upregulated in Non-tox 17 and co-cultures compared to Tox 53. Most other gene categories were only differentially regulated at 30 or 72 h. Most of the secondary metabolite genes involved in aflatoxin, sterigmatocystin and cyclopiazonic acid production were all downregulated in Non-tox 17 and co-cultures compared to Tox 53. Non-tox 17 does not have any of the genes from these mycotoxin biosynthesis pathways. A few genes from these pathways were upregulated in co-cultures indicating there was some Tox 53 growth present; however, most pathway genes were not expressed at a detectable level. Genes from the biosynthesis pathways of the putative asperfuranone and characterized imizoquin secondary metabolites were also upregulated in Non-tox 17 compared to Tox 53.

2.3.4. Gene Expression in the Aflatoxin Biosynthesis Cluster

The Non-tox 17 isolate does not have aflatoxin cluster genes, explaining the low expression levels indicated in Table 4. Some genes were expressed at a higher level in co-culture compared to Non-tox 17 alone, indicating limited growth of Tox 53 in co-culture. However, since there were fewer than 10 reads per gene at 72 h, there was very little expression of aflatoxin cluster genes, which is supported by the lack of aflatoxin production in co-culture. More genes were differentially expressed, and greater fold differences occurred at 72 h suggesting the lack of detectable aflatoxin at 30 h was due to very low expression of some aflatoxin cluster genes.

2.3.5. Genes Highly Upregulated in Biocontrol Non-Tox 17 Compared to Tox 53

To understand what specific genes may contribute to Non-tox 17′s ability to outcompete Tox 53 and reduce its aflatoxin production during the biocontrol interaction, genes with the greatest upregulation (Log2-fold change ≥ 8) in Non-tox 17 compared to Tox 53 were selected (Table 5a). Differential gene expression between Non-tox 17 and Tox 53 was similar to that of co-culture and Tox 53 alone, likely due to limited growth of Tox 53 in co-culture. The upregulated genes in Non-tox 17 compared to Tox 53 represent a diversity of potential functions including oxidation/reduction reactions, peroxisome production, metabolism, and protein-protein interactions. These functions are consistent with the predominant gene functions identified by functional enrichment analysis. Interesting, most of the highly expressed genes were on chromosome 5. AFLA_060320 and AFLA_060350, and AFLA_095290 and AFLA_095300 were co-located, but there was no similar trend for surrounding genes to be differentially expressed in those regions of the chromosome (Table S1). However, nearby genes AFLA_062960, 062980, and 062990 were upregulated and are in a secondary metabolite cluster 20 as predicted by SMURF [44,45]. Most of the remaining genes in cluster 20 were also upregulated in both Non-tox 17 and co-cultures, suggesting a potential role for differential secondary metabolism during the biocontrol interaction (Table 5b). Gene cluster 20 is predicted to produce asperfuranone [45,46] which was only found to be enriched at 72 h. Here, the genes were all differentially expressed at 30 and 72 h. When Tox 53 grew alone, no reads aligned to genes in the latter portion of SMURF cluster 20, starting with AFLA_062940. Since only AFLA_062800-AFLA_062880 are required for asperfuranone production [46], the remaining genes in cluster 20 are likely a separate secondary metabolite cluster only produced by Non-tox 17.

2.3.6. Genes Upregulated in Response to Tox 53

To further identify genes that may contribute to Non-tox 17′s ability to limit aflatoxin production during the biocontrol interaction, genes upregulated in response to Tox 53 were identified. Since co-cultures were dominated by Non-tox 17, genes that were further upregulated in Non-tox 17 in response to the presence of Tox 53 should have greater than 2 log2-fold differential expression in co-cultures than both Tox 53 and Non-tox 17 alone (Table S2). Only 10 genes fit these criteria and the fold changes only ranged from 2–3.2 when comparing co-cultures to Non-tox 17. If the criteria were loosened to greater than 1, 12 genes were upregulated compared to Non-tox 17 and Tox 53 in co-culture. Of the 12 genes, only AFLA_016350 (predicted NAD (P)H-dependent reductase) was expressed at a higher level in co-culture compared to Non-tox 17 at 30 h.
A closer inspection of the fold change values between co-cultures and Tox 53 revealed several genes that had slightly higher fold changes than Non-tox 17 alone vs. Tox 53, suggesting there could be a higher number of reads from Non-tox 17 in co-culture compared to Non-tox 17 alone, despite some relative expression levels indicating a lack of significance between co-culture and Non-tox 17. Reads per kilobase per millions of reads mapped (RPKM) values are shown for genes with higher RPKM values in co-culture than both Non-tox 17 and Tox 53 mono-cultures (Table 6a). Additionally, generalized linear models and post hoc least squares means (log odds) comparisons separated treatments based on normalized read counts per gene per total reads (proportion of total reads) (Table 6), like DESeq2 differential gene expression methodology on read counts without using their data smoothing algorithms [47]. Without smoothing an additional 17 genes, that were expressed at slightly higher levels in co-culture vs. Tox 53 comparisons than in the individual Non-tox 17 vs. Tox 53 comparisons, were found to have significantly more reads mapped to the co-culture than both Tox 53 and Non-tox 17 alone, suggesting that co-culturing the two isolates induced expression of several genes in Non-tox 17. Like differential expression using the fold changes from DESeq2, the greatest differential expression was at 72 h and most genes were expressed in larger abundance in co-cultures based on RPKM at 72 h.
Many genes induced in response to Tox 53 functions are membrane transport proteins, metal- or heme-binding proteins (potentially chelators), involved in oxidation/reduction reactions and metabolism. Several genes were part of a secondary metabolite cluster predicted by both antiSMASH [48] (cluster 8.5) and SMURF (cluster 46) [45], which encodes for the PKS responsible for orsellinic acid, a precursor to many polyketides like lecanoric acid and the pigments F-9775A and B [49] as well as meroterpenoids like LL-Z1272β (Ilicicolin B) [50]. The most highly-expressed genes in this cluster were the efflux pump and an O-methyl transferase that could convert the orsellinic acid precursor to 3,5-dimethylorsellicinc acid, itself a precursor to ausitinol in A. nidulans [49]. AFLA_096040 and AFLA_096060 are two of the three genes found in the kojic acid biosynthesis pathway [51]. Despite co-culture having a 1.3 log2-fold change from Non-tox 17 alone, AFLA_096040 (an oxidoreductase) had the greatest RPKM value of all genes upregulated in the co-culture, from both Non-tox 17 and Tox 53. The RPKM value for AFLA_096040 was 16X greater than AFLA_096060, suggesting that even though there was a smaller log2-fold change difference (1.3 vs. 2.2) between co-culture and Non-tox 17, there would be more mRNA molecules for AFLA_096040. Similarly, when comparing the RPKM values of highly upregulated genes in Non-tox 17 and co-culture compared to Tox 53 to RPKM values of genes upregulated in co-culture than both Tox 53 and Non-tox 17, only five of the 13 (38%) genes had RPKM values greater than 50 when selected based on greater than 8-fold changes (Table 6b). Conversely, 14 of the 29 (48%) genes had RPKM values greater than 50 despite low log2-fold changes (1–3.2) or lack of significant difference from DeSeq2 analysis between co-cultures and both Non-tox 17 and Tox 53. This suggests that when selecting influential genes, both abundance and relative abundance should be considered.

2.3.7. Differential Expression of Imizoquin Biosynthesis Genes

Imizoquin biosynthesis was predicted to be enriched in Non-tox 17 compared to Tox 53; however, during close inspection of differential expression between Tox 53 and Non-tox 17 and co-cultures, none of the genes in imizoquin biosynthesis (imq) were highly differentially expressed (Table 3). Only 4 of 11 genes (AFLA_064230–064330) in the imq cluster [52] were found to be upregulated in both Non-tox 17 and co-cultures compared to Tox 53 at 72 h with log2-fold changes ranging between 1.8 and 4.8, (Table S1). However, upon comparing RPKM values there were differences in gene expression in between Tox 53, Non-tox 17 and co-cultures (Table 7). At both 30 and 72 h there was very little expression of genes in the imq cluster by Tox 53. However, it was found that at 30 h there is substantial expression of genes in Tox 53 from a secondary metabolite gene cluster (AntiSMASH cluster 1.1) adjacent to the imq cluster that may be associated with production of a toxic gliotoxin-like metabolite, likely aspirochlorine (AFLA_064340-AFLA_064610, acl) [53]. In several instances, there was less gene expression in co-cultures than Non-tox 17 though still greater than Tox 53, suggesting that imizoquin and aspirochlorine production is slightly attenuated in response to Tox 53.

3. Discussion

The current study investigated differences in gene expression during the biocontrol interaction between a non-aflatoxigenic Aspergillus flavus isolate (Non-tox 17) and a toxigenic isolate (Tox 53) which severely limits aflatoxin production by Tox 53. In support of the prevailing theory that competitive exclusion occurs by direct replacement of Tox with Non-tox isolates, Tox 53 grew much less both in mono-culture and co-culture with Non-tox 17. Since there was less Tox 53 RNA in co-cultures than expected based on its growth characteristics, in addition to significantly reduced transcription of both aflatoxin and CPA cluster genes, the data suggest Non-tox 17 is limiting gene expression and growth of Tox 53 as previously observed [32,33,37]. Non-tox 17 and other biocontrol isolates need to be further evaluated for their anti-fungal activity during co-culture. Limited growth of Tox 53 resulted in similar gene expression profiles between co-cultures and Non-tox 17. Expression of genes encoding proteins presumptively functioning in redox reactions, transcription factors and secreted proteins differed between Non-tox 17 and Tox 53 suggesting their possible roles in fungal growth and aflatoxin inhibition or degradation. Genes in select secondary metabolite clusters were either upregulated in Non-Tox 17 (asperfuranone and imizoquin) or further upregulated when co-cultured with Tox 53 (kojic acid and orsellinic acid). We are currently investigating if these secondary metabolites play a role in inhibition of aflatoxin production through both touch inhibition and recently reported contactless inhibition by chemicals secreted in culture filtrates from Non-tox (e.g., Non-tox 17) biocontrol isolates [37,38,39,40]. Several genes with statistical differences between samples but a log2-fold change less than 2 had very high RPKM (>100–1000) values, whereas genes with the highest log2-fold changes had RPKM values typically under 50. This suggests that using log2-fold changes can identify genes with high differential expression that are not expressed at high levels, therefore, RPKM values should also be considered to determine if differential expression of a gene will contribute more transcripts and potentially become more biologically influential. Based on our observations, biocontrol strains such as Non-tox 17 likely lower aflatoxin contamination by a combination of outcompeting and displacing Tox 53 and producing secondary metabolites, which may alter the redox state and extracellular environment or otherwise inhibit important cellular processes.
The majority of differentially expressed genes in the Non-tox 17 mono-culture and during co-culture were involved in oxidation and reduction reactions. It is hypothesized that aflatoxin is produced to minimize oxidative stress from the host plant’s oxidative burst that occurs during fungal invasion or drought stress [36,54,55]. Several genes in the aflatoxin biosynthesis pathway are sources of reactive oxygen species (ROS) [54] and mutants and natural non-aflatoxigenic A. flavus and A. parasiticus strains are more sensitive to growth medium amended with H2O2 [54,55]. Aflatoxin production is induced by H2O2 and it was suggested that during aflatoxin synthesis, antioxidative enzymes scavenge H2O2 from the environment and sequester ROS in vesicles, thereby alleviating oxidative stress in the fungus [54,55,56]. Alternatively, aflatoxin production may be a source of oxidative stress to the fungus due to a buildup of ROS, and it was shown that toxigenic isolates have greater glutathione S-transferase activity at the onset of aflatoxin production in comparison with Non-tox isolates [57,58]. Glutathione S-transferase activity should mollify oxidative stress resulting in a decrease in aflatoxin production [57,58]. Interestingly, most corn isolates are Non-tox or low toxin producers [42], provide the majority of biomass during co-infection of kernels with Tox isolates [33], and survive greater ROS defense responses from plants [36]. This suggests Non-tox isolates have alternative mechanisms to alleviate oxidative stress which may explain why we observed that most differentially expressed genes are involved in oxidation and reduction reactions. NRRL 21882, the Non-tox isolate in AflaGuard®, differentially expressed more genes involved in oxidation and reduction than Tox isolates from H2O2–induced oxidative stress [56]. Further studies are needed to determine if Non-tox isolates alter the redox environment, resulting in decreased aflatoxin production and invasion of plant tissue by Tox isolates.
In addition to limited growth of Tox 53 during co-culture with Non-tox 17, there was also reduced expression of aflatoxin biosynthesis pathway genes. Multiple Non-tox isolates downregulated aflR, aflJ, omtA, ordA, pksA, and vbs when co-cultured with Tox isolates [59]. During co-culture, it is impossible to rule out that inhibition of aflatoxin production is only due to outcompeting the Tox isolate by the Non-tox isolate since here Tox 53 grew substantially less than Non-tox 17. However, cell-free Non-tox media filtrates from A. flavus, including Non-tox 17 and A. oryzae, inhibited aflatoxin production [37,38,39,40,60] or degraded aflatoxin [41]. Genes in the early and middle portions of the aflatoxin biosynthesis pathway were downregulated in NRRL 3357 in response to A. oryzae filtrates [60]. The aflatoxin biosynthetic pathway-specific co-activator, aflS, was substantially downregulated, but there was not significantly less expression of the transcriptional activator aflR [60]. Contrary to our findings, there was greater expression of imizoquins and cyclopiazonic acid upon exposure to only culture filtrates [60]. These results indicate that Non-tox isolates may lower aflatoxin production by both displacement and inhibition of aflatoxin production through production of chemicals capable of downregulating expression of critical aflatoxin biosynthetic pathway genes.
Expression of several secondary metabolite cluster genes was either upregulated more in Non-tox 17 compared to Tox 53 and/or further upregulated in response to Tox 53 during co-culture. Some of these may be candidate compounds that interfere with aflatoxin production during the biocontrol interaction. Genes involved in kojic acid synthesis had the greatest RPKM values during co-culture. Kojic acid is commonly found in soy sauce and miso, and functions as an antioxidant that inhibits browning due to polyphenol oxidases in potatoes, apples and mushrooms [61]. It is also used in the cosmetic industry to lighten skin by inhibiting melanization [61]. During the biocontrol interaction, kojic acid may serve as an antioxidant resulting in less aflatoxin production by Tox isolates. Under elevated H2O2–induced oxidative stress, kojA expression increased in NRRL 3357 and NRRL 21,882 (AflaGuard), while other Tox and Non-tox isolates demonstrated normal levels of kojA expression [56]. In this manuscript, 30 and 72 h Non-tox 17 fungal cultures produced more transcripts than one-week-old cultures in Fountain et al. [56], suggesting transcription of genes in kojic acid synthesis may diminish with culture age, or Non-tox 17 produces much more kojic acid transcripts than other A. flavus isolates. Although the RPKM values were less, genes in the predicted orsellinic acid biosynthesis cluster (antiSMASH cluster 8.5, SMURF 46) [45] were also upregulated in response to Tox 53. The orsellinic acid gene in A. nidulans was turned on when the fungus physically interacted with the bacterium Streptomyces rapamycinicus [62], resulting in production of orsellinic acid and its derivatives: lecanoric acid, F-9775A, and F-9775B. A similar phenomenon could be occurring in our experiments (e.g., increased expression of the orsellinic acid biosynthesis cluster genes occurring after contact with other fungal hyphae). Predicted asperfuranone genes (SMURF cluster 20) [45,46] were expressed more by Non-tox 17 and co-cultures than Tox 53. Asperfuranone inhibits growth of small lung cancer cells and induces apoptosis [63], suggesting that asperfuranone could potentially inhibit growth of Tox 53. Finally, imizoquin cluster genes [52] were expressed at higher levels by Non-tox 17 at 30 and 72 h compared to Tox 53; co-cultures expressed intermediate levels. Imizoquins were downregulated in response to an isolate of Ralstonia solanacearum that produced a lipopeptide, which induced chlamydospore production in A. flavus [52,64]. Loss of imizoquin production delays spore germination and increases sensitivity to H2O2–induced oxidative stress [52] suggesting it is involved in spore germination and can act as an antioxidant. Continued expression of imizoquin cluster genes by Non-tox 17 may reduce aflatoxin production in Tox 53 by reducing oxidative stress. Future metabolomic studies will be used (1) to determine if kojic acid, orsellinic acid, asperfuranone, and imizoquins are produced by Non-tox 17 alone and in co-culture, and (2) to understand how they regulate growth and aflatoxin production of A. flavus.
Non-tox A. flavus isolates are widely used as biocontrol agents to effectively manage aflatoxin contamination of peanuts, corn, cottonseed and pistachios [15,16,17,18,19,20,21]. Although the biocontrol has been shown to work primarily via direct replacement of Tox isolates with Non-tox isolates [17,25,26,27,28], as was confirmed in this manuscript, it is important to understand how Non-tox isolates molecularly and biochemically inhibit growth and toxin production of Tox A. flavus. Secondary metabolites previously found to be regulated in response to other microorganisms also produced different numbers of transcripts. Kojic acid and imizoquins, along with different individual genes, potentially alter aflatoxin production by serving as antioxidants. The greater antioxidant activity provided by kojic acid, imizoquins and other oxidation/reduction genes potentially gives the Non-tox a competitive advantage when infecting crops. Asperfuranone potentially acts in the biocontrol interaction by inhibiting growth. Future directions include determining if these chemicals are produced during the biocontrol interaction and assess their effects on A. flavus growth. If A. flavus chemicals (i.e., secondary metabolites) inhibit aflatoxin production, biocontrols should be evaluated for production of the most inhibitory chemicals, and then engineered to overproduce those chemicals or developed into a spray treatment mimicking the presence of Non-tox A. flavus.

4. Materials and Methods

4.1. Fungal Isolates

Aspergillus flavus Non-tox isolate 17, also named 07-S-3-1-6 (SRRC1588), was isolated from Louisiana corn field soil in 2007 [42] and is highly inhibitory to aflatoxin production [39,40]. Tox isolate 53 (SRRC1669) was isolated from Louisiana-grown, surface-sterilized corn kernels in 2003 [34], is highly toxigenic, and belongs to vegetative compatibility group RRS4 [42] originally isolated from corn kernels throughout Louisiana and along the Mississippi River in the US [65]. Tox 53 demonstrated the importance of physical interaction for toxin inhibition during a previous biocontrol interaction [34]. Both isolates are deposited in an accessible culture collection at the USDA-ARS Southern Regional Research Center (SRRC) in New Orleans Louisiana.

4.2. Biocontrol Interaction Cultural Experimental Design

RNA and aflatoxin were extracted from Tox 53 and Non-tox 17 isolates grown alone in mono-culture and together in co-cultures to understand how their gene expressions and aflatoxin production change in response to one another during the biocontrol interaction (i.e., co-cultures). Fresh conidia from 5-day old Tox 53 and Non-tox 17 cultures (grown in dark at 30 °C on 5% V8 juice, 2% agar, pH 5.2 medium) were suspended in glucose salts liquid medium (GS), with citrate buffer (pH 4) [32,34,43,66], at 1 × 10⁵ conidia/mL. Citrate buffer was added to maximize aflatoxin production, limit aflatoxin degradation and limit detrimental effects to fungal growth by low pH [39,40,43,66]. Buffered GS medium consisted of one part water, 2 parts 2.5 X salts and 2 parts 2.5 X glucose, mixed after autoclaving. One liter of 2.5 X salts consisted of 8.76 g (NH4)SO4, 1.88 g KH2PO4, 0.88 g MgSO4·7H2O, 0.188 g CaCl2·2H2O, 0.025 g ZnSO4·7H2O, 0.0125 g MnCl2·4H2O, 0.005 g (NH4)6Mo7O24·4H20, 0.005 g Na2B4O7·10H2O and 0.005 g FeSO4·7H2O with 25.36 g citric acid and 17.03 g sodium citrate. One liter of 2.5 X glucose consisted of 125 g glucose. For mono-cultures, 15 mL of Non-tox 17 or Tox 53 conidial- GS medium suspensions were dispensed into 100 × 15 mm Petri dishes. For co-cultures, equal volumes of Non-tox 17 and Tox 53 conidial- GS medium suspensions were mixed and 15 mL were dispensed into the Petri dishes. Separate cultures were grown for 30, 72 and 96 h. There were at least 4 biological replicates for each cultural condition (Table 8). To obtain enough tissue for RNA extraction at 30 h, a biological replicate consisted of 9 Petri-dish cultures. For all other time points, only one Petri-dish was used per biological replicate. The isolate mono-cultures, co-cultures and time points grew in separate boxes (five Petri dishes per box) within a darkened 25 °C incubator to minimize potential effect of differential volatile production between isolates on aflatoxin production [66,67]. RNA was extracted from 30 and 72 h cultures and aflatoxin was extracted from 30, 72 and 96 h cultures.

4.3. Aflatoxin Extraction and Quantification

At 30 h, 100 µL of liquid medium from each dish (n = 9) per biological rep was added to HPLC grade methanol. At 72 and 96 h, 500 µL of medium from each biological replicate (a single Petri dish) was added to 500 µL of HPLC grade methanol. Extracts were filtered through 200 mg basic alumina (58Å, 60-mesh powder, 11503-A1, Alfa Aesar, Tewksbury MA) in 1.5 mL polypropylene columns with 20 µm polyethylene frits [68]. 10 µL of each sample was separated in a Waters e2695 Separations Model HPLC (Waters Corp., Milford, MA) using a Nova-Pak C18 4 µm, 3.9 mm × 150 mm column held at 38 °C with an isocratic solvent system (37.5 Methanol: 62.5 water at a 0.8 mL/min) coupled to a PHRED photochemical reactor cell (Aura Industries Inc., New York, NY, USA). After separation and photolytic derivatization, a 2475 FLR Detector (Waters Corp., Milford, MA, USA) was used to detect and quantify aflatoxin B1 (365 nm Ex, 440 nm Em) [69,70]. Run time was 17 min with aflatoxin B1 peak eluting at~13.5 min. Empower software (Waters Corp., Milford, MA, USA) was used to integrate the aflatoxin B1 peak. Aflatoxin quantity was calculated based on a calibration curve calculated from 4 replicates of standards with 1, 5, 50, 500 and 1000 ng/mL aflatoxin B1 [70]. Aflatoxin B1 minimum level of detection was <0.05 ppb and minimum quantification from standard curve was 1 ppb.

4.4. Whole Fungal Mycelia Harvest and RNA Extraction

At 30 and 72 h, mycelia and medium were removed from the Petri dishes and centrifuged at 8000× g for 5 min at 4 °C. Thirty-hour tissues from nine plates per biological rep were pooled and centrifuged a second time for 5 min. Excess medium was removed by carefully blotting mycelia on chromatography paper. The tissue was added to a pre-weighed microcentrifuge tube (to calculate wet weight) and flash frozen with liquid nitrogen. RNA extraction was performed according the manufacture’s guidelines for the Spectrum™ Plant Total RNA Kit (STRN250, Sigma-Aldrich, St. Louis, MO, USA) and the On-column Dnase I Digestion Set (DNASE70, Sigma-Aldrich, St. Louis, MO, USA) with a couple of modifications. All tissue from a single biological replicate was ground directly in lysis buffer (100 mg mycelia/500 μL lysis buffer). A few 30 h cultures had less than 100 mg, which were still ground in 500 μL lysis buffer. For each sample, 500 μL was retained for RNA extraction. Binding buffer was increased to 750 μL due to inefficient RNA extraction from the residual medium.

4.5. RNA Sequencing and Analysis

Three RNA extracts per experimental condition were sequenced by NC State University’s Genomic Sciences Laboratory using an Illumina NextSeq 500, which generated 150 bp paired-end reads. Sequencing reads were submitted to NCBI’s Sequence Read Archive and can be accessed under BioProject ID PRJNA764255. Sequence reads were trimmed to remove adapters and low-quality sequences using BBDuk [71]. Sequencing reads were mapped to the A. flavus NRRL 3357 genome (JCVI-afl1-v2.0 assembly, (https://www.ncbi.nlm.nih.gov/assembly/GCF_000006275.2/#/st, accessed on 8 April 2019) using STAR v2.6.1 [72]. Reads mapped to exons were counted using featureCounts v1.6.0 [73] followed by differential expression testing of normalized reads using a generalized linear model with log link and a negative binomial distribution within DESeq2 [47]. Genes were removed if they did not have at least 10 reads in 3 or more samples. Genes were considered differentially expressed if the pairwise comparison by DESeq2 software p-value was less than 0.05 and if there was a log2-fold change greater than 2 [47]. To make the principal component analysis (PCA) plot, regularized log counts were produced with the DESeq2′s rlog function and the option “blind = TRUE” was set [47]. These were used as input to the plotPCA function in DESeq2 [47]. In order to quantify the fraction of RNA-seq reads contributed by each strain, variants were called using Freebayes [74]. Variants that were different between Non-tox 17 and Tox 53 were used in a custom python script utilizing the pysam library (https://github.com/pysam-developers/pysam, accessed on 8 April 2019)) and SAMtools [75] to assign reads from the mixed cultures to each strain. Functional enrichment analysis was performed with the enrichment function in BC3NET R package [76], which uses a one-sided Fisher’s Exact test with the Benjamini and Hochberg adjustment [77].
Excel version 2102 (Microsoft corp., Redmond, WA) was used to sort pairwise log2-fold differential gene expression testing from DESeq2 for each pairwise comparison of Non-tox 17 vs. Tox 53, Co-culture vs. Tox 53, and Co-culture vs. Non-tox 17 at 30 and 72 h. Genes that were overexpressed in biocontrol isolate Non-tox 17 were selected if the log2-fold change was ≥8. Genes that were further upregulated in Non-tox 17 during co-culture were selected if Co-culture vs. Tox 53 and Co-culture vs. Non-tox 17 log2-fold changes were >1. Additionally, further upregulated genes were selected if the differences between Co-culture vs. Tox 53 and Non-tox 17 vs. Tox 53 were log2-fold changes at least 1. Since the latter selection criterion was not statistically different based on DESeq2 analysis of normalized reads, generalized linear models were calculated to compare gene expression for each of those genes using the logit (log odds, i.e., (proportion reads (proportion (p) reads aligned to gene X/(p reads not aligned to gene X)) link for binomial data with SAS version 9.4 (SAS Institute, Cary, North Carolina). The fixed effects were culture type (Non-tox 17, Tox 53 and Co-culture) and culture age (30 and 72 h). The response variable was reads/total reads. Treatments were separated by post hoc comparison of odds with a difference of least squares means at α ≤ 0.05. Excel was also used to calculate reads per kilobase per million mapped reads (RPKM) for genes selected by sorting. RPKM for gene X = (1 × 10⁹) (read mapped to gene X)/(gene X length bp) (total reads mapped) [47,78].

4.6. Other Data Analysis

Generalized linear models estimated multivariate analysis of variance to compare biomass, total RNA and aflatoxin B1 between treatments using SAS. To address issues with normality, aflatoxin values were log transformed. In each model, fixed effects were either isolate growing alone or in co-culture, extraction time, and their interaction. Means were separated by post hoc comparison with a difference of least squares means at α ≤ 0.05. To determine if the number of reads which uniquely aligned to Non-tox 17 and Tox 53 during co-culture was similar to the expected ratio based on biomass and RNA production of each isolate growing separately, generalized linear models estimated multiple categorical data analysis (i.e., multiple contingency tables) using logit link and binomial distribution with SAS. Log odds (p Tox 53/p Non-Tox 17) were calculated within the model by inputting the events (either number of unique reads, biomass or total RNA of the Non-tox) and dividing by trials (total number of reads, sum of biomass and total RNA of Non-Tox 17 and Tox 53 isolates). Odds were separated by post hoc comparison with a difference of least squares means at α ≤ 0.05.

Supplementary Materials

The following are available online at https://www.mdpi.com/article/10.3390/toxins13110794/s1, Table S1. Log2-fold changes for gene expression in Non-tox 17 versus (v) Tox 53, Co-culture vs. Tox 53, and Co-culture vs. Non-tox 17 at 30 and 72 h pair-wise comparisons if the fold change was ≥2 and p-values were ≤0.05; Table S2. Genes upregulated in Co-cultures compared to Tox 53 and Non-tox 17.

Author Contributions

The authors contributed to different portions of this research including: Conceptualization, R.R.S., K.E.D.J. and G.G.M.; methodology, R.R.S., M.K.G., J.W.C., B.M.M., G.G.M. and K.E.D.J.; software, B.M.M.; formal analysis, R.R.S., B.M.M. and M.K.G.; investigation, R.R.S.; data curation, B.M.M.; writing—original draft preparation, R.R.S. and B.M.M.; writing—review and editing, R.R.S., J.W.C., M.D.L., G.G.M., B.M.M., M.K.G., K.R. and K.E.D.J.; visualization, R.R.S. and B.M.M.; supervision, K.E.D.J., K.R. and M.K.G.; project administration, G.G.M., K.R., J.W.C. and K.E.D.J. All authors have read and agreed to the published version of the manuscript.

Funding

This research was funded by the United States Department of Agriculture (USDA), Agricultural Research Service (CRIS No. 6054-41420-009-00D).

Institutional Review Board Statement

Not applicable.

Informed Consent Statement

Not applicable.

Data Availability Statement

Sequencing reads were submitted to NCBI’s Sequence Read Archive and can be accessed under BioProject ID PRJNA764255 and can be accessed at https://www.ncbi.nlm.nih.gov/sra. The remaining data is contained within the article and Supplementary Materials.

Acknowledgments

We thank David Andrew Baltzegar at North Carolina State University’s Genomic Sciences Laboratory for technical advice during preparation of samples for RNA sequencing. We thank Zhi-Yuan Chen and Yenjit Raruang at Louisiana State University, Department of Plant Pathology and Crop Physiology for technical assistance and use of HPLC machine to quantify aflatoxin.

Conflicts of Interest

The authors declare no conflict of interest.

References

  1. Horn, B.W. Ecology and population biology of aflatoxigenic fungi in soil. J. Toxicol. Toxin Rev. 2003, 22, 351–379. [Google Scholar] [CrossRef]
  2. Mitchell, N.J.; Bowers, E.; Hurburgh, C.; Wu, F. Potential economic losses to the USA corn industry from aflatoxin contamination. Food Addit. Contam. A 2016, 33, 540–550. [Google Scholar] [CrossRef]
  3. Richard, J.L. Discovery of aflatoxins and significant historical features. Toxin Rev. 2008, 27, 171–201. [Google Scholar] [CrossRef]
  4. Wicklow, D.T. Epidemiology of Aspergillus flavus in Corn. In Aflatoxin in Corn: New Perspectives; Shotwell, O.L., Hurburgh, C.R., Jr., Eds.; Research Bulletin—Iowa State University, Agricultural and Home Economics Experiment Station: Ames, IA, USA, 1991; Volume 599, pp. 315–328. [Google Scholar]
  5. Yu, J.; Cleveland, T.E.; Nierman, W.C.; Bennett, J.W. Aspergillus flavus genomics: Gateway to human and animal health, food safety, and crop resistance to diseases. Rev. Iberoam. Micol. 2005, 22, 194–202. [Google Scholar] [CrossRef]
  6. Cotty, P.J. Virulence and cultural characteristics of two Aspergillus flavus strains pathogenic on cotton. Phytopathology 1989, 79, 808–814. [Google Scholar] [CrossRef] [Green Version]
  7. Geiser, D.M.; Pitt, J.I.; Taylor, J.W. Cryptic speciation and recombination in the aflatoxin-producing fungus Aspergillus flavus. Proc. Natl. Acad. Sci. USA 1998, 95, 388–395. [Google Scholar] [CrossRef] [PubMed] [Green Version]
  8. Geiser, D.M.; Dorner, J.W.; Horn, B.W.; Taylor, J.W. The phylogenetics of mycotoxin and sclerotium production in Aspergillus flavus and Aspergillus oryzae. Fungal Genet. Biol. 2000, 31, 169–179. [Google Scholar] [CrossRef] [Green Version]
  9. Probst, C.; Callicott, K.A.; Cotty, P.J. Deadly strains of Kenyan Aspergillus are distinct from other aflatoxin producers. Eur. J. Plant Pathol. 2012, 132, 419–429. [Google Scholar] [CrossRef]
  10. Singh, P.; Orbach, M.J.; Cotty, P.J. Aspergillus texensis: A novel aflatoxin producer with S morphology from the United States. Toxins 2018, 10, 513. [Google Scholar] [CrossRef] [Green Version]
  11. Singh, P.; Callicott, K.A.; Orbach, M.J.; Cotty, P.J. Molecular analysis of S-morphology aflatoxin producers from the United States reveals previously unknown diversity and two new taxa. Front. Microbiol. 2020, 11, e1236. [Google Scholar] [CrossRef]
  12. Varga, J.; Frisvad, J.C.; Samson, R.A. A reappraisal of fungi producing aflatoxins. World Mycotoxin J. 2009, 2, 263–277. [Google Scholar] [CrossRef]
  13. Probst, C.; Njapau, H.; Cotty, P.J. Outbreak of an acute aflatoxicosis in Kenya in 2004: Identification of the causal agent. Appl. Environ. Microb. 2007, 7, 2762–2764. [Google Scholar] [CrossRef] [Green Version]
  14. Probst, C.; Schulthess, F.; Cotty, P.J. Impact of Aspergillus section Flavi community structure of the development of lethal levels of aflatoxins in Kenyan maize (Zea mays). J. Appl. Microbiol. 2010, 108, 600–610. [Google Scholar] [CrossRef]
  15. Abbas, H.K.; Weaver, M.A.; Horn, B.W.; Carbone, I.; Monacell, J.T.; Shier, W.T. Selection of Aspergillus flavus isolates for biological control of aflatoxins in corn. Toxin Rev. 2011, 30, 59–70. [Google Scholar] [CrossRef]
  16. Bandyopadhyay, R.; Ortega-Beltran, A.; Akande, A.; Mutegi, C.; Atehnkeng, J.; Kaptoge, L.; Senghor, A.L.; Adhikari, B.N.; Cotty, P.J. Biological control of aflatoxins in Africa: Current status and potential challenges in the face of climate change. World Mycotoxin J. 2016, 9, 771–789. [Google Scholar] [CrossRef] [Green Version]
  17. Cotty, P.J. Influence of field application of an atoxigenic strain of Aspergillus flavus on the populations of A. flavus infecting cotton bolls and on the aflatoxin content of cottonseed. Phytopathology 1994, 84, 1270–1277. [Google Scholar] [CrossRef]
  18. Cotty, P.J.; Bhatnagar, D. Variability among atoxigenic Aspergillus flavus strains in ability to prevent aflatoxin contamination and production of aflatoxin biosynthetic pathway enzymes. Appl. Environ. Microb. 1994, 60, 2248–2251. [Google Scholar] [CrossRef] [Green Version]
  19. Dorner, J.W.; Cole, R.J. Effect of application of nontoxigenic strains of Aspergillus flavus and A. parasiticus on subsequent aflatoxin contamination of peanuts in storage. J. Stored Prod. Res. 2002, 38, 329–339. [Google Scholar] [CrossRef]
  20. Moral, J.; Garcia-Lopez, M.T.; Camiletti, B.X.; Jaime, R.; Michailides, T.J.; Bandyopadhyay, R.; Ortega-Beltran, A. Present status and perspective on the future use of aflatoxin biocontrol products. Agronomy 2020, 10, 491. [Google Scholar] [CrossRef] [Green Version]
  21. Pitt, J.I. The pros and cons of using biocontrol by competitive exclusion as a means for reducing aflatoxin in maize in Africa. World Mycotoxin J. 2019, 12, 103–112. [Google Scholar] [CrossRef]
  22. Ezekiel, C.N.; Ortega-Beltran, A.; Oyedeji, E.O.; Atehnkeng, J.; Kössler, P.; Tairu, F.; Hoeschle-Zeledon, I.; Karlovsky, P.; Cotty, P.J.; Bandyopadhyay, R. Aflatoxin in chili peppers in Nigeria: Extent of contamination and control using atoxigenic Aspergillus flavus genotypes as biocontrol agents. Toxins 2019, 11, 429. [Google Scholar] [CrossRef] [Green Version]
  23. Alaniz Zanon, M.S.; Barros, G.G.; Chulze, S.N. Non-aflatoxigenic Aspergillus flavus as potential biocontrol agents to reduce aflatoxin contamination in peanuts harvested in Northern Argentina. Int. J. Food Microbiol. 2016, 16, 63–68. [Google Scholar] [CrossRef]
  24. Savić, Z.; Dudaš, T.; Loc, M.; Grahovac, M.; Budakov, D.; Jajić, I.; Krstović, S.; Barošević, T.; Krska, R.; Sulyok, M.; et al. Biological Control of Aflatoxin in Maize Grown in Serbia. Toxins 2020, 12, 162. [Google Scholar] [CrossRef] [PubMed] [Green Version]
  25. Cotty, P.J.; Bayman, P. Competitive exclusion of atoxigenic strain of Aspergillus flavus by an atoxigenic strain. Phytopathology 1993, 83, 1283–1287. [Google Scholar] [CrossRef]
  26. Dorner, J.W.; Cole, R.J.; Connick, W.J.; Daigle, D.J.; McGuire, M.R.; Shasha, B.S. Evaluation of biological control formulations to reduce aflatoxin contamination in peanuts. Biol. Control 2003, 26, 318–324. [Google Scholar] [CrossRef]
  27. Horn, B.W.; Dorner, J.W. Effect of nontoxigenic Aspergillus flavus and A. parasiticus on aflatoxin contamination of wounded peanut seeds inoculated with agricultural soil containing natural fungal populations. Biocontrol Sci. Technol. 2009, 19, 249–262. [Google Scholar] [CrossRef]
  28. Weaver, M.A.; Abbas, H.K. Field displacement of aflatoxigenic Aspergillus flavus strains through repeated biological control applications. Front. Microbiol. 2019, 10, e1788. [Google Scholar] [CrossRef] [Green Version]
  29. Damann, K.E., Jr. Atoxigenic Aspergillus flavus biological control of aflatoxin contamination: What is the mechanism? World Mycotoxin J. 2015, 8, 235–244. [Google Scholar] [CrossRef]
  30. Ehrlich, K.C. Non-aflatoxigenic Aspergillus flavus to prevent aflatoxin contamination in crops: Advantages and limitations. Front. Microbiol. 2014, 5, e50. [Google Scholar] [CrossRef]
  31. Moore, G.G. Practical considerations will ensure the continued success of pre-harvest biocontrol using non-aflatoxigenic Aspergillus flavus strains. Crit. Rev. Food Sci. Nutr. 2021, 1–18. [Google Scholar] [CrossRef]
  32. Wicklow, D.T.; Bobell, J.R.; Palmquist, D.E. Effect of intraspecific competition by Aspergillus flavus on aflatoxin formation in suspended disc culture. Mycol. Resour. 2003, 107, 617–623. [Google Scholar] [CrossRef] [PubMed]
  33. Mehl, H.L.; Cotty, P.J. Variation in competitive ability among isolates of Aspergillus flavus from different vegetative compatibility groups during maize infection. Phytopathology 2010, 100, 150–159. [Google Scholar] [CrossRef] [PubMed] [Green Version]
  34. Huang, C.; Jha, A.; Sweany, R.; DeRobertis, C.; Damann, K.E., Jr. Intraspecific aflatoxin inhibition in Aspergillus flavus is thigmoregulated, independent of vegetative compatibility group and is strain dependent. PLoS ONE 2011, 6, e23470. [Google Scholar] [CrossRef] [PubMed]
  35. Mauro, A.; Garcia-Cela, E.; Pietri, A.; Cotty, P.J.; Battilani, P. Biological control products for aflatoxin prevention in Italy: Commercial field evaluation of atoxigenic Aspergillus flavus active ingredients. Toxins 2018, 10, 30. [Google Scholar] [CrossRef] [Green Version]
  36. Lanubile, A.; Maschietto, V.; Battilani, P.; Marocco, A. Infection with toxigenic and atoxigenic strains of Aspergillus flavus induces different transcriptional signatures in maize kernels. J. Plant Interact. 2017, 12, 21–30. [Google Scholar] [CrossRef] [Green Version]
  37. Alshannaq, A.F.; Gibbons, J.G.; Lee, M.-K.L.; Han, K.-H.; Hong, S.-B.; Yu, J.-H. Controlling aflatoxin contamination and propagation of Aspergillus flavus by a soy-fermenting Aspergillus oryzae strain. Sci. Rep. 2018, 8, e16871. [Google Scholar] [CrossRef] [PubMed]
  38. Moore, G.G.; Lebar, M.D.; Carter-Wientjes, C.H. The role of extrolites secreted by nonaflatoxigenic Aspergillus flavus in biocontrol efficacy. J. Appl. Microbiol. 2019, 126, 1257–1264. [Google Scholar] [CrossRef]
  39. Sweany, R.R. Investigations into Aspergillus flavus Infection of Corn and Regulation of Aflatoxin Production by Volatiles and Biocontrol Strains. Ph.D. Thesis, Louisiana State University, Baton Rouge, LA, USA, 2019; p. e4780. [Google Scholar]
  40. Sweany, R.R.; DeRobertis, D.D.; Damann, K.E., Jr. Intra-specific growth and aflatoxin inhibition responses to atoxigenic Aspergillus flavus: Evidence of secreted, inhibitory substance(s) in biocontrol. Phytopathology 2021. in review. [Google Scholar]
  41. Maxwell, L.A.; Callicott, K.A.; Bandyopadhyay, R.; Mehl, H.L.; Orbach, M.J.; Cotty, P.J. Degradation of aflatoxins B1 by atoxigenic Aspergillus flavus biocontrol agents. Plant Dis. First Look 2021. [Google Scholar] [CrossRef]
  42. Sweany, R.R.; Damann, K.E., Jr.; Kaller, M.D. Comparison of soil and corn kernel Aspergillus flavus populations: Evidence for niche specialization. Phytopathology 2011, 101, 952–959. [Google Scholar] [CrossRef] [Green Version]
  43. Doyle, M.P.; Marth, E.H. Bisulfite degrades aflatoxin: Effect of citric acid and methanol and possible mechanism of degradation. J. Food Prot. 1978, 41, 891–896. [Google Scholar] [CrossRef]
  44. Khalid, N.; Seifuddin, F.T.; Turner, G.; Haft, D.; Nierman, W.C.; Wolfe, K.H.; Fedorova, N.D. SMURF: Genomic mapping of fungal secondary metabolite clusters. Fungal Genet. Biol. 2010, 47, 736–741. [Google Scholar] [CrossRef] [Green Version]
  45. Georgianna, D.R.; Fedorova, N.D.; Burroughs, J.L.; Dolezal, A.L.; Bok, J.W.; Horowitz-Brown, S.; Woloshuk, C.P.; Yu, J.; Keller, N.P.; Payne, G.A. Beyond aflatoxin: Four distinct expression patterns and functional roles associated with Aspergillus flavus secondary metabolism gene clusters. Mol. Plant Pathol. 2010, 11, 213–226. [Google Scholar] [CrossRef] [PubMed]
  46. Chiang, Y.-M.; Szewczyk, E.; Davidson, A.D.; Keller, N.; Oakley, B.R.; Wang, C.C.C. A gene cluster containing two fungal polyketide synthases encodes the biosynthetic pathway for a polyketide, asperfuranone, in Aspergillus nidulans. J. Am. Chem. Soc. 2009, 131, 2965–2970. [Google Scholar] [CrossRef] [Green Version]
  47. Love, M.I.; Wolfgang, H.; Anders, S. Moderated estimation of fold change and dispersion for RNA-seq data with DESeq2. Genome Biol. 2014, 15, 550. [Google Scholar] [CrossRef] [Green Version]
  48. Medema, M.H.; Blin, K.; Cimermancic, P.; De Jager, V.; Zakrzewski, P.; Fischbach, M.A.; Weber, T.; Takano, E.; Breitling, R. antiSMASH: Rapid identification, annotation, and analysis of secondary metabolite biosynthesis gene clusters in bacterial and fungal genome sequences. Nucleic Acids Resour. 2011, 39, W339–W346. [Google Scholar] [CrossRef] [PubMed]
  49. Nielsen, M.L.; Nielsen, J.B.; Rank, C.; Klejnstrup, M.L.; Holm, D.K.; Brogaard, K.H.; Hansen, B.G.; Frisvad, J.C.; Larsen, T.O.; Mortensen, U.H. A genome-wide polyketide synthase deletion library uncovers novel genetic links to polyketides and meroterpenoids in Aspergillus nidulans. FEMS Microbiol. Lett. 2011, 321, 157–166. [Google Scholar] [CrossRef] [PubMed]
  50. Li, C.; Matsuda, Y.; Gao, H.; Hu, D.; Yao, X.S.; Abe, I. Biosynthesis of LL-Z1272β: Discovery of a new member of NRPS-like enzymes for aryl-aldehyde formation. ChemBioChem 2016, 10, 904–907. [Google Scholar] [CrossRef] [PubMed]
  51. Ammar, H.A.M.; Srour, A.Y.; Ezzat, S.M.; Hoseny, A.M. Identification and characterization of genes involved in kojic acid biosynthesis in Aspergillus flavus. Ann. Microbiol. 2017, 67, 691–702. [Google Scholar] [CrossRef]
  52. Khalid, S.; Baccile, J.A.; Spraker, J.E.; Tannous, J.; Imran, M.; Schroeder, F.C.; Keller, N.P. NRPS-derived isoquinolines and lipopetides mediate antagonism between plant pathogenic fungi and bacteria. ACS Chem. Biol. 2018, 13, 171–179. [Google Scholar] [CrossRef] [Green Version]
  53. Chankhamjon, P.; Boettger-Schmidt, D.; Scherlach, K.; Urbansky, B.; Lackner, G.; Kalb, D.; Dahse, H.-M.; Hoffmeister, D.; Hertweck, C. Biosynthesis of the halogenated mycotoxin aspirochlorine in koji mold involves a cryptic amino acid conversion. Angew. Chem. Int. Ed. 2014, 53, 13409–13413. [Google Scholar] [CrossRef] [PubMed]
  54. Baidya, S.; Duran, R.M.; Lohmar, J.M.; Harris-Coward, P.Y.; Cary, J.W.; Hong, S.-Y.; Roze, L.V.; Linz, J.E.; Calvo, A.M. VeA is associated with the response to oxidative stress in the aflatoxin producer Aspergillus flavus. Eukaryot. Cell 2014, 13, 1095–1103. [Google Scholar] [CrossRef] [Green Version]
  55. Fountain, J.C.; Scully, B.T.; Chen, Z.-Y.; Gold, S.E.; Glenn, A.E.; Abbas, H.K.; Lee, R.D.; Kemerait, R.C.; Guo, B. Effects of hydrogen peroxide on different toxigenic and atoxigenic isolates of Aspergillus flavus. Toxins 2015, 7, 2985–2999. [Google Scholar] [CrossRef] [PubMed] [Green Version]
  56. Fountain, J.C.; Bajaj, P.; Pandey, M.; Nayak, S.N.; Yang, L.; Kumar, V.; Jayale, A.S.; Chitikineni, A.; Zhuang, W.; Scully, B.T.; et al. Oxidative stress and carbon metabolism influence Aspergillus flavus transcriptome composition and secondary metabolite production. Sci. Rep. 2016, 6, e38747. [Google Scholar] [CrossRef] [PubMed] [Green Version]
  57. Saxena, M.; Mukerji, K.G.; Raj, H.G. Positive correlation exists between glutathione S-transferase activity and aflatoxin formation in Aspergillus flavus. Biochem. J. 1988, 254, 567–570. [Google Scholar] [CrossRef] [PubMed] [Green Version]
  58. Ziglari, T.; Allameh, A.; Razzaghi-Abyaneh, M.; Khosravi, A.R.; Yadegari, M.H. Comparison of glutathione S-transferase activity and concentration in aflatoxin-producing and their non-toxigenic counterpart isolates. Mycopathologia 2008, 166, 219–226. [Google Scholar] [CrossRef] [PubMed]
  59. Hua, S.S.T.; Parfitt, D.E.; Sarreal, S.B.L.; Sidhu, G. Dual culture of atoxigenic and toxigenic strains of Aspergillus flavus to gain insight into repression of aflatoxin biosynthesis and fungal interaction. Mycotoxin Res. 2019, 35, 381–389. [Google Scholar] [CrossRef] [PubMed]
  60. Yang, K.; Geng, Q.; Song, F.; He, X.; Hu, T.; Wang, S.; Tian, J. Transcriptome sequencing revealed an inhibitory mechanism of Aspergillus flavus asexual development and aflatoxin metabolism by soy-fermenting non-aflatoxigenic Aspergillus. Int. J. Mol. Sci. 2020, 21, 6994. [Google Scholar] [CrossRef]
  61. Burdock, G.A.; Soni, M.G.; Carabin, I.G. Evaluation of health aspects of Kojic acid in food. Regul. Toxicol. Pharm. 2001, 33, 80–101. [Google Scholar] [CrossRef]
  62. Schroeckh, V.; Scherlach, K.; Nützmann, H.-W.; Shelest, E.; Schmidt-Heck, W.; Schuemann, J.; Martin, K.; Hertweck, C.; Brakhage, A.A. Intimate bacterial-fungal interaction triggers biosynthesis of archetypal polyketides in Aspergillus nidulans. Proc. Natl. Acad. Sci. USA 2009, 106, 14558–14563. [Google Scholar] [CrossRef] [Green Version]
  63. Wang, C.C.; Chiang, Y.M.; Praseuth, M.B.; Kuo, P.L.; Liang, H.L.; Hsu, Y.L. Asperfuranone from Aspergillus nidulans inhibits proliferation of human non-small cell lung cancer A549 cells via blocking cell cycle progression and inducing apoptosis. Basic Clin. Pharmacol. Toxicol. 2010, 107, 583–589. [Google Scholar] [CrossRef] [PubMed]
  64. Spraker, J.E.; Jewell, K.; Roze, L.V.; Scherf, J.; Ndagano, D.; Beaudry, R.; Linz, J.E.; Allen, C.; Keller, N.P. A volatile relationship: Profiling an inter-kingdom dialogue between two plant pathogens, Ralstonia Solanacearum and Aspergillus Flavus. J. Chem. Ecol. 2014, 40, 502–513. [Google Scholar] [CrossRef] [PubMed]
  65. Reyes Pineda, J.A. Characterization of Aspergillus flavus Soil and Corn Kernel Populations from Eight Mississippi River States. Master’s Thesis, Louisiana State University, Baton Rouge, LA, USA, 2017; p. e4350. [Google Scholar]
  66. Sweany, R.R.; Damann, K.E., Jr. Influence of neighboring clonal-colonies on aflatoxin production by Aspergillus flavus. Front. Microbiol. 2020, 10, e3038. [Google Scholar] [CrossRef] [Green Version]
  67. Moore, G.G.; Lebar, M.D.; Carter-Wientjes, C.H.; Gilbert, M.K. The potential role of fungal volatile organic compounds in Aspergillus flavus biocontrol efficacy. Biol. Control 2021, 160, e104686. [Google Scholar] [CrossRef]
  68. Sobolev, V.S.; Dorner, J.W. Cleanup procedure for determination of aflatoxins in major agricultural commodities by liquid chromatography. J. AOAC Int. 2002, 85, 642–645. [Google Scholar] [CrossRef] [PubMed] [Green Version]
  69. Joshua, H. Determination of aflatoxins by reversed-phase high performance liquid chromatography with post-column in-line photochemical derivatization and fluorescence detection. J. Chromatogr. 1993, 654, 247–254. [Google Scholar] [CrossRef]
  70. Raruang, Y.; Omolehin, O.; Hu, D.; Wei, Q.; Han, Z.Q.; Rajasekaran, K.; Cary, J.W.; Wang, K.; Chen, Z.Y. Host induced gene silencing targeting Aspergillus flavus aflM reduced aflatoxin contamination in transgenic maize under field conditions. Front. Microbiol. 2020, 11, e754. [Google Scholar] [CrossRef] [PubMed]
  71. Bushnell, B. BBTools Software Package. 2014. Available online: http://sourceforge.net/projects/bbmap578 (accessed on 8 April 2019).
  72. Dobin, A.; Davis, C.A.; Schlesinger, F.; Drenkow, J.; Zaleski, C.; Jha, S.; Batut, P.; Chaisson, M.; Gingeras, T.R. STAR: Ultrafast universal RNA-seq aligner. Bioinformatics 2013, 29, 15–21. [Google Scholar] [CrossRef]
  73. Liao, Y.; Smyth, G.K.; Shi, W. featureCounts: An efficient general purpose program for assigning sequence reads to genomic features. Bioinformatics 2014, 30, 923–930. [Google Scholar] [CrossRef] [Green Version]
  74. Garrison, E.; Marth, G. Haplotype-based variant detection from short-read sequencing. arXiv 2012, arXiv:1207.3907. [Google Scholar]
  75. Li, H.; Handsaker, B.; Wysoker, A.; Fennell, T.; Ruan, J.; Homer, N.; Marth, G.; Abecasis, G.; Durbin, R. 1000 Genome project data processing subgroup. The sequence alignment/map format and SAMtools. Bioinformatics 2009, 25, 2078–2079. [Google Scholar] [CrossRef] [PubMed] [Green Version]
  76. De Matos Simoes, R.; Emmert-Streib, F. Bagging statistical network inference from large-scale gene expression data. PLoS ONE 2012, 7, e33624. [Google Scholar] [CrossRef] [Green Version]
  77. Benjamini, Y.; Hochberg, Y. Controlling the false discovery rate: A practical and powerful approach to multiple testing. J. R. Stat. Soc. Ser. B 1995, 57, 289–300. [Google Scholar] [CrossRef]
  78. Evans, C.; Hardin, J.; Stoebel, D.M. Selecting between-sample RNA-Seq normalization methods from the perspective of their assumptions. Brief. Bioinform. 2018, 19, 776–792. [Google Scholar] [CrossRef] [PubMed]
Figure 1. Mycelial biomass and RNA production by Tox 53 and Non-tox 17 alone, as well as during their biocontrol interaction in co-culture. Isolates were grown alone or in co-culture (i.e., biocontrol interaction) in 15 mL of liquid medium for 30 and 72 h. Mycelial tissue was harvested, (a) weighed and (b) then RNA was extracted. Mean ± SD from 5 reps at 30 h and 4 reps at 72 h. Different letters denote significance as per least squares means comparisons (α ≤ 0.05).
Toxins 13 00794 g001
Figure 2. Proportion of RNA sequence reads uniquely aligned to A. flavus Tox 53 and Non-tox 17 in co-culture vs. the expected proportions based on biomass and RNA production of isolates grown apart. Proportions were compared using a generalized linear mixed model with the logit link and binomial distribution. Different letters denote significance as per least squares means (odds) comparisons (α < 0.05).
Toxins 13 00794 g002
Figure 3. Differential gene expression of Tox 53, Non-tox 17 and their co-cultures. (a) Principal component analysis (PCA) of gene expression and (b) number of differentially expressed genes between Tox 53, Non-tox 17 and co-cultures. (a) PCA was generated for 500 genes with highest log regularized read count variance. Dots represent score for each biological replicate. (b) The number of upregulated genes are shown above the origin and the number of downregulated genes are shown below the origin.
Toxins 13 00794 g003
Table 1. Aflatoxin B1 production by Tox 53 and Non-tox 17 isolates alone and during biocontrol interaction in co-cultures.
30 h72 h96 h
CulturesAflatoxin B1 ppb ± S. D.
Tox 53<0.05 c 1680 ± 35 b1902 ± 163 a
Non-tox 17<0.05 c<0.05 c<0.05 c
Co-culture0.2 ± 0.1 c1.8 ± 0.2 c<0.05 c
1 Mean ± SD from 5 reps at 30 h and 4 reps at 72 and 96 h. Aflatoxin B1 minimum level of detection by HPLC was <0.05 ppb and minimum quantification from standard curve was 1 ppb. Aflatoxin values with different letters denote significance as per least squares means comparisons (α ≤ 0.05).
Table 2. Total sequence reads (M) and reads (M) uniquely aligned to Tox 53 or Non-tox 17.
30 h72 h
Rep 1Total 2 Non-Tox 3Tox 4P Tox 5Rep 1Total 2Non-Tox 3Tox 4P Tox 5
Tox 53a14.20.0924.3360.979d8.60.0502.9850.984
b17.40.1055.1430.980e15.90.0875.4840.984
c14.30.0854.2060.980f14.10.1054.8170.979
Non-tox 17a16.75.1070.0820.016d16.95.8190.0850.014
b16.65.0470.0840.016e14.75.0750.0750.015
c185.3580.0900.017f14.25.0400.0740.014
Co-culturea29.68.2670.2990.035d14.04.8910.1400.028
b12.53.9020.1270.032e15.15.2200.1810.033
c11.33.5100.1200.033f29.19.4970.2610.027
1 RNA was sequenced from three independent replicates of Tox 53, Non-tox 17 mono and co-cultures. RNA was sequenced from different cultures at 30 and 72 h. 2 Total millions (M)-of 150 bp paired-end reads from Illumina RNA sequencing. 3 Millions (M) of reads uniquely aligned to Non-tox 17 based on single-nucleotide polymorphisms (SNPs) between Tox 53 and Non-tox 17. 4 Millions (M) of reads uniquely aligned to Tox 53 based on single-nucleotide polymorphisms SNPs between Tox 53 and Non-tox 17. 5 Proportion of reads that uniquely align to Tox 53 vs. Non-tox 17.
Table 3. Number of differentially expressed genes within significantly enriched functional annotation terms in Tox 53, Non-tox 17 and their co-cultures.
30 h72 h
Functional Annotation Terms 1Genes 2Non vs. Tox 3Co vs. ToxCo vs. NonNon vs. ToxCo vs. ToxCo vs. Non
Oxidation/reduction1477274-229 −235 −43277 284
Signal peptide1188236−182221−17628 220 212
Extracellular876 −146 −14021 180 175
Apoplastic537114−93 −9119 121 119
NAD(P)-binding 596 −104 −118 114 124
Oxidoreductase activity542 −9476−95 102 113
Major facilitator family38987 89
Alpha/Beta hydrolase 313 85 81
Zn(2)-C6 transcr. factor28967 69 57 57
Iron ion binding26664 58
FAD/NAD(P)-binding289 −1355 56
Heme binding246 48 50
Monooxygenase activity214 −1246 49
FAD binding179 42 37
Cytochrome P450166 40 41
GroES-like117 −30 −33
Fatty acid biosynthesis99 −26 −24
Alcohol dehydrogenase93 −26 −29
Peroxisome71 −25 −23
Polyketide synthase 94 −24 −28
Tyrosine metabolism71 23 20
ATPase movement66 18 19
Isomerase activity56 −19 −20
AMP-binding site57 −18
Phenylalanine metab.42 15 14
Aflatoxin synth. cluster 29 −14 −1116 −28 −289
Obsolete peroxidase rxn34 −14 −14
Sterigmatocystin synth.25 7 −14 −135
Imizoquin synth. 117 −611 11
Crotonase superfamily19 −9 −11
L-phenylalanine metab.23 10
Styrene catabolism20 10 9
Aromatic amino acid20 10 10
Phosphorelay sensor20 −10 −8
Protein histidine kinase20 −10 −8
Disulphide reductase10 8 9
Enoyl-CoA hydratase9 −7 −7
Sulfatase, conserved site86 6 5
Asperfuranone synth.5 5 5
Mycotoxin biosynthesis4 4 4
Cyclopiazonic acid4 −4 −43 −4 −42
Haem peroxidase4 −4 −4
1 Within each functional annotation term are. 2 Total number of genes assigned to the category. 3 Number of genes that were up and down (-) regulated in pair-wise comparisons between Non-tox 17 versus (v) Tox 53, co-culture (i.e., biocontrol interaction) vs. Tox 53, and co-culture vs. Non-tox 17 at 30 h and 72 h if the Benjamini and Hochberg adjusted p-value for the enrichment test was ≤ 0.05. Cells without numbers were not significantly enriched at α < 0.05. Values are color-scaled, blue is less than zero and red is greater than zero. A darker shade indicates a more negative or positive value and scaled to the maximum and minimum values in table.
Table 4. Differential expression of aflatoxin cluster genes between Non-tox 17, Tox 53 and their co-cultures.
30 h 172 h
Gene ID 2Chr 3Non vs. ToxCo vs. ToxCo vs. NonNon vs. ToxCo vs. ToxCo vs. NonGene Synonyms or Putative Function
AFLA_1391503---−15.1−11.3-aflY/hypA/hypP
AFLA_1391603---−14.8−10.8-aflX/ordB
AFLA_1391703-5.15.1−16.1−11.3-aflW/moxY
AFLA_1391803--5.3−15.2−10.7-aflV/cypX
AFLA_1391903-4.46.8−15.3−10.9-aflK/vbs/verB
AFLA_1392003---−14.3−10.9-aflQ/ordA/ord-1
AFLA_1392103---−15.5−10.7-aflP/omtA/omt-1
AFLA_1392203---−15.2−9.9-aflO/omtB/dmtA
AFLA_1392303---−9.8−9.1-aflI/avfA
AFLA_1392403------
AFLA_1392503---−15.3−11.0-aflL/verB
AFLA_1392603---−15.1−10.2-aflG/avnA/ord-1
AFLA_1392703−11.3−5.36.0−16.1−9.17.0
AFLA_1392803--4.4−14.2−9.8-aflN/verA
AFLA_1392903---−11.9−12.1-aflMa/hypE
AFLA_1393003-3.03.5−17.0−10.56.5aflM/ver-1
AFLA_1393103−5.9-5.9−16.0−11.9-aflE/norA/aad/adh-2
AFLA_1393203−9.6−4.74.9−15.7−10.55.2aflJ/estA
AFLA_1393303−9.9−4.05.9−16.0−10.7-aflH/adhA
AFLA_1393403−11.6−4.96.7−15.0−9.85.3aflS
AFLA_1393603−11.6−5.16.6−11.8−7.9-aflR/apa-2/afl-2
AFLA_1393703−10.2−4.16.1−15.1−10.34.7aflB/fas-1
AFLA_1393803−9.2−3.65.6−14.7−10.44.2aflA/fas-2/hexA
AFLA_1393903−8.1−2.55.5−15.8−11.24.5aflD/nor-1
AFLA_1394003−5.6−3.2-−15.0−10.9-aflCa/hypC
AFLA_1394103−8.2−4.14.1−16.0−10.55.5aflC/pksA/pksL1
AFLA_1394203−8.2−3.15.0−14.4−8.75.7aflT/aflT
AFLA_1394303−4.0--−11.2−9.1-aflU/cypA
AFLA_1394403−3.5--−10.2−8.6-aflF/norB
AFLA_1394503------
AFLA_1394603−9.3−5.7-−14.2−9.7-MFS multidrug transporter
AFLA_1394703−14.3−7.27.1−13.1−6.36.8FAD-dependent oxidoreductase
AFLA_1394803−12.4−6.46.0−12.7−5.57.2Tryptophan synthase
AFLA_1394903−11.9−6.75.2−9.9−7.0-hybrid PKS/NRPS enzyme
1 Log2-fold changes for gene expression pair-wise comparisons in Non-tox 17 versus (v) Tox 53, Co-culture vs. Tox 53, and Co-culture vs. Non-tox 17 at 30 and 72 h if the fold change was ≥2 and p-values were ≤0.05. A dash is reported for comparisons not meeting this criteria. Values are color-scaled, blue is less than zero and red is greater than zero. A darker shade indicates a more negative or positive value and scaled to the maximum and minimum values in table. 2 Gene ID is the AFLA_# gene number designated in the A. flavus NRRL 3357 reference genome. 3 Chr is the chromosome where aflatoxin cluster genes are located.
Table 5. Genes highly upregulated in Non-tox 17 mono-cultures and co-cultures compared to Tox 53 mono-cultures and differential gene expression in SMURF secondary metabolite cluster 20 (asperfuranone).
30 h 172 h
Gene ID 2Chr 3Non vs. ToxCo vs. ToxCo vs. NonNon vs. ToxCo vs. ToxCo vs. NonSM 4Putative Function
(a) Genes with at least 8 log2-fold differential expression
AFLA_08564018.48.0-4.74.8--, -Peroxisome biogenesis
AFLA_025220211.911.4-7.87.8--, -UPF0047 protein family
AFLA_12642027.98.5-9.69.4--, -Protein glycosylation
AFLA_060320 58.68.4-7.37.1--, -Perforin domain
AFLA_06035059.08.5-6.16.5--, -Unknown
AFLA_062960510.110.2-10.310.2--, 20Zn(2)-C6 transcript. factor
AFLA_06298059.810.0-9.89.7--, 20Crotonase activity
AFLA_06299058.78.7-8.48.3--, 20Oxidase
AFLA_09529059.59.6-2.32.9--, -Unknown
AFLA_09530058.48.3-2.63.0--, -Protein-protein interactions
AFLA_09580057.98.0-6.15.7--, -Short-chain reductase
AFLA_06637068.98.7-8.78.8--, -Phosphorylation
AFLA_008080810.49.6-----, -Unknown
AFLA_11734086.48.0-7.9---, -2-methylcitrate catabolism
(b) Differential gene expression in SMURF-predicted secondary metabolite cluster 20 (asperfuranone)
AFLA_06280052.42.4-1.91.9--, 20Aldo-keto reductase
AFLA_06281053.63.6-5.14.9--, 20Hypothetical protein
AFLA_06282053.34.51.25.35.0--, 20Polyketide synthase
AFLA_06283053.84.2-5.04.8--, 20Monoxy./oxidoreductase
AFLA_06284052.22.3-2.92.7--, 20Serine hydrolase
AFLA_06285053.22.9-----, 20Fatty acid oxidoreductase
AFLA_06286053.54.4-5.45.1--, 20Polyketide synthase
AFLA_06289051.2--1.61.2--, 20Hypothetical protein
AFLA_06294057.47.5-6.66.6--, 20Choline transport protein
AFLA_06295054.84.8-5.14.8--, 20Hypothetical protein
AFLA_062960510.110.2-10.310.2--, 20Zn(2)-C6 transcript. factor
AFLA_06297053.84.9-4.95.0--, 20Copper oxidase
AFLA_06298059.810.0-9.89.7--, 20Crotonase activity
AFLA_06299058.78.7-8.48.3--, 20Iron-binding oxidase
AFLA_06300055.45.3-6.25.7--, 20Metal-binding hydrolase
ALFA_06302054.35.1-5.46.0--, 20Multidrug resistance pump
1 Log2-fold changes for gene expression pair-wise comparisons of Non-tox 17 versus (v) Tox 53, Co-culture vs. Tox 53, and Co-culture vs. Non-tox 17 at 30 and 72 h if the fold change was ≥2 and p-values were ≤0.05. A dash is reported for comparisons not meeting these criteria. Values are color-scaled with a darker red tint indicating a more positive value and scaled to the maximum value in table. 2 Gene ID is the AFLA_# gene number designated in the A. flavus NRRL 3357 reference genome. Gene ID fonts color-coded in blue, red or gray are in close proximity on chromosomes. 3 Chr is the chromosome where each gene is located. 4 SM is the secondary metabolite cluster where a gene is located. The 1st number is predicted by antiSMASH, and the 2nd number is predicted by SMURF. Dashes indicate gene is not located in a predicted secondary metabolite cluster.
Table 6. RPKM expression values for genes upregulated in co-cultures compared to Tox 53 and Non-tox 17, and for genes highly upregulated in Non-tox 17 compared to Tox 53.
30 h 172 h
Gene ID 2Chr 3Tox 53Non-Tox 17Co-CultureTox 53Non-Tox 17Co-CultureSM 4Putative Function
(a) Genes which were upregulated in Co-cultures compared to Tox 53 and Non-tox 17
02970023±0.4*10±2**8±0.7**20±2.2*27±4*140±6.8**0, 0Peptidase
037820275±22*105±37**78±27*17±2.2*51±9.7**167±3.6***0, 0Hsp20 heat shock protein
12498022±0.1*3±1.2*2±0.3*6±0.9*31±12**88±16***0, 0Oxidoreduction decarboxylase
12500020±0*0±0.1*0±0.1*0±0*6±2.2**22±4.6***0, 0Membrane transport facilitator
12626025±0.5**1±0.3*1±0.5*1±0.2*2±0.3**9±0.7***0, 0FAD-dependent oxidoreductase
126390210±1*30±3.2***18±2.4**35±0.5*74±17**281±24***0, 0Metal-binding monoxygenase
135320310±1.3*50±2.1**70±3.3***55±2.6***15±0.8*33±2.1**0, 0Membrane transport facilitator
00084041±0.1*4±0.4**7±1.7***2±0*27±1.8**88±35***0, 0Membrane transport facilitator
000870419±3.2*57±13**27±3.1*2±0.2*11±1.1**26±3.8***0, 0Hypothetical protein
00101040±0*58±2.5***56±4.1**41±2.5**28±3.6*83±2.5***0, 0Cyt P450 oxygenase
01327040±0.1*1±0.2*0±0.1*1±0.1*18±8.9**80±13***0, 04-oxalocrotonate tautomerase
01368040±0.1*1±0.3**1±0.1**1±0.1*6±0.4**12±1.2***0, 0Phospholipase C
01635040±0.1*0±0.1*2±1.6**0±0.1*13±1.6**23±5.7**0, 0NAD(P)H-dependent reductase
05912050±0*0±0*0±0*1±0.1*1±0.1*3±0.5**0, 0Metal binding fumarylacetoacetase
06077050±0.1*1±0.1**1±0.4**2±0.1*26±1.8**47±3.1***0, 0Acetate transport/EtOH synthesis
06109050±0.1*6±0.4***4±0.1**3±0*2±0.2*5±0.5**0, 0Serine/threonine MAP-kinase
091690516±0.9*24±0.8***20±0.5**23±0.2*42±3.7**94±8.4***0, 0Isocitrate lyase
09604053±0.2*73±3.7**68±8.6**11±1.6*632±110**1589±530***0, 0 *FAD-dependent oxidoreductase
09606050±0*1±0.1**1±0.1**2±0.2*21±5**95±31***0, 0 *Membrane transport facilitator
097430617±4.1*14±0.4*11±1.4*4±0.6*11±1.2**70±32***0, 0NAD-dependent dehydratase
09744069±0.8*10±0.3*7±0.9*3±0.2*6±1.3**32±13***0, 0Unknown-NAD(P) binding
0401207100±13*302±10***314±23**352±11*313±22*665±21**0, 0FAD-binding oxidoreductase
11733085±0.3*94±15**103±5.6***24±3.9*23±3.4*71±9.5**0, 0Membrane transport facilitator
11894080±0*0±0*0±0*0±0*3±0.9**5±2.7***8.5, 46Polyketide synthase
11896080±0*0±0*0±0*0±0*2±0.6**5±3.2***8.5, 46Polyketide synthase
11897080±0.1*0±0*0±0*0±0.1*4±1.3**11±5.6***8.5, 46FAD-dependent oxygenase
11899080±0*0±0*0±0*0±0*14±4.3**46±25***8.5, 0Efflux pump, major facilitator
11900080±0*0±0*0±0*0±0*65±19**198±120***8.5, 0O-methyl transferase
12211085±0.2*2±0.3*3±0.6*3±0.7*30±5.1**136±54***0, 0Haem bifunctional peroxidase
(b) Genes which were highly overexpressed in Non-tox 17 compared to Tox 53
08564010±0*6±0.3**5±0.7**0±0*5±0.8**5±1.2**0, 0Peroxisome biogenesis
02522020±0*109±7.5**81±5.3**0±0.4*103±3.9**104±7**0, 0UPF0047 protein family
12642021±0.3*3±0.2**5±0.2**0±0*5±0.2**4±0.2**0, 0Protein glycosylation
06032050±0*5±0.9**5±0.9**0±0*7±0.6**6±0.4**0, 0Perforin domain
06035050±0*12±1.6**8±2**0±0*2±0.4**3±0.5**0, 0Unknown
06296050±0*7±0.1**8±0.1**0±0*14±0.8**13±0.5**0, 20Zn(2)-C6 transcription factor
06298050±0*12±1.3**15±0.5**0±0*40±2.2**36±0.7**0, 20Crotonase activity
06299050±0*5±0.2**5±0.1**0±0*12±0.3**10±0.2**0, 20Oxidase
09529050±0.3*90±3.6**103±4.3**1±0.3*8±0.5**13±1.2**0, 0Unknown
09530055±0.3*102±9.4**97±6.6**1±0.2*6±0.1**8±1.1**0, 0Protein-protein interactions
09580054±1.5*71±3.1**80±3.6**1±0.2*62±2.8**48±0.4**0, 0Short-chain reductase
06637060±0*12±0.3**11±0.8**0±0*33±1.9**34±1.2**0, 0Phosphorylation
00808081±0.3*216±23**128±14**65±2.7*112±4.6**128±1.1**0, 0Unknown
11734080±0*1±0.2**3±2.1**0±0*4±3.6**0±0**0, 02-methylcitrate catabolism
1 Reads per kilobase per millions reads mapped (RPKM) were calculated for each 30 and 72 h Non-tox 17, Tox 53 and co-cultures reported as means and standard error. RPKM are measures of read abundance, which account for the total reads in a single replicate and individual gene length. This allows for better comparisons between treatments and genes rather than directly reporting reads. RPKM values for a single gene within 30 or 72 h with different numbers of asterisks *, ** or *** are statistically different based on α = 0.05. Values are color-scaled red for each gene and darker shades indicate more positive values scaled to the maximum within an individual gene; 2 Gene ID is the AFLA_# gene number (i.e., 029700 = AFLA_029700) designated in the A. flavus NRRL 3357 reference genome. Gene ID fonts colorcoded in orange, purple, blue, red or gray are in close proximity on chromosomes. The red gene numbers are in secondary metabolite clusters. Orange genes were not predicted by a secondary metabolite program but are involved in kojic acid synthesis; 3 Chr is the chromosome where each gene is located; 4 SM is the secondary metabolite cluster where a gene is located. The 1st number is the SM cluster predicted by antiSMASH, the 2nd number is the SM cluster predicted by SMURF.
Table 7. RPKM gene expression values for genes in imizoquin and aspirochlorine clusters.
30 h 172 h
Gene ID 2Chr 3Tox 53Non-Tox 17Co-CultureTox 53Non-Tox 17Co-CultureSM 4
064230630±3*33±0.9*21±1.2*10±1.6*209±12.3**134±4.7**0, 21
06424066±0.8*9±0.7*7±0.3*4±0.3*68±2**41±1.4**0, 21
064250631±8.6*168±3.9*79±12.2*13±0.9*613±29.2*333±6.2*0, 21
06426064±0.9*15±1.3*9±1.4*10±0.5*153±4.2*140±1*0, 21
064270637±9.7*278±9.2*141±23.4*15±1.1*1132±36.9*711±17.5*0, 21
064280624±7.3*150±10.9*66±10.2*6±0.2*610±24.1*290±12.3*0, 21
0642906355±90.6**615±23.8**291±42.5*43±1.7*1393±57.3**762±31.9**0, 21
064300615±2.1*42±0.8*20±2.8*6±0.4*146±5.5*93±1.2*0, 21
06431065±0.5*14±0.1*8±0.9*5±0.3*59±3.5*44±1.2*0, 21
064320618±3.8*134±7.8*60±9.4*8±0.6*443±20.8*250±4.7*0, 21
06433067±0.3*12±1*7±1.2*4±0.3*23±2.1**17±1.5**0, 21
06434066±0.9*19±0.3*9±1.4*2±0.3*22±0.1*16±1.5*0, 21
06435060±0.1*0±0*0±0*1±0*1±0.1*1±0*0, 21
06436060±0.1*0±0*0±0.1*1±0.1*1±0*1±0*0, 21
06437061±0.2*2±0.1*1±0.2*2±0.1*4±0.2*3±0.2*0, 21
0643806185±15.9*36±2.3*63±9.3*5±0.3*85±3.2*47±1.8*0, 21
064390611±0.7*3±0.4*5±0.5*0±0.1*7±0.1*4±0.2*0, 21
064400632±4.2*11±0.5*18±3.3*1±0.2*21±1.3*11±0.4*0, 21
06441069±1.1*4±0.7*5±0.8*1±0.1*8±0.9**6±0.4**0, 21
0644206112±7.7*18±0.4*22±4.3*4±0.6*46±3.6*25±1.5*0, 21
064430689±5.1*17±1*22±0.1*9±0.8*38±1.7*26±1*0, 21
064440635±3*10±0.7*16±2.1*1±0.1*22±1.8*10±0.8*0, 21
064450644±2.2*13±1.3*21±3.2*1±0.2*33±1.6*17±0.8*0, 21
064460616±2*4±0.6*8±0.9*0±0.1*9±0.8*4±0.4*1.1, 21
064470632±3.2*14±0.9*20±3*1±0.2*20±1.7*10±0.1*1.1, 21
0644806137±14.1*68±7.1*81±15.4*5±0.2*79±3.9**40±2.9**1.1, 21
064490690±7.8*32±1.2*46±8.9*7±0.4*60±0.7**30±1.4**1.1, 21
0645006727±33.2**340±28.1*309±31.9*179±5.1*996±19.5**717±16.8**1.1, 21
064510640±3.1*23±0.8*34±5.4*8±0.5*32±1.2**20±0.1**1.1, 21
064520640±2.4*19±1.6*29±4.5*9±0.4*33±0.8**23±0.5**1.1, 21
064530664±9.2*22±2.7*29±5.5*1±0.1*34±1.7*18±0.8*1.1, 21
064540624±2.2*8±0.9*11±1.8*1±0.1*17±1.1*8±0.4*1.1, 21
064550622±2.6*8±0.9*14±2.3*1±0.1*20±1.3*11±0.3*1.1, 21
06456066±0.4*2±0.1*5±0.6*0±0*10±0.2*5±0.1*1.1, 21
064570656±10.4*8±0.5*12±0.4*1±0.2*16±0.4*8±0.2*1.1, 21
0645806122±13.4*42±4.6*53±9.3*2±0.4*67±3.1*33±2.1*1.1, 21
0645906122±13.3*22±1.5*32±3*1±0.1*42±2.3*23±0.6*1.1, 21
06460067±0.7*1±0.3*2±0.2*0±0.1*4±0.1*2±0*1.1, 21
06461062±0.4*1±0.2*1±0.1*2±0.1*7±0.2**9±2.8**1.1, 21
1 Reads per kilobase per millions reads mapped (RPKM) were calculated for each 30 and 72 h Non-tox 17, Tox 53 and co-culture, reported as means and standard error. RPKM are measures of read abundance, which account for the total reads in a single replicate and individual gene length. This allows for better comparisons between treatments and genes rather than directly reporting reads. RPKM values for a single gene within 30 or 72 h with different numbers of asterisks * or ** are statistically different based on α ≤ 0.05. Values are color-scaled red for each gene and a darker shade indicates more positive values that are scaled to the maximum within an individual gene. 2 Gene ID is the AFLA_# gene number (i.e., 029700 = AFLA_029700) designated in the A. flavus NRRL 3357 reference genome. Gene ID font color red and blue correspond to the imizoquin and aspirochlorine gene clusters, respectively. 3 Chr is the chromosome where each gene is located. 4 SM is the secondary metabolite cluster where a gene is located. The 1st number is the SM cluster predicted by antiSMASH, and the 2nd number is the SM cluster predicted by SMURF.
Table 8. Biological control mono and co-culture experimental design.
Cultured IsolatesChemicals ExtractedHoursBiological ReplicatesDishes per Rep
Non-tox 17RNA and aflatoxin3059
Tox 53RNA and aflatoxin3059
Co-culture of 17 + 53RNA and aflatoxin3059
Non-tox 17RNA and aflatoxin7241
Tox 53RNA and aflatoxin7241
Co-culture of 17 + 53RNA and aflatoxin7241
Non-tox 17Aflatoxin9641
Tox 53Aflatoxin9641
Co-culture of 17 + 53Aflatoxin9641
Total samples 39
Aspergillus flavus Non-tox 17 and Tox 53 isolates grew alone and together in co-cultures within separate Petri-dishes for 30, 72 and 96 h. Biological replicates at 30 h consisted of multiple Petri-dishes to accumulate adequate mycelial biomass for RNA extraction.
Publisher’s Note: MDPI stays neutral with regard to jurisdictional claims in published maps and institutional affiliations.

