Protein-Bound Uremic Toxins in Hemodialysis Patients Relate to Residual Kidney Function, Are Not Influenced by Convective Transport, and Do Not Relate to Outcome

 , ,
, , 
Abstract
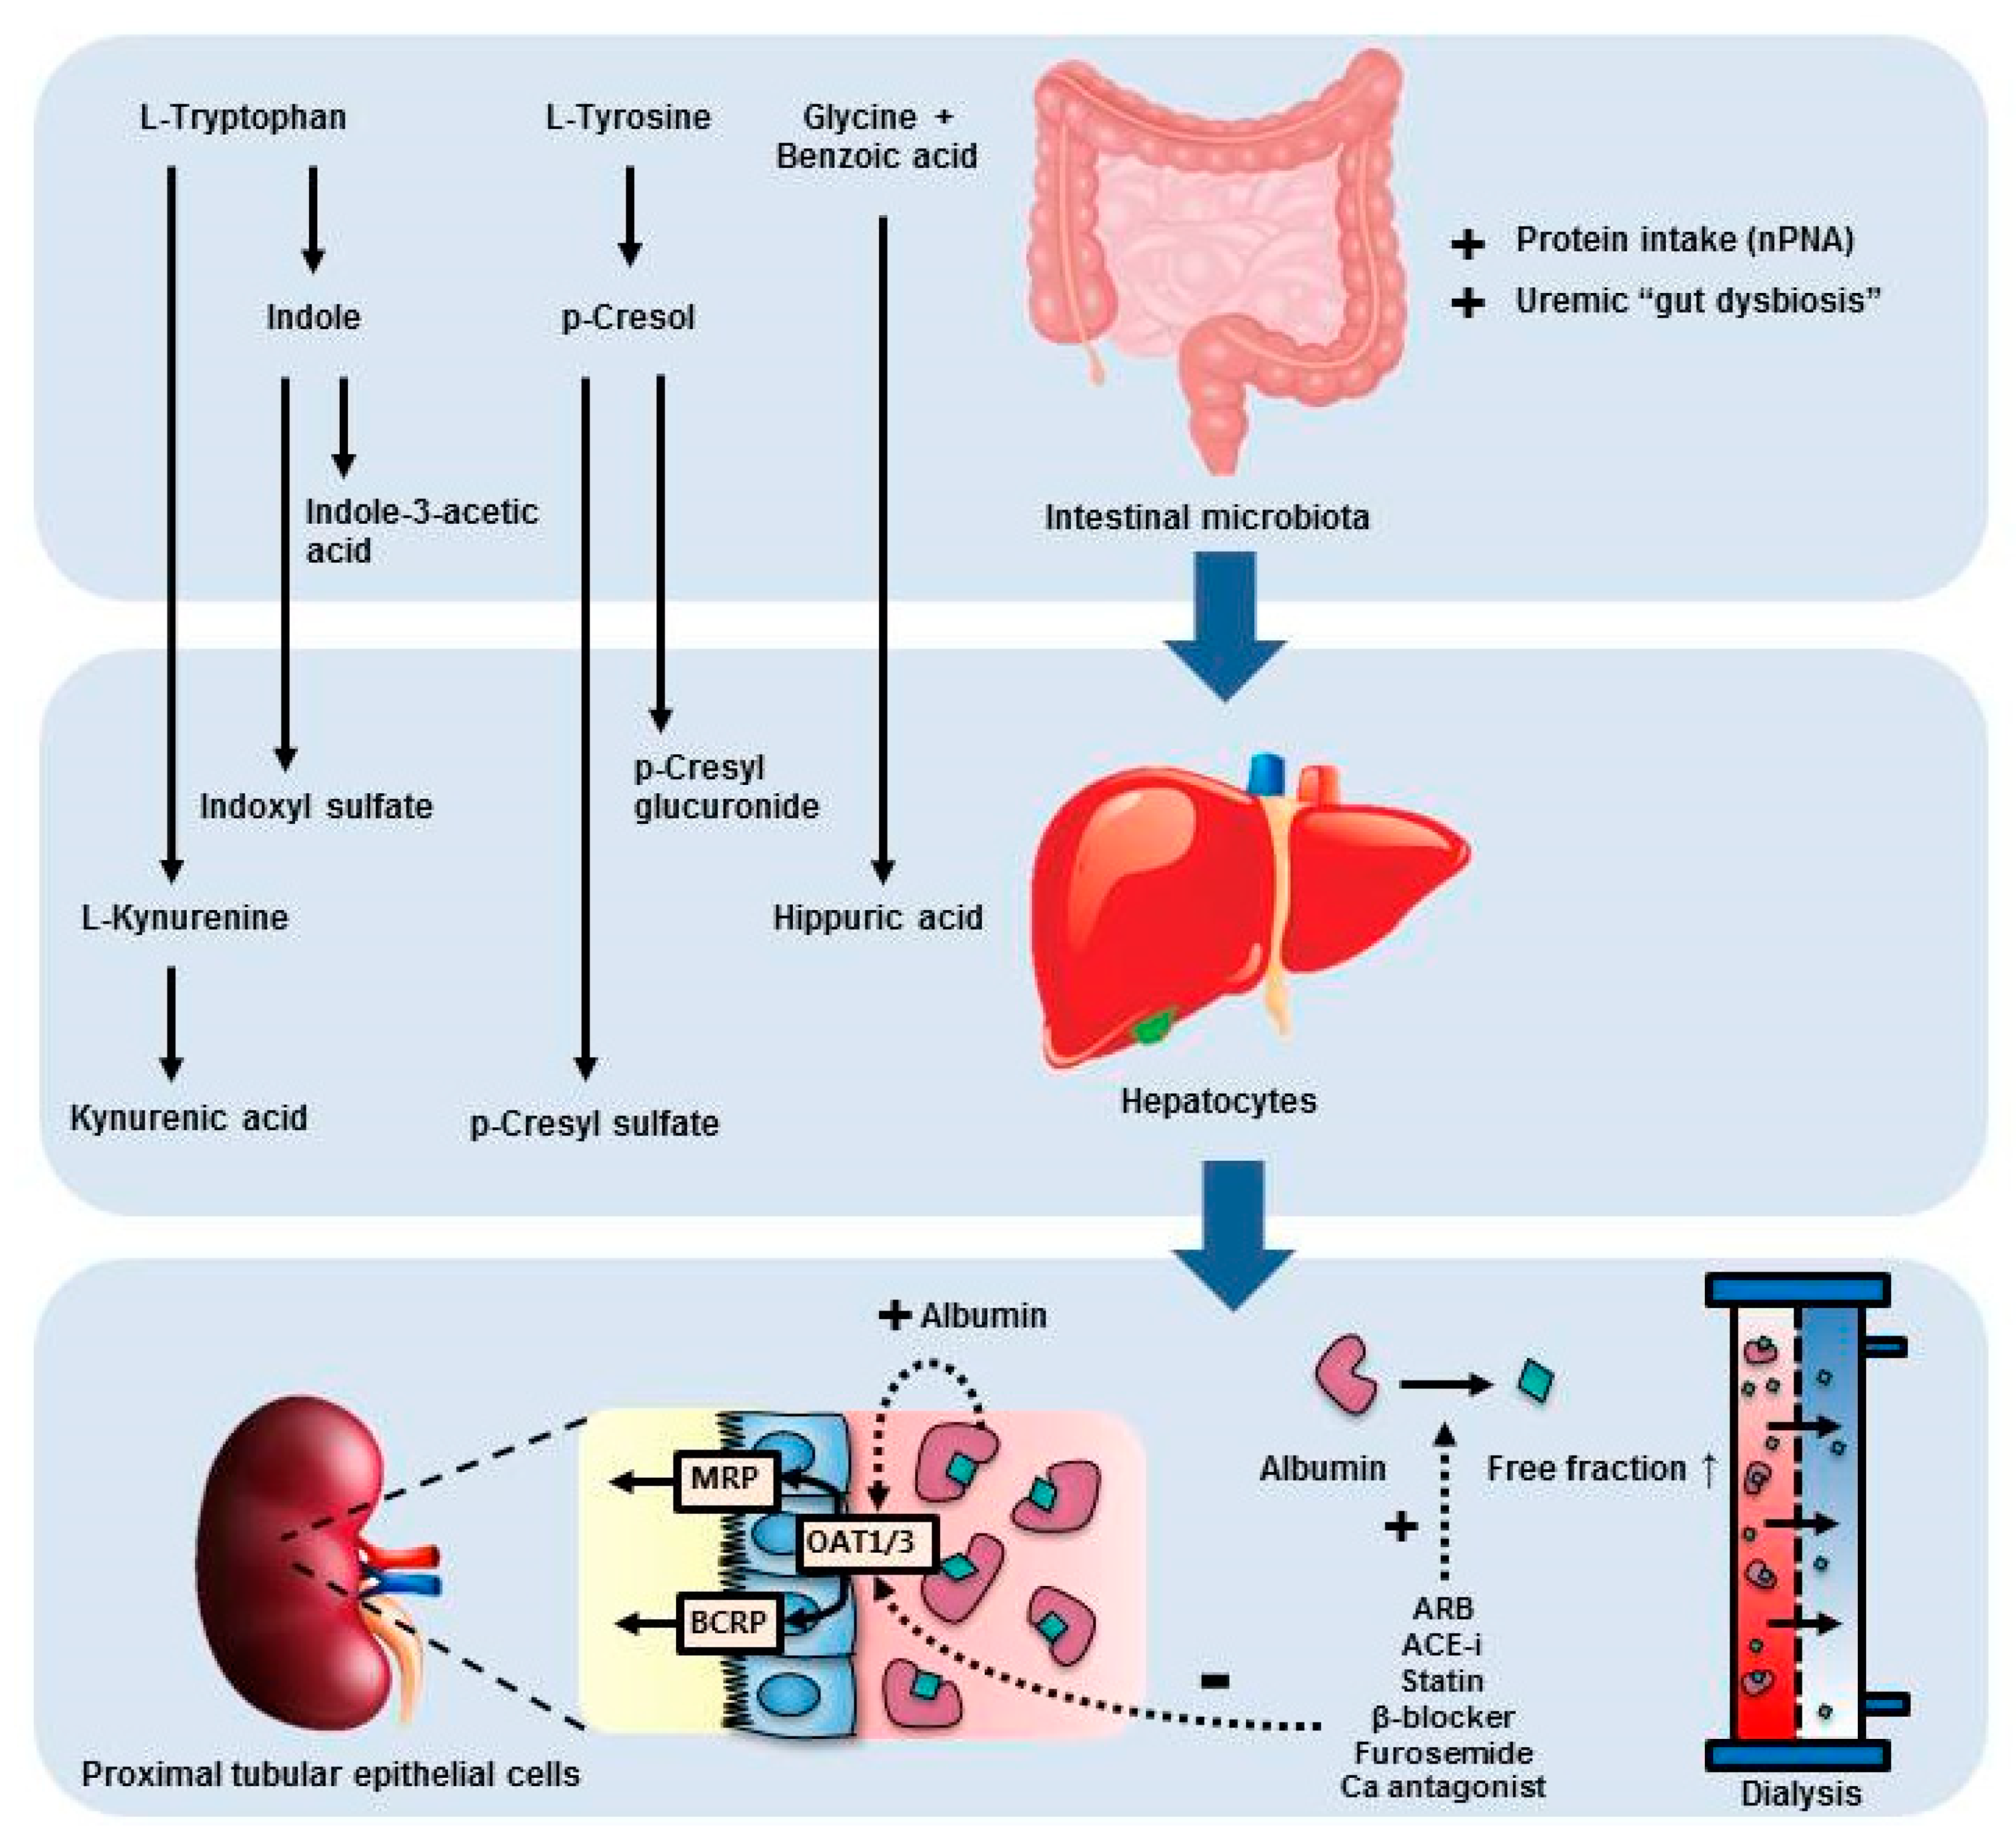
1. Introduction
2. Results
2.1. Baseline Characteristics
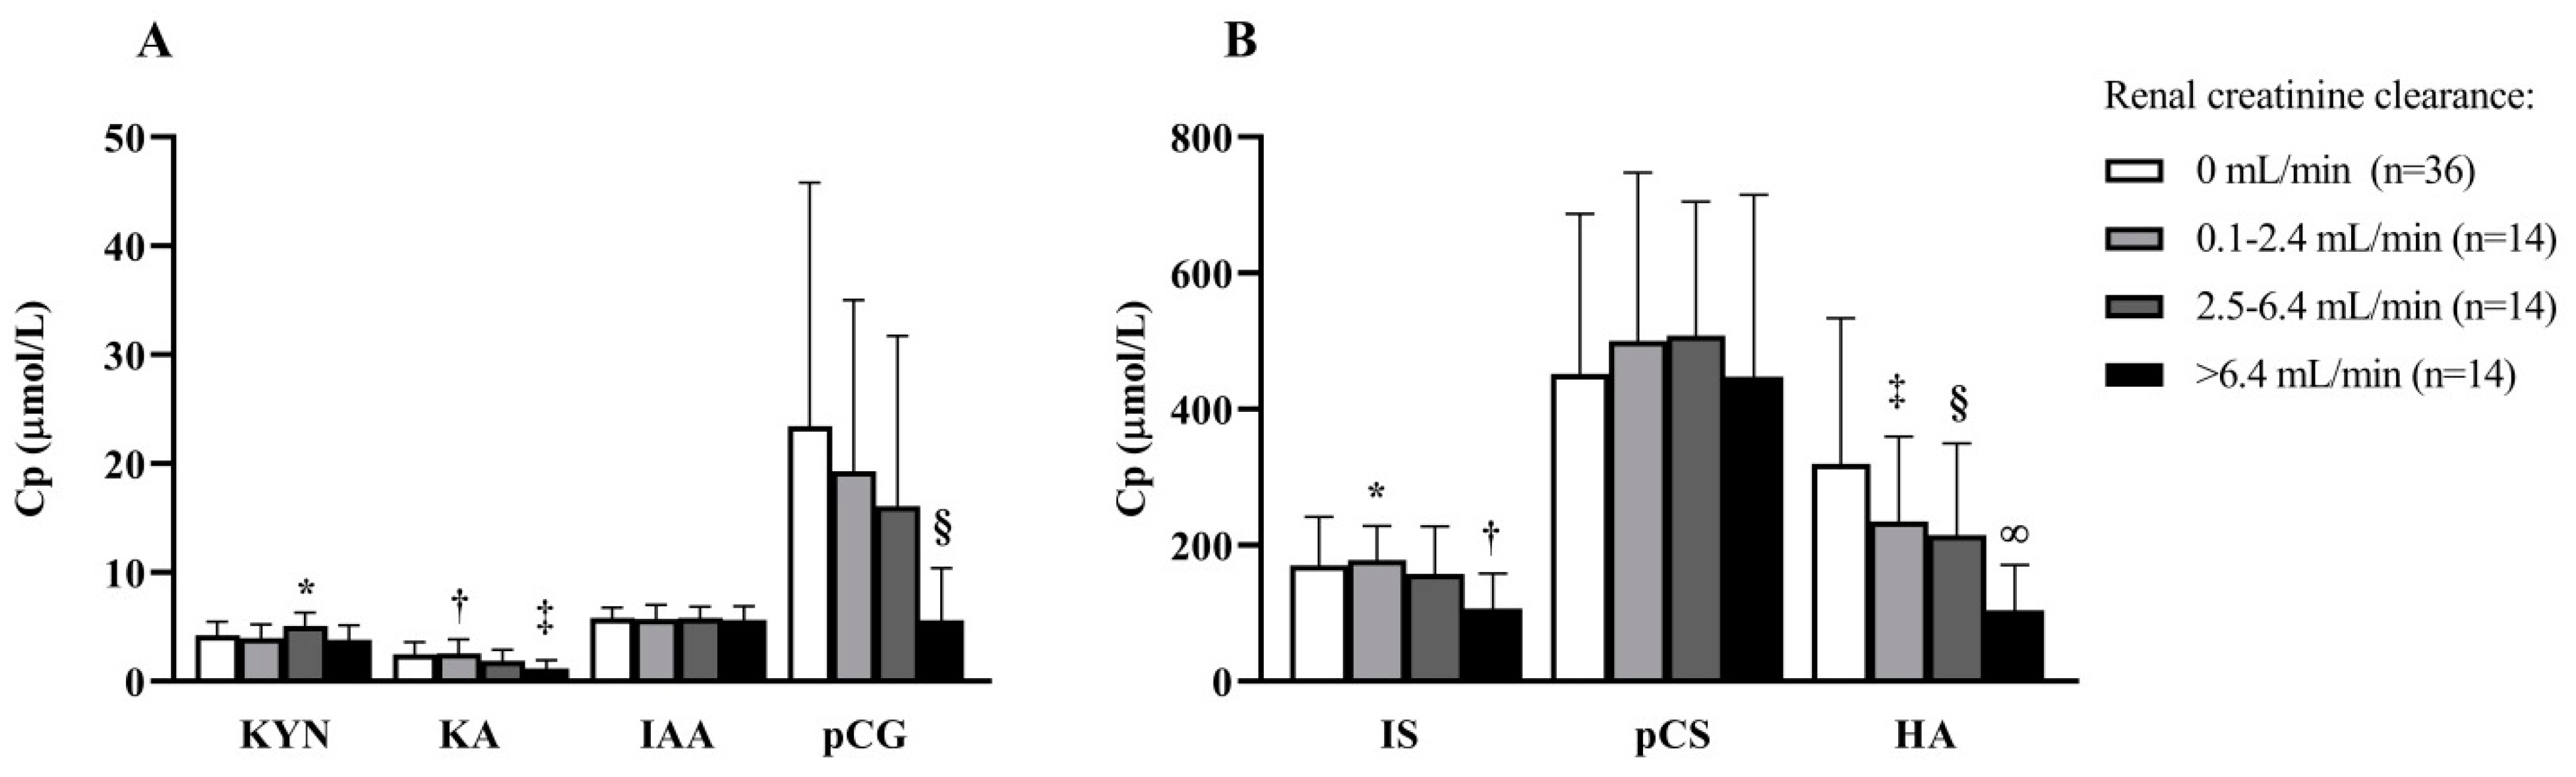
2.2. Determinants of PBUT Plasma Concentrations at Baseline
2.3. PBUT Change over Time, HDF versus HD
2.4. PBUTs and All-Cause Mortality and Cardiovascular Event
3. Discussion
4. Conclusions
5. Methods
5.1. Study Design and Patients
5.2. Dialysis Procedures
5.3. Data Collection
5.4. Laboratory Analyses
5.5. Statistical Analysis
5.5.1. Baseline Characteristics
5.5.2. Determinants of PBUT Plasma Concentrations at Baseline
5.5.3. PBUT Change over Time, HDF versus HD
5.5.4. PBUTs and All-Cause Mortality and Cardiovascular Events
Supplementary Materials
Author Contributions
Funding
Acknowledgments
Conflicts of Interest
References
- Masereeuw, R.; Mutsaers, H.A.; Toyohara, T.; Abe, T.; Jhawar, S.; Sweet, D.H.; Lowenstein, J. The kidney and uremic toxin removal: Glomerulus or tubule? Semin. Nephrol. 2014, 34, 191–208. [Google Scholar] [CrossRef]
- van Gelder, M.K.; Mihaila, S.M.; Jansen, J.; Wester, M.; Verhaar, M.C.; Joles, J.A.; Stamatialis, D.; Masereeuw, R.; Gerritsen, K.G.F. From portable dialysis to a bioengineered kidney. Expert Rev. Med. Devices 2018, 15, 323–336. [Google Scholar] [CrossRef] [PubMed]
- Schophuizen, C.M.; Wilmer, M.J.; Jansen, J.; Gustavsson, L.; Hilgendorf, C.; Hoenderop, J.G.; van den Heuvel, L.P.; Masereeuw, R. Cationic uremic toxins affect human renal proximal tubule cell functioning through interaction with the organic cation transporter. Pflugers Arch. 2013, 465, 1701–1714. [Google Scholar] [CrossRef] [PubMed]
- Saran, R.; Canaud, B.J.; Depner, T.A.; Keen, M.L.; McCullough, K.P.; Marshall, M.R.; Port, F.K. Dose of dialysis: Key lessons from major observational studies and clinical trials. Am. J. Kidney Dis. 2004, 44, 47–53. [Google Scholar] [CrossRef]
- Port, F.K.; Pisoni, R.L.; Bragg-Gresham, J.L.; Satayathum, S.S.; Young, E.W.; Wolfe, R.A.; Held, P.J. DOPPS estimates of patient life years attributable to modifiable hemodialysis practices in the United States. Blood Purif 2004, 22, 175–180. [Google Scholar] [CrossRef]
- Group, F.H.N.T.; Chertow, G.M.; Levin, N.W.; Beck, G.J.; Depner, T.A.; Eggers, P.W.; Gassman, J.J.; Gorodetskaya, I.; Greene, T.; James, S.; et al. In-center hemodialysis six times per week versus three times per week. N. Engl. J. Med. 2010, 363, 2287–2300. [Google Scholar] [CrossRef]
- Obi, Y.; Rhee, C.M.; Mathew, A.T.; Shah, G.; Streja, E.; Brunelli, S.M.; Kovesdy, C.P.; Mehrotra, R.; Kalantar-Zadeh, K. Residual Kidney Function Decline and Mortality in Incident Hemodialysis Patients. J. Am. Soc. Nephrol. 2016, 27, 3758–3768. [Google Scholar] [CrossRef]
- Obi, Y.; Streja, E.; Rhee, C.M.; Ravel, V.; Amin, A.N.; Cupisti, A.; Chen, J.; Mathew, A.T.; Kovesdy, C.P.; Mehrotra, R.; et al. Incremental Hemodialysis, Residual Kidney Function, and Mortality Risk in Incident Dialysis Patients: A Cohort Study. Am. J. Kidney Dis. 2016, 68, 256–265. [Google Scholar] [CrossRef]
- Shafi, T.; Jaar, B.G.; Plantinga, L.C.; Fink, N.E.; Sadler, J.H.; Parekh, R.S.; Powe, N.R.; Coresh, J. Association of residual urine output with mortality, quality of life, and inflammation in incident hemodialysis patients: The Choices for Healthy Outcomes in Caring for End-Stage Renal Disease (CHOICE) Study. Am. J. Kidney Dis. 2010, 56, 348–358. [Google Scholar] [CrossRef]
- Vanholder, R.; Schepers, E.; Pletinck, A.; Nagler, E.V.; Glorieux, G. The uremic toxicity of indoxyl sulfate and p-cresyl sulfate: A systematic review. J. Am. Soc. Nephrol. 2014, 25, 1897–1907. [Google Scholar] [CrossRef]
- Opdebeeck, B.; Maudsley, S.; Azmi, A.; De Mare, A.; De Leger, W.; Meijers, B.; Verhulst, A.; Evenepoel, P.; D’ Haese, P.C.; Neven, E. Indoxyl Sulfate and p-Cresyl Sulfate Promote Vascular Calcification and Associate with Glucose Intolerance. J. Am. Soc. Nephrol. 2019, 30, 751–766. [Google Scholar] [CrossRef] [PubMed]
- Lin, C.J.; Wu, V.; Wu, P.C.; Wu, C.J. Meta-Analysis of the Associations of p-Cresyl Sulfate (PCS) and Indoxyl Sulfate (IS) with Cardiovascular Events and All-Cause Mortality in Patients with Chronic Renal Failure. PLoS ONE 2015, 10, e0132589. [Google Scholar] [CrossRef] [PubMed]
- Sato, E.; Tanaka, A.; Oyama, J.; Yamasaki, A.; Shimomura, M.; Hiwatashi, A.; Ueda, Y.; Amaha, M.; Nomura, M.; Matsumura, D.; et al. Long-term effects of AST-120 on the progression and prognosis of pre-dialysis chronic kidney disease: A 5-year retrospective study. Heart Vessels 2016, 31, 1625–1632. [Google Scholar] [CrossRef] [PubMed]
- Cha, R.H.; Kang, S.W.; Park, C.W.; Cha, D.R.; Na, K.Y.; Kim, S.G.; Yoon, S.A.; Kim, S.; Han, S.Y.; Park, J.H.; et al. Sustained uremic toxin control improves renal and cardiovascular outcomes in patients with advanced renal dysfunction: Post-hoc analysis of the Kremezin Study against renal disease progression in Korea. Kidney Res. Clin. Pract. 2017, 36, 68–78. [Google Scholar] [CrossRef]
- Peters, S.A.; Bots, M.L.; Canaud, B.; Davenport, A.; Grooteman, M.P.; Kircelli, F.; Locatelli, F.; Maduell, F.; Morena, M.; Nube, M.J.; et al. Haemodiafiltration and mortality in end-stage kidney disease patients: A pooled individual participant data analysis from four randomized controlled trials. Nephrol. Dial. Transplant. 2016, 31, 978–984. [Google Scholar] [CrossRef]
- Meert, N.; Waterloos, M.A.; Van Landschoot, M.; Dhondt, A.; Ledebo, I.; Glorieux, G.; Goeman, J.; Van der Eycken, J.; Vanholder, R. Prospective evaluation of the change of predialysis protein-bound uremic solute concentration with postdilution online hemodiafiltration. Artif Organs 2010, 34, 580–585. [Google Scholar] [CrossRef]
- Abad, S.; Vega, A.; Quiroga, B.; Arroyo, D.; Panizo, N.; Reque, J.E.; Lopez-Gomez, J.M. Protein-bound toxins: Added value in their removal with high convective volumes. Nefrologia 2016, 36, 637–642. [Google Scholar] [CrossRef]
- Bammens, B.; Evenepoel, P.; Verbeke, K.; Vanrenterghem, Y. Removal of the protein-bound solute p-cresol by convective transport: A randomized crossover study. Am. J. Kidney Dis. 2004, 44, 278–285. [Google Scholar] [CrossRef]
- Krieter, D.H.; Hackl, A.; Rodriguez, A.; Chenine, L.; Moragues, H.L.; Lemke, H.D.; Wanner, C.; Canaud, B. Protein-bound uraemic toxin removal in haemodialysis and post-dilution haemodiafiltration. Nephrol Dial. Transplant. 2010, 25, 212–218. [Google Scholar] [CrossRef]
- Krieter, D.H.; Devine, E.; Korner, T.; Ruth, M.; Wanner, C.; Raine, M.; Jankowski, J.; Lemke, H.D. Haemodiafiltration at increased plasma ionic strength for improved protein-bound toxin removal. Acta Physiol. (Oxf) 2017, 219, 510–520. [Google Scholar] [CrossRef]
- Snauwaert, E.; Van Biesen, W.; Raes, A.; Glorieux, G.; Vande Walle, J.; Roels, S.; Vanholder, R.; Askiti, V.; Azukaitis, K.; Bayazit, A.; et al. Haemodiafiltration does not lower protein-bound uraemic toxin levels compared with haemodialysis in a paediatric population. Nephrol. Dial. Transplant. 2019. [Google Scholar] [CrossRef] [PubMed]
- Panichi, V.; Rocchetti, M.T.; Scatena, A.; Rosati, A.; Migliori, M.; Pizzarelli, F.; Gesualdo, L.; group, R.S. Long term variation of serum levels of uremic toxins in patients treated by post-dilution high volume on-line hemodiafiltration in comparison to standard low-flux bicarbonate dialysis: Results from the REDERT study. J. Nephrol. 2017, 30, 583–591. [Google Scholar] [CrossRef] [PubMed]
- Malhotra, R.; Persic, V.; Zhang, W.; Brown, J.; Tao, X.; Rosales, L.; Thijssen, S.; Finkelstein, F.O.; Unruh, M.L.; Ikizler, A.; et al. Tryptophan and Kynurenine Levels and Its Association With Sleep, Nonphysical Fatigue, and Depression in Chronic Hemodialysis Patients. J. Ren. Nutr. 2017, 27, 260–266. [Google Scholar] [CrossRef] [PubMed]
- Schefold, J.C.; Zeden, J.P.; Fotopoulou, C.; von Haehling, S.; Pschowski, R.; Hasper, D.; Volk, H.D.; Schuett, C.; Reinke, P. Increased indoleamine 2,3-dioxygenase (IDO) activity and elevated serum levels of tryptophan catabolites in patients with chronic kidney disease: A possible link between chronic inflammation and uraemic symptoms. Nephrol Dial. Transplant. 2009, 24, 1901–1908. [Google Scholar] [CrossRef]
- Quak, J.; Doornbos, B.; Roest, A.M.; Duivis, H.E.; Vogelzangs, N.; Nolen, W.A.; Penninx, B.W.; Kema, I.P.; de Jonge, P. Does tryptophan degradation along the kynurenine pathway mediate the association between pro-inflammatory immune activity and depressive symptoms? Psychoneuroendocrinology 2014, 45, 202–210. [Google Scholar] [CrossRef]
- Karu, N.; McKercher, C.; Nichols, D.S.; Davies, N.; Shellie, R.A.; Hilder, E.F.; Jose, M.D. Tryptophan metabolism, its relation to inflammation and stress markers and association with psychological and cognitive functioning: Tasmanian Chronic Kidney Disease pilot study. BMC Nephrol. 2016, 17, 171. [Google Scholar] [CrossRef]
- Aronov, P.A.; Luo, F.J.; Plummer, N.S.; Quan, Z.; Holmes, S.; Hostetter, T.H.; Meyer, T.W. Colonic contribution to uremic solutes. J. Am. Soc. Nephrol. 2011, 22, 1769–1776. [Google Scholar] [CrossRef]
- Ujhelyi, L.; Balla, G.; Jeney, V.; Varga, Z.; Nagy, E.; Vercellotti, G.M.; Agarwal, A.; Eaton, J.W.; Balla, J. Hemodialysis reduces inhibitory effect of plasma ultrafiltrate on LDL oxidation and subsequent endothelial reactions. Kidney Int. 2006, 69, 144–151. [Google Scholar] [CrossRef][Green Version]
- Jourde-Chiche, N.; Dou, L.; Sabatier, F.; Calaf, R.; Cerini, C.; Robert, S.; Camoin-Jau, L.; Charpiot, P.; Argiles, A.; Dignat-George, F.; et al. Levels of circulating endothelial progenitor cells are related to uremic toxins and vascular injury in hemodialysis patients. J. Thromb Haemost 2009, 7, 1576–1584. [Google Scholar] [CrossRef]
- de Loor, H.; Bammens, B.; Evenepoel, P.; De Preter, V.; Verbeke, K. Gas chromatographic-mass spectrometric analysis for measurement of p-cresol and its conjugated metabolites in uremic and normal serum. Clin. Chem. 2005, 51, 1535–1538. [Google Scholar] [CrossRef]
- Viaene, L.; Meijers, B.K.; Vanrenterghem, Y.; Evenepoel, P. Serum Concentrations of p-Cresyl Sulfate and Indoxyl Sulfate, but Not Inflammatory Markers, Increase in Incident Peritoneal Dialysis Patients in Parallel with Loss of Residual Renal Function. Perit Dial. Int 2015, 35, 492. [Google Scholar] [CrossRef] [PubMed]
- Liabeuf, S.; Barreto, D.V.; Barreto, F.C.; Meert, N.; Glorieux, G.; Schepers, E.; Temmar, M.; Choukroun, G.; Vanholder, R.; Massy, Z.A.; et al. Free p-cresylsulphate is a predictor of mortality in patients at different stages of chronic kidney disease. Nephrol. Dial. Transplant. 2010, 25, 1183–1191. [Google Scholar] [CrossRef] [PubMed]
- Bammens, B.; Evenepoel, P.; Verbeke, K.; Vanrenterghem, Y. Removal of middle molecules and protein-bound solutes by peritoneal dialysis and relation with uremic symptoms. Kidney Int. 2003, 64, 2238–2243. [Google Scholar] [CrossRef] [PubMed]
- Poesen, R.; Viaene, L.; Verbeke, K.; Claes, K.; Bammens, B.; Sprangers, B.; Naesens, M.; Vanrenterghem, Y.; Kuypers, D.; Evenepoel, P.; et al. Renal clearance and intestinal generation of p-cresyl sulfate and indoxyl sulfate in CKD. Clin. J. Am. Soc Nephrol. 2013, 8, 1508–1514. [Google Scholar] [CrossRef]
- Bammens, B.; Evenepoel, P.; Verbeke, K.; Vanrenterghem, Y. Time profiles of peritoneal and renal clearances of different uremic solutes in incident peritoneal dialysis patients. Am. J. Kidney Dis. 2005, 46, 512–519. [Google Scholar] [CrossRef]
- Jansen, J.; Fedecostante, M.; Wilmer, M.J.; Peters, J.G.; Kreuser, U.M.; van den Broek, P.H.; Mensink, R.A.; Boltje, T.J.; Stamatialis, D.; Wetzels, J.F.; et al. Bioengineered kidney tubules efficiently excrete uremic toxins. Sci. Rep. 2016, 6, 26715. [Google Scholar] [CrossRef]
- Poesen, R.; Evenepoel, P.; de Loor, H.; Kuypers, D.; Augustijns, P.; Meijers, B. Metabolism, Protein Binding, and Renal Clearance of Microbiota-Derived p-Cresol in Patients with CKD. Clin, J. Am. Soc Nephrol. 2016, 11, 1136–1144. [Google Scholar] [CrossRef]
- Mutsaers, H.A.; van den Heuvel, L.P.; Ringens, L.H.; Dankers, A.C.; Russel, F.G.; Wetzels, J.F.; Hoenderop, J.G.; Masereeuw, R. Uremic toxins inhibit transport by breast cancer resistance protein and multidrug resistance protein 4 at clinically relevant concentrations. PLoS ONE 2011, 6, e18438. [Google Scholar] [CrossRef]
- Snauwaert, E.; Van Biesen, W.; Raes, A.; Holvoet, E.; Glorieux, G.; Van Hoeck, K.; Van Dyck, M.; Godefroid, N.; Vanholder, R.; Roels, S.; et al. Accumulation of uraemic toxins is reflected only partially by estimated GFR in paediatric patients with chronic kidney disease. Pediatr. Nephrol. 2018, 33, 315–323. [Google Scholar] [CrossRef]
- Snauwaert, E.; Holvoet, E.; Van Biesen, W.; Raes, A.; Glorieux, G.; Vande Walle, J.; Roels, S.; Vanholder, R.; Askiti, V.; Azukaitis, K.; et al. Uremic Toxin Concentrations are Related to Residual Kidney Function in the Pediatric Hemodialysis Population. Toxins (Basel) 2019, 11, 235. [Google Scholar] [CrossRef]
- TMIC. The Metabolomics Innovation Centre. Available online: http://www.hmdb.ca/metabolites (accessed on 4 February 2020).
- Deltombe, O.; Van Biesen, W.; Glorieux, G.; Massy, Z.; Dhondt, A.; Eloot, S. Exploring Protein Binding of Uremic Toxins in Patients with Different Stages of Chronic Kidney Disease and during Hemodialysis. Toxins (Basel) 2015, 7, 3933–3946. [Google Scholar] [CrossRef] [PubMed]
- Etinger, A.; Kumar, S.R.; Ackley, W.; Soiefer, L.; Chun, J.; Singh, P.; Grossman, E.; Matalon, A.; Holzman, R.S.; Meijers, B.; et al. The effect of isohydric hemodialysis on the binding and removal of uremic retention solutes. PLoS ONE 2018, 13, e0192770. [Google Scholar] [CrossRef]
- Sirich, T.L.; Meyer, T.W.; Gondouin, B.; Brunet, P.; Niwa, T. Protein-bound molecules: A large family with a bad character. Semin. Nephrol. 2014, 34, 106–117. [Google Scholar] [CrossRef]
- van der Made, T.K.; Fedecostante, M.; Scotcher, D.; Rostami-Hodjegan, A.; Sastre Torano, J.; Middel, I.; Koster, A.S.; Gerritsen, K.G.; Jankowski, V.; Jankowski, J.; et al. Quantitative Translation of Microfluidic Transporter in Vitro Data to in Vivo Reveals Impaired Albumin-Facilitated Indoxyl Sulfate Secretion in Chronic Kidney Disease. Mol. Pharm. 2019, 16, 4551–4562. [Google Scholar] [CrossRef]
- Tao, X.; Thijssen, S.; Kotanko, P.; Ho, C.H.; Henrie, M.; Stroup, E.; Handelman, G. Improved dialytic removal of protein-bound uraemic toxins with use of albumin binding competitors: An in vitro human whole blood study. Sci. Rep. 2016, 6, 23389. [Google Scholar] [CrossRef]
- Pubchem. Available online: https://pubchem.ncbi.nlm.nih.gov/compound/Pravastatin (accessed on 4 February 2020).
- Pubchem. Available online: https://pubchem.ncbi.nlm.nih.gov/compound/losartan (accessed on 4 February 2020).
- Mihaila, S.; Stefens, M.; Stamatialis, D.; Marianne, V.; Gerritsen, K.; Masereeuw, R. Interaction between drugs and endogenous metabolites for renal organic anion transport [Abstract].; Nephrology Dialysis Transplantation, V., Issue Supplement, June 2019, gfz106.FP112. Available online: https://academic.oup.com/ndt/article/34/Supplement_1/gfz106.FP112/5514630 (accessed on 4 February 2020).
- Krieter, D.H.; Kerwagen, S.; Ruth, M.; Lemke, H.D.; Wanner, C. Differences in Dialysis Efficacy Have Limited Effects on Protein-Bound Uremic Toxins Plasma Levels over Time. Toxins (Basel) 2019, 11, 47. [Google Scholar] [CrossRef]
- Meijers, B.K.; De Loor, H.; Bammens, B.; Verbeke, K.; Vanrenterghem, Y.; Evenepoel, P. p-Cresyl sulfate and indoxyl sulfate in hemodialysis patients. Clin. J. Am. Soc Nephrol. 2009, 4, 1932–1938. [Google Scholar] [CrossRef]
- Meert, N.; Eloot, S.; Schepers, E.; Lemke, H.D.; Dhondt, A.; Glorieux, G.; Van Landschoot, M.; Waterloos, M.A.; Vanholder, R. Comparison of removal capacity of two consecutive generations of high-flux dialysers during different treatment modalities. Nephrol. Dial. Transplant. 2011, 26, 2624–2630. [Google Scholar] [CrossRef]
- van Gelder, M.K.; Abrahams, A.C.; Joles, J.A.; Kaysen, G.A.; Gerritsen, K.G.F. Albumin handling in different hemodialysis modalities. Nephrol. Dial. Transplant. 2018, 33, 906–913. [Google Scholar] [CrossRef]
- Blankestijn, P.J.; Ledebo, I.; Canaud, B. Hemodiafiltration: Clinical evidence and remaining questions. Kidney Int. 2010, 77, 581–587. [Google Scholar] [CrossRef]
- Roumelioti, M.E.; Trietley, G.; Nolin, T.D.; Ng, Y.H.; Xu, Z.; Alaini, A.; Figueroa, R.; Unruh, M.L.; Argyropoulos, C.P. Beta-2 microglobulin clearance in high-flux dialysis and convective dialysis modalities: A meta-analysis of published studies. Nephrol. Dial. Transplant. 2018, 33, 1025–1039. [Google Scholar] [CrossRef]
- Viaene, L.; Annaert, P.; de Loor, H.; Poesen, R.; Evenepoel, P.; Meijers, B. Albumin is the main plasma binding protein for indoxyl sulfate and p-cresyl sulfate. Biopharm. Drug Dispos. 2013, 34, 165–175. [Google Scholar] [CrossRef] [PubMed]
- De Smet, R.; Dhondt, A.; Eloot, S.; Galli, F.; Waterloos, M.A.; Vanholder, R. Effect of the super-flux cellulose triacetate dialyser membrane on the removal of non-protein-bound and protein-bound uraemic solutes. Nephrol. Dial. Transplant. 2007, 22, 2006–2012. [Google Scholar] [CrossRef] [PubMed]
- Meyer, T.W.; Sirich, T.L.; Fong, K.D.; Plummer, N.S.; Shafi, T.; Hwang, S.; Banerjee, T.; Zhu, Y.; Powe, N.R.; Hai, X.; et al. Kt/Vurea and Nonurea Small Solute Levels in the Hemodialysis Study. J. Am. Soc. Nephrol. 2016, 27, 3469–3478. [Google Scholar] [CrossRef] [PubMed]
- Sirich, T.L.; Funk, B.A.; Plummer, N.S.; Hostetter, T.H.; Meyer, T.W. Prominent accumulation in hemodialysis patients of solutes normally cleared by tubular secretion. J. Am. Soc. Nephrol. 2014, 25, 615–622. [Google Scholar] [CrossRef] [PubMed]
- Dou, L.; Sallee, M.; Cerini, C.; Poitevin, S.; Gondouin, B.; Jourde-Chiche, N.; Fallague, K.; Brunet, P.; Calaf, R.; Dussol, B.; et al. The cardiovascular effect of the uremic solute indole-3 acetic acid. J. Am. Soc. Nephrol. 2015, 26, 876–887. [Google Scholar] [CrossRef]
- Cohen, G.; Glorieux, G.; Thornalley, P.; Schepers, E.; Meert, N.; Jankowski, J.; Jankowski, V.; Argiles, A.; Anderstam, B.; Brunet, P.; et al. Review on uraemic toxins III: Recommendations for handling uraemic retention solutes in vitro--towards a standardized approach for research on uraemia. Nephrol. Dial. Transplant. 2007, 22, 3381–3390. [Google Scholar] [CrossRef]
- De Smet, R.; Van Kaer, J.; Van Vlem, B.; De Cubber, A.; Brunet, P.; Lameire, N.; Vanholder, R. Toxicity of free p-cresol: A prospective and cross-sectional analysis. Clin. Chem. 2003, 49, 470–478. [Google Scholar] [CrossRef]
- Kalantar-Zadeh, K.; Fouque, D. Nutritional Management of Chronic Kidney Disease. N. Engl. J. Med. 2017, 377, 1765–1776. [Google Scholar] [CrossRef]
- Kasiske, B.L.; Lakatua, J.D.; Ma, J.Z.; Louis, T.A. A meta-analysis of the effects of dietary protein restriction on the rate of decline in renal function. Am. J. Kidney Dis. 1998, 31, 954–961. [Google Scholar] [CrossRef]
- Jiang, Z.; Zhang, X.; Yang, L.; Li, Z.; Qin, W. Effect of restricted protein diet supplemented with keto analogues in chronic kidney disease: A systematic review and meta-analysis. Int. Urol. Nephrol. 2016, 48, 409–418. [Google Scholar] [CrossRef]
- Lin, C.J.; Liu, H.L.; Pan, C.F.; Chuang, C.K.; Jayakumar, T.; Wang, T.J.; Chen, H.H.; Wu, C.J. Indoxyl sulfate predicts cardiovascular disease and renal function deterioration in advanced chronic kidney disease. Arch. Med. Res. 2012, 43, 451–456. [Google Scholar] [CrossRef]
- Wu, I.W.; Hsu, K.H.; Lee, C.C.; Sun, C.Y.; Hsu, H.J.; Tsai, C.J.; Tzen, C.Y.; Wang, Y.C.; Lin, C.Y.; Wu, M.S. p-Cresyl sulphate and indoxyl sulphate predict progression of chronic kidney disease. Nephrol. Dial. Transplant. 2011, 26, 938–947. [Google Scholar] [CrossRef]
- Barreto, F.C.; Barreto, D.V.; Liabeuf, S.; Meert, N.; Glorieux, G.; Temmar, M.; Choukroun, G.; Vanholder, R.; Massy, Z.A.; European Uremic Toxin Work, G. Serum indoxyl sulfate is associated with vascular disease and mortality in chronic kidney disease patients. Clin. J. Am. Soc. Nephrol. 2009, 4, 1551–1558. [Google Scholar] [CrossRef] [PubMed]
- Shinaberger, C.S.; Kilpatrick, R.D.; Regidor, D.L.; McAllister, C.J.; Greenland, S.; Kopple, J.D.; Kalantar-Zadeh, K. Longitudinal associations between dietary protein intake and survival in hemodialysis patients. Am. J. Kidney Dis. 2006, 48, 37–49. [Google Scholar] [CrossRef] [PubMed]
- Ravel, V.A.; Molnar, M.Z.; Streja, E.; Kim, J.C.; Victoroff, A.; Jing, J.; Benner, D.; Norris, K.C.; Kovesdy, C.P.; Kopple, J.D.; et al. Low protein nitrogen appearance as a surrogate of low dietary protein intake is associated with higher all-cause mortality in maintenance hemodialysis patients. J. Nutr. 2013, 143, 1084–1092. [Google Scholar] [CrossRef]
- Grooteman, M.P.; van den Dorpel, M.A.; Bots, M.L.; Penne, E.L.; van der Weerd, N.C.; Mazairac, A.H.; den Hoedt, C.H.; van der Tweel, I.; Levesque, R.; Nube, M.J.; et al. Effect of online hemodiafiltration on all-cause mortality and cardiovascular outcomes. J. Am. Soc. Nephrol. 2012, 23, 1087–1096. [Google Scholar] [CrossRef]
- Association for the Advancement of Medical Instrumentation (AAMI). Water for Hemodialysis and Related Therapies. ANSI/AAMI/ISO 11663:2009. Available online: https://webstore.ansi.org/standards/aami/ansiaamiiso116632009 (accessed on 4 February 2020).
- Shemesh, O.; Golbetz, H.; Kriss, J.P.; Myers, B.D. Limitations of creatinine as a filtration marker in glomerulopathic patients. Kidney Int. 1985, 28, 830–838. [Google Scholar] [CrossRef]
- Daugirdas, J.T. Second generation logarithmic estimates of single-pool variable volume Kt/V: An analysis of error. J. Am. Soc. Nephrol. 1993, 4, 1205–1213. [Google Scholar]
- Poesen, R.; Mutsaers, H.A.; Windey, K.; van den Broek, P.H.; Verweij, V.; Augustijns, P.; Kuypers, D.; Jansen, J.; Evenepoel, P.; Verbeke, K.; et al. The Influence of Dietary Protein Intake on Mammalian Tryptophan and Phenolic Metabolites. PLoS ONE 2015, 10, e0140820. [Google Scholar] [CrossRef]


| Characteristic | Low-Flux HD (n = 41) | Online HDF (n = 39) | P† |
|---|---|---|---|
| Age – years | 63.4 ± 13.1 | 62.4 ± 15.4 | 0.744 |
| Male sex – no. (%) | 25 (61) | 20 (51) | 0.499 |
| Systolic blood pressure (mmHg)* | 146 ± 19 | 147 ± 20 | 0.681 |
| Diastolic blood pressure (mmHg)* | 75 ± 10 | 77 ± 12 | 0.576 |
| Pulse pressure (mmHg)* | 70 ± 17 | 70 ± 16 | 0.913 |
| History of CVD – no. (%) | 18 (44) | 16 (41) | 0.824 |
| Diabetes mellitus – no. (%) | 8 (20) | 9 (23) | 0.788 |
| 24-h urine volume (mL) | 550 (305–1000) | 798 (246–1295) | 0.478 |
| Residual kidney function – no. (%)‡ | 20 (49) | 24 (62) | 0.271 |
| Renal creatinine clearance (mL/min) | 0.0 (0.0–3.6) | 1.5 (0.0–5.9) | 0.249 |
| Dialysis vintage (years) | 2.3 (0.7–3.7) | 1.4 (0.8–2.4) | 0.182 |
| Normalized protein equivalent of nitrogen appearance (g/kg/d) | 1.19 ± 0.24 | 1.14 ± 0.24 | 0.409 |
| Beta blocker – no. (%) | 23 (56) | 15 (39) | 0.125 |
| Calcium antagonist – no. (%) | 15 (37) | 12 (31) | 0.641 |
| ACE-inhibitor – no. (%) | 17 (43) | 12 (31) | 0.352 |
| ARB – no. (%) | 8 (20) | 13 (33) | 0.210 |
| Statin – no. (%) | 19 (46) | 25 (64) | 0.123 |
| Furosemide– no. (%) | 7 (18) | 14 (36) | 0.078 |
| Creatinin (µmol/L)* | 965 ± 211 | 886 ± 264 | 0.143 |
| Phosphate (mmol/L)* | 1.76 ± 0.52 | 1.72 ± 0.49 | 0.711 |
| Albumin (g/L)* | 41.6 ± 3.9 | 41.6 ± 3.0 | 0.968 |
| HsCRP (mg/L)* | 10.5 ± 17.6 | 8.2 ± 16.2 | 0.561 |
| Hemoglobin (mmol/L)* | 7.3 ± 0.6 | 7.6 ± 0.8 | 0.183 |
| Kynurenine (µmol/L)* | 4.1 ± 1.2 | 4.4 ± 1.5 | 0.383 |
| Kynurenic acid (µmol/L)* | 2.4 ± 1.2 | 1.9 ± 1.1 | 0.023 |
| Indoxyl sulfate (µmol/L)* | 174 ± 59 | 143 ± 72 | 0.044 |
| Indole-3-acetic acid (µmol/L)* | 7.3 (5.1–15.0) | 6.6 (5.3–12.9) | 0.667 |
| p-Cresyl sulfate* | 618 (311–701) | 527 (195–701) | 0.449 |
| p-Cresyl glucuronide (µmol/L)* | 14.0 (5.1–32.1) | 8.9 (2.5–23.9) | 0.120 |
| Hippuric acid (µmol/L)* | 201 (103–333) | 182 (95–295) | 0.487 |
| Characteristic | Kynurenine (µmol/L)* | Kynurenic Acid (µmol/L)* | Indoxyl Sulfate (µmol/L)* | Indole-3-Acetic Acid (µmol/L)* | p-Cresyl Sulfate tertiles† | p-Cresyl Glucuronide (µmol/L)* | Hippuric Acid (µmol/L)* |
|---|---|---|---|---|---|---|---|
| β (p) | β (p) | β (p) | eβ (p) | eβ (p) | eβ (p) | eβ (p) | |
| Age (years) | −0.003 (0.808) | −0.020 (0.020) | −0.167 (0.754) | 1.000 (0.976) | 1.010 (0.531) | 1.001 (0.895) | 1.001 (0.899) |
| Gender (male = 1) | 0.203 (0.514) | 0.356 (0.145) | 3.750 (0.802) | 1.180 (0.309) | 1.784 (0.179) | 0.668 (0.182) | 1.062 (0.726) |
| Renal creatinine clearance (mL/min/1.73m2) | −0.019 (0.514) | −0.115 (<0.001) | −6.024 (0.001) | 0.958 (0.024) | 1.002 (0.968) | 0.899 (0.004) | 0.898 (<0.001) |
| nPNA (g/kg/d) | −1.579 (0.055) | 2.367 (<0.001) | 110.055 (0.005) | 0.852 (0.687) | 4.242 (0.216) | 2.572 (0.236) | 1.891 (0.148) |
| Dialysis vintage (years) | −0.096 (0.102) | −0.003 (0.951) | −0.311 (0.914) | 0.950 (0.077) | 1.122 (0.187) | 1.082 (0.170) | 0.984 (0.613) |
| Albumin (g/L) | 0.027 (0.543) | 0.054 (0.119) | 0.019 (0.993) | 1.047 (0.072) | 1.216 (0.004) | 1.082 (0.065) | 1.019 (0.462) |
| Beta blocker (yes = 1) | 0.334 (0.282) | 0.418 (0.084) | 19.877 (0.184) | 0.976 (0.881) | 1.507 (0.341) | 0.851 (0.594) | 1.189 (0.314) |
| Calcium antagonist (yes = 1) | 0.068 (0.833) | 0.018 (0.942) | −12.860 (0.407) | 1.122 (0.500) | 1.084 (0.855) | 0.689 (0.231) | 0.752 (0.113) |
| ACE-inhibitor (yes = 1) | −0.041 (0.901) | −0.550 (0.028) | 13.994 (0.374) | 0.724 (0.052) | 1.443 (0.458) | 1.235 (0.505) | 0.800 (0.214) |
| ARB (yes = 1) | 0.008 (0.983) | 0.653 (0.018) | −16.456 (0.344) | 1.065 (0.727) | 0.789 (0.595) | 0.800 (0.525) | 1.337 (0.141) |
| Statin (yes = 1) | 0.039 (0.902) | 0.224 (0.359) | 3.831 (0.800) | 0.705 (0.030) | 0.908 (0.823) | 1.061 (0.845) | 0.800 (0.196) |
| Furosemide (yes = 1) | 0.440 (0.210) | −0.685 (0.011) | −14.406 (0.399) | 1.072 (0.714) | 1.770 (0.242) | 0.702 (0.301) | 1.114 (0.580) |
| Systolic blood pressure (mmHg) | 0.001 (0.857) | 0.007 (0.278) | −0.230 (0.547) | 0.993 (0.126) | 0.988 (0.292) | 1.001 (0.862) | 1.001 (0.804) |
| Diastolic blood pressure (mmHg) | −0.004 (0.776) | 0.010 (0.401) | 0.790 (0.277) | 0.994 (0.463) | 1.016 (0.459) | 1.015 (0.319) | 1.013 (0.120) |
| Pulse pressure (mmHg) | 0.004 (0.690) | 0.006 (0.438) | −0.650 (0.156) | 0.993 (0.165) | 0.977 (0.088) | 0.996 (0.676) | 0.997 (0.504) |
| History of CVD (yes = 1) | 0.248 (0.468) | 0.069 (0.797) | 17.557 (0.286) | 0.863 (0.407) | 1.842 (0.198) | 0.847 (0.617) | 0.724 (0.087) |
| Diabetes mellitus (yes = 1) | 0.158 (0.693) | 0.624 (0.044) | 27.092 (0.159) | 1.047 (0.843) | 1.322 (0.614) | 0.704 (0.367) | 1.492 (0.074) |
| HsCRP (mg/L) | −0.001 (0.911) | −0.010 (0.177) | 0.585 (0.216) | 0.999 (0.917) | 0.968 (0.076) | 0.994 (0.486) | 0.999 (0.898) |
| PBUT | RKF | HD | HDF | HD vs. HDF | ||||
|---|---|---|---|---|---|---|---|---|
| N | ∆ (% Change/6 Months) | p* | N | ∆ (% Change/6 Months) | p* | p** | ||
| Kynurenine | all | 38 | −7.7 (−22.6 to 14.5) | 0.269 | 35 | −5.9 (−20.9 to 29.3) | 0.694 | 0.453 |
| NO | 19 | −9.4 (−21.8 to 12.4) | 0.171 | 12 | −19.6 (−42.2 to 5.6) | 0.019 | 0.181 | |
| YES | 19 | −5.9 (−30.1 to 25.7) | 0.693 | 23 | 17.6 (−13.5 to 17.5) | 0.226 | 0.146 | |
| Kynurenic acid | all | 38 | 5.6 (−8.6 to 69.1) | 0.111 | 36 | 3.2 (−22.1 to 39.5) | 0.537 | 0.430 |
| NO | 19 | 10.0 (−8.5 to 68.8) | 0.414 | 12 | −6.1 (−35.2 to 28.5) | 0.729 | 0.256 | |
| YES | 19 | 1.6 (−9.1 to 70.1) | 0.141 | 24 | 12.8 (−14.0 to 43.8) | 0.150 | 0.883 | |
| Indoxyl sulfate | all | 38 | 11.9 (−15.4 to 31.9) | 0.133 | 36 | −8.0 (−34.6 to 15.3) | 0.092 | 0.045 |
| NO | 19 | 14.5 (−14.3 to 31.7) | 0.130 | 12 | 4.6 (−19.6 to 19.6) | 0.992 | 0.351 | |
| YES | 19 | 1.7 (−21.3 to 33.9) | 0.524 | 24 | −17.8 (−48.0 to 10.9) | 0.075 | 0.129 | |
| Indole-3-acetic acid | all | 25 | 9.2 (−19.6 to 34.9) | 0.876 | 27 | −10.8 (−26.0 to 14.0) | 0.615 | 0.356 |
| NO | 12 | 0.6 (−36.3 to 25.9) | 0.721 | 10 | −15.1 (−28.3 to 5.3) | 0.314 | 0.568 | |
| YES | 13 | 10.9 (−15.2 to 40.7) | 0.477 | 17 | 5.8 (−25.6 to 52.5) | 0.861 | 0.434 | |
| p-Cresyl sulfate | all | 38 | −8.8 (−28.9 to 29.5) | 0.510 | 36 | −2.7 (−27.4 to 10.2) | 0.199 | 0.854 |
| NO | 19 | −7.3 (−24.2 to 17.6) | 0.381 | 12 | 2.6 (−21.7 to 86.9) | 0.859 | 0.394 | |
| YES | 19 | −10.7 (−31.8 to 79.5) | 0.906 | 24 | −4.0 (−40.3 to 0.00) | 0.053 | 0.477 | |
| p-Cresyl glucuronide | all | 38 | −7.0 (−38.1 to 69.8) | 0.421 | 36 | 7.4 (−37.3 to 65.3) | 0.765 | 0.681 |
| NO | 19 | −6.4 (−43.6 to 39.2) | 0.077 | 12 | 30.5 (−33.5 to 181.0) | 0.239 | 0.096 | |
| YES | 19 | −15.5 (−36.6 to 154.6) | 0.520 | 24 | −2.8 (−53.5 to 50.0) | 0.710 | 0.478 | |
| Hippuric acid | all | 38 | 5.7 (−44.6 to 54.5) | 0.531 | 36 | −21.9 (−47.6 to 42.4) | 0.187 | 0.566 |
| NO | 19 | 11.1 (−42.6 to 59.9) | 0.557 | 12 | −11.1 (−47.5 to 75.3) | 0.583 | 0.832 | |
| YES | 19 | 5.7 (−47.7 to 53.1) | 0.778 | 24 | −29.6 (−47.6 to 42.4) | 0.199 | 0.696 | |
| PBUT | Convection Volume (L) | N | ∆ (% Change/6 Months) | p* |
|---|---|---|---|---|
| Kynurenine | < 14.3 | 11 | 14.6 ± 42.6 | 0.265 |
| 14.3–18.4 | 14 | 8.5 ± 38.7 | ||
| >18.4 | 12 | −9.8 ± 29.1 | ||
| Kynurenic acid | < 14.3 | 12 | 10.8 ± 42.9 | 0.972 |
| 14.3–18.4 | 14 | 15.3 ± 42.6 | ||
| >18.4 | 12 | 14.0 ± 46.7 | ||
| Indoxyl sulfate | < 14.3 | 12 | 6.8 ± 48.8 | 0.774 |
| 14.3–18.4 | 14 | −17.7 ± 37.3 | ||
| >18.4 | 12 | −3.9 ± 40.4 | ||
| Indole-3-acetic acid | < 14.3 | 7 | 21.2 ± 61.1 | 0.453 |
| 14.3–18.4 | 9 | −1.3 ± 35.9 | ||
| >18.4 | 7 | −7.4 ± 32.7 | ||
| P-cresyl sulfate | < 14.3 | 12 | −2.1 ± 65.7 | 0.597 |
| 14.3–18.4 | 14 | 1.8 ± 64.4 | ||
| >18.4 | 12 | 54.0 ± 252.8 | ||
| P-cresyl glucuronide | < 14.3 | 12 | 41.8 ± 91.4 | 0.541 |
| 14.3–18.4 | 14 | 38.5 ± 135.7 | ||
| >18.4 | 12 | 233.7 ± 868.1 | ||
| Hippuric acid | < 14.3 | 12 | 23.5 ± 92.3 | 0.345 |
| 14.3–18.4 | 14 | −2.0 ± 89.2 | ||
| >18.4 | 12 | 11.1 ± 89.8 |
| Hazard Ratio (95% CI) | |||||||
|---|---|---|---|---|---|---|---|
| PBUT | Outcome | N | # Events | Model I | P | Model II | P |
| Kynurenine (µmol/L) | All-cause mortality | 79 | 34 | 1.020 (0.802 to 1.298) | 0.872 | 0.943 (0.707 to 1.256) | 0.687 |
| CV events | 78 | 29 | 1.054 (0.807 to 1.376) | 0.701 | 0.982 (0.717 to 1.346) | 0.911 | |
| Kynurenic acid (µmol/L) | All-cause mortality | 80 | 35 | 0.879 (0.638 to 1.210) | 0.429 | 1.104 (0.666 to 1.829) | 0.702 |
| CV events | 79 | 29 | 0.876 (0.622 to 1.235) | 0.876 | 1.333 (0.798 to 2.226) | 0.272 | |
| Indoxyl sulfate (µmol/L) | All-cause mortality | 80 | 35 | 1.001 (0.995 to 1.006) | 0.837 | 1.002 (0.995 to 1.009) | 0.617 |
| CV events | 79 | 29 | 1.003 (0.998 to 1.008) | 0.290 | 1.007 (1.000 to 1.015) | 0.056 | |
| Indole-3-acetic acid (µmol/L) | All-cause mortality | 60 | 24 | 1.190 (0.609 to 2.323) | 0.610 | 1.346 (0.568 to 3.192) | 0.500 |
| CV events | 59 | 20 | 1.002 (0.493 to 2.039) | 0.995 | 1.434 (0.535 to 3.847) | 0.474 | |
| p-Cresyl sulfate (µmol/L) | All-cause mortality | 80 | 35 | 0.955 (0.670 to 1.362) | 0.801 | 0.897 (0.614 to 1.310) | 0.574 |
| CV events | 79 | 29 | 0.960 (0.664 to 1.389) | 0.829 | 1.036 (0.667 to 1.611) | 0.874 | |
| p-Cresyl glucuronide (µmol/L) | All-cause mortality | 80 | 35 | 0.992 (0.767 to 1.283) | 0.952 | 1.024 (0.782 to 1.340) | 0.864 |
| CV events | 79 | 29 | 1.032 (0.775 to 1.374) | 0.830 | 1.189 (0.863 to 1.636) | 0.289 | |
| Hippuric acid (µmol/L) | All-cause mortality | 78 | 33 | 1.037 (0.688 to 1.562) | 0.862 | 0.966 (0.569 to 1.642) | 0.900 |
| CV events | 77 | 28 | 0.722 (0.457 to 1.142) | 0.164 | 0.823 (0.445 to 1.524) | 0.536 | |
| Kyn | KA | IS | IAA | pCG | pCS | HA | |
|---|---|---|---|---|---|---|---|
| OAT affinity [1,36]* | - | ++++ | ++ | + | -- | +/- | +++ |
| Molecular weight (g/mol) [41] | 208.21 | 189.17 | 213.21 | 175.18 | 284.26 | 188.2 | 179.17 |
| Protein binding (%) [42,43,44] | 67 | 95 | 87-98 | 53-69 | 12-13 | 95 | 39-41 |
| Water solubility (mg/L) [41] | 1.67 | 0.95 | 0.79 | 1.38 | 24 | 1.58 | 1.18 |
| pKa [41] | 1.2 | 3.2 | −1.8 | 4.7 | 3.3 | −2.0 | 3.6 |
© 2020 by the authors. Licensee MDPI, Basel, Switzerland. This article is an open access article distributed under the terms and conditions of the Creative Commons Attribution (CC BY) license (http://creativecommons.org/licenses/by/4.0/).
Share and Cite
van Gelder, M.K.; Middel, I.R.; Vernooij, R.W.M.; Bots, M.L.; Verhaar, M.C.; Masereeuw, R.; Grooteman, M.P.; Nubé, M.J.; van den Dorpel, M.A.; Blankestijn, P.J.; et al. Protein-Bound Uremic Toxins in Hemodialysis Patients Relate to Residual Kidney Function, Are Not Influenced by Convective Transport, and Do Not Relate to Outcome. Toxins 2020, 12, 234. https://doi.org/10.3390/toxins12040234
van Gelder MK, Middel IR, Vernooij RWM, Bots ML, Verhaar MC, Masereeuw R, Grooteman MP, Nubé MJ, van den Dorpel MA, Blankestijn PJ, et al. Protein-Bound Uremic Toxins in Hemodialysis Patients Relate to Residual Kidney Function, Are Not Influenced by Convective Transport, and Do Not Relate to Outcome. Toxins. 2020; 12(4):234. https://doi.org/10.3390/toxins12040234
Chicago/Turabian Stylevan Gelder, Maaike K., Igor R. Middel, Robin W. M. Vernooij, Michiel L. Bots, Marianne C. Verhaar, Rosalinde Masereeuw, Muriel P. Grooteman, Menso J. Nubé, M. A. van den Dorpel, Peter J. Blankestijn, and et al. 2020. "Protein-Bound Uremic Toxins in Hemodialysis Patients Relate to Residual Kidney Function, Are Not Influenced by Convective Transport, and Do Not Relate to Outcome" Toxins 12, no. 4: 234. https://doi.org/10.3390/toxins12040234
APA Stylevan Gelder, M. K., Middel, I. R., Vernooij, R. W. M., Bots, M. L., Verhaar, M. C., Masereeuw, R., Grooteman, M. P., Nubé, M. J., van den Dorpel, M. A., Blankestijn, P. J., Rookmaaker, M. B., & Gerritsen, K. G. F. (2020). Protein-Bound Uremic Toxins in Hemodialysis Patients Relate to Residual Kidney Function, Are Not Influenced by Convective Transport, and Do Not Relate to Outcome. Toxins, 12(4), 234. https://doi.org/10.3390/toxins12040234