Mycotoxins at the Start of the Food Chain in Costa Rica: Analysis of Six Fusarium Toxins and Ochratoxin A between 2013 and 2017 in Animal Feed and Aflatoxin M1 in Dairy Products

 and
and
Abstract
1. Introduction
2. Results
2.1. Fusarium Toxins Present in Animal Feed
2.2. Mycotoxin Prevalence in Feed Ingredients
2.3. Mycotoxin Prevalence in Compound Feed
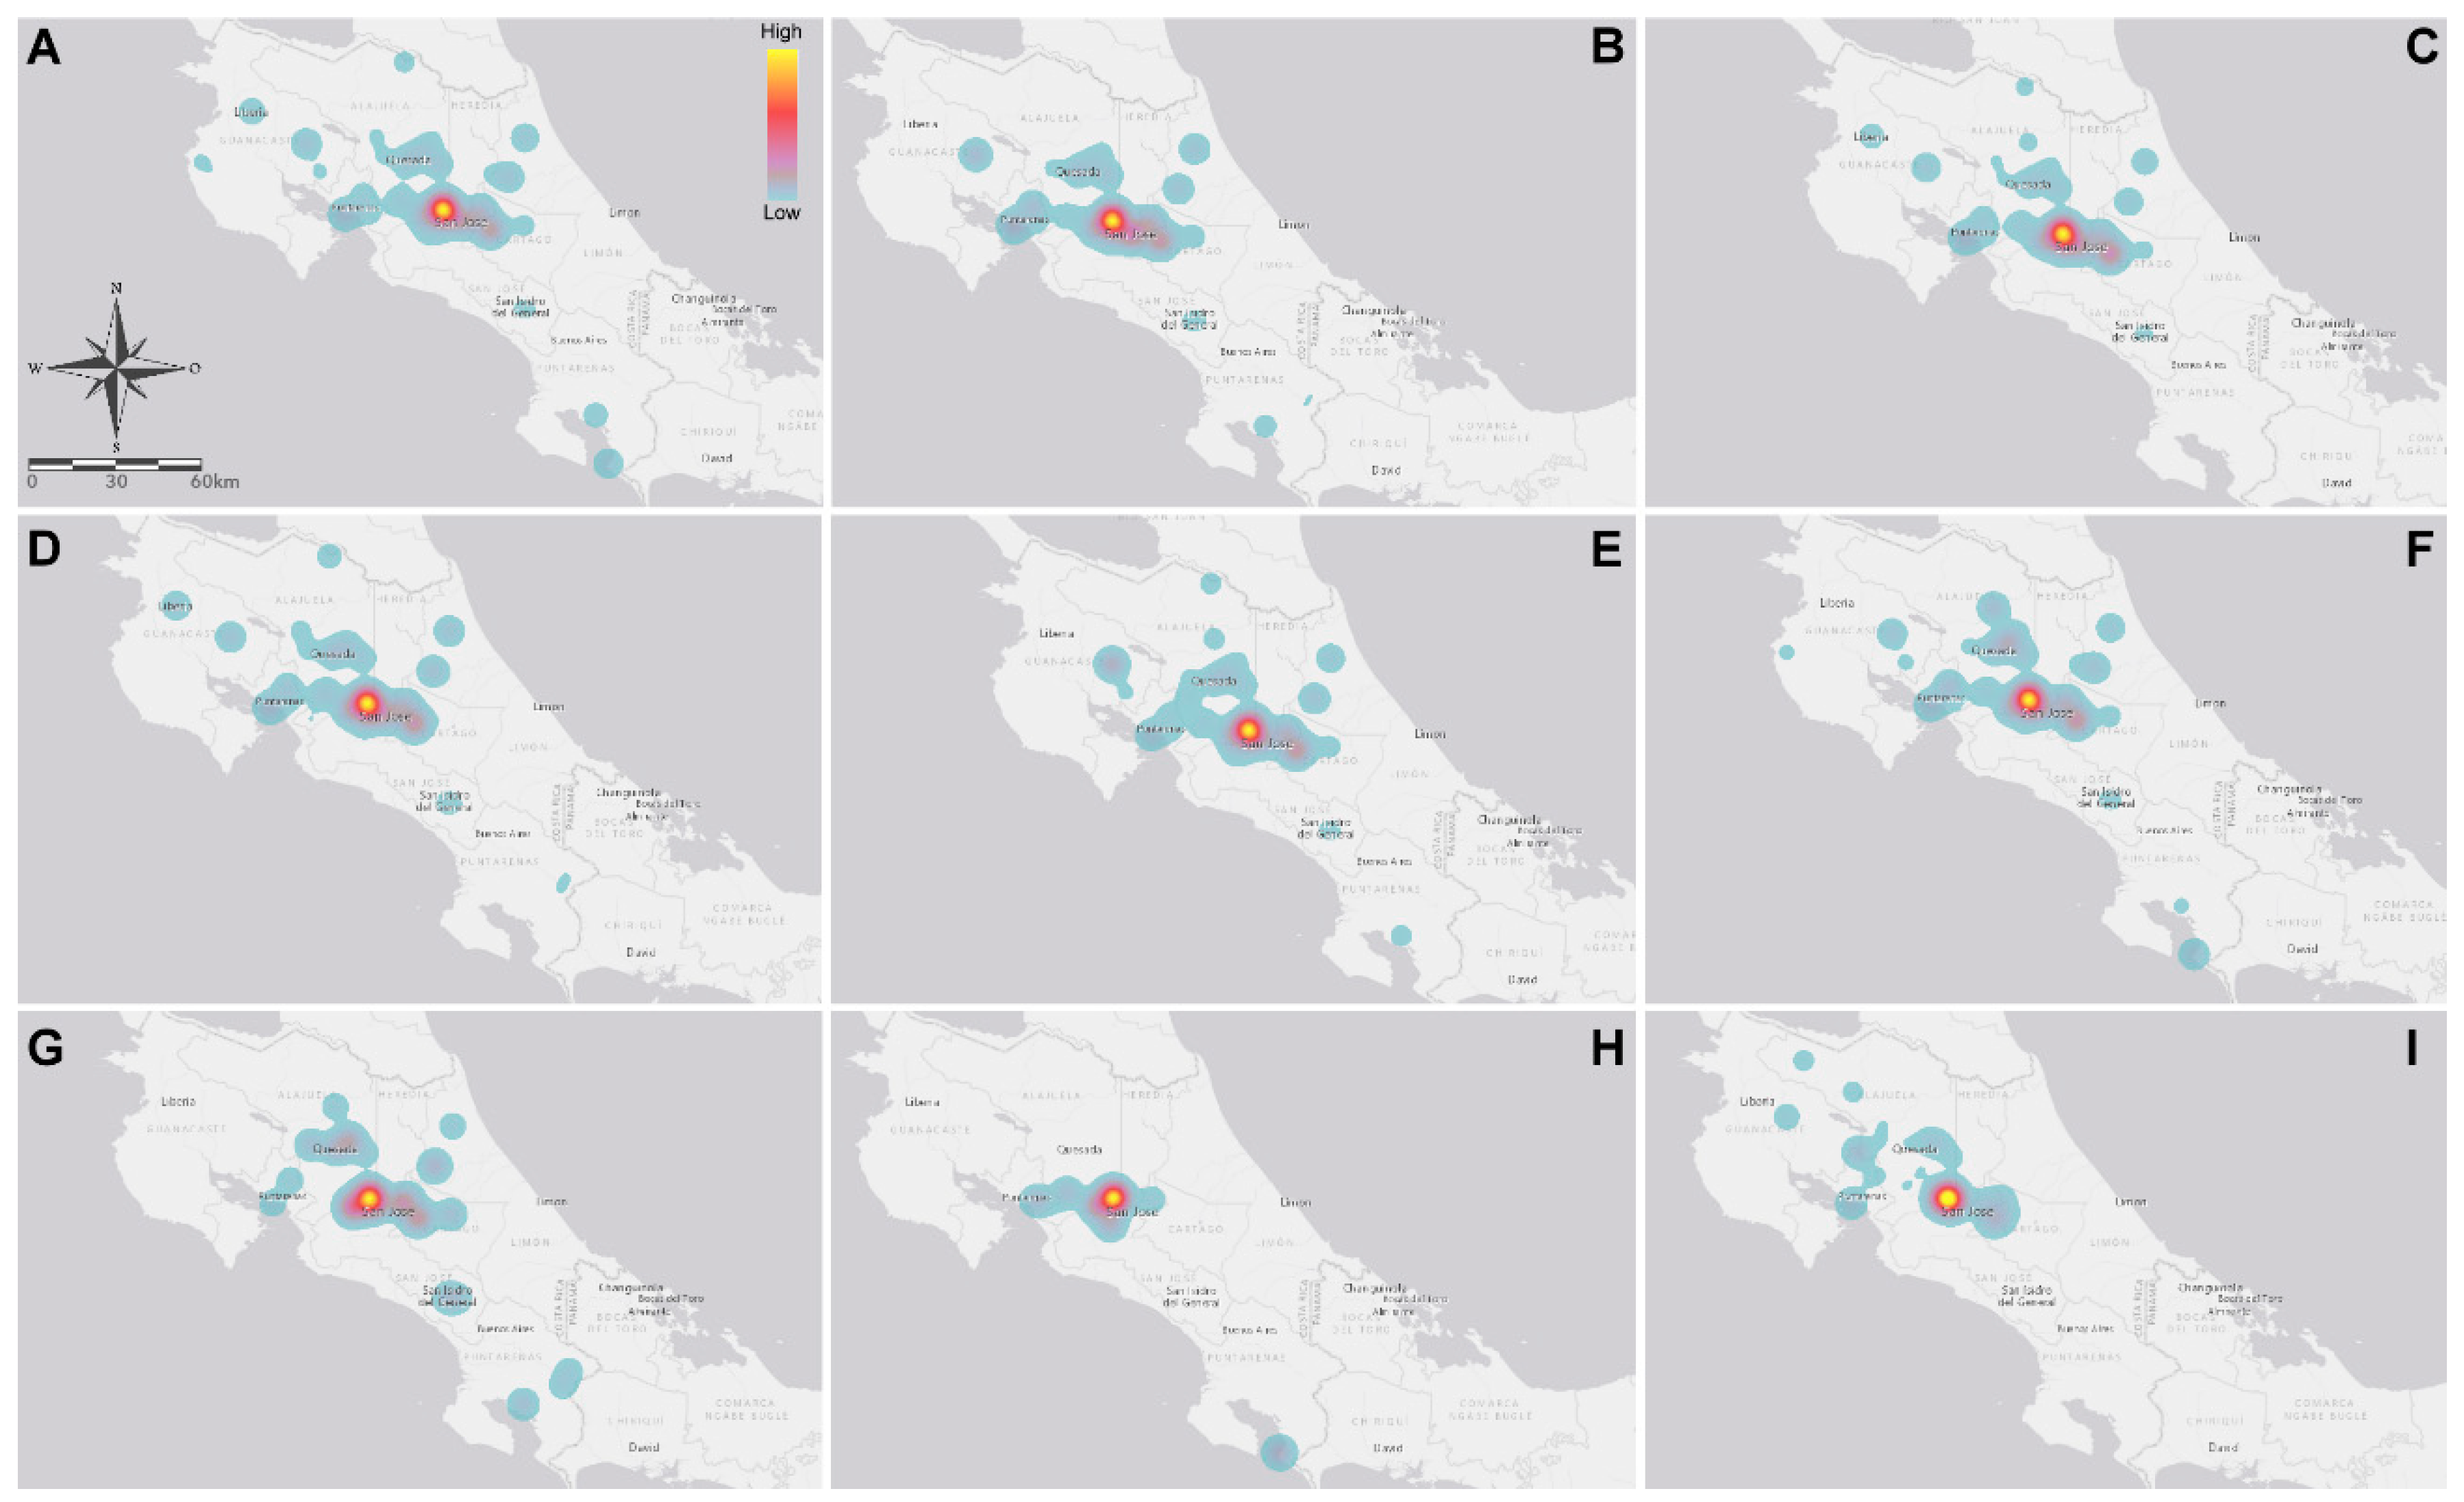
2.4. Geographical Distribution and Climate Influence for Fusarium Toxins Present in Animal Feed
2.5. OTA Prevalence in Animal Feeds
2.6. Aflatoxin M1 in Liquid Milk
3. Discussion
3.1. Mycotoxin Prevalence between 2013 and 2017 in Animal Feed
3.2. Mycotoxin Prevalence in Compound Feed and Feed Ingredients
3.2.1. Prevalence in Feed Ingredients
3.2.2. Prevalence in Cattle Feeds
3.2.3. Prevalence in Compound Feed destined for Poultry and Swine
3.2.4. Prevalence in Pet Food
3.2.5. Prevalence in Fish Feed
3.3. Geographical Distribution and Climate Influence for Fusarium Toxins Present in Animal Feed
3.4. Aflatoxin M1 in Liquid Milk
4. Conclusions
5. Materials and Methods
5.1. Reagents
5.2. Sampling
5.3. Reference Methods for Toxin Determination
5.4. Chromatographic System and Conditions
5.4.1. DON/3-ADON
5.4.2. T-2 and HT-2 Toxin
5.4.3. ZEA
5.4.4. FB1 and FB2
5.4.5. OTA
5.4.6. AFM1 in Milk and Butter
5.5. Data Analysis
Author Contributions
Funding
Acknowledgments
Conflicts of Interest
Appendix A

| Matrix | Indicative Levels for the Sum of T-2 and HT-2 (µg kg−1) from Which Onwards/above Which Investigations Should be Performed, Certainly in Case of Repetitive Findings |
|---|---|
| Unprocessed Cereals | |
| Barley (including malting barley) and maize | 200 |
| Oats (with husk) | 1000 |
| Wheat, rye and other cereals | 100 |
| Cereal Products for Feed and Compound Feed | |
| Oat milling products (husks) | 2000 |
| Other cereal products | 500 |
| Compound feed with the exception of feed for cats | 250 |
| Mycotoxin | Products Intended for Animal Feed | Guidance Value in mg kg−1 Relative to a Feedstuff with a Moisture Content of 12 g/100 g |
|---|---|---|
| Deoxynivalenol | Feed materials | |
| Cereals and cereal products with the exception | 8 | |
| Cereals and cereal products with the exception | 12 | |
| Compound feed (exception of compound feed for pigs, calves (<4 months), lambs, kids and dogs) | 5 | |
| Compound feed for pigs | 0.9 | |
| Compound feed for calves (<4 months), lambs, kids and dogs | 2 | |
| Zearalenone | Feed materials | |
| Cereals and cereal products with the exception of maize byproducts | 2 | |
| Maize byproducts | 3 | |
| Compound feed for: | ||
| Piglets, gilts (young sows), puppies, kittens, dogs and cats for reproduction | 0.1 | |
| Adult dogs and cats other than for reproduction | 0.2 | |
| Sows and fattening pigs | 0.25 | |
| Calves, dairy cattle, sheep (including lamb) and goats (kids) | 0.5 | |
| Ochratoxin A | Feed materials | |
| Cereals and cereal products | 0.25 | |
| Compound feed for | ||
| Pigs | 0.05 | |
| Poultry | 0.1 | |
| Cats and dogs | 0.01 | |
| Fumonisin FB1 + FB2 | Feed materials | |
| Maize and maize products | 60 | |
| Compound feed for | ||
| Pigs, horses (Equidae), rabbits and pet animals | 5 | |
| Fish | ||
| Poultry, calves (<4 months), lambs and kids | 20 | |
| Adult ruminants (> 4 months) and mink | 50 | |
| T2 + HT-2 | Compound Feed for Cats | 0.05 |
References
- Tola, M.; Kebede, B. Occurrence, Importance and Control of Mycotoxins: A Review. Cogent Food Agric. 2016. [Google Scholar] [CrossRef]
- Lee, H.J.; Ryu, D. Worldwide occurrence of mycotoxins in cereals and cereal derived food products: Public Health Perspectives of their Co-occurrence. J. Agric. Food Chem. 2017, 65, 7034–7051. [Google Scholar] [CrossRef] [PubMed]
- Arcella, D.; Gergelova, P.; Innocenti, M.L.; Steinkellner, H. Human and animal dietary exposure to T-2 and HT-2. EFSA J. 2017, 15, 4972. [Google Scholar]
- Chen, S.S.; Li, Y.-H.; Lin, M.-F. Chronic Exposure to the Fusarium Mycotoxin Deoxynivalenol: Impact on Performance, Immune Organ, and Intestinal Integrity of Slow-Growing Chickens. Toxins 2017, 9, 334. [Google Scholar] [CrossRef] [PubMed]
- Zhang, Y.; Han, J.; Zhu, C.-C.; Tang, F.; Cui, X.-S.; Kim, N.-H. Exposure to HT-2 toxins causes oxidative stress-induced apoptosis/autophagy in porcine oocytes. Sci. Rep. 2016, 6, 33904. [Google Scholar] [CrossRef]
- Ismail, Z.; Basha, E.A.; Al-Nabulsi, F. Mycotoxins in animal feed, hazardous to both animals and human health. J. Vet. Med. Res. 2018, 5, 1145. [Google Scholar]
- Bertero, A.; Moretti, A.; Spicer, L.J.; Caloni, F. Fusarium Molds and Mycotoxins: Potential Species-Specific Effects. Toxins 2018, 10, 244. [Google Scholar] [CrossRef] [PubMed]
- Kinoshita, A.; Keese, C.; Meyer, U.; Starke, A.; Wrenzycki, C.; Dänicke, S.; Rehage, J. Chronic Effects of Fusarium Mycotoxins in rations with or without Increased Concentrate Proportion on the Insulin Sensitivity in Lactating Dairy Cows. Toxins 2018, 10, 188. [Google Scholar] [CrossRef] [PubMed]
- Ashiq, S. Natural Occurrence of Mycotoxins in Food and Feed: Pakistan Perspective. Compr. Rev. Food Sci. Food Saf. 2015, 14, 159–175. [Google Scholar] [CrossRef]
- Antonissen, G.; Van Immerseel, F.; Pasmans, F.; Ducatelle, R.; Haesebrouck, F.; Timbermont, L.; Verlinden, M.; Janssens, G.P.J.; Eeckhaut, V.; Eekhpout, M.; et al. The mycotoxin deoxynivalenol predisposes for the development of Clostridium perfringens-induced necrotic enteritis in broiler chickens. PLoS ONE 2014, 9, e108775. [Google Scholar] [CrossRef] [PubMed]
- Streit, E.; Schatzmayr, G.; Tassis, P.; Tzika, E.; Marin, D.; Taranu, I.; Tabuc, C.; Nicoau, A.; Aprodu, I.; Puel, O.; et al. Current Situation of Mycotoxin Contamination and Co-occurrence in Animal Feed-Focus on Europe. Toxins 2012, 4, 788–809. [Google Scholar] [CrossRef] [PubMed]
- Greco, M.; Pardo, A.; Pose, G. Mycotoxigenic Fungi and Natural Co-Occurrence of Mycotoxins in Rainbow Trout (Oncorhynchus mykiss) Feeds. Toxins 2015, 7, 4595–4609. [Google Scholar] [CrossRef] [PubMed]
- Ismaeil, A.A.; Papenbrock, J. Mycotoxins: Producing Fungi and Mechanisms of Phytotoxicity. Agriculture 2015, 5, 492–537. [Google Scholar] [CrossRef]
- Rostagno, H.; Teixeira, L.; Hannas, M.; Lopes, J.; Kazue, N.; Perazzo, F.; Saraiva, A.; Teixeira de Abreu, M.; Borges, P.; Flávia De Oliveira, R.; et al. Tablas Brasileñas Para aves y Cerdos, 4th ed.; Universidad Federal de Viçosa, Departamento de Zootecnia: Viçosa, Brasil, 2017; pp. 28–256. [Google Scholar]
- De Blass, C.; Mateos, G.G.; García-Rebollar, P. Tablas FEDNA de Composición y Valor Nutritivo de Alimentos Para la Fabricación de Piensos Compuestos, 3rd ed.; Fundación Española para el Desarrollo de la Nutrición Animal: Madrid, Spain, 2010; Available online: http://www.fundacionfedna.org/ingredientes-para-piensos (accessed on 4 February 2019).
- SEPSA [Secretaría Ejecutiva de Planificación Agropecuaria]. Informe de Comercio Exterior del Sector Agropecuario 2016–2017. 2018. Available online: http://www.sepsa.go.cr/docs/2018-004-Informe_Comercio_Exterior_Sector_Agropecuario_2016-2017.pdf (accessed on 4 February 2019).
- Chacón, M. Evolución del Cultivo de Maíz en Costa Rica. Oficina Nacional de Semillas, 2017. Available online: http://ofinase.go.cr/certificacion-de-semillas/certificacion-de-semillas-de-maiz/evolucion-cultivo-maiz/ (accessed on 4 February 2019).
- CIAB [Cámara de Industriales de Alimentos Balanceados]. Situación Actual de Alimentos Balanceados—Informe Anual. 2018. Available online: https://www.ciabcr.com/charlas/Nutrici%C3%B3n%20Animal%202018/Charlas/Carl_Oroz.pdf (accessed on 4 February 2019).
- Karlovsky, P.; Suman, M.; Berthiller, F.; De Meester, J.; Eisenbrand, G.; Perrin, I.; Oswald, I.P.; Speijers, G.; Chiodini, A.; Recker, T.; et al. Impact of food processing and detoxification treatments on mycotoxin contamination. Mycotoxin Res. 2016, 32, 179. [Google Scholar] [CrossRef] [PubMed]
- Ma, R.; Zhang, L.; Su, Y.-T.; Xie, W.-M.; Zhang, N.-Y.; Dai, J.-F.; Wang, Y.; Rajput, S.A.; Qi, D.-S.; Karrow, N.A.; et al. Individual and Combined Occurrence of Mycotoxins in Feed Ingredients and Complete Feeds in China. Toxins 2018, 10, 113. [Google Scholar] [CrossRef] [PubMed]
- Chagwa, R.; Abia, W.; Msagati, T.; Nyoni, H.; Ndleve, K.; Njobeh, P. Multi-Mycotoxin Occurrence in Dairy Cattle Feeds from the Gauteng Province of South Africa: A Pilot Study Using UHPLC-QTOF-MS/MS. Toxins 2018, 10, 294. [Google Scholar] [CrossRef] [PubMed]
- Franco, L.T.; Petta, T.; Rottinghaus, G.E.; Bordin, K.; Gomes, G.A.; Oliveira, C.A.F. Co-occurrence of mycotoxins in maize food and maize-based feed from small-scale farms in Brazil: A pilot study. Mycotoxin Res. 2018. [Google Scholar] [CrossRef]
- Ul Hassan, Z.; Al Thani, R.; Atia, F.A.; Al Meer, S.; Migheli, Q.; Jaoua, S. Co-occurrence of mycotoxins in commercial formula milk and cereal-based baby food in Qatar. Food Addit. Contam. Part B 2018, 11, 191–197. [Google Scholar] [CrossRef] [PubMed]
- Bozzo, G.; Bonerba, E.; Ceci, E.; Valeriana, C.; Tantillo, G. Determination of ochratoxin A in eggs and target tissues of experimentally drugged hens using HPLC–FLD. Food Chem. 2011, 126, 1278–1282. [Google Scholar]
- Payros, D.; Alassane-Kpembi, I.; Pierron, A.; Loiseau, N.; Pinton, P.; Oswald, I.P. Toxicology for deoxynivalenol and its acetylated and modified forms. Arch. Toxicol. 2016, 90, 2931–2957. [Google Scholar] [CrossRef]
- Munkvold, G.P.; Arias, S.; Taschl, I.; Gruber-Dorninger, C. Chapter 9: Mycotoxin in Corn: Occurrence, Impacts and Management. In Corn; AACC International Press: St. Paul, MN, USA, 2019; pp. 235–287. [Google Scholar] [CrossRef]
- Guerre, P. Fusariotoxins in Avian Species: Toxicokinetics, Metabolism, and Persistence in Tissues. Toxins 2015, 7, 2289–2305. [Google Scholar] [CrossRef] [PubMed]
- Alshannaq, A.; Yu, J.H. Occurrence, Toxicity, and Analysis of Major Mycotoxins in Food. Int. J. Envron. Res. Public Health 2017, 14, 632. [Google Scholar] [CrossRef] [PubMed]
- Krska, R.; Sulyok, M.; Berthiller, F.; Schuhmacher, R. Mycotoxin testing: From Multi toxin analysis to metabolomics. JSM Mycotoxins 2017, 67, 11–16. [Google Scholar] [CrossRef]
- Van der Fels-Klerx, H.J.; Adamse, P.; Punt, A.; van Asselt, E.D. Data analyses and modeling for risk-based monitoring of mycotoxins in animal feed. Toxins 2018, 10, 54. [Google Scholar] [CrossRef] [PubMed]
- Streit, E.; Naehrer, K.; Rodrigues, I.; Schatzmayr, G. Mycotoxin occurrence in feed and feed raw materials worldwide: Long-term analysis with special focus on Europe and Asia. J. Sci. Food Agric. 2013, 93, 2892–2899. [Google Scholar] [CrossRef]
- Pinotti, L.; Ottoboni, M.; Giormini, C.; Dell’Orto, V.; Cheli, F. Mycotoxin Contamination in the EU Feed Supply Chain: A Focus on Cereal Byproducts. Toxins 2016, 8, 45. [Google Scholar] [CrossRef]
- Rodrigues, I.; Naehrer, K. A Thre-Year Survey on the Worldwide Occurrence of mycotoxins in feedstuff and feed. Toxins 2012, 4, 663–675. [Google Scholar] [CrossRef]
- Selvaraj, J.N.; Wang, Y.; Zhou, L.; Zhao, Y.; Xing, F.; Dai, X.; Liu, Y. Recent mycotoxin survey data and advanced mycotoxin detection techniques reported from China: A review. Food Addit. Contam. Part A 2015, 32, 440–452. [Google Scholar] [CrossRef]
- Granados-Chinchilla, F.; Molina, A.; Chavarría, G.; Alfaro-Cascante, M.; Bogantes, D.; Murillo-Williams, A. Aflatoxins occurrence through the food chain in Costa Rica: Applying the One Health approach to mycotoxin surveillance. Food Control 2017, 82, 217–226. [Google Scholar] [CrossRef]
- Chavarría, G.; Granados-Chinchilla, F.; Alfaro-Cascante, M.; Molina, A. Detection of Aflatoxin Mn milk, cheese and sour cream samples from Costa Rica using enzyme-assisted extraction and HPLC. Food Addit. Contam. Part B 2015, 8, 128–135. [Google Scholar] [CrossRef]
- EU Commission Recommendations (2006/576/EC) of 17 August 2006 on the presence of deoxynivalenol, zearalenone, ochratoxin A, T-2 and HT-2 and fumonisins in products intended for animal feeding. Off. J. Eur. Union 2016, 229, 7–9.
- EU Commission Recommendations (2013/165/EU) of March 2013 on the presence of T-2 and HT-2 toxin in cereals and cereal products. Off. J. Eur. Union 2013, 91, 12–15.
- FAO (Food and Agriculture Organization of the United Nations). Aquaculture Feed and Fertilizer Resources Information System. 2018. Available online: http://www.fao.org/fishery/affris/species-profiles/nile-tilapia/tables/en/ (accessed on 19 July 2018).
- INRA. Equine Nutrition, 1st ed.; Wageningen Academic Publishers: Wageningen, The Netherlands, 2015; pp. 97–120. [Google Scholar]
- FEDIAF. Nutritional Guidelines for Complete and Complementary Pet Food for Cats and Dog; FEDIAF: Brussels, Belgium, 2016; pp. 1–102. [Google Scholar]
- Martínez Marín, A.L. Inclusion of feeds in pelleted concentrates intended for stall-fed leisure horses. Arch. Zootec 2008, 57, 115–122. [Google Scholar]
- Milani, J.M. Ecological conditions affecting mycotoxin production in cereals: A review. Vet. Med. 2013, 58, 405–411. [Google Scholar] [CrossRef]
- Wu, L.; Qiu, L.; Zhang, H.; Sun, J.; Hu, X.; Wang, B. Optimization for the Production of Deoxynivalenol and Zearalenone by Fusarium graminearum Using Response Surface Methodology. Toxins 2017, 9, 57. [Google Scholar] [CrossRef] [PubMed]
- CODEX. Code of Practice for the Prevention and Reduction of Mycotoxin Contamination in Cereals; CAC/RCP 51-2003; CODEX: Rome, Italy, 2014. [Google Scholar]
- Pettersson, H. Mycotoxin contamination of animal feed. In Woodhead Publishing Series in Food Science, Technology and Nutrition, Animal Feed Contamination; Fink-Gremmels, J., Ed.; Woodhead Publishing: Cambridge, UK, 2012; ISBN 9781845697259. [Google Scholar] [CrossRef]
- Leiva, A.; Granados-Chinchilla, F.; Redondo-Solano, M.; Arrieta-González, M.; Pineda Salazar, E.; Molina, A. Characterization of the animal by-product meal industry in Costa Rica: Manufacturing practices through the production chain and food safety. Poult. Sci. 2018, 97, 2159–2169. [Google Scholar] [CrossRef] [PubMed]
- U.S. Grains Council. 2017/2018 Corn Harvest Quality Report 2018. Available online: https://grains.org/corn_report/corn-harvest-quality-report-2017-2018/ (accessed on 4 February 2019).
- Xie, S.; Zheng, L.; Wan, M.; Niu, J.; Liu, Y.; Tian, L. Effect of deoxynivalenol on growth performance, histological morphology, anti-oxidative ability and immune response of juvenile Pacific white shrimp, Litopenaeus vannamei. Fish Shellfish Immunol. 2018, 82, 442–452. [Google Scholar] [CrossRef]
- Di Stefano, V. Occurrence & Risk of OTA Food and Feed in Food and Feed. Ref. Modul. Food Sci. 2018. [Google Scholar] [CrossRef]
- INEC (Instituto Nacional de Estadística y Censos). Encuesta Nacional Agropecuaria 2017: Resultados Generales de las Actividades Ganaderas Vacuna y Porcina. 2019. Available online: http://www.inec.go.cr/multimedia/encuesta-nacional-agropecuaria-2017-datos-de-la-ganaderia-vacuna-y-porcina (accessed on 4 February 2019).
- Charmley, E.; Trenholm, H.L.; Thompson, B.K.; Vudathala, D.; Nicholson, J.W.G.; Prelusky, B.D.; Charmley, L.L. Influence of level of deoxynivalenol in the diet of dairy cows on feed intake, milk production, and its composition. J. Dairy Sci. 1993, 76, 3580–3587. [Google Scholar] [CrossRef]
- CAST. Mycotoxins: Risks in Plant, Animal, and Human Systems. Council for Agricultural Science and Technology; CAST: Ames, IA, USA, 2003; pp. 1–217. [Google Scholar]
- Focht Müller, L.K.; Paiano, D.; Gugel, J.; Lorenzetti, W.R.; Morais Santurio, J.; de Castro Tavernari, F.; Micotti da Gloria, E.; Baldissera, M.D.; Da Silva, A.S. Post-weaning piglets fed with different levels of fungal mycotoxins and spray-dried porcine plasma have improved weight gain, feed intake and reduced diarrhea incidence. Microb. Pathog. 2018, 117, 259–264. [Google Scholar] [CrossRef]
- Dänicke, S.; Winkler, J. Invited review: Diagnosis of zearalenone (ZEN) exposure of farm animals and transfer of its residues into edible tissues (carry over). Food Chem. Toxicol. 2015, 84, 225–249. [Google Scholar] [CrossRef] [PubMed]
- Wang, A.; Hogan, N.S. Performance effects of feed-borne Fusarium mycotoxins on broiler chickens: Influences of timing and duration of exposure. Anim. Nutr. 2018, 5, 32–40. [Google Scholar] [CrossRef] [PubMed]
- Boermans, H.J.; Leung, M.C.K. Mycotoxins and the pet food industry: Toxicological evidence and risk assessment. Int. J. Food Microbiol. 2007, 119, 95–102. [Google Scholar] [CrossRef] [PubMed]
- Gazzotti, T.; Biagi, G.; Pagliuca, G.; Pinna, C.; Scardilli, M.; Grandi, M.; Zaghini, G. Occurrence of mycotoxins in extrude commercial dog food. Anim. Feed Sci. Technol. 2015, 202, 81–89. [Google Scholar] [CrossRef]
- Atungulu, G.G.; Mohammadi-Shad, Z.; Wilson, S. Chapter 2—Mycotoxin Issues in Pet. In Food and Feed Safety Systems and Analysis; Academic Press: Cambridge, MA, USA, 2018; pp. 25–44. [Google Scholar]
- García-Herranz, V.; Valdehita, A.; Navvas, J.M.; Fernández-Cruz, M.L. Cytotoxicity against fish and mammalian cells lines and endocrine activity of the mycotoxins beauvericin, deoxynivalenol and ochratoxin-A. Food Chem. Toxicol. 2019. [Google Scholar] [CrossRef]
- Gonçalves, R.A.; Navarro-Guillén, C.; Gilannejad, N.; Días, J.; Schatzmayr, D.; Bichl, G.; Czabany, T.; Moyano, F.J.; Rema, P.; Yúfera, M.; et al. Impact of deoxynivalenol on rainbow trout: Growth performance, digestibility, key gene expression regulation and metabolism. Aquaculture 2018, 490, 362–372. [Google Scholar] [CrossRef]
- Woźny, M.; Obremski, K.; Hliwa, P.; Gomulka, P.; Rożyński, R.; Wojtacha, P.; Florczyk, M.; Segner, H.; Brzuzan, P. Feed contamination with zearalenone promotes growth but affects the immune system of rainbow trout. Fish Shellfish Immunol. 2019, 84, 680–694. [Google Scholar]
- Ferrigo, D.; Raiola, A.; Causin, R. Fusarium Toxins in Cereals: Occurrence, Legislation, Factors Promoting the Appearance and Their Management. Molecules 2016, 21, 627. [Google Scholar] [CrossRef]
- Shi, W.; Tan, Y.; Wang, S.; Gardiner, D.M.; De Saeger, S.; Liao, Y.; Wang, C.; Fan, Y.; Wang, Z.; Wu, A. Mycotoxigenic Potentials of Fusarium Species in Various Culture Matrices Revealed by Mycotoxin Profiling. Toxins 2017, 9, 6. [Google Scholar] [CrossRef]
- Malir, F.; Ostry, V.; Pfohl-Leszkowicz, A.; Malir, J.; Toman, J. Ochratoxin A: 50 Years of Research. Toxins 2016, 8, 191. [Google Scholar] [CrossRef]
- Li, H.; Xing, L.; Zhang, M.; Wang, J.; Zheng, N. The Toxic Effects of Aflatoxin B1 and Aflatoxin M1 on Kidney through Regulating L-Proline and Downstream Apoptosis. BioMed Res. Int. 2018, 2018, 9074861. [Google Scholar] [CrossRef] [PubMed]
- Becker-Algeri, T.A.; Castagnaro, D.; de Bartoli, K.; de Souza, C.; Drunkler, D.A.; Badiale-Furlong, E. Mycotoxins in Bovine Milk and Dairy Products: A Review. J. Food Sci. 2016, 81, R545–R552. [Google Scholar] [CrossRef] [PubMed]
- Ramírez-Martínez, A.; Camarillo-Hernández, E.; Carvajal-Moreno, M.; Vargas-Ortiz, M.; Wesolek, N.; Del Carmen, G.; Jimenes, R.; García Alvarado, M.A.; Roudot, A.-C.; Salgado Cervantes, M.A.; et al. Assessment of Aflatoxin M1 and M2 exposure risk through Oaxaca cheese consumption in southeastern Mexico. Int. J. Environ. Health Res. 2018, 28, 202–213. [Google Scholar]
- US Jersey. A Quality Heifer. Cornell University, 2008. Available online: https://www.usjersey.com/Portals/0/AJCA/2_Docs/QualityHeiferBrochure.pdf (accessed on 27 February 2019).
- Franklin, S.T.; Amaral-Phillips, D.M.; Jackson, J.A.; Campbell, A.A. Health and performance of Holstein calves that suckled or were hand-fed colostrum and were fed one of three physical forms of starter. J. Dairy Sci. 2003, 86, 2145–2153. [Google Scholar] [CrossRef]
- Scaglioni, P.T.; Becker-Algeri, T.; Drunkler, D.; Badiale-Furlong, E. Aflatoxin B1 and M1 in milk. Anal. Chim. Acta 2014, 829, 68–74. [Google Scholar] [CrossRef] [PubMed]
- Michlig, N.; Signorini, M.; Gaggiotti, M.; Chiericatti, C.; Basílico, J.C.; Repetti, M.R.; Beldomenico, H.R. Risk factors associated with the presence of aflatoxin M1 in raw bulk milk from Argentina. Food Control 2016, 64, 151–156. [Google Scholar] [CrossRef]
- Quevedo-Garza, P.A.; Amador-Espejo, G.G.; Cantú-Martínez, P.C.; Trujillo-Mesa, J.A. Aflatoxin M1 occurrence in fluid milk commercialized in Monterrey, Mexico. J. Food Saf. 2018, 38, e12507. [Google Scholar] [CrossRef]
- Peña-Rodas, O.; Martinez-Lopez, R.; Hernandez-Rauda, R. Occurrence of Aflatoxin M1 in cow milk in El Salvador: Results from a two-year survey. Toxicol. Rep. 2018, 5, 671–678. [Google Scholar] [CrossRef]
- Sibaja, K.V.; Gonçalves, K.D.M.; Garcia, S.D.O.; Feltrin, A.C.P.; Noguiera, W.V.; Badiale-Furlong, E.; Garda-Buffon, J. Aflatoxin M1 and B1 in Colombian milk powder and estimated risk exposure. Food Addit. Contam. Part B 2019, 30, 1–8. [Google Scholar] [CrossRef] [PubMed]
- Iqbal, S.Z.; Jinap, S.; Pirouz, A.A.; Faizal, A.R.A. Aflatoxin M1 in milk and dairy products, occurrence and recent challenges: A review. Trends Food Sci. Technol. 2015, 46, 110–119. [Google Scholar] [CrossRef]
- Yoon, B.R.; Hong, S.-Y.; Cho, S.M.; Lee, K.R.; Kim, M.; Chung, S.H. Aflatoxin M1 levels in dairy products from South Korea determined by high-performance liquid chromatography with fluorescence detection. J. Food Nutr. Res. 2016, 55, 171–180. [Google Scholar]
- Assunçao, R.; Martins, C.; Viegas, S.; Viegas, C.; Jakobsen, L.S.; Pires, S.; Alvito, P. Climate change and the health impact of aflatoxins exposure in Portugal—An overview. Food Addit. Contam. Part A 2018, 35, 1610–1621. [Google Scholar] [CrossRef]
- Bellio, A.; Bianchi, D.M.; Gramaglia, M.; Loria, A.; Nucera, D.; Gallina, S.; Gili, M.; Decastelli, L. Aflatoxin M1 in Cow’s Milk: Method Validation for Milk Sampled in Northern Italy. Toxins 2016, 8, 57. [Google Scholar] [CrossRef] [PubMed]
- Gong, Y.Y.; Watson, S.; Routledge, M.N. Aflatoxin Exposure and Associated Human Health Effects, a Review of Epidemiological Studies. Food Saf. 2016, 4, 14–27. [Google Scholar] [CrossRef]
- Milićević, D.R.; Spirić, D.; Radičević, T.; Velebit, B.; Steganović, S.; Milojević, L.; Janković, S. A review of the current situation of aflatoxin M1 in cow’s milk in Serbia: Risk assessment and regulatory aspects. Food Addit. Contam. Part A 2017, 34, 1617–1631. [Google Scholar] [CrossRef] [PubMed]
- Ahlberg, S.; Grace, D.; Kiarie, G.; Kirino, Y.; Lindahl, J. A Risk Assessment of Aflatoxin M1 Exposure in Low Mid-Income Dairy Consumers in Kenya. Toxins 2018, 10, 348. [Google Scholar] [CrossRef] [PubMed]
- Walte, H.-G.; Schwake-Anduschus, C.; Geisen, R.; Fritsche, J. Afaltoxin: Food chain transference from feed to food. J. Verbr. Lebensm 2016, 11, 295–297. [Google Scholar] [CrossRef]
- Gonçalves, L.; Dalla Rosa, A.; Gonzales, S.L.; Feltes, M.M.C.; Badiale-Furlong, E.; Dors, G.C. Incidence of aflatoxin M1 in fresh milk from small farms. Food Sci. Technol. 2017, 37, 11–15. [Google Scholar]
- Fallah, A.A.; Fazlollahi, R.; Emami, A. Seasonal study of aflatoxin M1 contamination in milk of four dairy species in Yazd, Iran. Food Control 2016, 68, 77–82. [Google Scholar] [CrossRef]
- Cantú-Cornelio, F.; Aguilar-Toalá, J.E.; de León-Rodríguez, C.I.; Esparza-Romero, J.; Vallejo-Córdoba, A.F.; García, H.S.; Hernández-Mendoza, A. Occurrence and factors associated with the presence of aflatoxin M1 in breast milk samples of nursing mothers in central Mexico. Food Control 2016, 62, 16–22. [Google Scholar] [CrossRef]
- Naeimipour, F.; Aghajani, J.; Kojuri, S.A.; Ayoubi, S. Useful Approaches for Reducing Aflatoxin M1 Content in Milk and Dairy Products. Biomed. Biotechnol. Res. J. 2018, 2, 94–99. [Google Scholar]
- Udomkun, P.; Wiredu, A.N.; Nagle, M.; Müller, J.; Vanlauwe, B.; Bandyopadhyay, R. Innovative technologies to manage aflatoxins in foods and feeds and the profitability of application—A review. Food Control 2017, 76, 127–138. [Google Scholar] [CrossRef] [PubMed]
- Association of American Feed Control Officials (AAFCO). Feed Inspector’s Manual, 7th ed.; AAFCO Inspection and Sampling Committee: Atlanta, GA, USA, 2017. [Google Scholar]
- Czerwiecki, L.; Wilczyńska, G. Determination of Deoxynivalenol in cereal by HPLC-UV. Mycotoxin Res. 2003, 19, 31–34. [Google Scholar] [CrossRef]
- Visconti, A.; Lattanzio, V.M.T.; Pascale, M.; Haidukowski, M. Analysis of T-2 and HT-2 toxins in cereal grains by immunoaffinity clean-up and liquid chromatography with fluorescence detection. J. Chromatogr. A 2005, 1075, 151–158. [Google Scholar] [CrossRef] [PubMed]
- Aydemir Atasever, M.; Atasever, M.; Özturan, K.; Urçar, S. Determination of Aflatoxin M1 level in Butter Samples Consumed in Erzurum, Turkey. Kafkas Univ. Vet. Fak. Derg. 2010, 16 (Suppl. A), S159–S162. [Google Scholar]


| Year | Sample Numbers, n | Prevalence (%) (Samples over the Limit of Detection) | Average ± Standard Deviation b | Median b | |||||
|---|---|---|---|---|---|---|---|---|---|
| Concentration Range, µg kg−1 a | Concentration, µg kg−1 | ||||||||
| x < LoD | x < 250 | 250 ≤ x < 500 | 500 ≤ x < 1000 | x ≥ 1000 | |||||
| Zearalenone | |||||||||
| 2013 | 47 | 19 | 27 | 1 | 0 | 0 | 59.6 | 30 ± 80 | 10 |
| 2014 | 57 | 8 | 49 | 0 | 0 | 0 | 86.0 | 15 ± 15 | 11 |
| 2015 | 62 | 44 | 18 | 0 | 0 | 0 | 29.0 | 33 ± 62 | 7 |
| 2016 | 99 | 79 | 12 | 6 | 2 | 0 | 20.0 | 180 ± 225 | 44 |
| 2017 | 61 | 35 | 8 | 9 | 3 | 6 | 42.6 | 1055 ± 1587 | 392 |
| Total | 335 | 194 | 114 | 16 | 5 | 6 | 42.1 | 236 ± 784 | 18 |
| 3-acetyldeoxynivalenol | |||||||||
| 2015 | 67 | 53 | 7 | 3 | 2 | 2 | 20.9 | 1602± 4238 | 251 |
| 2016 | 91 | 74 | 7 | 0 | 3 | 7 | 18.7 | 1691 ± 2757 | 594 |
| 2017 | 54 | 40 | 7 | 3 | 3 | 1 | 25.9 | 400 ± 398 | 275 |
| Deoxynivalenol | |||||||||
| Total | 212 | 167 | 21 | 6 | 8 | 10 | 21.2 | 1261 ± 2909 | 295 |
| 2013 | 40 | 11 | 0 | 7 | 10 | 12 | 72.5 | 10,439 ± 29,521 | 830 |
| 2014 | 87 | 18 | 15 | 32 | 10 | 12 | 79.3 | 966 ± 2442 | 372 |
| 2015 | 81 | 44 | 9 | 11 | 10 | 7 | 45.7 | 703 ± 916 | 467 |
| 2016 | 94 | 54 | 13 | 7 | 7 | 11 | 42.5 | 1150 ± 1888 | 355 |
| 2017 | 61 | 24 | 10 | 13 | 8 | 6 | 60.7 | 4147 ± 18,710 | 400 |
| Total | 363 | 151 | 47 | 70 | 45 | 48 | 58.4 | 2822 ± 13,805 | 439 |
| x < LoD | 5 < x | 10 ≤ x < 25 | 25 ≤ x < 50 | x ≥ 50 | |||||
| Ochratoxin A | |||||||||
| 2013 | 49 | 41 | 8 | 0 | 0 | 0 | 16.3 | 2 ± 2 | 2 |
| 2014 | 101 | 59 | 42 | 0 | 0 | 0 | 41.6 | 1 ± 2 | 1 |
| 2015 | 64 | 15 | 49 | 0 | 0 | 0 | 76.7 | 11 ± 23 | 1 |
| 2016 | 95 | 68 | 26 | 0 | 0 | 1 | 28.4 | 90 ± 346 | 3 |
| 2017 | 50 | 30 | 20 | 0 | 0 | 0 | 40.0 | 32 ± 63 | 5 |
| Total | 360 | 214 | 145 | 0 | 0 | 0 | 40.6 | 25 ± 152 | 1 |
| T-2 toxin | |||||||||
| 2013 | 48 | 23 | 12 | 8 | 1 | 4 | 52.1 | 406 ± 467 | 273 |
| 2014 | 126 | 49 | 56 | 15 | 6 | 0 | 61.1 | 171 ± 227 | 61 |
| 2015 | 91 | 66 | 24 | 0 | 1 | 0 | 27.5 | 39 ± 130 | 9 |
| 2016 | 93 | 77 | 15 | 0 | 0 | 1 | 17.2 | 180 ± 509 | 15 |
| 2017 | 47 | 36 | 11 | 0 | 0 | 0 | 23.4 | 20 ± 18 | 13 |
| Total | 406 | 251 | 119 | 23 | 8 | 5 | 47.0 | 177 ± 317 | 47 |
| HT-2 toxin | |||||||||
| 2014 | 47 | 17 | 16 | 6 | 4 | 4 | 63.8 | 1113 ± 2661 | 217 |
| 2015 | 86 | 66 | 14 | 3 | 2 | 1 | 23.2 | 257 ± 399 | 151 |
| 2016 | 92 | 56 | 29 | 3 | 1 | 3 | 39.1 | 199 ± 359 | 53 |
| 2017 | 44 | 33 | 10 | 1 | 0 | 0 | 25.0 | 108 ± 71 | 103 |
| Total | 269 | 172 | 66 | 13 | 7 | 8 | 36.1 | 463 ± 1495 | 115 |
| x < LoD | x < 1250 | 1250 ≤ x < 2500 | 2500 ≤ x < 5000 | x ≥ 5000 | |||||
| Fumonisin B1 | |||||||||
| 2013 | 31 | 29 | 1 | 0 | 1 | 0 | 6.4 | 1691 ± 2117 | 1670 |
| 2014 | 35 | 27 | 3 | 1 | 2 | 2 | 22.9 | 3814 ± 3793 | 3625 |
| 2015 | 24 | 10 | 6 | 2 | 1 | 5 | 58.3 | 4551 ± 5774 | 3865 |
| 2016 | 88 | 54 | 13 | 5 | 4 | 12 | 38.6 | 3468.48 ± 7159 | 740 |
| 2017 | 59 | 43 | 11 | 2 | 3 | 0 | 27.1 | 203.64 ± 48 | 230 |
| Total | 237 | 163 | 34 | 10 | 11 | 19 | 31.2 | 3390 ± 5505 | 3110 |
| Fumonisin B2 | |||||||||
| 2014 | 8 | 0 | 4 | 0 | 0 | 4 | 100.0 | 2794 ± 2252 | 2830 |
| 2015 | 11 | 1 | 3 | 2 | 2 | 3 | 90.9 | 6635 ± 9404 | 2010 |
| 2016 | 33 | 21 | 10 | 0 | 0 | 2 | 36.4 | 9931 ± 18,380 | 1793 |
| 2017 | 29 | 24 | 5 | 0 | 0 | 0 | 17.2 | 866 ± 1131 | 175 |
| Total | 81 | 46 | 22 | 2 | 2 | 9 | 43.2 | 6353 ± 13,559 | 1560 |
| Average ± Standard Deviation | Median | Sample Numbers above Guidance Value, n | Prevalence, % (Sample Totals Analyzed by Toxin) c |
|---|---|---|---|
| Concentration, µg kg−1 | |||
| Corn and Byproducts | |||
| Deoxynivalenol (12,000 µg kg−1)b | |||
| 650 ± 346 | 440 | 0 | 61.1 (36) |
| Fumonisin B1 (60,000 µg kg−1 sum FB1/FB2)b | |||
| 18,280 ± 16,016 | 3230 | 0 | 35.9 (39) |
| HT-2 toxin (500 µg kg−1 sum T-2/HT-2)b | |||
| 493 ± 927 | 84 | 3 | 62.6 (24) |
| Ochratoxin A (250 µg kg−1)b | |||
| 18 ± 45 | 1 | 0 | 25.6 (39) |
| T-2 toxin | |||
| 195 ± 256 | 53 | 3 | 55.7 (61) |
| Zearalenone (3000 µg kg−1)b | |||
| 314 ± 895 | 15 | 2 | 71.1 (45) |
| Soybean Meal (there is no recommended Guidelines) b | |||
| Deoxynivalenol | |||
| 188 ± 69 | 200 | Not applicable | 60.0 (5) |
| Fumonisin B1 | |||
| 3045 ± 1096 | 3045 | Not applicable | 100.0 (2) |
| HT-2 toxin | |||
| 5013 ± 6542 | 2140 | Not applicable | 50.0 (6) |
| T-2 toxin | |||
| 120 ± 141 | 50 | Not applicable | 61.5 (13) |
| Wheat and Byproducts | |||
| Deoxynivalenol (8000 µg kg−1)b | |||
| 20,290 ± 52,867 | 890 | 1 | 100.0 (8) |
| Fumonisin B1 (60,000 µg kg−1 sum FB1/FB2)b | |||
| 2050 ± 2234 | 576 | 0 | 50.0 (4) |
| HT-2 toxin (500 µg kg−1 sum T-2/HT-2)b | |||
| 44 ± 50 | 65 | 0 | 66.7 (3) |
| Ochratoxin A (250 µg kg−1)b | |||
| 2 ± 2 | 1 | 0 | 50.0 (4) |
| T-2 toxin | |||
| 64 ± 61 | 54 | 0 | 75.0 (8) |
| Zearalenone (2000 µg kg−1)b | |||
| 12 ± 14 | 5 | 0 | 28.6 (7) |
| Rice and Byproducts | |||
| 3-acetyldeoxynivalenol (there is no recommended guideline)c | |||
| 351 ± 79 | 351 | Not applicable | 50.0 (4) |
| Deoxynivalenol (8000 µg kg−1)b | |||
| 890 ± 400 | 1101 | 0 | 60.0 (5) |
| Palm Oil and Byproducts (there is no recommended guidelines) b | |||
| Deoxynivalenol | |||
| 400 ± 359 | 286 | Not applicable | 55.6 (18) |
| T-2 toxin | |||
| 330 ± 625 | 58 | Not applicable | 61.5 (13) |
| Zearalenone | |||
| 19 ± 18 | 13 | Not applicable | 30.0 (10) |
| Fruit Pulps and Peels (there is no recommended guidelines) b | |||
| 3-acetyldeoxynivalenol | |||
| 2204 ± 2394 | 2104 | Not applicable | 40.0 (10) |
| Deoxynivalenol | |||
| 21,249 ± 41,315 | 2160 | Not applicable | 50.0 (14) |
| Fumonisin B1 | |||
| 16,564 ± 18,916 | 7010 | Not applicable | 34.7 (32) |
| Fumonisin B2 | |||
| 10,100 ± 13,096 | 16,564 | Not applicable | 50.0 (4) |
| Ochratoxin A | |||
| 4 ± 7 | 1 | Not applicable | 50.0 (12) |
| T-2 toxin | |||
| 330 ± 464 | 50 | Not applicable | 13.3 (15) |
| Zearalenone | |||
| 43 ± 31 | 21 | Not applicable | 11.8 (17) |
| Forages, Silages, and Hay (there is no recommended guidelines) b | |||
| 3-acetyldeoxynivalenol | |||
| 476 ± 431 | 335 | Not applicable | 54.5 (22) |
| Deoxynivalenol | |||
| 655 ± 514 | 410 | Not applicable | 66.7 (30) |
| Fumonisin B1 | |||
| 11,883 ± 6917 | 7740 | Not applicable | 9.4 (32) |
| Fumonisin B2 | |||
| 3985 ± 5310 | 1020 | Not applicable | 22.2 (9) |
| HT-2 toxin | |||
| 124 ± 132 | 126 | Not applicable | 25.0 (16) |
| Ochratoxin A | |||
| 15 ± 30 | 2 | Not applicable | 54.5 (22) |
| T-2 toxin | |||
| 119 ± 177 | 25 | Not applicable | 30.4 (23) |
| Zearalenone | |||
| 314 ± 724 | 27 | Not applicable | 37.5 (24) |
| Others (there is no recommended guidelines) b | |||
| Deoxynivalenol | |||
| 610 ± 519 | 567 | Not applicable | 38.5 (13) |
| Fumonisin B1 | |||
| 4931 ± 5994 | 693 | Not applicable | 66.7 (3) |
| HT-2 toxin | |||
| 193 ± 136 | 197 | Not applicable | 75.0 (12) |
| Ochratoxin A | |||
| 1 ± 3 | 1 | Not applicable | 56.3 (64) |
| T-2 toxin | |||
| 6 ± 3 | 6 | Not applicable | 38.5 (13) |
| Zearalenone | |||
| 9 ± 5 | 9 | Not applicable | 18.2 (11) |
| Average ± Standard Deviation | Median | Sample Numbers above Recommended Guidance Value, n | Prevalence, % (Sample Totals Analyzed by Toxin) d |
|---|---|---|---|
| Concentration, µg kg−1 | |||
| Beef Cattle Feed | |||
| 3-acetyldeoxynivalenol (there is no recommended guideline)c | |||
| 166 ± 159 | 77 | Not applicable | 42.9 (7) |
| Deoxinivalenol (5000 µg kg−1)c | |||
| 988 ± 1371 | 530 | 0 | 70.0 (10) |
| Fumonisin B1 (50,000 µg kg−1 sum FB1/FB2)c | |||
| 8912 ± 13,416 | 3305 | 0 | 88.9 (9) |
| Fumonisin B2 | |||
| 4020 ± 4921 | 134 | 0 | 66.7 (3) |
| HT-2 toxin (250 µg kg−1 sum T-2/HT-2c | |||
| 442 ± 736 | 20 | 1 | 37.5 (8) |
| T-2 toxin | |||
| 128 ± 126 | 110 | 1 | 30.0 (10) |
| Ochratoxin A (there is no recommended guideline)c | |||
| 19 ± 22 | 12 | Not applicable | 44.4 (9) |
| Zearalenone (500 µg kg−1)c | |||
| 269 ± 216 | 157 | 0 | 57.1 (7) |
| Ingredients b†: cornmeal (no restriction), soybean meal (no restriction), DDGG (12–15 g/100 g), palm kernel meal (max 10–15 g/100 g), wheat middlings (max 10–20 g/100 g), rice bran and polishings (max 10–20 g/100 g), soybean hulls (max 10 g/100 g), citrus pulp (10 g/100 g). | |||
| Dairy cattle Feed (Adults and Heifers) | |||
| 3-acetyldeoxynivalenol (there is no recommended guideline)c | |||
| 1843 ± 4135 | 218 | Not applicable | 19.0 (105) |
| Deoxynivalenol (5000 µg kg−1)c | |||
| 1578 ± 4613 | 338 | 5 | 55.1 (147) |
| Fumonisin B1 (50,000 µg kg−1 sum FB1/FB2c | |||
| 6171 ± 7908 | 1480 | 0 | 44.4 (144) |
| Fumonisin B2 | |||
| 3838 ± 5913 | 2310 | 0 | 43.2 (44) |
| HT-2 toxin (250 µg kg−1 sum T-2/HT-2c | |||
| 207 ± 282 | 106 | 13 | 35.6 (132) |
| Ochratoxin A (there is no recommended guidelinec | |||
| 55 ± 259 | 1 | Not applicable | 35.0 (140) |
| T-2 toxin | |||
| 184 ± 351 | 40 | 10 | 27.5 (171) |
| Zearalenone (500 µg kg−1c | |||
| 215 ± 810 | 16 | 6 | 44.0 (150) |
| Ingredients b†: cornmeal (no restriction), soybean meal (no restriction), DDGG (12–15 g/100 g), palm kernel meal (max 10–15 g/100 g), wheat middlings (max 10–20 g/100 g), rice bran and polishings (max 10–20 g/100 g), soybean hulls (max 10 g/100 g), citrus pulp (10 g/100 g). | |||
| Poultry Feed | |||
| Deoxynivalenol (5000 µg kg−1)c | |||
| 1550 ± 2327 | 405 | 2 | 71.4 (14) |
| Fumonisin B1 (20,000 µg kg−1 sum FB1/FB2)c | |||
| 17,147 ± 33,569 | 3860 | 1 | 70.0 (10) |
| Fumonisin B2 | |||
| 436 ± 467 | 835 | 0 | 80.0 (5) |
| HT-2 toxin (250 µg kg−1 sum T-2/HT-2)c | |||
| 353 ± 284 | 208 | 1 | 33.3 (15) |
| Ochratoxin A (100 µg kg−1)c | |||
| 31 ± 48 | 11 | 1 | 44.4 (9) |
| T-2 toxin | |||
| 316 ± 462 | 67 | 5 | 51.7 (29) |
| Zearalenone (there is no recommended guideline)c | |||
| 75 ± 117 | 28 | Not applicable | 50.0 (10) |
| Ingredientsb†: corn meal (no restriction), soybean meal (no restriction), DDGG (max 10–15 g/100 g), palm kernel meal (3–3.5 g/100 g), wheat middlings (max 3–3.5 g/100 g), rice bran and polishings (max 3–3.5 g/100 g), soybean hulls (max 3–3.5 g/100 g). | |||
| Pet Food (Cat and Dog Dry Food) | |||
| Deoxynivalenol (2000 µg kg−1)c | |||
| 940 ± 1317 | 470 | 0 | 50.0 (14) |
| Fumonisin B1 (5000 µg kg−1 sum FB1/FB2)c | |||
| 143,560 ± 479,783 | 3570 | 6 | 93.3 (15) |
| Ingredients b†: cornmeal (max 50 g/100 g), DDGG (max 25 g/100 g), palm kernel meal, wheat middlings (max 20 g/100 g), rice meal and bran (max 20 g/100 g). | |||
| Swine Feed (Lactating and Gestating Sows and Pig Grower) | |||
| Deoxynivalenol (900 µg kg−1)c | |||
| 6302 ± 14,932 | 590 | 6 | 76.5 (17) |
| Fumonisin B1 (5000 µg kg−1 sum FB1/FB2)c | |||
| 20,042 ± 35,978 | 3124 | 2 | 55.6 (9) |
| Fumonisin B2 | |||
| 376 ± 472 | 376 | 0 | 40.0 (5) |
| HT-2 toxin (250 µg kg−1 sum T-2/HT-2)c | |||
| 3409 ± 4738 | 3409 | 1 | 28.6 (7) |
| T-2 toxin | |||
| 183 ± 187 | 88 | 3 | 46.7 (15) |
| Zearalenone (100 µg kg−1)c | |||
| 518 ± 1327 | 37 | 2 | 44.4 (18) |
| Ingredients b†: cornmeal (no restriction), soybean meal (no restriction), DDGG (max 10 g/100 g), palm kernel meal (max 10 g/100 g), wheat middlings (max 20–25 g/100 g), rice bran and polishing (max 20–25 g/100 g), soybean hulls (no restriction). | |||
| Fish Feed | |||
| Deoxynivalenol (500 µg kg−1)c | |||
| 570 ± 318 | 635 | 2 | 25.0 (16) |
| Fumonisin B1 (10,000 µg kg−1 sum FB1/FB2)c | |||
| 10,851 ± 10,781 | 1565 | 2 | 52.4 (21) |
| Ochratoxin A (there is no recommended guideline)c | |||
| 3 ± 5 | 1 | Not applicable | 66.7 (24) |
| T-2 toxin | |||
| 4 ± 4 | 3 | 0 | 35.0 (20) |
| Zearalenone (there is no recommended guideline)c | |||
| 84 ± 122 | 35 | Not applicable | 25.0 (16) |
| Ingredientsb†: cornmeal (max 15 g/100 g), soybean meal (max 75 g/100 g), DDGG, palm kernel meal (max 30 g/100 g), wheat middlings (max 20 g/100 g), rice meal and bran (max 15 g/100 g), soybean hulls. | |||
| Horse Feed | |||
| Deoxynivalenol (5000 µg kg−1)c | |||
| 740 ± 295 | 580 | 0 | 50.0 (6) |
| Fumonisin B2 | |||
| 3355 ± 2623 | 3355 | 1 | 66.7 (3) |
| HT-2 toxin (250 µg kg−1 sum T-2/HT-2)c | |||
| 52 ± 26 | 52 | 0 | 40.0 (5) |
| Ochratoxin A (there is no recommended guideline)c | |||
| 95.36 ± 47.43 | 95 | Not applicable | 33.3 (6) |
| T-2 toxin | |||
| 49 ± 60 | 49 | 0 | 33.3 (6) |
| Ingredientsb†: cornmeal (max 45 g/100 g), soybean meal (max 13 g/100 g), DDGG (max 20 g/100 g), palm kernel meal, wheat middlings (max 25 g/100 g), rice bran, soybean hulls (max 20 g/100 g). | |||
| Concentration, mg kg−1 | |||
|---|---|---|---|
| Season a | Positive Samples, n (Prevalence, %) | Average ± SD | Maximum |
| 3-ADON | |||
| Rainy Season | 36/145 (24.8) | 2 ± 3 | 16 |
| DON | |||
| Dry Season | 57/101 (56.4) | 3 ± 7 | 52 |
| Rainy Season | 130/229 (56.8) | 17 ± 161 | 1830 |
| FB1 | |||
| Dry Season | 29/97 (29.9) | 7 ± 12 | 40 |
| Rainy Season | 111/226 (49.1) | 7 ± 13 | 77 |
| FB2 | |||
| Dry Season | 9/21 (42.9) | 4 ± 8 | 23 |
| Rainy Season | 25/56 (44.6) | 3 ± 4 | 19 |
| HT-2 toxin | |||
| Rainy Season | 96/180 (53.3) | 1 ± 2 | 11 |
| T-2 toxin | |||
| Dry Season | 54/145 (37.2) | < 1 | 2 |
| Rainy Season | 94/248 (37.9) | < 1 | 1 |
| OTA, μg kg−1 | |||
| Dry Season | 31/112 (27.7) | 7 ± 24 | 137 |
| Rainy Season | 88/204 (43.1) | 37 ± 193 | 1810 |
| ZEA | |||
| Dry Season | 46/94 (48.9) | 1 ± 1 | 6 |
| Rainy Season | 90/228 (39.5) | 1 ± 6 | 4 |
| Overall Months with Higher Levels and Prevalence | |||
| 3-ADON | April and May | DON | No clear distribution |
| FB1 | June, July, and September | FB2 | April, June, and September |
| HT-2 toxin | October and November | T-2 toxin | No clear distribution |
| OTA | May and September | ZEA | May, July, and October |
| Number of Toxins Simultaneously Present | 2 | 3 | 4 | 5 | 6 | 7 | |||
|---|---|---|---|---|---|---|---|---|---|
| Samples, n (Incidence, %) | 141/279 a (50.54) | 81/279 (29.0) | 36/279 (12.9) | 17/279 (6.1) | 1/279 (0.4) | 3/279 (1.1) | |||
| Toxin/Metabolite | Sample Numbers with the toxin present, n | Co-occurrence, n | Incidence, % | ||||||
| DON/3-ADON | 177 | 18 | 10.2 | ||||||
| FB1/FB2 | 137 | 23 | 16.8 | ||||||
| T-2/HT-2 toxin | 155 | 66 | 42.6 | ||||||
| Toxin Co-occurrence with OTA | Sample Numbers, n | Incidence, % | |||||||
| DON + HT-2 toxin + ZEA | 1 | 1.0 | |||||||
| DON + 3-ADON + FB1 + ZEA | 1 | 1.0 | |||||||
| T-2 toxin + FB1 + ZEA | 1 | 1.0 | |||||||
| DON + FB1 + FB2 + ZEA | 1 | 1.0 | |||||||
| 3-ADON | 1 | 1.0 | |||||||
| DON + 3-ADON + T-2 toxin + FB1 | 1 | 1.0 | |||||||
| DON + HT-2 toxin + FB1 + ZEA | 2 | 2.0 | |||||||
| T-2 toxin + HT-2 toxin + FB1 + ZEA | 2 | 2.0 | |||||||
| DON + 3-ADON + T-2 toxin + HT-2 T-2 toxin + FB1 + FB2 + ZEA | 2 | 2.0 | |||||||
| FB1 + ZEA | 2 | 2.0 | |||||||
| T-2/HT-2 toxin + ZEA | 3 | 2.9 | |||||||
| T-2 toxin + FB1 | 3 | 2.9 | |||||||
| DON + T-2 toxin + HT-2 toxin | 4 | 3.9 | |||||||
| DON + ZEA | 4 | 3.9 | |||||||
| DON + T-2 + FB1 + ZEA | 6 | 5.9 | |||||||
| DON | 7 | 6.9 | |||||||
| HT-2 toxin | 8 | 7.8 | |||||||
| T-2 toxin | 10 | 9.8 | |||||||
| FB1/FB2 | 12 | 11.8 | |||||||
| DON + FB1 | 14 | 13.7 | |||||||
| ZEA | 17 | 16.7 | |||||||
| Concentration b, ng mL−1 | |||||||
|---|---|---|---|---|---|---|---|
| Year | Positive Samples, n (Prevalence, %) a | Samples > 0.05 µg kg−1, n (%) | Samples > 0.5 µg kg−1, n (%) | Average ± SD | Median | Maximum | Minimum |
| 2017 | 24/38 (63.2) | 16 (42.1) | 0 | 0.083 ± 0.076 | 0.061 | 0.334 | 0.013 |
| 2016 | 8/27 (29.6) | 2 (7.4) | 0 | 0.042 ± 0.030 | 0.032 | 0.109 | 0.014 |
| 2015 | 34/73 (46.6) | 16 (21.9) | 3 (4.1) | 0.154 ± 0.236 | 0.057 | 0.989 | 0.017 |
| 2014 | 32/45 (71.1) | 11 (24.4) | 0 | 0.042 ± 0.038 | 0.030 | 0.164 | 0.005 |
| Overall | 98/183 (53.5) | 45 (45.9) | 3 (3.1) | 0.091 ± 0.155 | 0.049 | 0.989 | 0.005 |
| Dry season c | 28/45 (62.2) | 14 (50.0) | 0 | 0.075 ± 0.105 | 0.050 | 0.485 | 0.005 |
| Rainy season c | 69/138 (50.0) | 34 (49.3) | 3 (4.3) | 0.098 ± 0.172 | 0.049 | 0.989 | 0.005 |
| Overall months with higher levels and prevalence | March, August, and September | ||||||
© 2019 by the authors. Licensee MDPI, Basel, Switzerland. This article is an open access article distributed under the terms and conditions of the Creative Commons Attribution (CC BY) license (http://creativecommons.org/licenses/by/4.0/).
Share and Cite
Molina, A.; Chavarría, G.; Alfaro-Cascante, M.; Leiva, A.; Granados-Chinchilla, F. Mycotoxins at the Start of the Food Chain in Costa Rica: Analysis of Six Fusarium Toxins and Ochratoxin A between 2013 and 2017 in Animal Feed and Aflatoxin M1 in Dairy Products. Toxins 2019, 11, 312. https://doi.org/10.3390/toxins11060312
Molina A, Chavarría G, Alfaro-Cascante M, Leiva A, Granados-Chinchilla F. Mycotoxins at the Start of the Food Chain in Costa Rica: Analysis of Six Fusarium Toxins and Ochratoxin A between 2013 and 2017 in Animal Feed and Aflatoxin M1 in Dairy Products. Toxins. 2019; 11(6):312. https://doi.org/10.3390/toxins11060312
Chicago/Turabian StyleMolina, Andrea, Guadalupe Chavarría, Margarita Alfaro-Cascante, Astrid Leiva, and Fabio Granados-Chinchilla. 2019. "Mycotoxins at the Start of the Food Chain in Costa Rica: Analysis of Six Fusarium Toxins and Ochratoxin A between 2013 and 2017 in Animal Feed and Aflatoxin M1 in Dairy Products" Toxins 11, no. 6: 312. https://doi.org/10.3390/toxins11060312
APA StyleMolina, A., Chavarría, G., Alfaro-Cascante, M., Leiva, A., & Granados-Chinchilla, F. (2019). Mycotoxins at the Start of the Food Chain in Costa Rica: Analysis of Six Fusarium Toxins and Ochratoxin A between 2013 and 2017 in Animal Feed and Aflatoxin M1 in Dairy Products. Toxins, 11(6), 312. https://doi.org/10.3390/toxins11060312