Changes in Stress and Appetite Responses in Male Power-Trained Athletes during Intensive Training Camp

Abstract
1. Introduction
2. Materials and Methods
2.1. Participants
2.2. Study Design
2.3. Anthropometry
2.4. Exercise Training Volume
2.5. Dietary Intake
2.6. Hormonal and Biochemical Indicators
2.7. Appetite and Fatigue Sensation
2.8. Mood States
2.9. Statistical Analysis
3. Results
3.1. Anthropometric Measures
3.2. Training Volume and Nutritional Intake
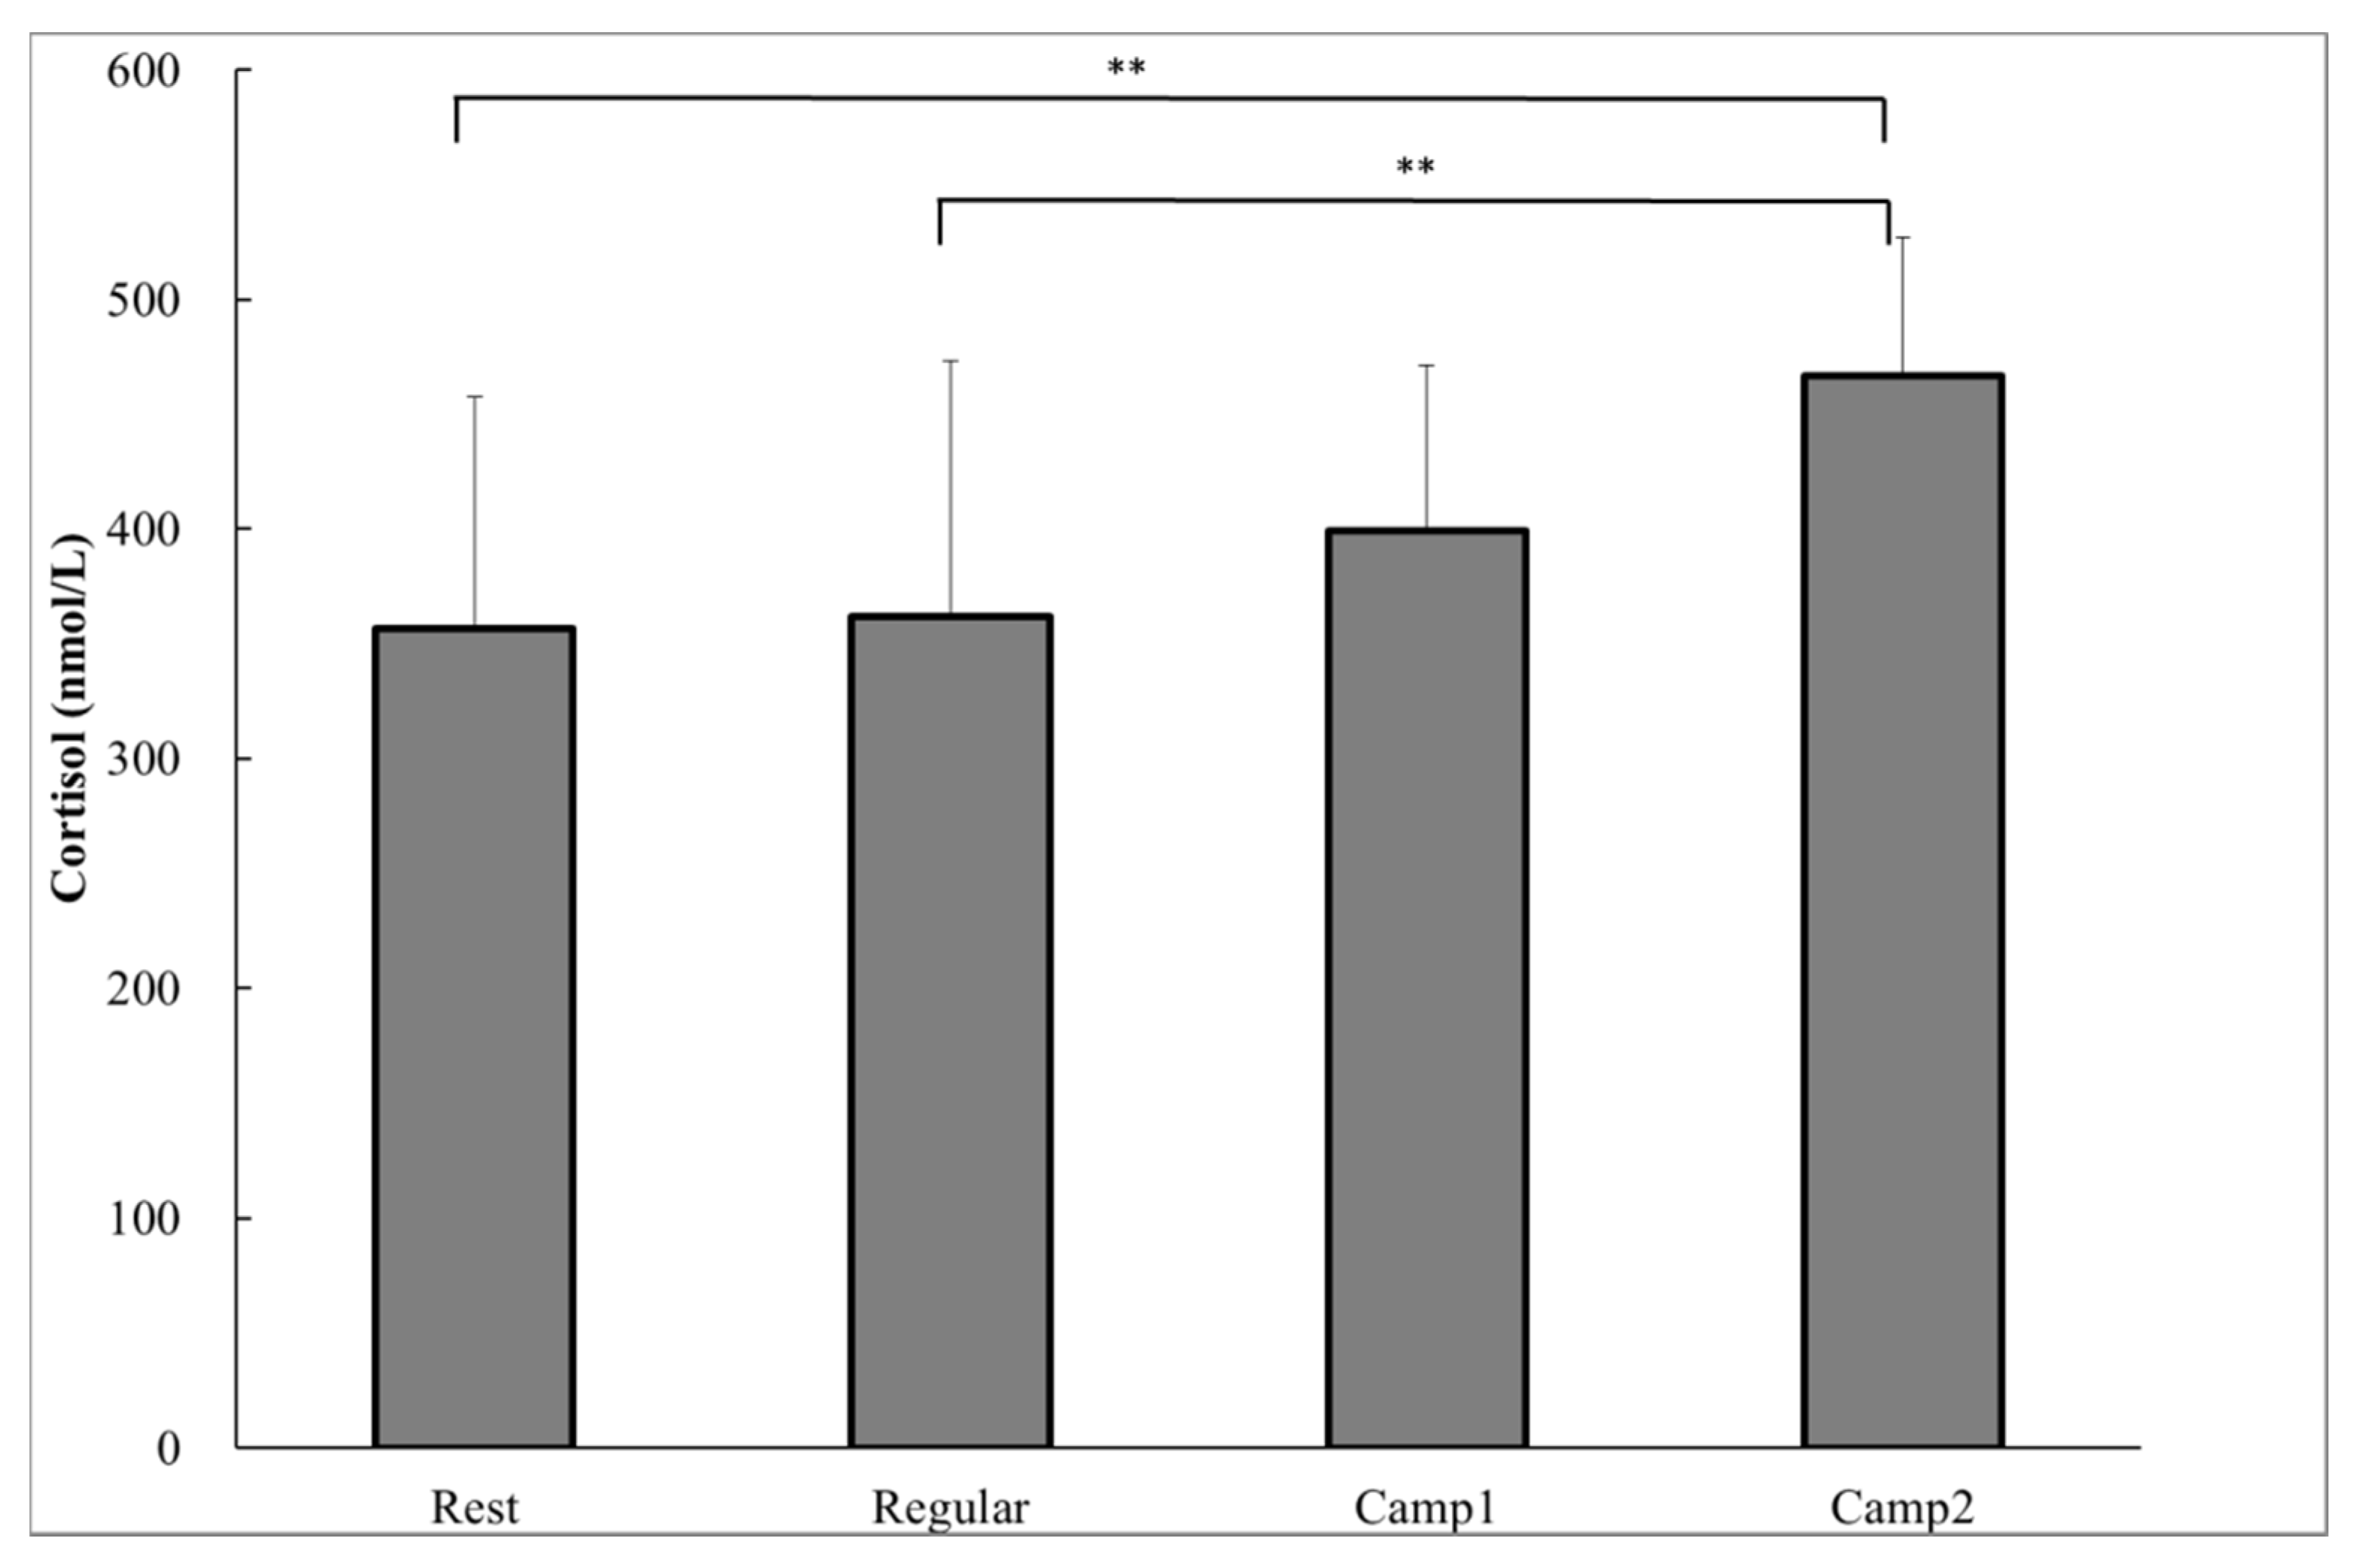
3.3. Measurements Related to Stress
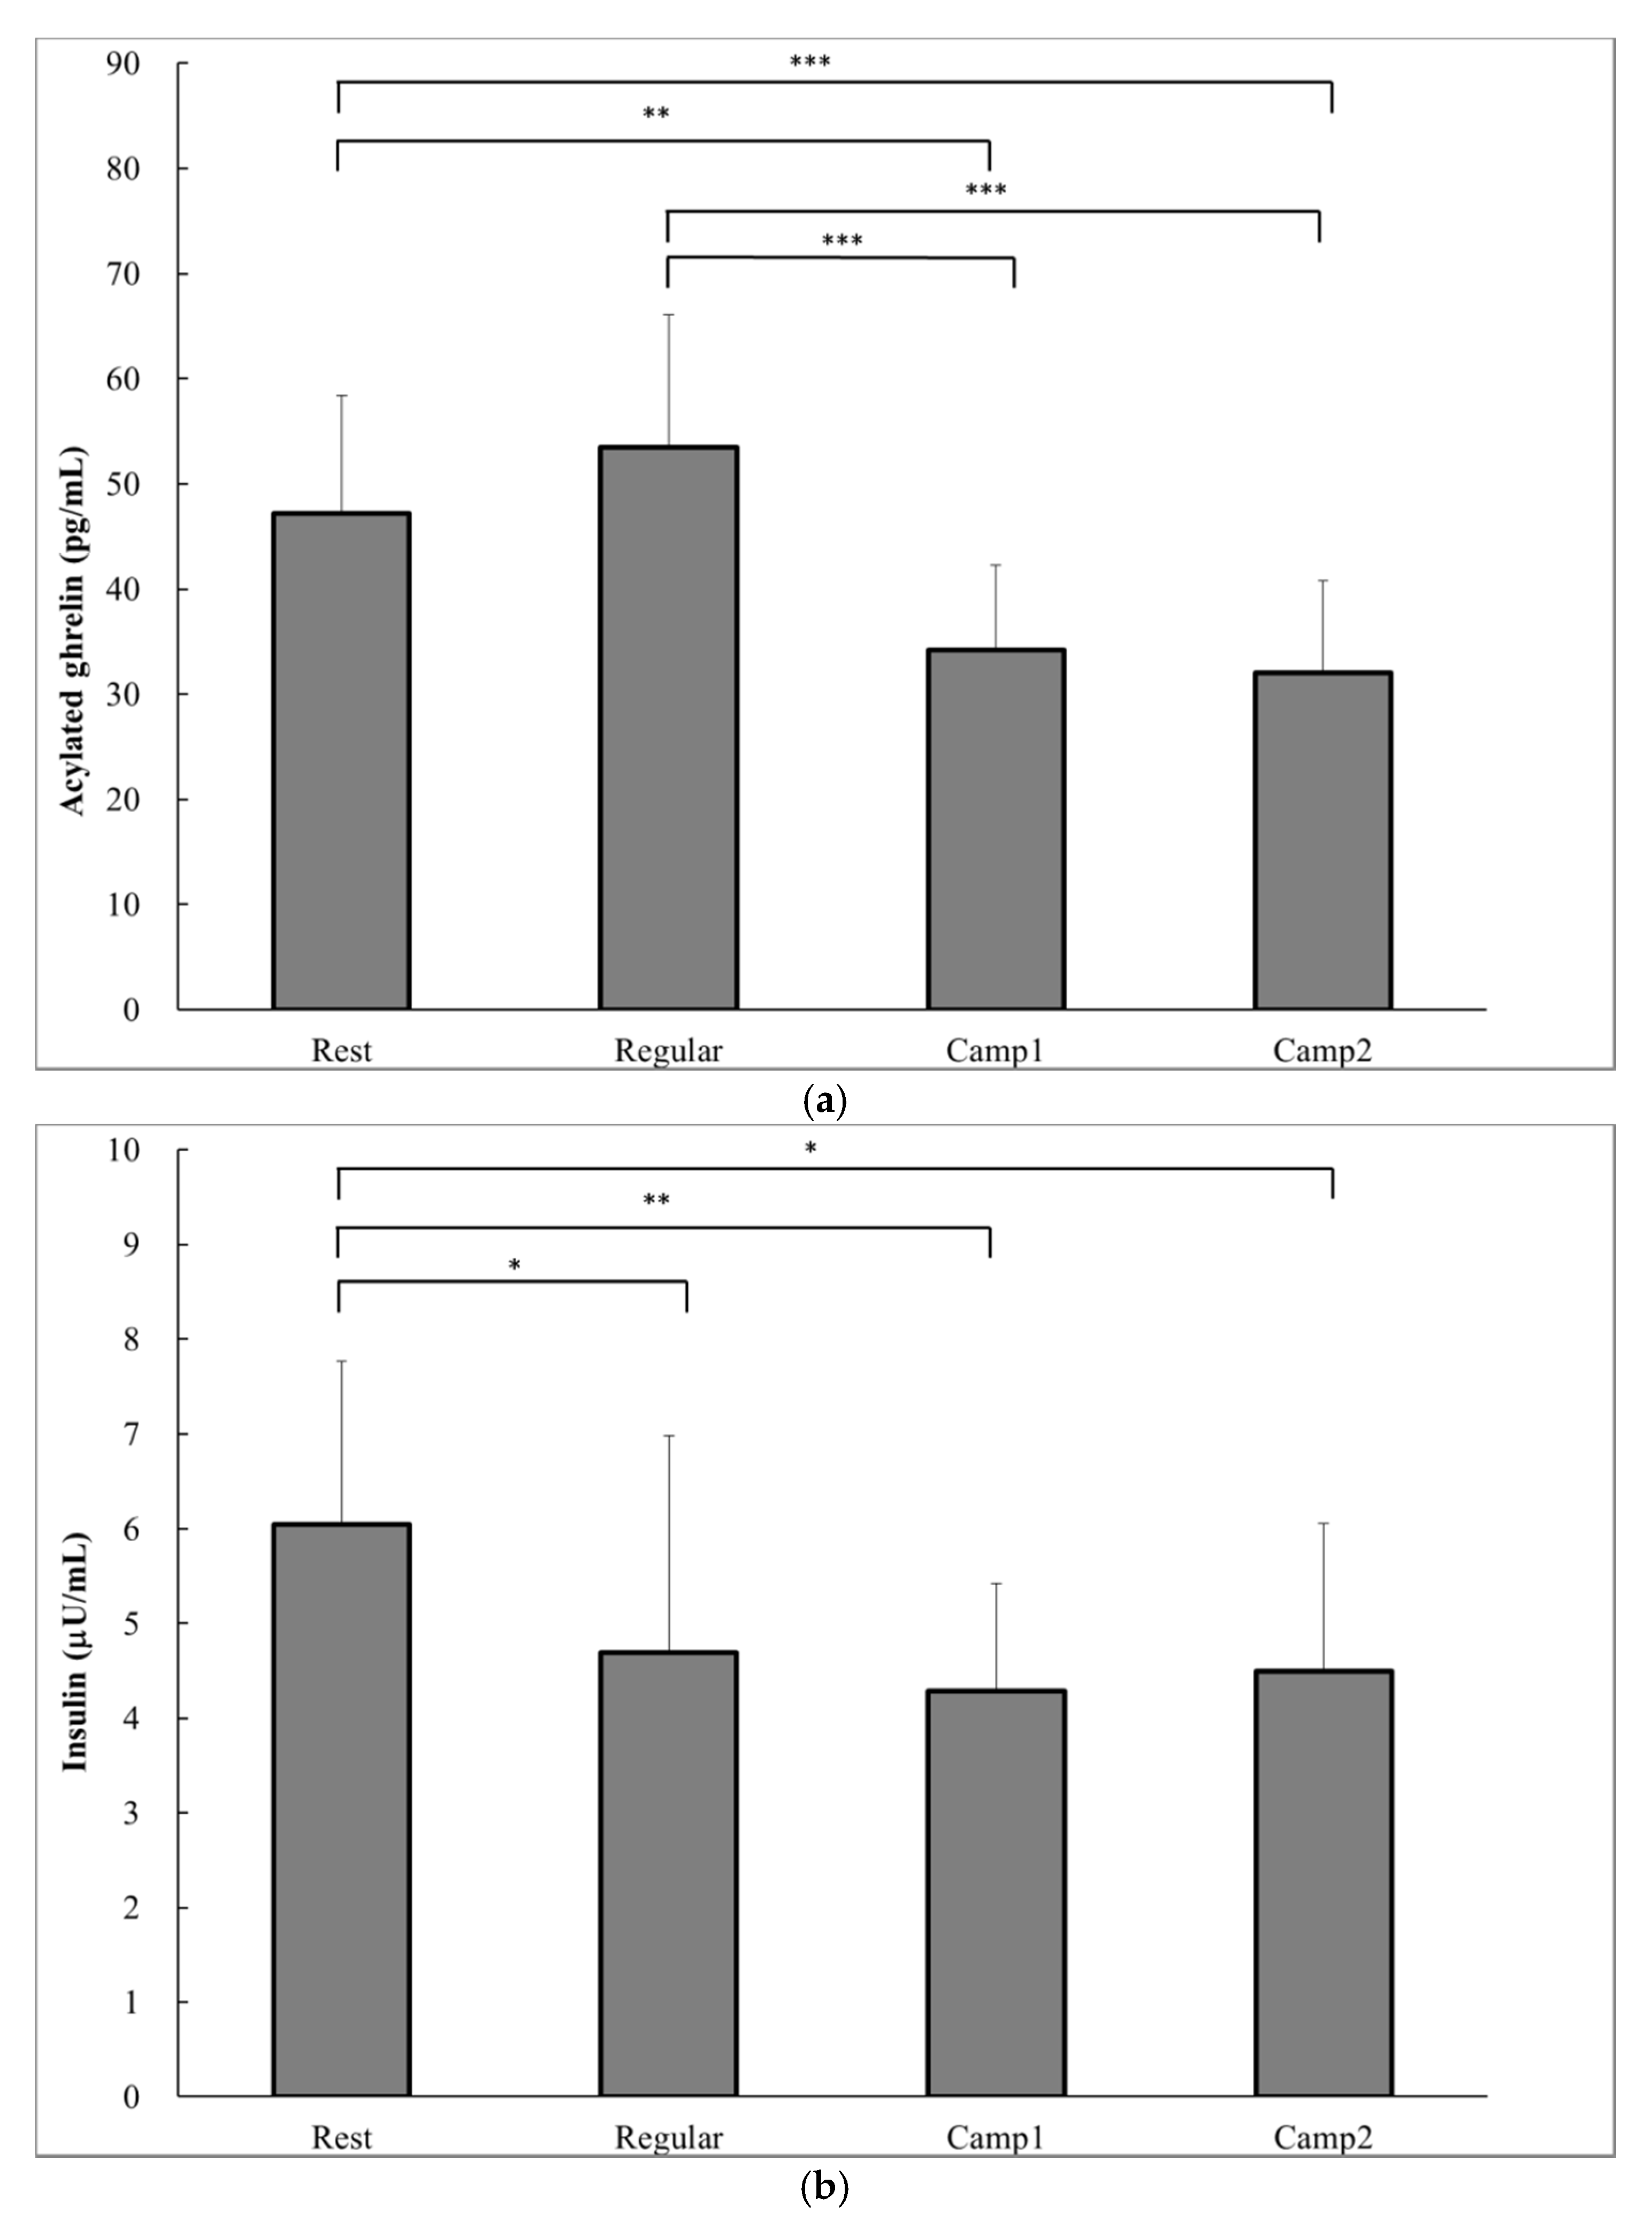
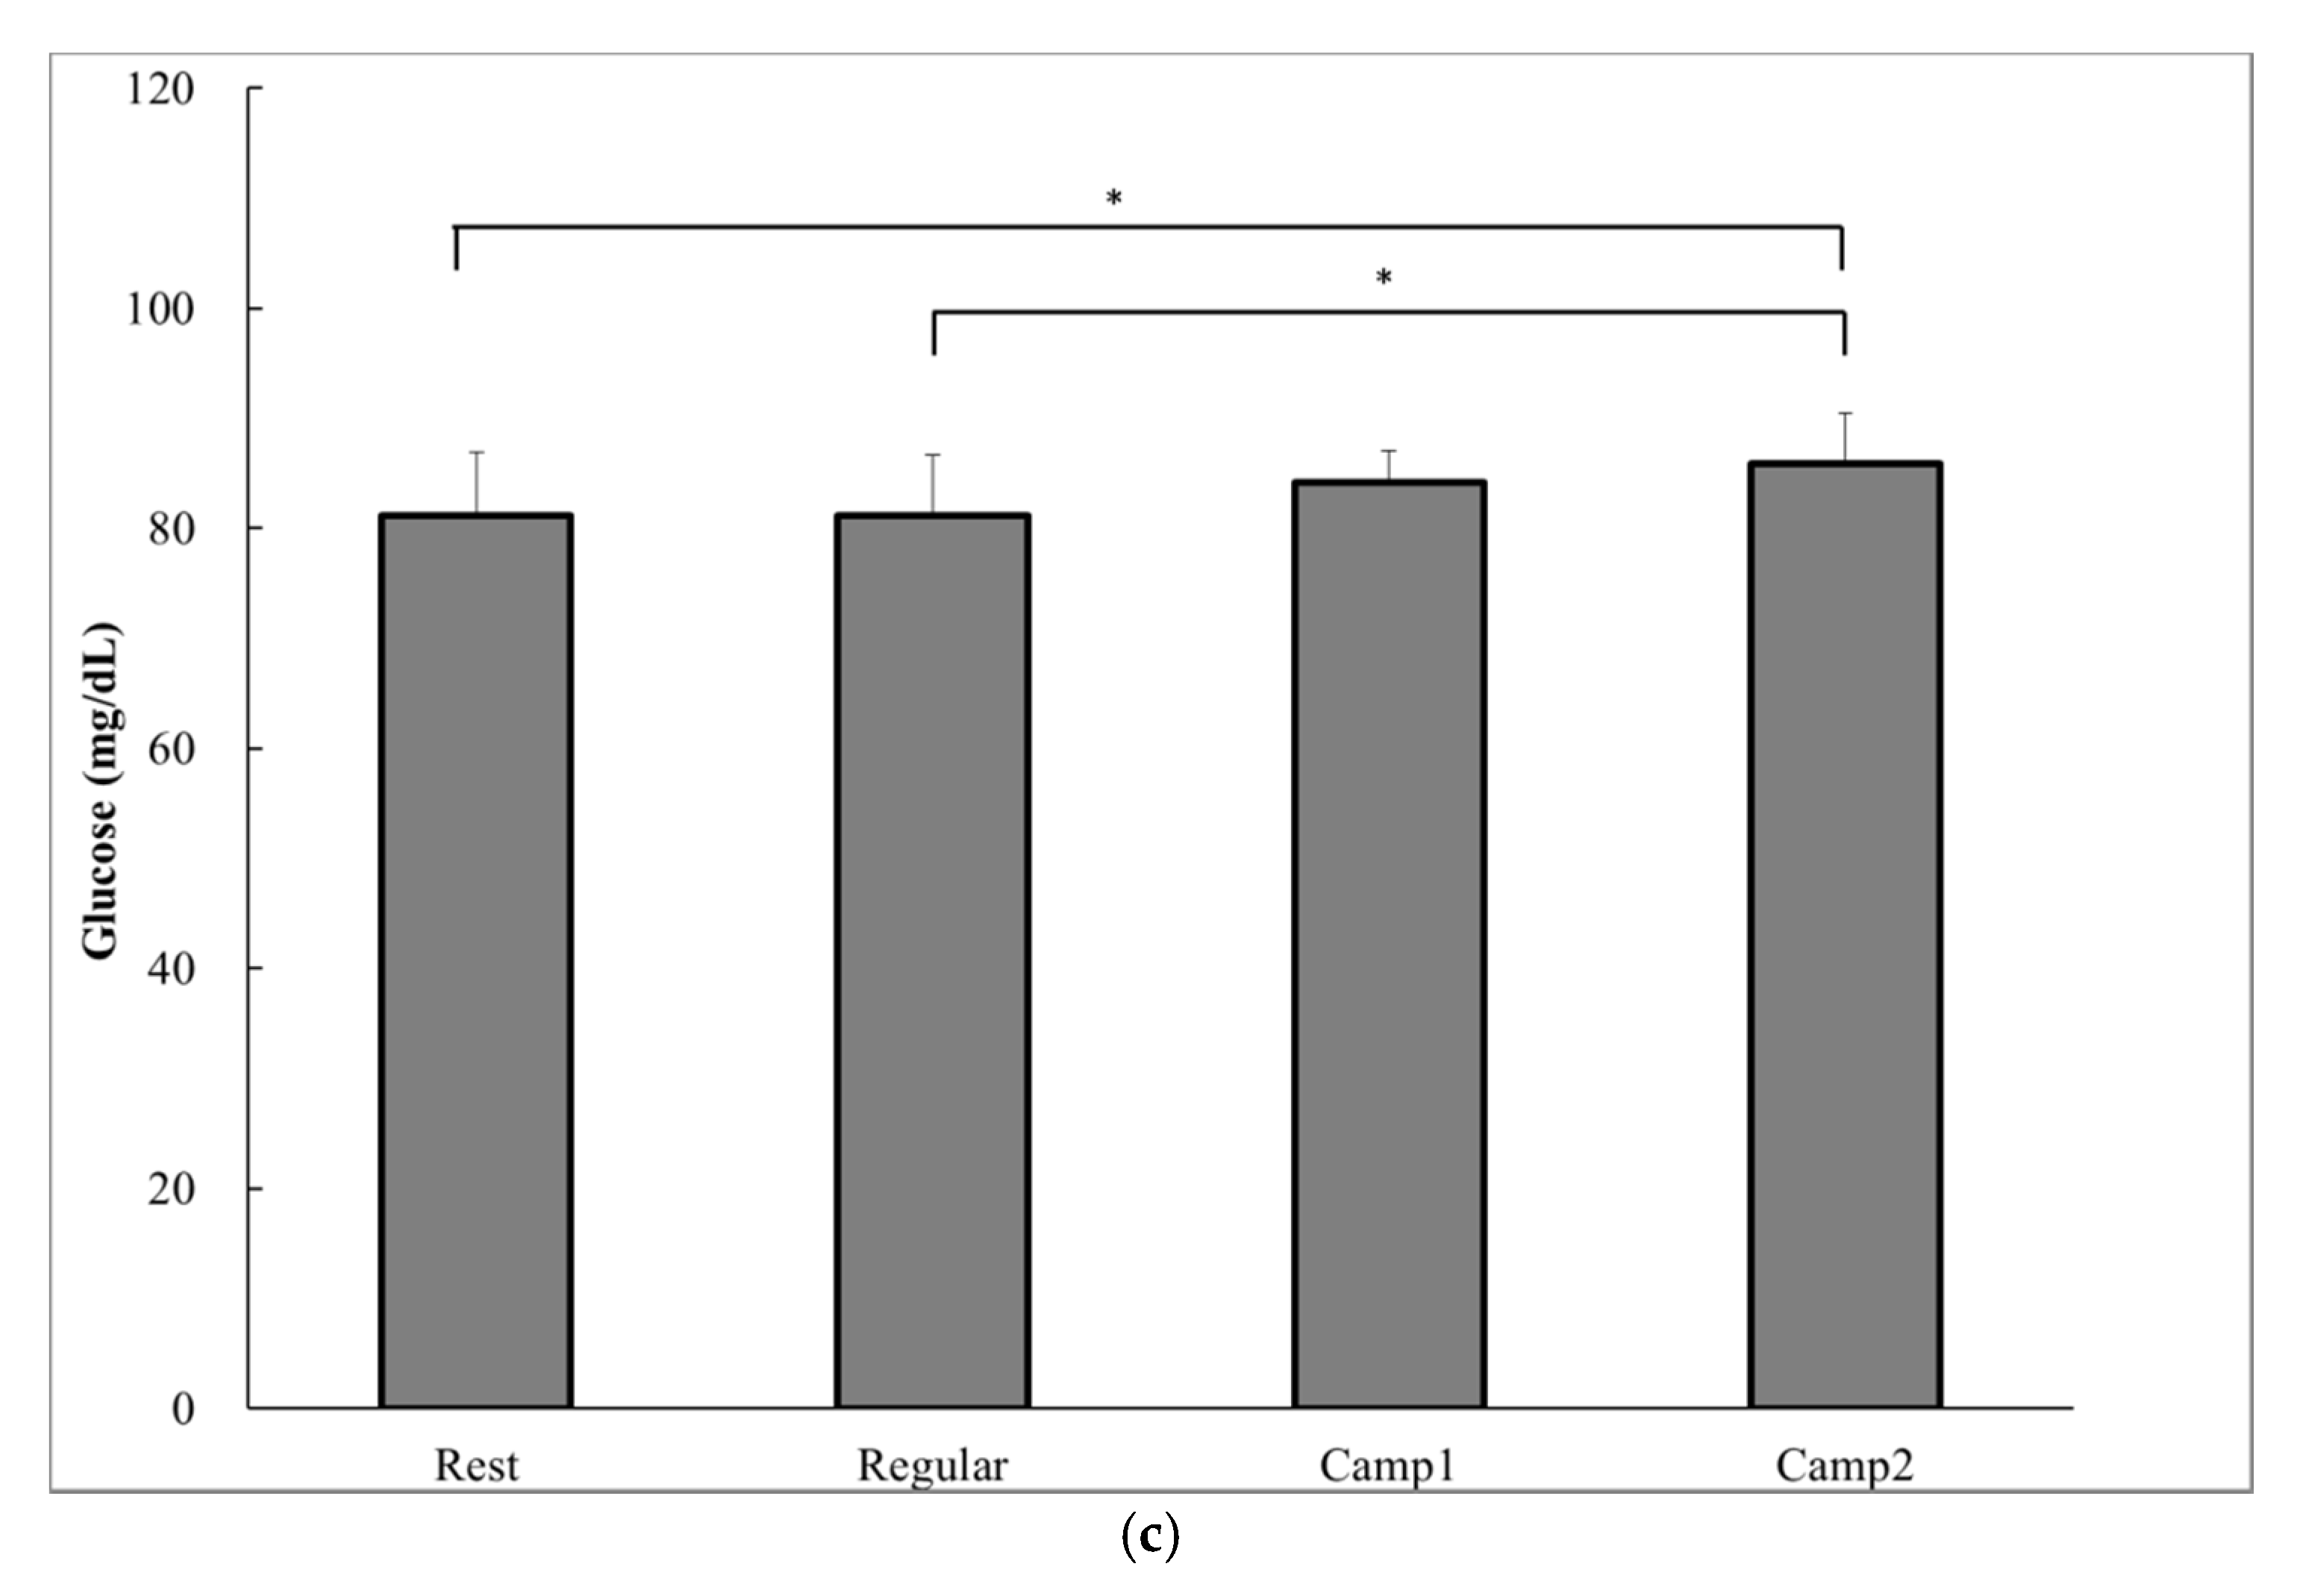
3.4. Measurements Related to Appetite
4. Discussion
5. Conclusions
Acknowledgments
Author Contributions
Conflicts of Interest
References
- Budgett, R. Overtraining syndrome. Br. J. Sports Med. 1990, 24, 231–236. [Google Scholar] [CrossRef] [PubMed]
- Fry, R.W.; Grove, J.R.; Morton, A.R.; Zeroni, P.M.; Gaudieri, S.; Keast, D. Psychological and immunological correlates of acute overtraining. Br. J. Sports Med 1994, 28, 241–246. [Google Scholar] [CrossRef] [PubMed]
- Parker, B.A.; Sturm, K.; MacIntosh, C.; Feinle, C.; Horowitz, M.; Chapman, I.M. Relation between food intake and visual analogue scale ratings of appetite and other sensations in healthy older and young subjects. Eur. J. Clin. Nutr. 2004, 58, 212–218. [Google Scholar] [CrossRef] [PubMed]
- Meeusen, R.; Duclos, M.; Foster, C.; Fry, A.; Gleeson, M.; Nieman, D.; Raglin, J.; Rietjens, G.; Steinacker, J.; Urhausen, A. Prevention, diagnosis, and treatment of the overtraining syndrome: Joint consensus statement of the european college of sport science and the american college of sports medicine. Med. Sci. Sports Exerc. 2013, 45, 186–205. [Google Scholar] [CrossRef] [PubMed]
- Perna, F.M.; Schneiderman, N.; LaPerriere, A. Psychological stress, exercise and immunity. Int. J. Sports Med. 1997, 18, S78–S83. [Google Scholar] [CrossRef] [PubMed]
- Urhausen, A.; Kindermann, W. Diagnosis of overtraining: What tools do we have? Sports Med. 2002, 32, 95–102. [Google Scholar] [CrossRef] [PubMed]
- Gleeson, M.; McDonald, W.A.; Cripps, A.W.; Pyne, D.B.; Clancy, R.L.; Fricker, P.A. The effect on immunity of long-term intensive training in elite swimmers. Clin. Exp. Immunol. 1995, 102, 210–216. [Google Scholar] [CrossRef] [PubMed]
- Yamauchi, R.; Shimizu, K.; Furukawa, T.; Watanabe, K.; Takemura, M.; Akama, T.; Akimoto, T.; Kono, I. Alterations of salivary siga during training camp in collegiate rugby football players. Jpn. J. Phys. Fit. Sports Med. 2009, 58, 131–142. [Google Scholar] [CrossRef]
- Stensel, D. Exercise, appetite and appetite-regulating hormones: Implications for food intake and weight control. Ann. Nutr. Metab. 2010, 57, 36–42. [Google Scholar] [CrossRef] [PubMed]
- Wren, A.M.; Seal, L.J.; Cohen, M.A.; Brynes, A.E.; Frost, G.S.; Murphy, K.G.; Dhillo, W.S.; Ghatei, M.A.; Bloom, S.R. Ghrelin enhances appetite and increases food intake in humans. J. Clin. Endocrinol. Metab. 2001, 86, 5992. [Google Scholar] [CrossRef] [PubMed]
- Druce, M.R.; Wren, A.M.; Park, A.J.; Milton, J.E.; Patterson, M.; Frost, G.; Ghatei, M.A.; Small, C.; Bloom, S.R. Ghrelin increases food intake in obese as well as lean subjects. Int. J. Obes. 2005, 29, 1130–1136. [Google Scholar] [CrossRef] [PubMed]
- Murphy, K.G.; Bloom, S.R. Gut hormones and the regulation of energy homeostasis. Nature 2006, 444, 854–859. [Google Scholar] [CrossRef] [PubMed]
- Broom, D.R.; Stensel, D.J.; Bishop, N.C.; Burns, S.F.; Miyashita, M. Exercise-induced suppression of acylated ghrelin in humans. J. Appl. Physiol. 2007, 102, 2165–2171. [Google Scholar] [CrossRef] [PubMed]
- Broom, D.R.; Batterham, R.L.; King, J.A.; Stensel, D.J. Influence of resistance and aerobic exercise on hunger, circulating levels of acylated ghrelin, and peptide yy in healthy males. Am. J. Physiol. Regul. Integr. Comp. Physiol. 2009, 296, R29–R35. [Google Scholar] [CrossRef] [PubMed]
- King, J.A.; Miyashita, M.; Wasse, L.K.; Stensel, D.J. Influence of prolonged treadmill running on appetite, energy intake and circulating concentrations of acylated ghrelin. Appetite 2010, 54, 492–498. [Google Scholar] [CrossRef] [PubMed]
- Hoffman, J.R.; Epstein, S.; Yarom, Y.; Zigel, L.; Einbinder, M. Hormonal and biochemical changes in elite basketball players during a 4-week training camp. J. Strength Cond. Res. 1999, 13, 280–285. [Google Scholar]
- Jurimae, J.; Maestu, J.; Purge, P.; Jurimae, T.; Soot, T. Relations among heavy training stress, mood state, and performance for male junior rowers. Percept. Mot. Skills 2002, 95, 520–526. [Google Scholar] [CrossRef] [PubMed]
- Jurimae, J.; Maestu, J.; Purge, P.; Jurimae, T. Changes in stress and recovery after heavy training in rowers. J. Sci. Med. Sport 2004, 7, 335–339. [Google Scholar] [CrossRef]
- Goto, K.; Shioda, K.; Uchida, S. Effect of 2days of intensive resistance training on appetite-related hormone and anabolic hormone responses. Clin. Physiol. Funct. Imaging 2013, 33, 131–136. [Google Scholar] [CrossRef] [PubMed]
- Foster, C.; Florhaug, J.A.; Franklin, J.; Gottschall, L.; Hrovatin, L.A.; Parker, S.; Doleshal, P.; Dodge, C. A new approach to monitoring exercise training. J. Strength Cond. Res. 2001, 15, 109–115. [Google Scholar] [PubMed]
- Impellizzeri, F.M.; Rampinini, E.; Coutts, A.J.; Sassi, A.; Marcora, S.M. Use of rpe-based training load in soccer. Med. Sci. Sports Exerc. 2004, 36, 1042–1047. [Google Scholar] [CrossRef] [PubMed]
- Day, M.L.; McGuigan, M.R.; Brice, G.; Foster, C. Monitoring exercise intensity during resistance training using the session rpe scale. J. Strength Cond. Res. 2004, 18, 353–358. [Google Scholar] [PubMed]
- Borg, G.; Ljunggren, G.; Ceci, R. The increase of perceived exertion, aches and pain in the legs, heart-rate and blood lactate during exercise on a bicycle ergometer. Eur. J. Appl. Physiol. Occup. Physiol. 1985, 54, 343–349. [Google Scholar] [CrossRef] [PubMed]
- Science and Technology Agency. Standard Tables of Food cComposition in Japan, 2010; Printing Bureau of the Ministry of Education, Culture, Sports, Science and Technology: Tokyo, Japan, 2010. (In Japanese)
- Flint, A.; Raben, A.; Blundell, J.E.; Astrup, A. Reproducibility, power and validity of visual analogue scales in assessment of appetite sensations in single test meal studies. Int. J. Obes. Relat. Metab. Disord. 2000, 24, 38–48. [Google Scholar] [CrossRef] [PubMed]
- Nagai, N.; Hibi, M.; Yamaguchi, T.; Kameo, Y.; Kobayashi, S.; Katashima, M. Development of the japanese version of appetite sensations questionnaire using visual analogue scales (VAS), and assessment of its reproducibility and validity. J. Jpn. Soc. Study Obes. 2012, 18, 39–51. [Google Scholar]
- Morgan, W.P.; Costill, D.L.; Flynn, M.G.; Raglin, J.S.; O’Connor, P.J. Mood disturbance following increased training in swimmers. Med. Sci. Sports Exerc. 1988, 20, 408–414. [Google Scholar] [CrossRef] [PubMed]
- Yokoyama, K.; Araki, S.; Kawakami, N.; Tkakeshita, T. Production of the Japanese edition of profile of mood states (POMS): Assessment of reliability and validity. Jpn. J. Public Health 1990, 37, 913–918. [Google Scholar]
- Berglund, B.; Safstrom, H. Psychological monitoring and modulation of training load of world-class canoeists. Med. Sci. Sports Exerc. 1994, 26, 1036–1040. [Google Scholar] [CrossRef] [PubMed]
- Urhausen, A.; Gabriel, H.; Kindermann, W. Blood hormones as markers of training stress and overtraining. Sports Med. 1995, 20, 251–276. [Google Scholar] [CrossRef] [PubMed]
- Lehmann, M.; Foster, C.; Dickhuth, H.H.; Gastmann, U. Autonomic imbalance hypothesis and overtraining syndrome. Med. Sci. Sports Exerc. 1998, 30, 1140–1145. [Google Scholar] [CrossRef] [PubMed]
- Kirwan, J.P.; Costill, D.L.; Flynn, M.G.; Mitchell, J.B.; Fink, W.J.; Neufer, P.D.; Houmard, J.A. Physiological responses to successive days of intense training in competitive swimmers. Med. Sci. Sports Exerc. 1988, 20, 255–259. [Google Scholar] [CrossRef] [PubMed]
- Moreira, A.; Arsati, F.; Cury, P.R.; Franciscon, C.; Simoes, A.C.; de Oliveira, P.R.; de Araujo, V.C. The impact of a 17-day training period for an international championship on mucosal immune parameters in top-level basketball players and staff members. Eur. J. Oral Sci. 2008, 116, 431–437. [Google Scholar] [CrossRef] [PubMed]
- Schmid, D.A.; Held, K.; Ising, M.; Uhr, M.; Weikel, J.C.; Steiger, A. Ghrelin stimulates appetite, imagination of food, gh, acth, and cortisol, but does not affect leptin in normal controls. Neuropsychopharmacology 2005, 30, 1187–1192. [Google Scholar] [CrossRef] [PubMed]
- Hosoda, H.; Kangawa, K. The autonomic nervous system regulates gastric ghrelin secretion in rats. Regul. Pept. 2008, 146, 12–18. [Google Scholar] [CrossRef] [PubMed]
- Chicharro, J.L.; Lucia, A.; Perez, M.; Vaquero, A.F.; Urena, R. Saliva composition and exercise. Sports Med. 1998, 26, 17–27. [Google Scholar] [CrossRef] [PubMed]
- Espelund, U.; Hansen, T.K.; Hojlund, K.; Beck-Nielsen, H.; Clausen, J.T.; Hansen, B.S.; Orskov, H.; Jorgensen, J.O.L.; Frystyk, J. Fasting unmasks a strong inverse association between ghrelin and cortisol in serum: Studies in obese and normal-weight subjects. J. Clin. Endocrinol. Metab. 2005, 90, 741–746. [Google Scholar] [CrossRef] [PubMed]
- Clarke, N.; Farthing, J.P.; Norris, S.R.; Arnold, B.E.; Lanovaz, J.L. Quantification of training load in canadian football: Application of session-RPE in collision-based team sports. J. Strength Cond. Res. 2013, 27, 2198–2205. [Google Scholar] [CrossRef] [PubMed]


| n = 13 | Regular | Camp1 | Camp2 |
|---|---|---|---|
| RPE per training session | 13.9 ± 0.9 | 15.0 ± 1.2 a | 14.8 ± 2.9 |
| Total training duration (hours/day) | 2.2 ± 0.4 | 7.1 ± 0.1 a | 6.8 ± 0.8 a |
| Total training volume (RPE hour/day) | 31.1 ± 5.9 | 106.9 ± 8.5 a | 99.5 ± 20.1 a |
| n = 13 | Rest | Regular | Camp1 | Camp2 |
|---|---|---|---|---|
| Energy (kcal) | 3373 ± 769 | 3398 ± 739 | 6175 ± 513 a,b | 4752 ± 915 a,b,c |
| Carbohydrate (g) | 531 ± 128 | 485 ± 108 | 926 ± 108 a,b | 747 ± 196 a,b,c |
| Protein (g) | 105 ± 22 | 125 ± 27 | 180 ± 24 a,b | 134 ± 23 a,c |
| Fat (g) | 83 ± 31 | 97 ± 30 | 184 ± 26 a,b | 131 ± 32 a,b,c |
| n = 13 | Rest | Regular | Camp1 | Camp2 |
|---|---|---|---|---|
| Saliva flow rate (mL/min) | 1.1 ± 0.5 | 1.2 ± 0.5 | 1.1 ± 0.6 | 0.8 ± 0.6 a,b |
| SIgA concentration (μg/mL) | 24.6 ± 11.1 | 24.0 ± 13.8 | 26.6 ± 6.2 | 32.1 ± 9.0 a,b |
| SIgA secretion rate (µg/min) | 27.2 ± 16.1 | 25.9 ± 12.0 | 28.1 ± 13.3 | 24.3 ± 14.6 |
| n = 13 | Rest | Regular | Camp1 | Camp2 |
|---|---|---|---|---|
| Tension | 1.5 ± 4.4 | 1.3 ± 2.2 | 1.4 ± 1.7 | 2.2 ± 3.2 |
| Depression | 1.5 ± 3.2 | 1.0 ± 1.6 | 0.8 ± 1.4 | 1.2 ± 2.1 |
| Anger | 0.6 ± 1.6 | 0.8 ± 1.3 | 0.8 ± 1.5 | 0.7 ± 1.3 |
| Vigor | 1.0 ± 1.7 | 2.4 ± 2.0 | 1.4 ± 2.7 | 1.6 ± 3.6 |
| Fatigue | 3.1 ± 4.3 | 4.2 ± 4.7 | 4.6 ± 3.6 | 6.5 ± 5.2 |
| Confusion | 1.5 ± 3.0 | 1.1 ± 1.6 | 0.5 ± 1.0 | 1.2 ± 2.2 |
| Total mood score | 107.2 ± 14.9 | 105.9 ± 9.6 | 106.8 ± 5.6 | 110.2 ± 10.6 |
| n = 13 | Rest | Regular | Camp1 | Camp2 |
|---|---|---|---|---|
| How hungry do you feel? | 67 ± 20 | 60 ± 18 | 50 ± 18 | 60 ± 17 |
| How full do you feel? | 31 ± 22 | 29 ± 19 | 42 ± 22 | 40 ± 21 |
| How much do you think you can eat? | 62 ± 15 | 55 ± 15 | 51 ± 14 | 47 ± 15 a |
| How tired are you? | 42 ± 14 | 49 ± 16 | 66 ± 11 a,b | 77 ± 15 a,b |
| ∆ Acylated Ghrelin | ∆ Insulin | ∆ Glucose | ||||
|---|---|---|---|---|---|---|
| ∆ Cortisol | r | p | r | p | r | p |
| ∆ Rest to Camp2 | −0.365 | 0.220 | −0.510 | 0.075 | 0.147 | 0.631 |
| ∆ Regular to Camp2 | −0.705 | 0.007 * | −0.136 | 0.657 | 0.109 | 0.722 |
| ∆ Camp1 to Camp2 | −0.575 | 0.040 * | −0.213 | 0.485 | 0.289 | 0.339 |
© 2017 by the authors. Licensee MDPI, Basel, Switzerland. This article is an open access article distributed under the terms and conditions of the Creative Commons Attribution (CC BY) license (http://creativecommons.org/licenses/by/4.0/).
Share and Cite
Oshima, S.; Takehata, C.; Sasahara, I.; Lee, E.; Akama, T.; Taguchi, M. Changes in Stress and Appetite Responses in Male Power-Trained Athletes during Intensive Training Camp. Nutrients 2017, 9, 912. https://doi.org/10.3390/nu9080912
Oshima S, Takehata C, Sasahara I, Lee E, Akama T, Taguchi M. Changes in Stress and Appetite Responses in Male Power-Trained Athletes during Intensive Training Camp. Nutrients. 2017; 9(8):912. https://doi.org/10.3390/nu9080912
Chicago/Turabian StyleOshima, Satomi, Chisato Takehata, Ikuko Sasahara, Eunjae Lee, Takao Akama, and Motoko Taguchi. 2017. "Changes in Stress and Appetite Responses in Male Power-Trained Athletes during Intensive Training Camp" Nutrients 9, no. 8: 912. https://doi.org/10.3390/nu9080912
APA StyleOshima, S., Takehata, C., Sasahara, I., Lee, E., Akama, T., & Taguchi, M. (2017). Changes in Stress and Appetite Responses in Male Power-Trained Athletes during Intensive Training Camp. Nutrients, 9(8), 912. https://doi.org/10.3390/nu9080912