Reported Dietary Intake and Food Sources of Zinc, Selenium, and Vitamins A, E and C in the Spanish Population: Findings from the ANIBES Study †

 ,
, 
 , ,
, ,  ,
, 
Abstract
:1. Introduction
2. Materials and Methods
2.1. Sample
2.2. Food Record and Adequacy of Reported Intake
2.3. Evaluation of Misreporting
2.4. Statistical Analysis
3. Results
3.1. Zinc, Selenium, and Vitamins C, A (Retinol and Carotenes), and E Intake in the Whole Population
3.2. Zinc, Selenium, Retinol, Carotenes, and Vitamins A, C and E Reported Intake in Plausible Energy Reporters
3.3. Disparity between Reported Intake and the Level Needed for Adequacy for Zinc, Selenium, and Vitamins C, A (Retinol and Carotenes), and E in the Whole Population and in the Plausible Energy Reporters
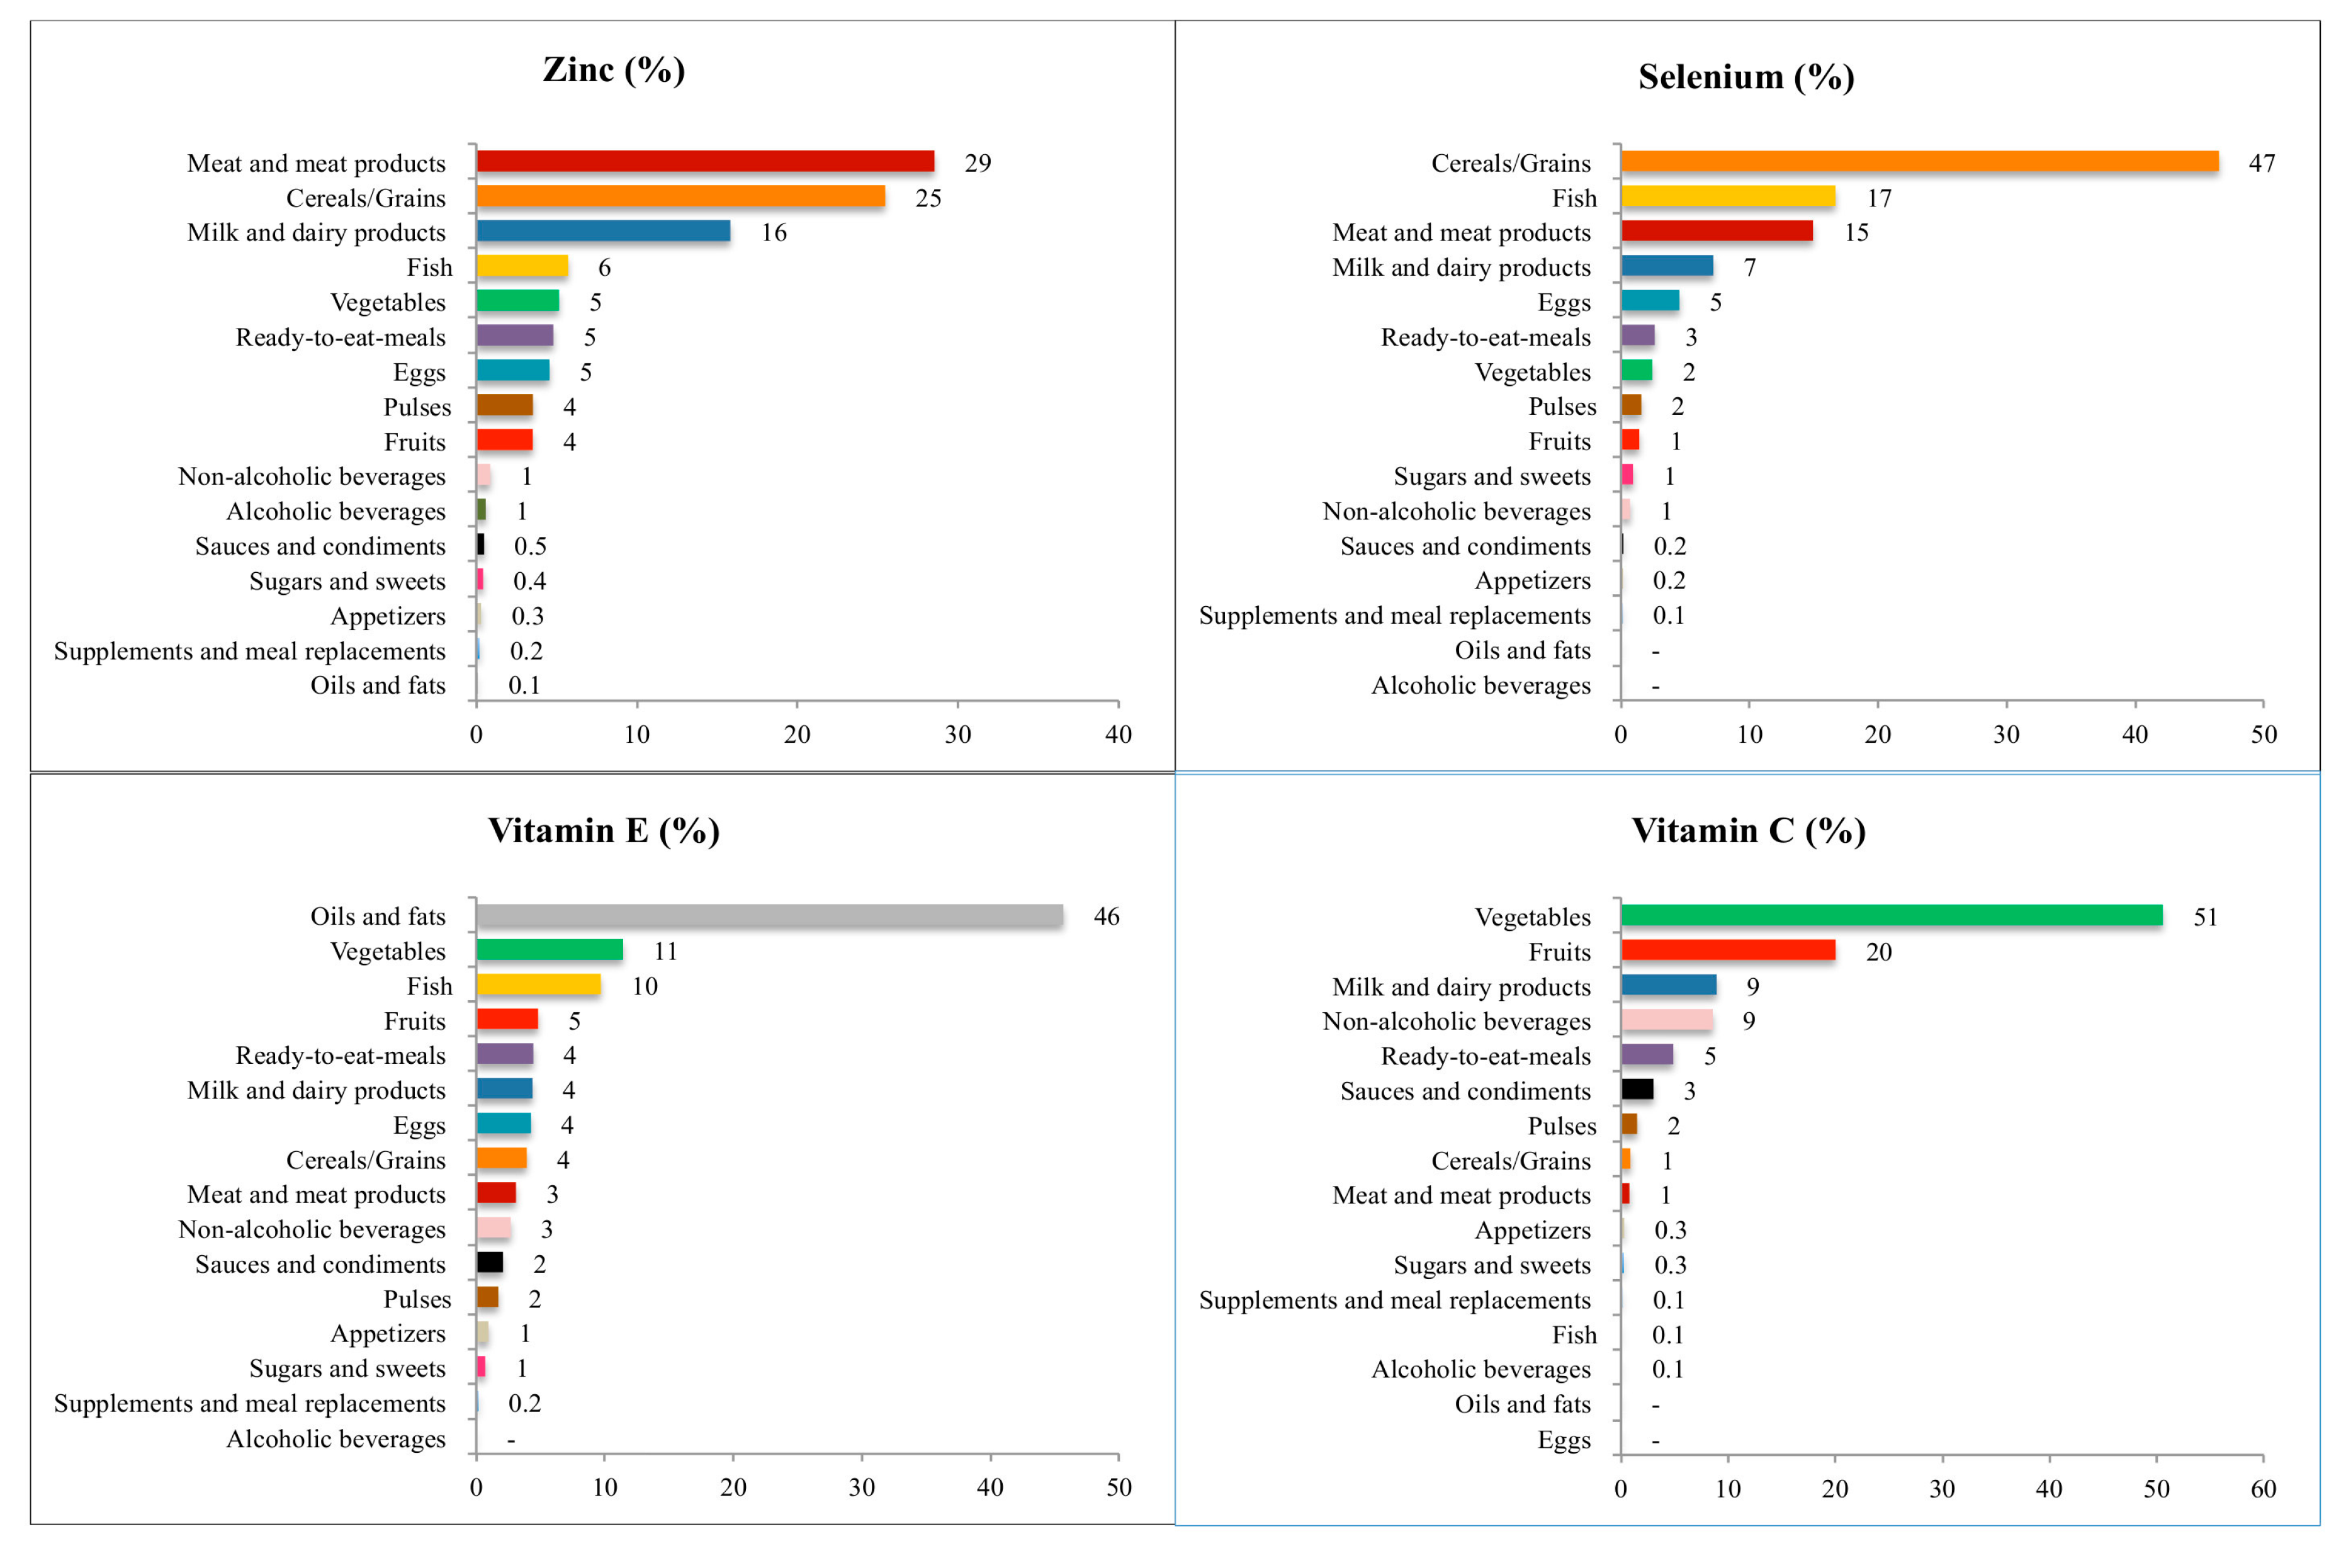
3.4. Contribution of the Food and Beverages to Zinc, Selenium, Retinol, Carotenes and Vitamins A, C and E Intakes
3.4.1. Zinc
3.4.2. Selenium
3.4.3. Vitamin E
3.4.4. Vitamin C
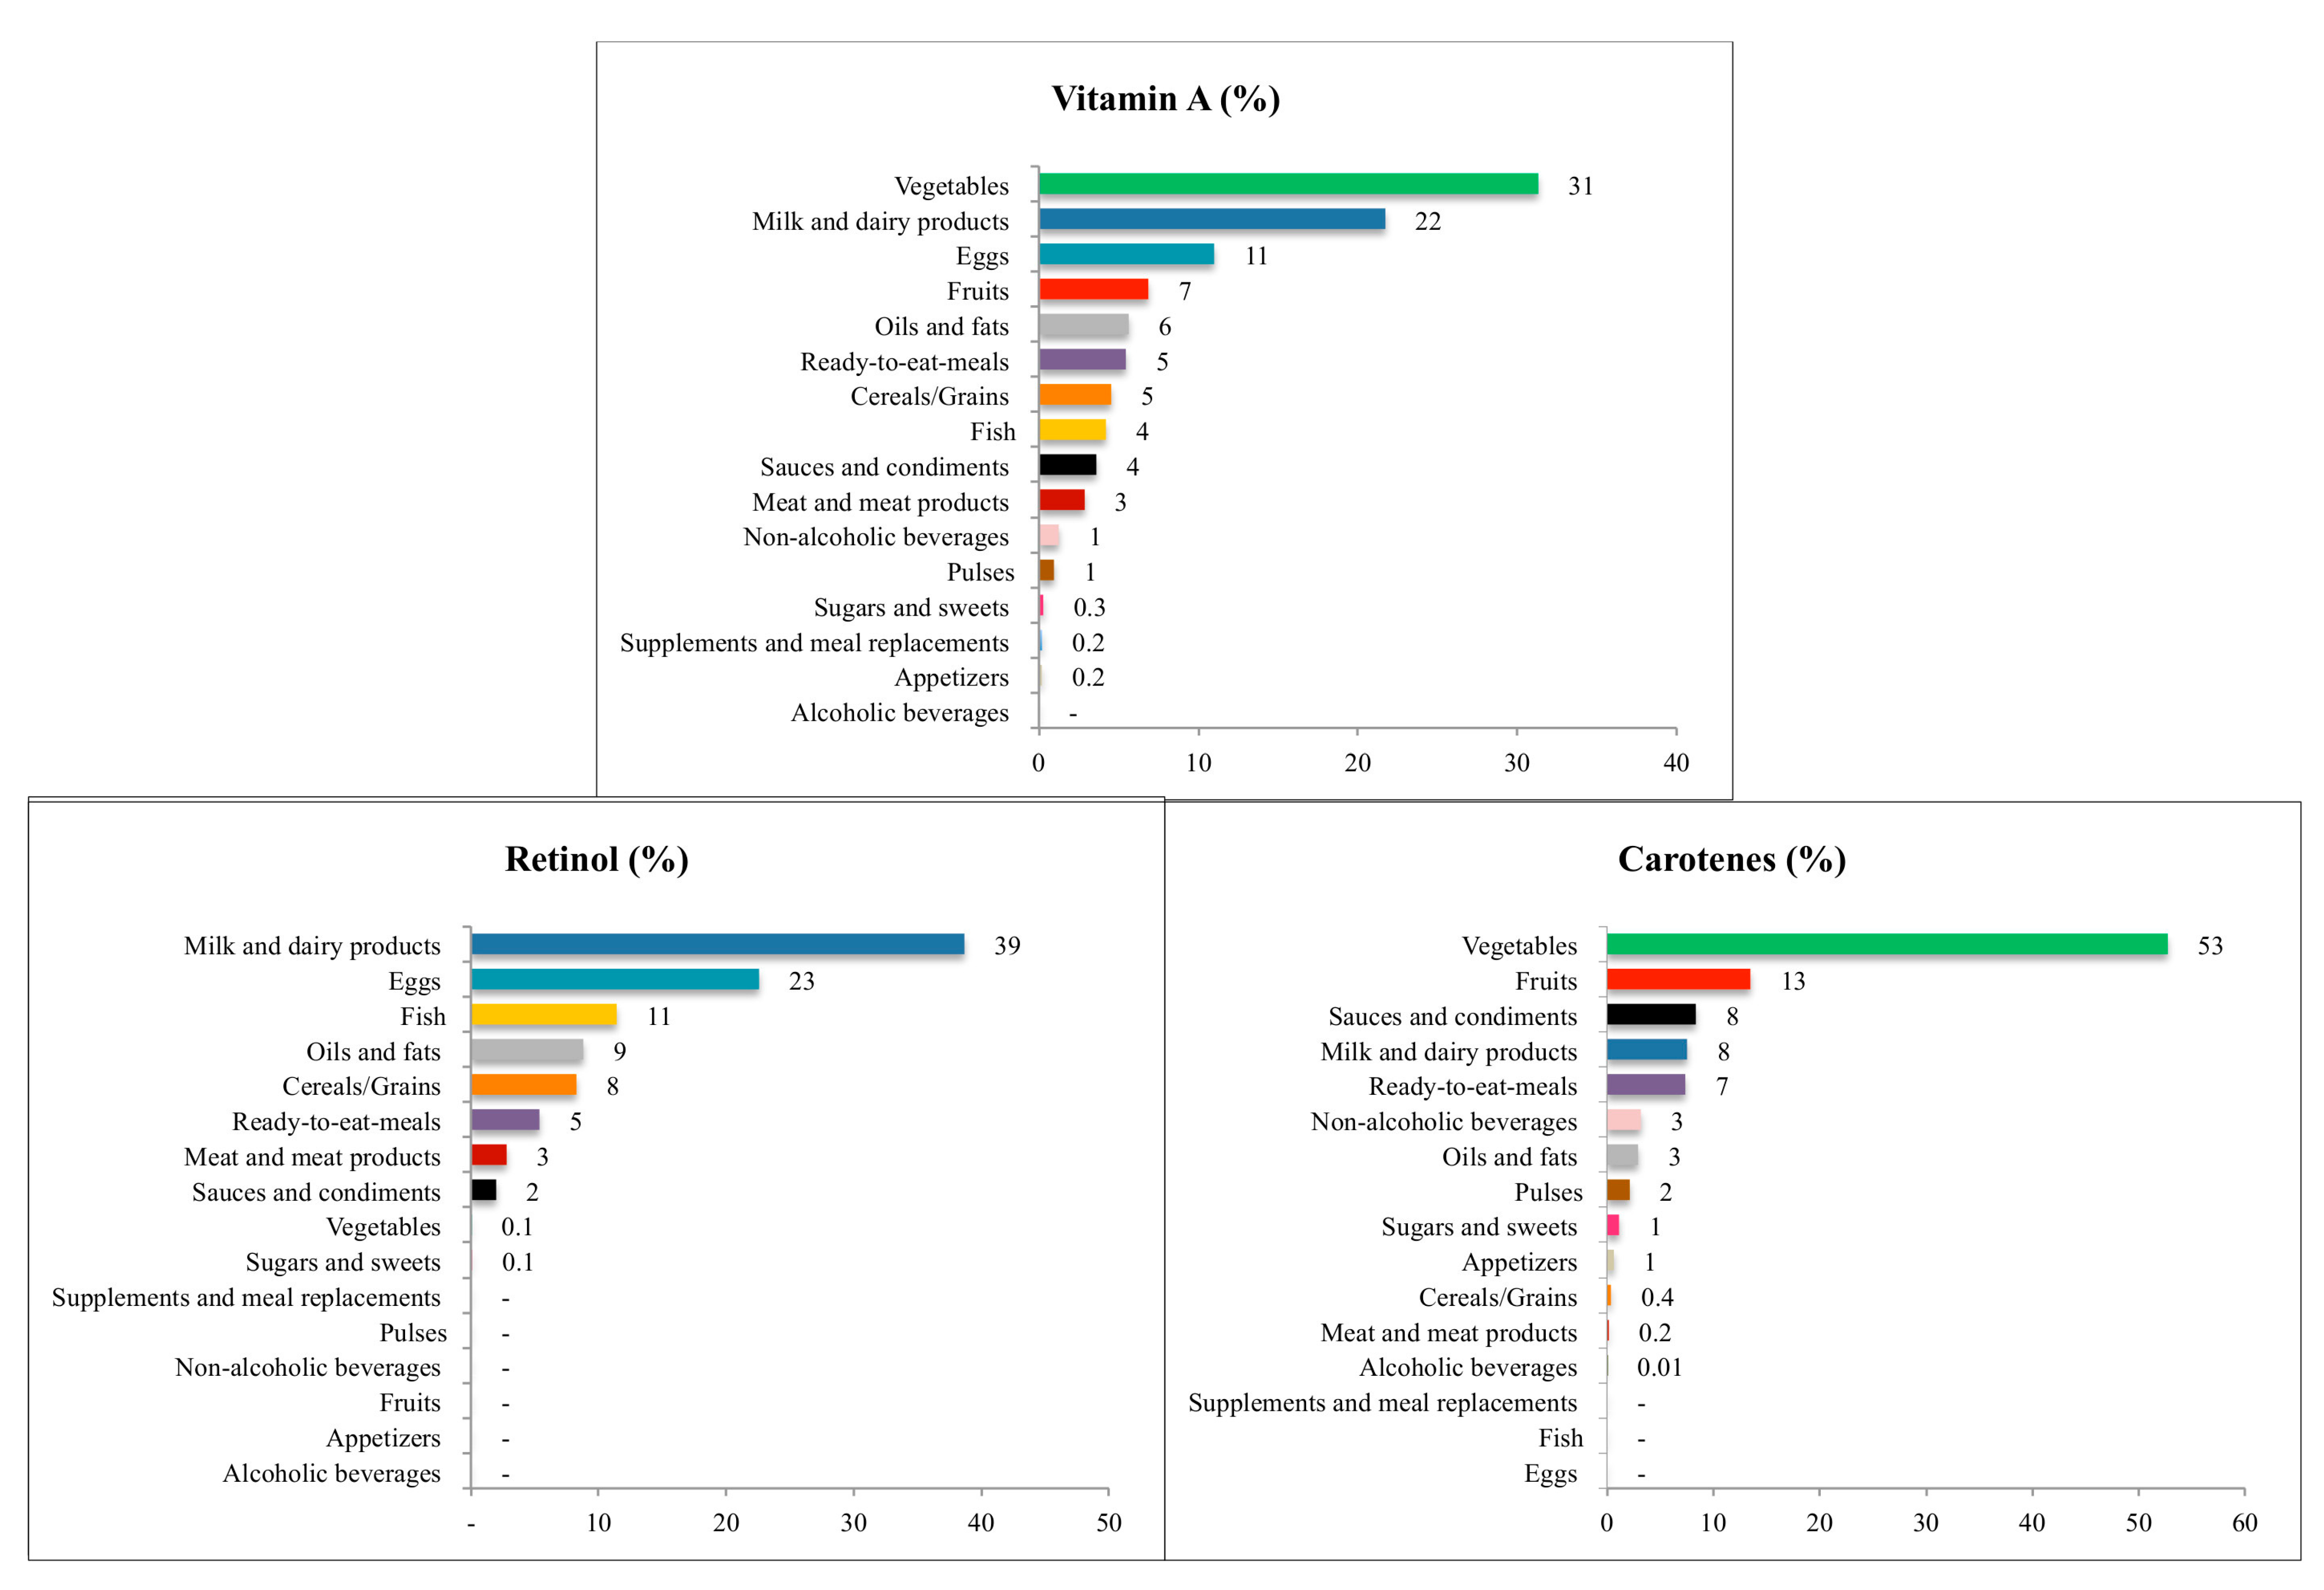
3.4.5. Retinol
3.4.6. Carotenes
3.4.7 Vitamin A
4. Discussion
5. Conclusions
Supplementary Materials
Acknowledgments
Author Contributions
Conflicts of Interest
References
- World Health Organization (WHO). Global Status Report on Noncommunicables Diseases. 2014. Available online: http://apps.who.int/iris/bitstream/10665/148114/1/9789241564854_eng.pdf?ua=1 (accessed on 10 December 2016).
- Ezzati, M.; Riboli, E. Behavioral and dietary risk factors for noncommunicable diseases. N. Engl. J. Med. 2013, 369, 954–964. [Google Scholar] [CrossRef] [PubMed]
- Ríos-Hoyo, A.; Cortés, M.J.; Ríos-Ontiveros, H.; Meaney, E.; Ceballos, G.; Gutiérrez-Salmeán, G. Obesity, metabolic syndrome, and dietary therapeutical approaches with a special focus on nutraceuticals (polyphenols): A Mini-Review. Int. J. Vitam. Nutr. Res. 2014, 84, 113–123. [Google Scholar] [CrossRef] [PubMed]
- Elmadfa, I.; Meyer, A.L. Importance of food composition data to nutrition and public health. Eur. J. Clin. Nutr. 2010, 64 (Suppl. 3), S4–S7. [Google Scholar] [CrossRef] [PubMed]
- King, J.C.; Brown, K.H.; Gibson, R.S.; Krebs, N.F.; Lowe, N.M.; Siekmann, J.H.; Raiten, D.J. Biomarkers of nutrition for development (bond)-zinc review. J. Nutr. 2016, 146, 858S–885S. [Google Scholar] [CrossRef] [PubMed]
- King, J.C.; Cousins, R. Zinc. In Modern Nutrition in Health and Disease; Ross, A.C., Caballero, B., Cousins, R.J., Tucker, K.L., Ziegler, T.R., Eds.; Lippincott Williams & Wilkins: Philadelphia, PN, USA, 2014; pp. 189–205. [Google Scholar]
- Burk, R.F.; Hill, K.E. Regulation of selenium metabolism and transport. Annu. Rev. Nutr. 2015, 35, 109–134. [Google Scholar] [CrossRef] [PubMed]
- EFSA Panel on Dietetic Products, Nutrition and Allergies (NDA). Scientific Opinion on Dietary Reference Values for vitamin A. EFSA J. 2015, 13. [Google Scholar] [CrossRef]
- Álvarez, R.; Vaz, B.; Gronemeyer, H.; de Lera, Á.R. Functions, therapeutic applications, and synthesis of retinoids and carotenoids. Chem. Rev. 2014, 114, 1–125. [Google Scholar] [CrossRef] [PubMed]
- Albahrani, A.A.; Greaves, R.F. Fat-soluble vitamins: clinical indications and current challenges for chromatographic measurement. Clin. Biochem. Rev. 2016, 37, 27–47. [Google Scholar] [PubMed]
- European Food Safety Authority (EFSA). Scientific Opinion on Dietary Reference Values for vitamin C. EFSA Panel on Dietetic Products, Nutrition and Allergies (NDA). EFSA J. 2013, 11, 3418. [Google Scholar]
- Archer, E.; Hand, GA.; Blair, SN. Validity of U.S. nutritional surveillance: National Health and Nutrition Examination Survey caloric energy intake data, 1971–2010. PLoS ONE 2013, 8, e76632. [Google Scholar] [CrossRef]
- Varela Moreiras, G.; Ávila, J.M.; Ruiz, E. Energy balance, a new paradigm and methodological issues: The ANIBES study in Spain. Nutr. Hosp. 2015, 31, 101–112. [Google Scholar] [PubMed]
- Ruiz, E.; Ávila, J.M.; del Pozo, S.; Rodriguez, P.; Aranceta Bartrina, J.; Gil, A.; González-Gross, M.; Ortega, R.M.; Serra-Majem, L.; Varela-Moreiras, G. Macronutrient distribution and dietary sources in the spanish population: Findings from the ANIBES Study. Nutrients 2016, 8, 177. [Google Scholar] [CrossRef] [PubMed]
- Olza, J.; Aranceta Bartrina, J.; González-Gross, M.; Ortega, R.M.; Serra-Majem, L.; Varela-Moreiras, G.; Gil, A. Reported dietary intake, disparity between the reported consumption and the level needed for adequacy and food sources of calcium, phosphorus, magnesium and vitamin D in the Spanish population: Findings from the ANIBES study. Nutrients 2017, 9, 168. [Google Scholar] [CrossRef] [PubMed]
- Samaniego-Vaesken, M.L.; Partearroyo, T.; Olza, J.; Aranceta-Bartrina, J.; Gil, A.; González-Gross, M.; Ortega, R.M.; Serra-Majem, L.; Varela-Moreiras, G. Iron intake and dietary sources in the spanish population: Findings from the ANIBES Study. Nutrients 2017, 9, 203. [Google Scholar] [CrossRef] [PubMed]
- Ruiz, E.; Ávila, J.M.; Castillo, A.; Valero, T.; del Pozo, S.; Rodriguez, P.; Aranceta-Bartrina, J.; Gil, A.; González-Gross, M.; Ortega, R.M.; et al. The ANIBES study on energy balance in Spain: Design, Protocol and Methodology. Nutrients 2015, 7, 970–998. [Google Scholar] [CrossRef] [PubMed]
- Nissensohn, M.; Sánchez-Villegas, A.; Ortega, R.M.; Aranceta-Bartrina, J.; Gil, Á.; González-Gross, M.; Varela-Moreiras, G.; Serra-Majem, L. Beverage consumption habits and association with total water and energy intakes in the spanish population: Findings of the ANIBES Study. Nutrients 2016, 8, 232. [Google Scholar] [CrossRef] [PubMed]
- Moreiras, O.; Carbajal, A.; Cabrera, L.; Cuadrado, C. Tablas de Composición de Alimentos/Guía de Prácticas, 16th ed.; Ediciones Pirámide: Madrid, Spain, 2013; pp. 154–196. (In Spanish) [Google Scholar]
- Carbajal, Á. Ingestas Recomendadas de Energía y Nutrientes. In Nutrición y Dietética; Revisited 2013; García-Arias, M.T., García-Fernández, M.C., Eds.; Secretariado de Publicaciones y Medios Audiovisuales, Universidad de León: León, Spain, 2003; pp. 1–26. Available online: https://www.ucm.es/data/cont/docs/458-2013-07-24-CARBAJAL-IR-2003-ISBN-84-9773-023-2-rev2013.pdf (accessed on 15 October 2016).
- European Food Safety Authority (EFSA). Dietary Reference Values and Dietary Guidelines. Available online: https://www.efsa.europa.eu/en/topics/topic/drv (accessed on 13 September 2016).
- European Food Safety Authority (EFSA). Example of a Protocol for Identification of Misreporting (Under- and Over-Reporting of Energy Intake) Based on the PILOT-PANEU Project. Available online: http://www.efsa.europa.eu/sites/default/files/efsa_rep/blobserver_assets/3944A-8-2-1.pdf (accessed on 10 February 2016).
- Schofield, W.N. Predicting basal metabolic rate, new standards and review of previous work. Hum. Nutr. Clin. Nutr. 1985, 39 (Suppl. 1), 5–41. [Google Scholar] [PubMed]
- Mielgo-Ayuso, J.; Aparicio-Ugarriza, R.; Castillo, A.; Ruiz, E.; Ávila, J.M.; Aranceta Bartrina, J.; Gil, A.; Ortega, R.M.; Serra-Majem, L.; Varela-Moreiras, G.; et al. Physical Activity patterns of the spanish population are mostly determined by sex and age: Findings in the ANIBES Study. PLoS ONE 2016, 11, e0149969. [Google Scholar] [CrossRef] [PubMed]
- Jansen, E.; Ruskovska, T. Serum biomarkers of (anti) oxidant status for epidemiological studies. Int. J. Mol. Sci. 2015, 16, 27378–27390. [Google Scholar] [CrossRef] [PubMed]
- Archer, E.; Pavela, G.; Lavie, C.J. The inadmissibility of what we eat in America and NHANES dietary data in nutrition and obesity research and the scientific formulation of national dietary guidelines. Mayo Clin. Proc. 2015, 90, 911–926. [Google Scholar] [CrossRef] [PubMed]
- Archer, E.; Pavela, G.; Lavie, C.J. A discussion of the refutation of memory-based dietary assessment methods (m-bms): The rhetorical defense of pseudoscientific and inadmissible evidence. Mayo Clin. Proc. 2015, 90, 1736–1739. [Google Scholar] [CrossRef] [PubMed]
- European Food Safety Authority (EFSA). Guidance on the EU Menu methodology. EFSA J. 2014, 12, 3944. [Google Scholar]
- Varela-Moreiras, G.; Ruiz, E.; Valero, T.; Avila, J.M.; del Pozo, S. The Spanish diet: An update. Nutr. Hosp. 2013, 28 (Suppl. 5), 13–20. [Google Scholar] [PubMed]
- López-Sobaler, A.M.; Aparicio, A.; González-Rodríguez, L.G.; Cuadrado-Soto, E.; Rubio, J.; Marcos, V.; Sanchidrián, R.; Santos, S.; Pérez-Farinós, N.; Dal Re, M.Á.; et al. Adequacy of usual vitamin and mineral intake in spanish children and adolescents: ENALIA study. Nutrients 2017, 9, 131. [Google Scholar] [CrossRef] [PubMed]
- Agencia Española de Seguridad Alimentaria y Nutrición (AESAN). Encuesta Nacional de Ingesta Dietética Española 2011. Available online: http://www.laboratoriolcn.com/f/docs/Valoracion_nutricional_ENIDE_micronutrientes.pdf (accessed on 30 September 2016).
- Mensink, G.B.; Fletcher, R.; Gurinovic, M.; Huybrechts, I.; Lafay, L.; Serra-Majem, L.; Szponar, L.; Tetens, I.; Verkaik-Kloosterman, J.; Baka, A.; et al. Mapping low intake of micronutrients across Europe. Br. J. Nutr. 2013, 110, 755–773. [Google Scholar] [CrossRef] [PubMed]
- Max Rubner-Institut. Nationale Verzehrsstudie II. In Ergebnisbericht Teil 2. Die bundesweite Befragung zur Ernährung von Jugendlichen und Erwachsenen; Max Rubner-Institut: Karlsruhe, Germany, 2008; Chapter 5. (In German) [Google Scholar]
- Lyhne, N.; Christensen, T.; Groth, M.V.; Fagt, S.; Biltoft-Jensen, A.; Hartkopp, H.; Hinsch, H.J.; Matthiessen, J.; Møller, A.; Saxholt, E.; et al. Danskernes Kostvaner 2000–2002—Hovedresultater [Dietary Habits of Denmark 2000–2002]; Danmarks Fødevare-Forskning: Søborg, Denmark, 2005. (In Danish) [Google Scholar]
- Paturi, M.; Tapanainen, H.; Reinivuo, H.; Pietinen, P. The National FINDIET 2007 Survey; National Public Health Institute: Helsinki, Finland, 2008. [Google Scholar]
- Peltonen, M.; Harald, K.; Männistö, S.; Saarikoski, L.; Peltomäki, P.; Lund, L.; Sundvall, J.; Juolevi, A.; Laatikainen, T.; Aldén-Nieminen, H.; et al. The National FINRISK 2007 Study; B34/2008; National Public Health Institute: Helsinki, Finland, 2008. [Google Scholar]
- Turrini, A.; Saba, A.; Perrone, D.; Cialfa, E.; D’Amicis, A. Food consumption patterns in Italy: The INNCA Study 1994–1996. Eur. J. Clin. Nutr. 2001, 55, 571–588. [Google Scholar] [CrossRef] [PubMed]
- Becker, W.; Pearson, M. Riksmaten 1997–1998. Dietary Habits and Nutrient Intake in Sweden 1997–1998 (In Swedish/English Summary); Livsmedelsverket: Uppsala, Sweden, 2002. [Google Scholar]
- Harrington, J.; Perry, I.; Lutomski, J.; Morgan, K.; McGee, H.; Shelley, E.; Watson, D.; Barry, M. SLÁN 2007: Survey of Lifestyle, Attitudes and Nutrition in Ireland; Dietary Habits of the Irish Population, Department of Health and Children; The Stationery Office: Dublin, Ireland, 2008. [Google Scholar]
- Hulshof, K.F.A.M.; Ocke, M.C.; van Rossum, C.T.M.; Buurma-Rethans, E.J.M.; Brants, H.A.M.; Drijvers, J.J.M.M.; ter Doest, D. Resultaten van de Voedselconsumptiepeiling 2003. In Results of the National Food Consumption Survey 2003; RIVM Report 350030002; RIVM: Bilthoven, The Netherlands, 2004; Available online: http://www.rivm.nl/bibliotheek/rapporten/350030002.html (accessed on 17 October 2016).
- Henderson, L.; Irving, K.; Gregory, J.; Bates, C.J.; Prentice, A.; Swan, G.; Farron, M. Vitamin and Mineral Intake and Urinary Analyses. In The National Diet and Nutrition Survey: Adults Aged 19 to 64 Year; The Stationery Office: London, UK, 2003; Volume 3, pp. 154–196. [Google Scholar]
- Serra-Majem, L.; Ribas, L.; Pérez-Rodrigo, C.; García-Closas, R.; Peña-Quintana, L.; Aranceta, J. Determinants of nutrient intake among children and adolescents: results from the enKid study. Ann. Nutr. Metab. 2002, 46 (Suppl. 1), 31–38. [Google Scholar] [CrossRef] [PubMed]
- Mensink, G.B.; Beitz, R. Food and nutrient intake in East and West Germany, 8 years after the reunification —The German Nutrition Survey 1998. Eur. J. Clin. Nutr. 2004, 58, 1000–1010. [Google Scholar] [CrossRef] [PubMed]
- Szponar, L.; Sekuła, W.; Rychlik, E.; Ołtarzewski, M.; Figurska, K. Badania Indywidualnego Spozycia Zywnosci i Stanu Odzywienia w Gospodarstwach Domowych (Household Food Consumption and Anthropometric Survey); Instytut Zywnosci i Zywienia (National Food and Nutrition Institute): Warsaw, Poland, 2003. (In Polish) [Google Scholar]
- Dubuisson, C.; Lioret, S.; Touvier, M.; Dufour, A.; Calamassi-Tran, G.; Volatier, J.L.; Lafay, L. Trends in food and nutritional intakes of French adults from 1999 to 2007: Results from the INCA surveys. Br. J. Nutr. 2010, 103, 1035–1048. [Google Scholar] [CrossRef] [PubMed]
- Agence Française de Sécurité Sanitaire des Aliments (AFSSA). Étude Individuelle Nationale des Consommations Alimentaires 2 (INCA 2) (2006–2007); Rapport 228; AFSSA: Maisons-Alfort, France, 2009. (In French) [Google Scholar]
- Nicholson, S.K.; Roberts, C.; Prynne, C.J.; Pot, G.K.; Olson, A.; Fitt, E.; Cole, D.; Teucher, B.; Bates, B.; Henderson, H.; et al. National diet and nutrition survey: UK food consumption and nutrient intakes from the first year of the rolling programme and comparisons with previous surveys. Br. J. Nutr. 2011, 106, 1899–1914. [Google Scholar]
- Food, D.T.U. Danskernes Kostvaner 2003–2008 (Dietary Habits in Denmark 2003–2008); Danmarks Fødevareforskning: Søborg, Denmark, 2010. (In Danish) [Google Scholar]
- Elmadfa, I. European Nutrition and Health Report 2009; Karger Medical and Scientific Publishers: Basel, Switzerland, 2009; Volume 55, pp. 1–40. [Google Scholar]
- Kjøller, M.; Juel, K.; Kamper-Jørgensen, F. (Eds.) Folkesundhedsrapporten, Danmark 2007 [The Report on Public Health, Denmark 2007]; Statens Institut for Folkesundhed: Copenhagen, Denmark, 2007. (In Danish) [Google Scholar]
- Mendez, M.A.; Popkin, B.M.; Buckland, G.; Schroder, H.; Amiano, P.; Barricarte, A.; Huerta, J.M.; Quirós, J.R.; Sánchez, M.J.; González, C.A. Alternative methods of accounting for underreporting and overreporting when measuring dietary intake-obesity relations. Am. J. Epidemiol. 2011, 173, 448–458. [Google Scholar] [CrossRef] [PubMed]
- Poslusna, K.; Ruprich, J.; de Vries, J.H.; Jakubikova, M.; van’t Veer, P. Misreporting of energy and micronutrient intake estimated by food records and 24 h recalls, control and adjustment methods in practice. Br. J. Nutr. 2009, 101 (Suppl. 2), S73–S85. [Google Scholar] [CrossRef] [PubMed]

| Misreporting Cut-Off | ||||
|---|---|---|---|---|
| Group Level | Individual Level | |||
| PAL | Lower | Upper | Lower | Upper |
| Children and adolescents | ||||
| 1.6 | 1.55 | 1.66 | 0.93 | 2.76 |
| 1.8 | 1.73 | 1.86 | 1.04 | 3.10 |
| 2.0 | 1.93 | 2.07 | 1.16 | 3.45 |
| Adults and elderly | ||||
| 1.4 | 1.38 | 1.42 | 0.77 | 2.53 |
| 1.6 | 1.58 | 1.62 | 0.88 | 2.89 |
| 1.8 | 1.77 | 2.83 | 1.00 | 3.25 |
| Total | Children 9–12 Years | Adolescents 13–17 Years | Adults 18–64 Years | Elderly 65–75 Years | |||||||||||
|---|---|---|---|---|---|---|---|---|---|---|---|---|---|---|---|
| n | Mean ± SEM | Median (Range) | n | Mean ± SEM | Median (Range) | n | Mean ± SEM | Median (Range) | n | Mean ± SEM | Median (Range) | n | Mean ± SEM | Median (Range) | |
| ZINC (mg/day) | |||||||||||||||
| Total | 2009 | 8.1 ± 0.1 | 7.7 (2.3–27.3) | 213 | 8.3 ± 0.1 a | 8.2 (3.7–17.3) | 211 | 8.6 ± 0.2 a | 8.3 (2.9–18.6) | 1655 | 8.2 ± 0.1 a | 7.7 (2.3–27.3) | 206 | 7.4 ± 0.2 b | 7.1 (3.1–20.0) |
| Men | 1013 | 8.8 ± 0.1 * | 8.4 (2.3–27.3) | 126 | 8.6 ± 0.2 * | 8.2 (3.7–17.3) | 137 | 9.2 ± 0.2 * | 8.7 (2.9–18.6) | 798 | 8.9 ± 0.1 * | 8.6 (2.3–27.3) | 99 | 8.1 ± 0.3 * | 7.5 (3.7–20.0) |
| Women | 996 | 7.4 ± 0.1 | 7.2 (2.9–19.5) | 87 | 7.8 ± 0.2 | 7.6 (4.3–12.5) | 74 | 7.4 ± 0.3 | 7.5 (3.6–13.5) | 857 | 7.5 ± 0.1 | 7.2 (2.9–19.5) | 107 | 6.8 ± 0.2 | 6.8 (3.1–12.3) |
| SELENIUM (µg/day) | |||||||||||||||
| Total | 2009 | 75 ± 1 | 72 (14–265) | 213 | 77 ± 2 a | 76 (9–180) | 211 | 80 ± 2 a | 77 (26–164) | 1655 | 76 ± 1 a | 72 (14–265) | 206 | 70 ± 2 b | 65 (23–221) |
| Men | 1013 | 81 ± 1 * | 77 (20–188) | 126 | 79 ± 2 | 76 (9–180) | 137 | 85 ± 2 * | 81 (26–164) | 798 | 82 ± 1 * | 79 (20–198) | 99 | 75 ± 3 * | 70 (28–221) |
| Women | 996 | 69 ± 1 | 67 (14–265) | 87 | 74 ± 2 | 75 (24–140) | 74 | 71 ± 3 | 67 (30–150) | 857 | 70 ± 1 | 67 (134–265) | 107 | 64 ± 2 | 61 (23–144) |
| VITAMIN A (µg RE/day) | |||||||||||||||
| Total | 2009 | 668 ± 19 | 477 (2–11,017) | 213 | 664 ± 43 | 496 (79–5991) | 211 | 570 ± 33 | 426 (108–3434) | 1655 | 672 ± 21 | 479 (2–11,017) | 206 | 658 ± 61 | 489 (78–7796) |
| Men | 1013 | 691 ± 29 | 478 (38–11,017) | 126 | 702 ± 51 | 531 (79–3196) | 137 | 582 ± 42 | 446 (109–3434) | 798 | 697 ± 34 | 484 (38–11,017) | 99 | 708 ± 104 | 475 (96–7796) |
| Women | 996 | 644 ± 24 | 474 (2–7505) | 87 | 609 ± 75 | 427 (120–5991) | 74 | 546 ± 53 | 383 (108–2831) | 857 | 650 ± 26 | 474 (2–7505) | 107 | 612 ± 67 | 492 (78–6584) |
| RETINOL (µg/day) | |||||||||||||||
| Total | 2009 | 364 ± 18 | 187 (0–10,881) | 213 | 420 ± 42 a | 227 (18–5950) | 211 | 343 ± 29 a | 218 (0–2697) | 1655 | 363 ± 20 b | 186 (0–10,881) | 206 | 309 ± 57 c | 163 (3–7407) |
| Men | 1013 | 399 ± 28 * | 199 (0–10,881) | 126 | 461 ± 50 * | 262 (18–2802) | 137 | 359 ± 37 | 237 (0–2697) | 798 | 395 ± 33 * | 197 (0–10,881) | 99 | 361 ± 98 | 167 (3–7407) |
| Women | 996 | 327 ± 23 | 176 (0–7440) | 87 | 362 ± 75 | 211 (46–5950) | 74 | 312 ± 45 | 204 (21–2392) | 857 | 333 ± 25 | 177 (0–7440) | 107 | 261 ± 61 | 160 (9–6494) |
| CAROTENES (µg/day) | |||||||||||||||
| Total | 2009 | 1735 ± 35 | 1342 (13–13,962) | 213 | 1331 ± 78 a | 995 (42–6222) | 211 | 1254 ± 79 a | 882 (45–6805) | 1655 | 1760 ± 39 b | 1355 (13–13,962) | 206 | 2082 ± 122 c | 1618 (97–11,643) |
| Men | 1013 | 1652 ± 46 * | 1231 (14–10,960) | 126 | 1283 ± 102 | 980 (50–5754) | 137 | 1227 ± 100 | 873 (79–6197) | 798 | 1696 ± 54 | 1313 (14–10,960) | 99 | 2068 ± 151 | 1705 (123–6851) |
| Women | 996 | 1820 ± 51 | 1415 (13–13,962) | 87 | 1402 ± 121 | 1023 (42–6222) | 74 | 1303 ± 132 | 993 (45–6805) | 857 | 1819 ± 56 | 1419 (13–13,962) | 107 | 2095 ± 189 | 1528 (97–11,643) |
| VITAMIN E (mg α-TE/day) | |||||||||||||||
| Total | 2009 | 7.0 ± 0.1 | 6.3 (0.7–55.2) | 213 | 7.4 ± 0.3 a | 6.3 (0.7–27.6) | 211 | 7.5 ± 0.3 a | 6.4 (1.1–31.0) | 1655 | 7.1 ± 0.1 a | 6.5 (0.7–55.2) | 206 | 5.9 ± 0.2 b | 5.2 (1.7–16.6) |
| Men | 1013 | 7.3 ± 0.1 * | 6.5 (0.7–55.2) | 126 | 7.4 ± 0.4 | 6.1 (0.7–27.6) | 137 | 7.6 ± 0.4 | 6.5 (1.1–24.0) | 798 | 7.4 ± 0.2 * | 6.7 (0.9–55.2) | 99 | 6.3 ± 0.3 | 5.8 (1.8–16.6) |
| Women | 996 | 6.7 ± 0.1 | 6.1 (0.7–27.5) | 87 | 7.5 ± 0.4 | 6.6 (2.2–19.1) | 74 | 7.4 ± 0.6 | 6.3 (1.7–31.0) | 857 | 6.8 ± 0.1 | 6.3 (0.7–27.5) | 107 | 5.6 ± 0.3 | 4.9 (1.7–15.7) |
| VITAMIN C (mg/day) | |||||||||||||||
| Total | 2009 | 84.4 ± 1.4 | 71.3 (5.0–802.7) | 213 | 66.4 ± 3.2 a | 57.2 (6.9–258.3) | 211 | 61.6 ± 3.1 a | 49.3 (4.5–270.5) | 1655 | 84.8 ± 1.5 b | 71.8 (5.0–802.7) | 206 | 106.6 ± 4.8 c | 94.6 (14.5–478.8) |
| Men | 1013 | 83.2 ± 2.0 * | 68.9 (5.0–802.7) | 126 | 65.1 ± 3.7 | 56.6 (6.9–210.6) | 137 | 62.6 ± 4.1 | 48.3 (4.5–270.5) | 798 | 85.2 ± 2.3 | 72.0 (5.0–802.7) | 99 | 109.4 ± 7.3 | 96.6 (16.2–410.6) |
| Women | 996 | 85.6 ± 1.9 | 72.8 (8.0–788.6) | 87 | 68.3 ± 5.5 | 58.5 (11.8–258.3) | 74 | 59.9 ± 4.7 | 50.6 (8.8–234.3) | 857 | 84.5 ± 2.0 | 71.8 (5.9–788.6) | 107 | 104.1 ± 6.2 | 91.6 (14.5–478.8) |
| Total | Children 9–12 Years | Adolescents 13–17 Years | Adults 18–64 Years | Elderly 65–75 Years | |||||||||||
|---|---|---|---|---|---|---|---|---|---|---|---|---|---|---|---|
| n | Mean ± SEM | Median (Range) | n | Mean ± SEM | Median (Range) | n | Mean ± SEM | Median (Range) | n | Mean ± SEM | Median (Range) | n | Mean ± SEM | Median (Range) | |
| ZINC (mg/day) | |||||||||||||||
| Total | 2009 | 8.1 ± 0.1 | 7.7 (2.3–27.3) | 213 | 8.3 ± 0.2 | 8.2 (3.7–17.3) | 211 | 8.6 ± 0.2 | 8.3 (2.9–18.6) | 1655 | 8.2 ± 0.1 | 7.7 (2.3–27.3) | 206 | 7.4 ± 0.2 | 7.1 (3.1–20.0) |
| Plausible energy reporters | 543 | 9.8 ± 0.1 * | 9.5 (4.9–23.0) | 120 | 9.0 ± 0.2 * | 9.0 (5.4–14.5) | 76 | 10.3 ± 0.3 * | 9.9 (4.9–16.7) | 433 | 10.0 ± 0.1 * | 9.7 (5.2–23.0) | 45 | 9.5 ± 0.4 * | 9.1 (5.4–20.0) |
| Men | 232 | 11.0 ± 0.2 § | 10.7 (5.4–23.0) | 68 | 9.4 ± 0.2 | 9.1 (6.5–14.5) | 48 | 11.0 ± 0.3 | 10.9 (7.2–16.7) | 158 | 11.6 ± 0.2 | 11.3 (5.8–23.0) | 24 | 10.2 ± 0.7 | 9.6 (5.4–20.0) |
| Women | 311 | 8.9 ± 0.1 † | 8.6 (4.9–19.5) | 52 | 8.6 ± 0.3 | 8.8 (5.4–12.5) | 28 | 9.0 ± 0.4 | 8.7 (4.9–13.5) | 275 | 9.0 ± 0.1 | 8.7 (5.2–19.5) | 21 | 8.7 ± 0.4 | 8.4 (6.3–12.3) |
| Non-Plausible energy reporters | 1466 | 7.5 ± 0.1 | 7.1 (2.3–27.3) | 93 | 7.3 ± 0.2 | 7.1 (3.7–17.3) | 135 | 7.6 ± 0.2 | 7.6 (2.9–18.6) | 1222 | 7.5 ± 0.1 | 7.2 (2.3–27.3) | 161 | 6.9 ± 0.2 | 6.74 (3.1–17.8) |
| Men | 781 | 8.2 ± 0.1 | 7.8 (2.3–27.3) | 58 | 7.6 ± 0.3 | 7.3 (3.7–17.3) | 89 | 8.2 ± 0.2 | 8.0 (2.9–18.6) | 640 | 8.2 ± 0.1 | 7.9 (2.3–27.3) | 75 | 7.4 ± 0.3 | 7.1 (3.7–17.8) |
| Women | 685 | 6.7 ± 0.1 | 6.6 (2.9–19.2) | 35 | 6.7 ± 0.3 | 6.6 (4.3–11.6) | 46 | 6.5 ± 0.2 | 6.2 (3.6–9.8) | 582 | 6.7 ± 0.1 | 6.6 (2.9–19.2) | 86 | 6.4 ± 0.2 | 6.4 (3.1–11.2) |
| SELENIUM (µg/day) | |||||||||||||||
| Total | 2009 | 75 ± 1 | 72 (14–265) | 213 | 77 ± 2 | 76 (9–180) | 211 | 80 ± 2 | 77 (26–164) | 1655 | 76 ± 1 | 72 (14–265) | 206 | 70 ± 2 | 65 (23–221) |
| Plausible energy reporters | 543 | 90 ± 1 * | 87 (25–265) | 120 | 83 ± 2 * | 85 (39–180) | 76 | 96 ± 3 * | 91 (46–164) | 433 | 91 ± 2 * | 87 (25–265) | 45 | 93 ± 4 * | 85 (38–221) |
| Men | 232 | 101 ± 2 § | 95 (31–188) | 68 | 85 ± 3 | 86 (39–180) | 48 | 102 ± 4 | 98 (64–164) | 158 | 104 ± 2 | 100 (31–196) | 24 | 101 ± 7 | 96 (49–221) |
| Women | 311 | 82 ± 2 † | 78 (25–265) | 52 | 81 ± 3 | 79 (39–140) | 28 | 84 ± 5 | 79 (46–150) | 275 | 83 ± 2 | 87 (25–265) | 21 | 84 ± 5 | 83 (38–144) |
| Non-Plausible energy reporters | 1466 | 70 ± 1 | 67 (14–185) | 93 | 69 ± 2 | 64 (9–145) | 135 | 71 ± 2 | 68 (26–147) | 1222 | 70 ± 1 | 67 (14–172) | 161 | 63 ± 2 | 61 (23–185) |
| Men | 781 | 79 ± 1 | 71 (20–185) | 58 | 72 ± 4 | 63 (9–145) | 89 | 75 ± 3 | 72 (26–147) | 640 | 77 ± 1 | 73 (20–172) | 75 | 67 ± 3 | 63 (28–185) |
| Women | 685 | 63 ± 1 | 60 (14–166) | 35 | 65 ± 4 | 67 (24–99) | 46 | 64 ± 4 | 57 (30–139) | 582 | 63 ± 1 | 60 (14–166) | 86 | 59 ± 2 | 58 (23–117) |
| VITAMIN A (µg RE/day) | |||||||||||||||
| Total | 2009 | 668 ± 19 | 477 (2–11,017) | 213 | 664 ± 43 | 496 (79–5991) | 211 | 570 ± 33 | 426 (108–3434) | 1655 | 672 ± 21 | 479 (2–11,017) | 206 | 658 ± 61 | 489 (78–7796) |
| Plausible energy reporters | 543 | 790 ± 31 * | 609 (145–7796) | 120 | 724 ± 62 * | 576 (79–5991) | 76 | 685 ± 59 * | 567 (156–3434) | 433 | 779 ± 30 * | 611 (92–5864) | 45 | 1124 ± 209 * | 717 (173–7796) |
| Men | 232 | 860 ± 56 § | 626 (145–7796) | 68 | 756 ± 66 | 589 (79–2814) | 48 | 709 ± 74 | 567 (156–3434) | 158 | 866 ± 63 | 639 (146–5864) | 24 | 1133 ± 304 | 712 (268–7796) |
| Women | 311 | 737 ± 34 † | 600 (147–6584) | 52 | 681 ± 115 | 553 (143–5991) | 28 | 644 ± 100 | 563 (232–2831) | 275 | 729 ± 31 | 600 (92–3925) | 21 | 1115 ± 290 | 732 (173–6584) |
| Non-Plausible energy reporters | 1466 | 622 ± 23 | 425 (2–11,017) | 93 | 587 ± 58 | 384 (86–3196) | 135 | 504 ± 38 | 356 (108–2784) | 1222 | 635 ± 27 | 431 (2–11,017) | 161 | 527 ± 47 | 420 (78–6887) |
| Men | 781 | 641 ± 34 | 431 (38–11,017) | 58 | 638 ± 80 | 421 (86–3196) | 89 | 514 ± 49 | 375 (109–2728) | 640 | 655 ± 39 | 451 (38–11,017) | 75 | 571 ± 93 | 415 (96–6887) |
| Women | 685 | 601 ± 31 | 414 (2–7505) | 35 | 502 ± 77 | 364 (120–2676) | 46 | 489 ± 58 | 348 (108–2027) | 582 | 613 ± 36 | 413 (2–7505) | 86 | 489 ± 35 | 429 (78–1735) |
| RETINOL (µg/day) | |||||||||||||||
| Total | 2009 | 364 ± 18 | 187 (0–10,881) | 213 | 420 ± 42 | 227 (18–5959) | 211 | 343 ± 29 | 218 (0–2697) | 1655 | 363 ± 20 | 186 (0–10,881) | 206 | 309 ± 57 | 163 (3–7407) |
| Plausible energy reporters | 543 | 423 ± 29 * | 258 (21–7407) | 120 | 451 ± 62 * | 263 (38–5959) | 76 | 422 ± 51 * | 312 (54–2697) | 433 | 405 ± 27 * | 259 (21–5249) | 45 | 597 ± 212 * | 248 (62–7407) |
| Men | 232 | 491 ± 53 § | 285 (48–7407) | 68 | 483±63 | 278 (38–2594) | 48 | 433 ± 62 | 340 (80–2697) | 158 | 467 ± 57 | 282 (48–5246) | 24 | 633 ± 306 | 252 (65–7407) |
| Women | 311 | 372 ± 31 † | 225 (21–6494) | 52 | 409 ± 116 | 217 (91–5950) | 28 | 403 ± 90 | 227 (54–2392) | 275 | 369 ± 27 | 235 (21–3585) | 21 | 555 ± 298 | 228 (62–6494) |
| Non-Plausible energy reporters | 1466 | 341 ± 22 | 166 (0–10,881) | 93 | 381 ± 56 | 191 (18–2802) | 135 | 298 ± 34 | 187 (0–2672) | 1222 | 348 ± 26 | 168 (0–10,881) | 161 | 228 ± 41 | 143 (3–6242) |
| Men | 781 | 372 ± 33 | 178 (0–10,881) | 58 | 434 ± 78 | 214 (18–2802) | 89 | 320 ± 46 | 199 (0–2672) | 640 | 378 ± 38 | 182 (0–10,881) | 75 | 274 ± 85 | 147 (3–6242) |
| Women | 685 | 307 ± 30 | 149 (0–7440) | 35 | 293 ± 73 | 167 (46–2503) | 46 | 256 ± 47 | 169 (21–1726) | 582 | 315 ± 34 | 150 (0–7440) | 86 | 189 ± 20 | 141 (9–1055) |
| CAROTENES (µg/day) | |||||||||||||||
| Total | 2009 | 1735 ± 35 | 1342 (13–13,962) | 213 | 1331 ± 78 | 995 (42–6222) | 211 | 1254 ± 79 | 882 (45–6805) | 1655 | 1760 ± 39 | 1355 (13–13,962) | 206 | 2082 ± 122 | 1618 (97–11,643) |
| Plausible energy reporters | 543 | 2080 ± 75 * | 1644 (65–13,159) | 120 | 1472 ± 109 * | 1094 (145–6222) | 76 | 1468 ± 141 * | 1013 (45–5676) | 433 | 2119 ± 84 * | 1685 (65–13,159) | 45 | 3111 ± 348 * | 2574 (339–11,643) |
| Men | 232 | 2077 ± 118 § | 1601 (101–9795) | 68 | 1419 ± 144 | 1053 (145–5754) | 48 | 1561 ± 199 | 961 (101–5676) | 158 | 2250 ± 150 | 1754 (124–9795) | 24 | 2857 ± 361 | 2443 (687–6851) |
| Women | 311 | 2083 ± 98 † | 1678 (65–13,159) | 52 | 1542 ± 167 | 1122 (198–6222) | 28 | 1309 ± 174 | 1042 (45–3695) | 275 | 2044 ± 99 | 1649 (65–13,159) | 21 | 3402 ± 625 | 2659 (339–11,643) |
| Non-Plausible energy reporters | 1466 | 1607 ± 38 | 1237 (13–13,962) | 93 | 1149 ± 108 | 831 (42–4665) | 135 | 1133 ± 94 | 800 (62–6805) | 1222 | 1633 ± 43 | 1264 (13–13,962) | 161 | 1794 ± 113 | 1396 (97–8292) |
| Men | 781 | 1525 ± 48 | 1165 (14–10,960) | 58 | 1122 ± 143 | 810 (50–4665) | 89 | 1047 ± 105 | 777 (79–6197) | 640 | 1559 ± 54 | 1200 (14–10,960) | 75 | 1815 ± 153 | 1550 (123–6517) |
| Women | 685 | 1700 ± 59 | 1339 (13–13,962) | 35 | 1194 ± 165 | 960 (42–4656) | 46 | 1299 ± 185 | 864 (62–6805) | 582 | 1713 ± 67 | 1342 (13–13,962) | 86 | 1776 ± 164 | 1316 (97–8292) |
| VITAMIN E (mg α-TE/day) | |||||||||||||||
| Total | 2009 | 7.0 ± 0.1 | 6.3 (0.7–55.2) | 213 | 7.4 ± 0.3 | 6.3 (0.7–27.6) | 211 | 7.5 ± 0.3 | 6.4 (1.1–31.0) | 1655 | 7.1 ± 0.1 | 6.4 (0.7–55.2) | 206 | 5.9 ± 0.2 | 5.25 (1.73–16.59) |
| Plausible energy reporters | 543 | 9.0 ± 0.2 * | 8.3 (1.7–27.6) | 120 | 8.3 ± 0.4 * | 7.6 (2.0–27.6) | 76 | 9.7 ± 0.6 * | 9.0 (1.7–31.0) | 433 | 9.2 ± 0.2 * | 8.2 (2.2–27.5) | 45 | 8.3 ± 0.4 * | 8.21 (3.90–15.70) |
| Men | 232 | 9.8 ± 0.3 § | 9.0 (3.2–27.6) | 68 | 8.3 ± 0.5 | 7.2 (1.9–27.6) | 48 | 9.8 ± 0.7 | 9.2 (3.9–24.0) | 158 | 10.2 ± 0.3 | 9.4 (3.2–27.3) | 24 | 8.5 ± 0.5 | 8.4 (4.4–15.4) |
| Women | 311 | 8.5 ± 0.2 † | 7.9 (1.7–27.6) | 52 | 8.4 ± 0.6 | 7.7 (2.5–19.1) | 28 | 9.6 ± 1.2 | 8.4 (1.7–31.0) | 275 | 8.7 ± 0.2 | 8.0 (2.2–27.5) | 21 | 8.0 ± 0.7 | 8.2 (3.9–15.7) |
| Non-Plausible energy reporters | 1466 | 6.3 ± 0.1 | 5.7 (0.7–55.2) | 93 | 6.2 ± 0.3 | 5.5 (0.7–18.7) | 135 | 6.3 ± 0.3 | 5.4 (1.1–20.5) | 1222 | 6.4 ± 0.1 | 5.9 (0.7–55.2) | 161 | 5.3 ± 0.2 | 4.81 (1.73–16.59) |
| Men | 781 | 6.6 ± 0.1 | 6.0 (0.7–55.2) | 58 | 6.3 ± 0.4 | 5.6 (0.7–18.7) | 89 | 6.4 ± 0.4 | 5.5 (1.1–20.5) | 640 | 6.7 ± 0.2 | 6.1 (0.9–55.2) | 75 | 5.6 ± 0.3 | 5.0 (1.8–16.6) |
| Women | 685 | 5.9 ± 0.1 | 5.4 (0.7–23.3) | 35 | 6.1 ± 0.6 | 5.0 (2.2–18.5) | 46 | 6.1 ± 0.5 | 5.4 (2.3–14.3) | 582 | 6.0 ± 0.1 | 5.8 (0.7–23.3) | 86 | 5.0 ± 0.2 | 4.7 (1.7–14.6) |
| VITAMIN C (mg/day) | |||||||||||||||
| Total | 2009 | 84.4 ± 1.4 | 71.3 (5.0–802.7) | 213 | 66.4 ± 3.2 | 57.2 (6.9–258.3) | 211 | 61.6 ± 3.1 | 49.3 (4.5–270.5) | 1655 | 84.8 ± 1.5 | 71.8 (5.0–802.7) | 206 | 106.6 ± 4.8 | 94.6 (14.5–478.8) |
| Plausible energy reporters | 543 | 100.7 ± 3.3 * | 84.8 (11.0- 802.7) | 120 | 72.5 ± 4.3 * | 63.0 (13.3–258.3) | 76 | 74.8 ± 5.6 * | 61.1 (8.8–244.5) | 433 | 103.0 ± 3.8 * | 87.2 (5.9–802.7) | 45 | 142.0 ± 12.9 * | 127.0 (28.6–478.8) |
| Men | 232 | 102.9 ± 5.3 § | 87.1 (14.1–802.7) | 68 | 74.2 ± 5.4 | 64.7 (13.3–210.6) | 48 | 77.7 ± 7.7 | 57.2 (20.6–244.5) | 158 | 112.5 ± 7.1 | 95 (14.1–802.7) | 24 | 144.1 ± 16.1 | 126.7 (28.6–315.3) |
| Women | 311 | 99.0 ± 4.2 † | 84.0 (11.0–788.6) | 52 | 70.2 ± 6.8 | 57.8 (16.8–258.3) | 28 | 69.8 ± 7.5 | 64.3 (8.8–181.7) | 275 | 97.5 ± 4.3 | 84 (5.9–788.6) | 21 | 139.7 ± 21.2 | 131.3 (34.9–478.8) |
| Non-Plausible energy reporters | 1466 | 78.4 ± 1.4 | 66.2 (5.0–410.6) | 93 | 58.6 ± 4.6 | 48.7 (6.9–255.0) | 135 | 54.2 ± 3.6 | 41.3 (4.5–270.5) | 1222 | 78.4 ± 1.5 | 66.9 (5.0–408.3) | 161 | 96.8 ± 4.6 | 86.9 (14.5–410.6) |
| Men | 781 | 77.4 ± 2.0 | 63.9 (5.0–410.6) | 58 | 54.5 ± 4.7 | 45.9 (6.9–172.8) | 89 | 54.5 ± 4.6 | 40.9 (4.5–270.5) | 640 | 78.5 ± 2.2 | 66 (5.0–408.3) | 75 | 98.2 ± 7.7 | 83.9 (16.2–410.6) |
| Women | 685 | 79.6 ± 1.9 | 68.3 (8.0–289.5) | 35 | 65.5 ± 9.3 | 60.7 (11.8–255.0) | 46 | 53.8 ± 6.0 | 42.3 (9.9–234.3) | 582 | 78.3 ± 2.1 | 67.3 (8.0–343.4) | 86 | 95.4 ± 5.5 | 87 (14.5–289.5) |
| Total | Children | Adolescents | Adults | Elderly | ||||||
|---|---|---|---|---|---|---|---|---|---|---|
| 9–12 Years | 13–17 Years | 18–64 Years | 65–75 Years | |||||||
| Spain | EFSA | Spain | EFSA | Spain | EFSA | Spain | EFSA | Spain | EFSA | |
| Zinc (%) | ||||||||||
| Whole population | 92 | 83 | 82 | 31 | 89 | 65 | 92 | 86 | 96 | 92 |
| Men | 86 | 69 | 80 | 30 | 85 | 59 | 86 | 72 | 93 | 84 |
| Women | 97 | 96 | 85 | 33 | 95 | 77 | 97 | 99 | 99 | 100 |
| Plausible energy reporters | 80 | 65 | 75 | 15 | 75 | 38 | 81 | 73 | 84 | 78 |
| Men | 64 | 31 | 74 | 15 | 69 | 27 | 59 | 31 | 75 | 58 |
| Women | 93 | 90 | 77 | 15 | 86 | 57 | 93 | 97 | 95 | 100 |
| Selenium (%) | ||||||||||
| Whole population | 15 | 25 | 2 | 4 | 4 | 16 | 16 | 26 | 22 | 32 |
| Men | 16 | 18 | 2 | 5 | 3 | 12 | 18 | 19 | 22 | 22 |
| Women | 14 | 32 | 3 | 3 | 7 | 24 | 14 | 33 | 21 | 41 |
| Plausible energy reporters | 4 | 9 | 0 | 0 | 0 | 3 | 4 | 11 | 4 | 7 |
| Men | 3 | 3 | 0 | 0 | 0 | 0 | 3 | 3 | 4 | 4 |
| Women | 5 | 14 | 0 | 0 | 0 | 7 | 5 | 16 | 5 | 10 |
| Vitamin A (%) | ||||||||||
| Whole population | 74 | 60 | 57 | 36 | 78 | 64 | 74 | 61 | 75 | 60 |
| Men | 78 | 64 | 57 | 33 | 80 | 66 | 80 | 57 | 80 | 65 |
| Women | 69 | 56 | 57 | 41 | 73 | 62 | 69 | 66 | 70 | 56 |
| Plausible energy reporters | 58 | 39 | 51 | 23 | 68 | 46 | 59 | 42 | 47 | 24 |
| Men | 63 | 40 | 53 | 18 | 71 | 46 | 66 | 44 | 63 | 33 |
| Women | 54 | 38 | 48 | 31 | 64 | 46 | 56 | 40 | 29 | 14 |
| Vitamin E (%) | ||||||||||
| Whole population | 80 | 80 | 62 | 66 | 72 | 76 | 80 | 79 | 90 | 91 |
| Men | 78 | 82 | 63 | 69 | 72 | 79 | 78 | 82 | 89 | 92 |
| Women | 82 | 77 | 60 | 62 | 70 | 70 | 82 | 76 | 92 | 90 |
| Plausible energy reporters | 62 | 59 | 51 | 57 | 54 | 61 | 62 | 58 | 76 | 76 |
| Men | 56 | 61 | 53 | 59 | 54 | 65 | 52 | 58 | 79 | 83 |
| Women | 67 | 59 | 48 | 54 | 54 | 54 | 67 | 57 | 71 | 67 |
| Vitamin C (%) | ||||||||||
| Whole population | 29 | 56 | 41 | 37 | 47 | 67 | 29 | 58 | 15 | 42 |
| Men | 32 | 60 | 39 | 37 | 48 | 69 | 31 | 62 | 19 | 44 |
| Women | 27 | 52 | 45 | 38 | 46 | 64 | 27 | 53 | 11 | 40 |
| Plausible energy reporters | 20 | 42 | 36 | 29 | 36 | 55 | 19 | 45 | 7 | 20 |
| Men | 21 | 42 | 29 | 26 | 35 | 56 | 19 | 44 | 8 | 17 |
| Women | 20 | 42 | 44 | 33 | 36 | 54 | 19 | 45 | 5 | 24 |
© 2017 by the authors. Licensee MDPI, Basel, Switzerland. This article is an open access article distributed under the terms and conditions of the Creative Commons Attribution (CC BY) license (http://creativecommons.org/licenses/by/4.0/).
Share and Cite
Olza, J.; Aranceta-Bartrina, J.; González-Gross, M.; Ortega, R.M.; Serra-Majem, L.; Varela-Moreiras, G.; Gil, Á. Reported Dietary Intake and Food Sources of Zinc, Selenium, and Vitamins A, E and C in the Spanish Population: Findings from the ANIBES Study. Nutrients 2017, 9, 697. https://doi.org/10.3390/nu9070697
Olza J, Aranceta-Bartrina J, González-Gross M, Ortega RM, Serra-Majem L, Varela-Moreiras G, Gil Á. Reported Dietary Intake and Food Sources of Zinc, Selenium, and Vitamins A, E and C in the Spanish Population: Findings from the ANIBES Study. Nutrients. 2017; 9(7):697. https://doi.org/10.3390/nu9070697
Chicago/Turabian StyleOlza, Josune, Javier Aranceta-Bartrina, Marcela González-Gross, Rosa M. Ortega, Lluis Serra-Majem, Gregorio Varela-Moreiras, and Ángel Gil. 2017. "Reported Dietary Intake and Food Sources of Zinc, Selenium, and Vitamins A, E and C in the Spanish Population: Findings from the ANIBES Study" Nutrients 9, no. 7: 697. https://doi.org/10.3390/nu9070697
APA StyleOlza, J., Aranceta-Bartrina, J., González-Gross, M., Ortega, R. M., Serra-Majem, L., Varela-Moreiras, G., & Gil, Á. (2017). Reported Dietary Intake and Food Sources of Zinc, Selenium, and Vitamins A, E and C in the Spanish Population: Findings from the ANIBES Study. Nutrients, 9(7), 697. https://doi.org/10.3390/nu9070697