Effects of Low-Dose Non-Caloric Sweetener Consumption on Gut Microbiota in Mice

 ,
, 
Abstract
:1. Introduction
2. Materials and Methods
2.1. Animals
2.2. Experimental Design
2.3. Plasma and Hepatic Lipid Concentrations
2.4. RNA Preparation and Quantitative Reverse Transcriptase Polymerase Chain Reaction
2.5. Extraction of Genomic DNA and Quantitative Polymerase Chain Reaction
2.6. PCR Denaturing Gradient Gel Electrophoresis (DGGE) Analysis
2.7. Extraction of Bile Acids
2.8. Analysis of Bile Acid Composition
2.9. Metabolome Analysis of Cecum Luminal Contents by Capillary Electrophoresis Electrospray Ionization Time-of-Flight Mass Spectrometry
2.10. Statistical Analyses
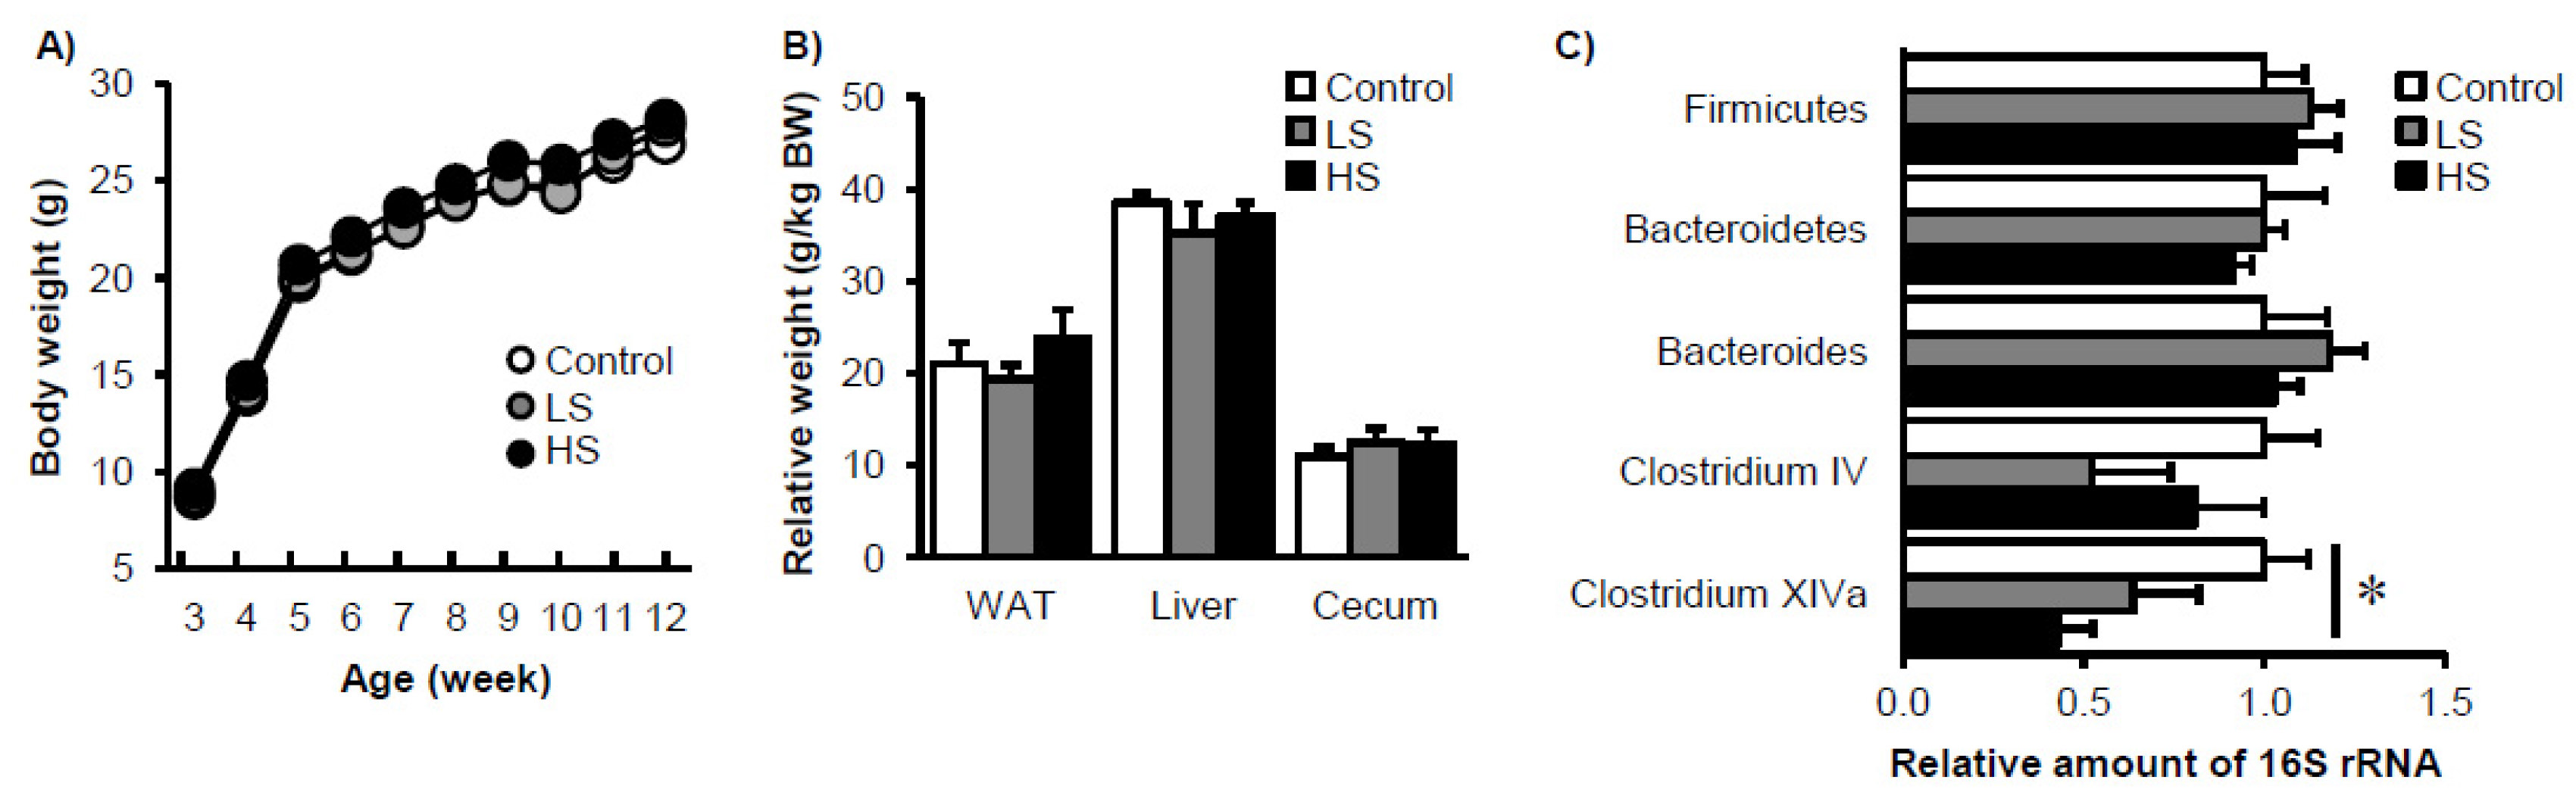
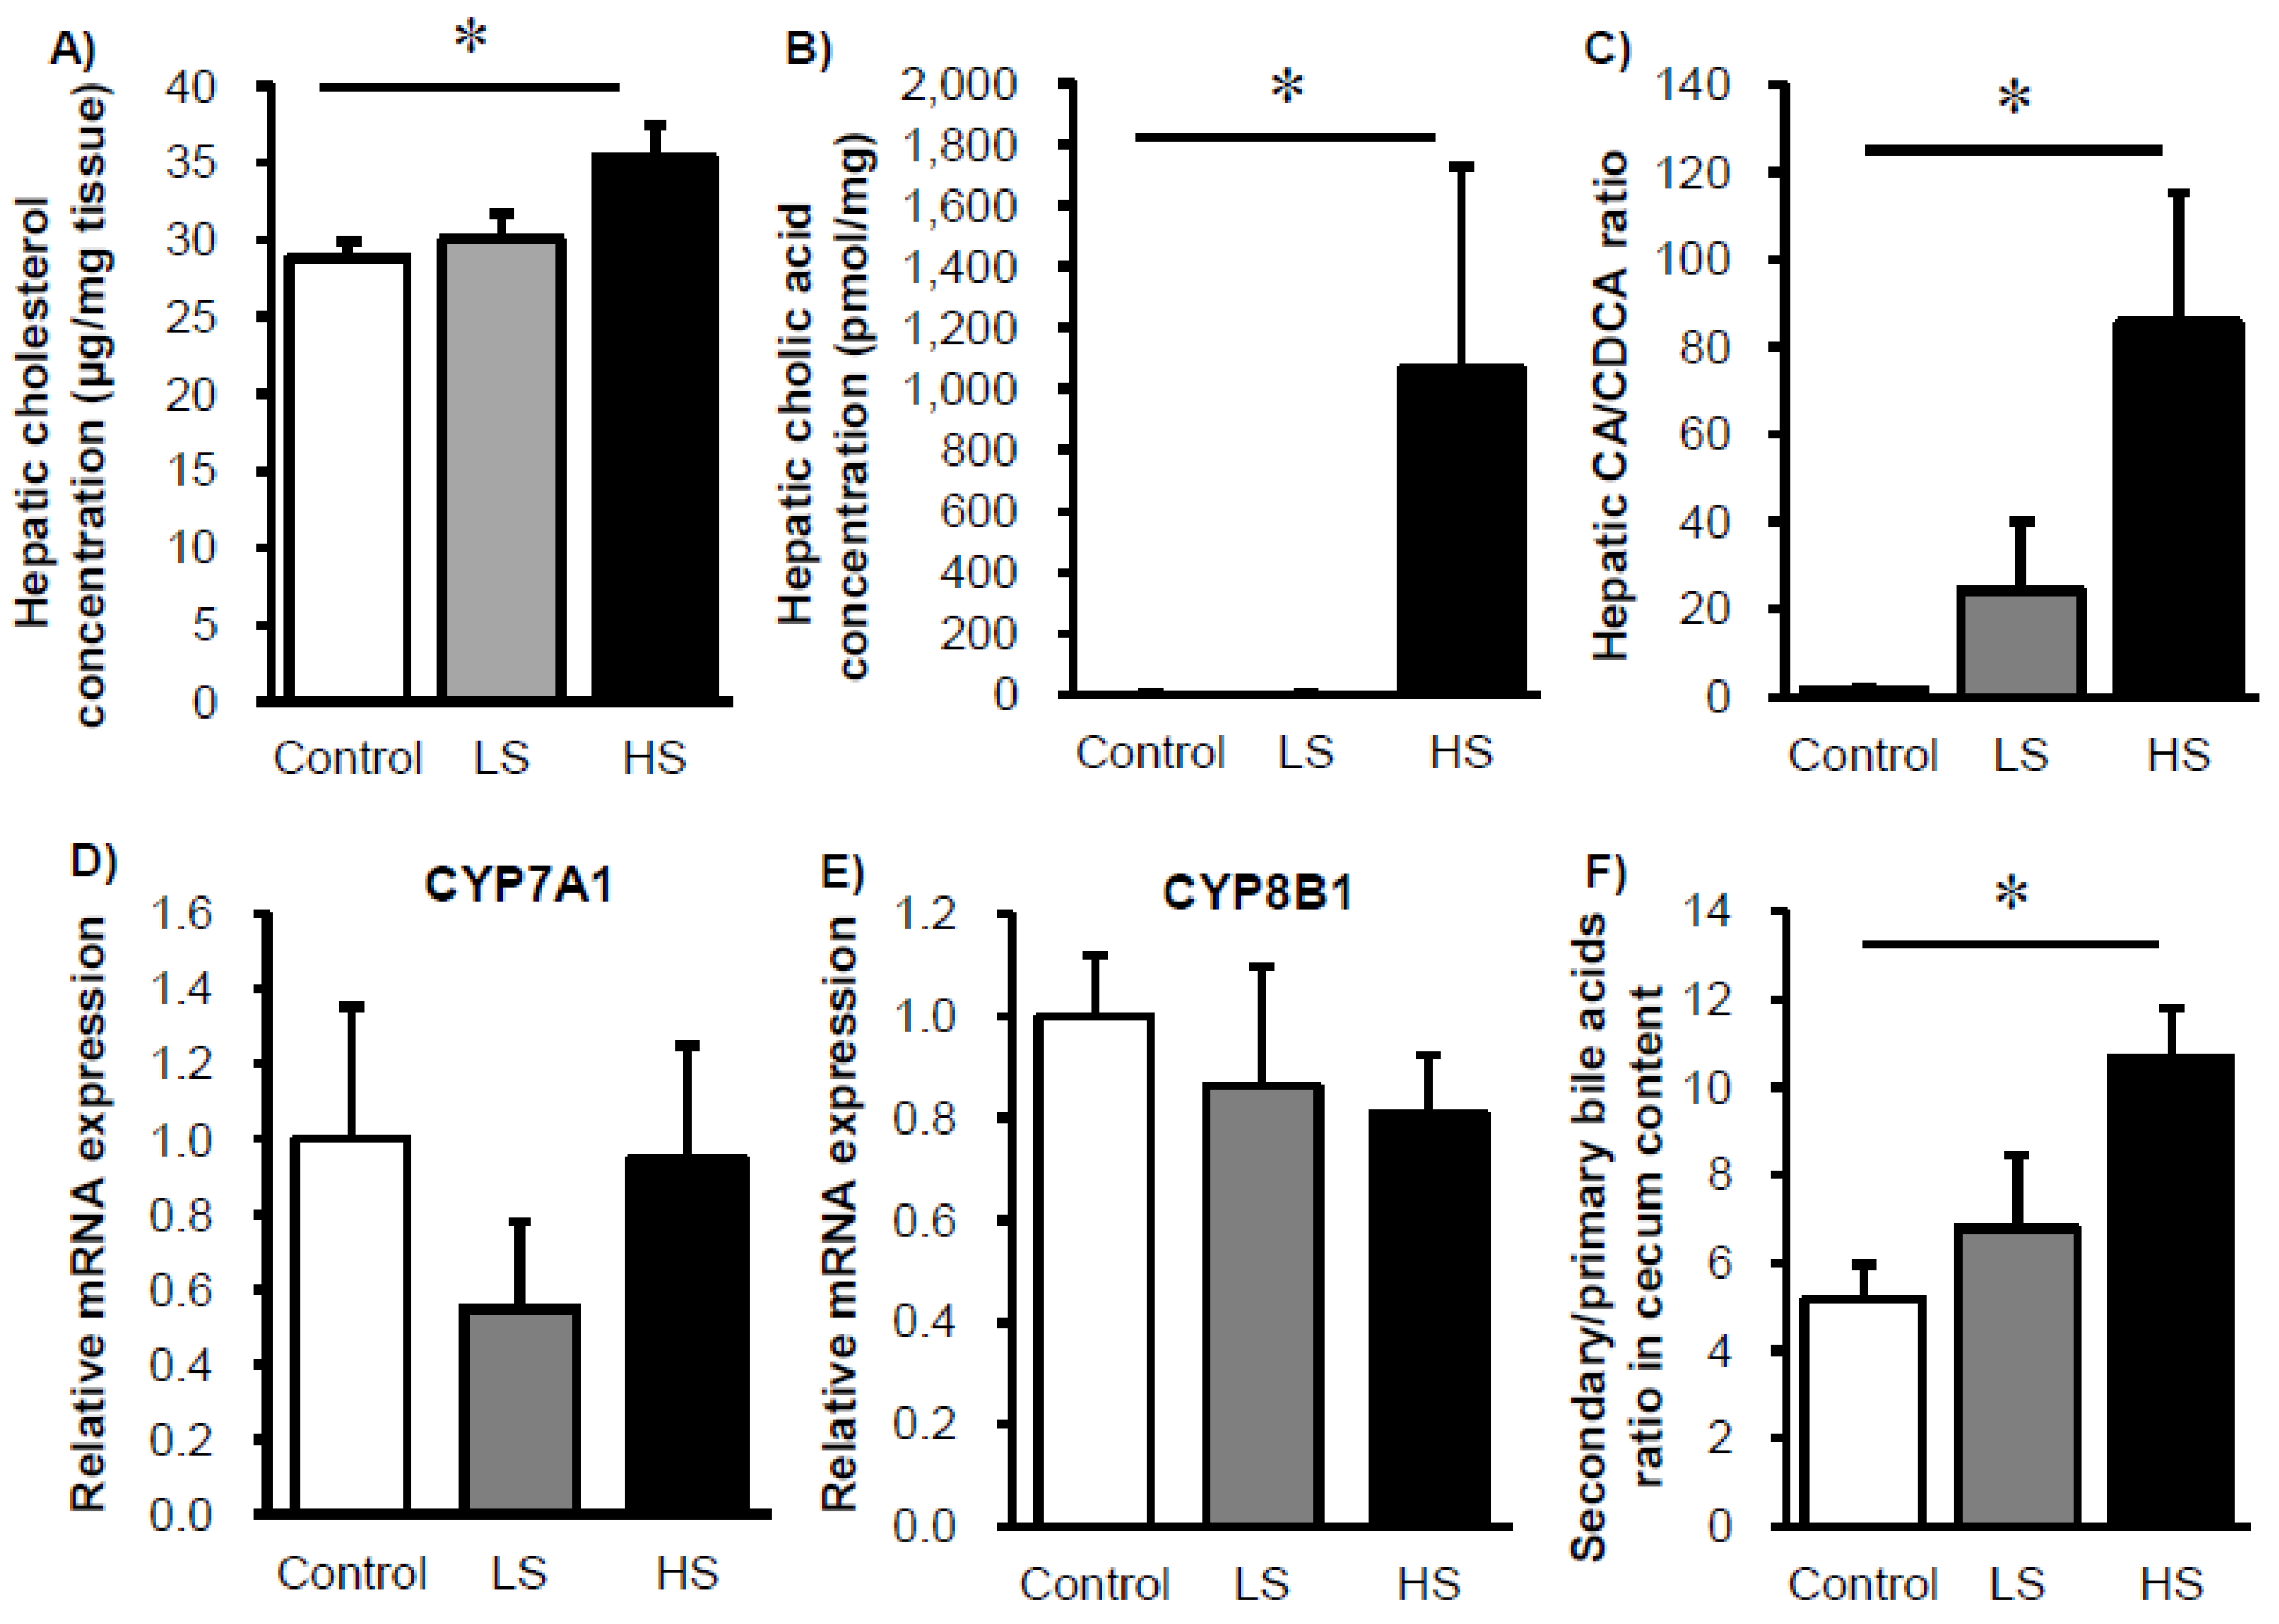
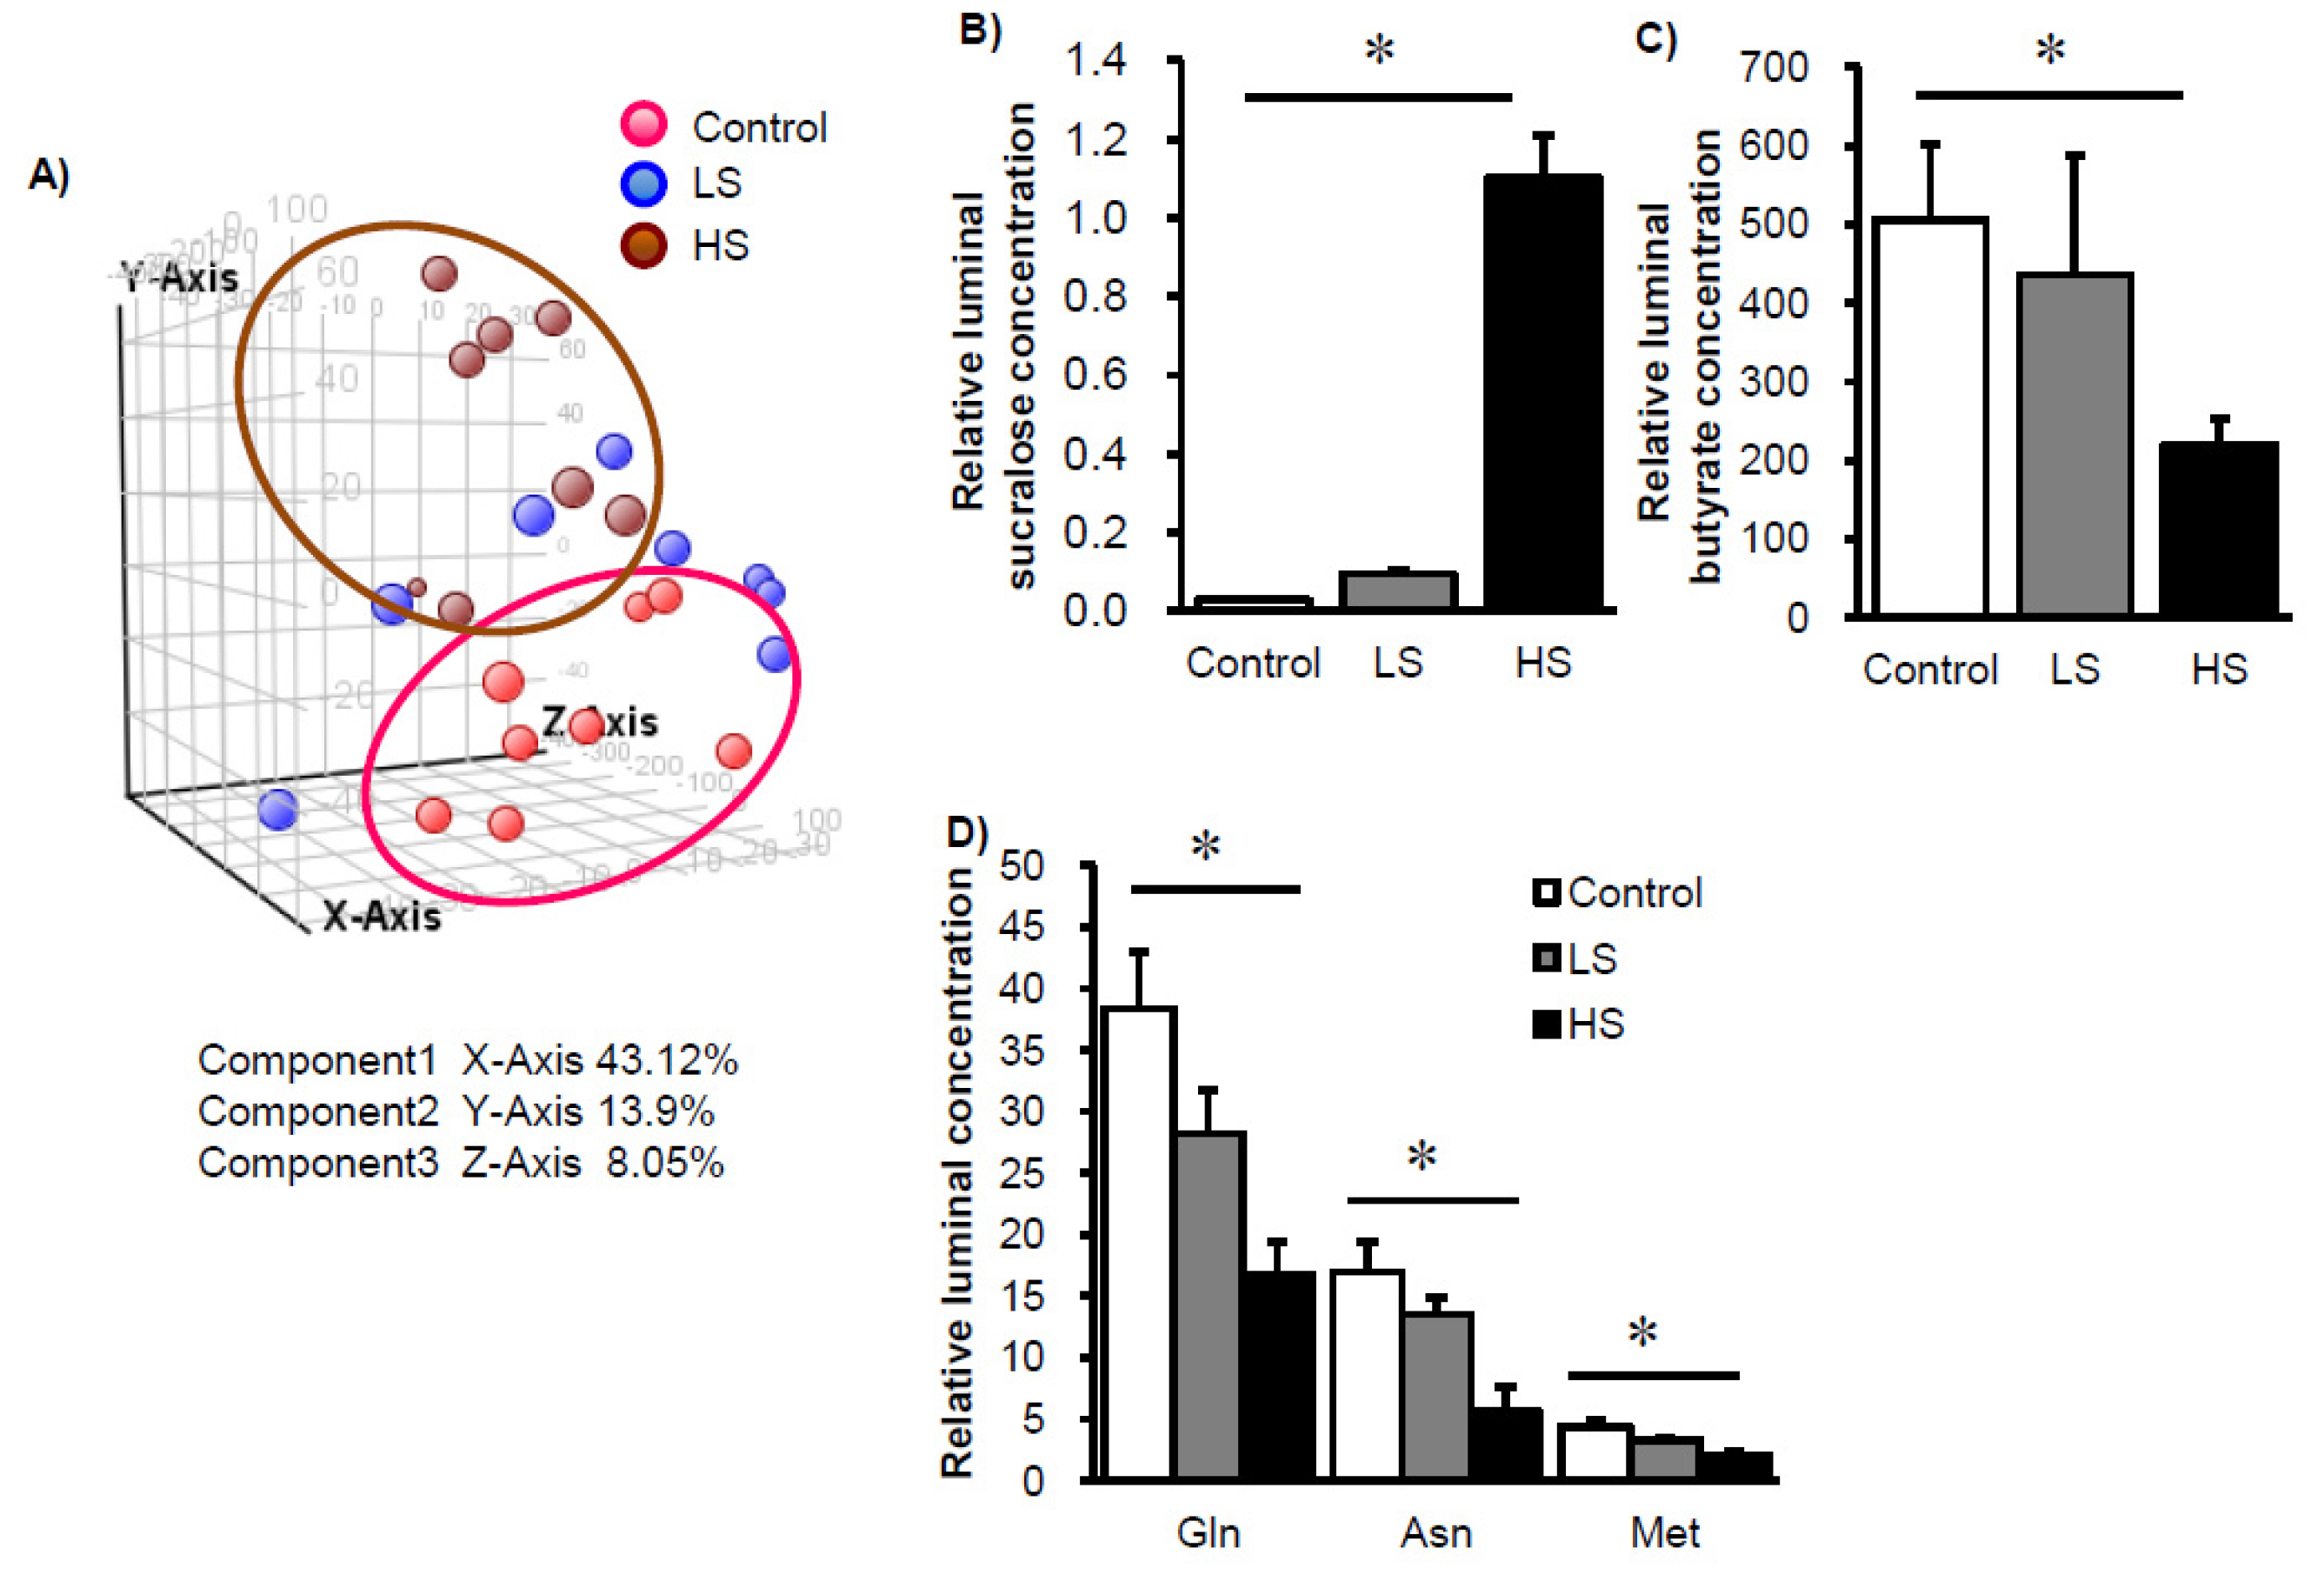
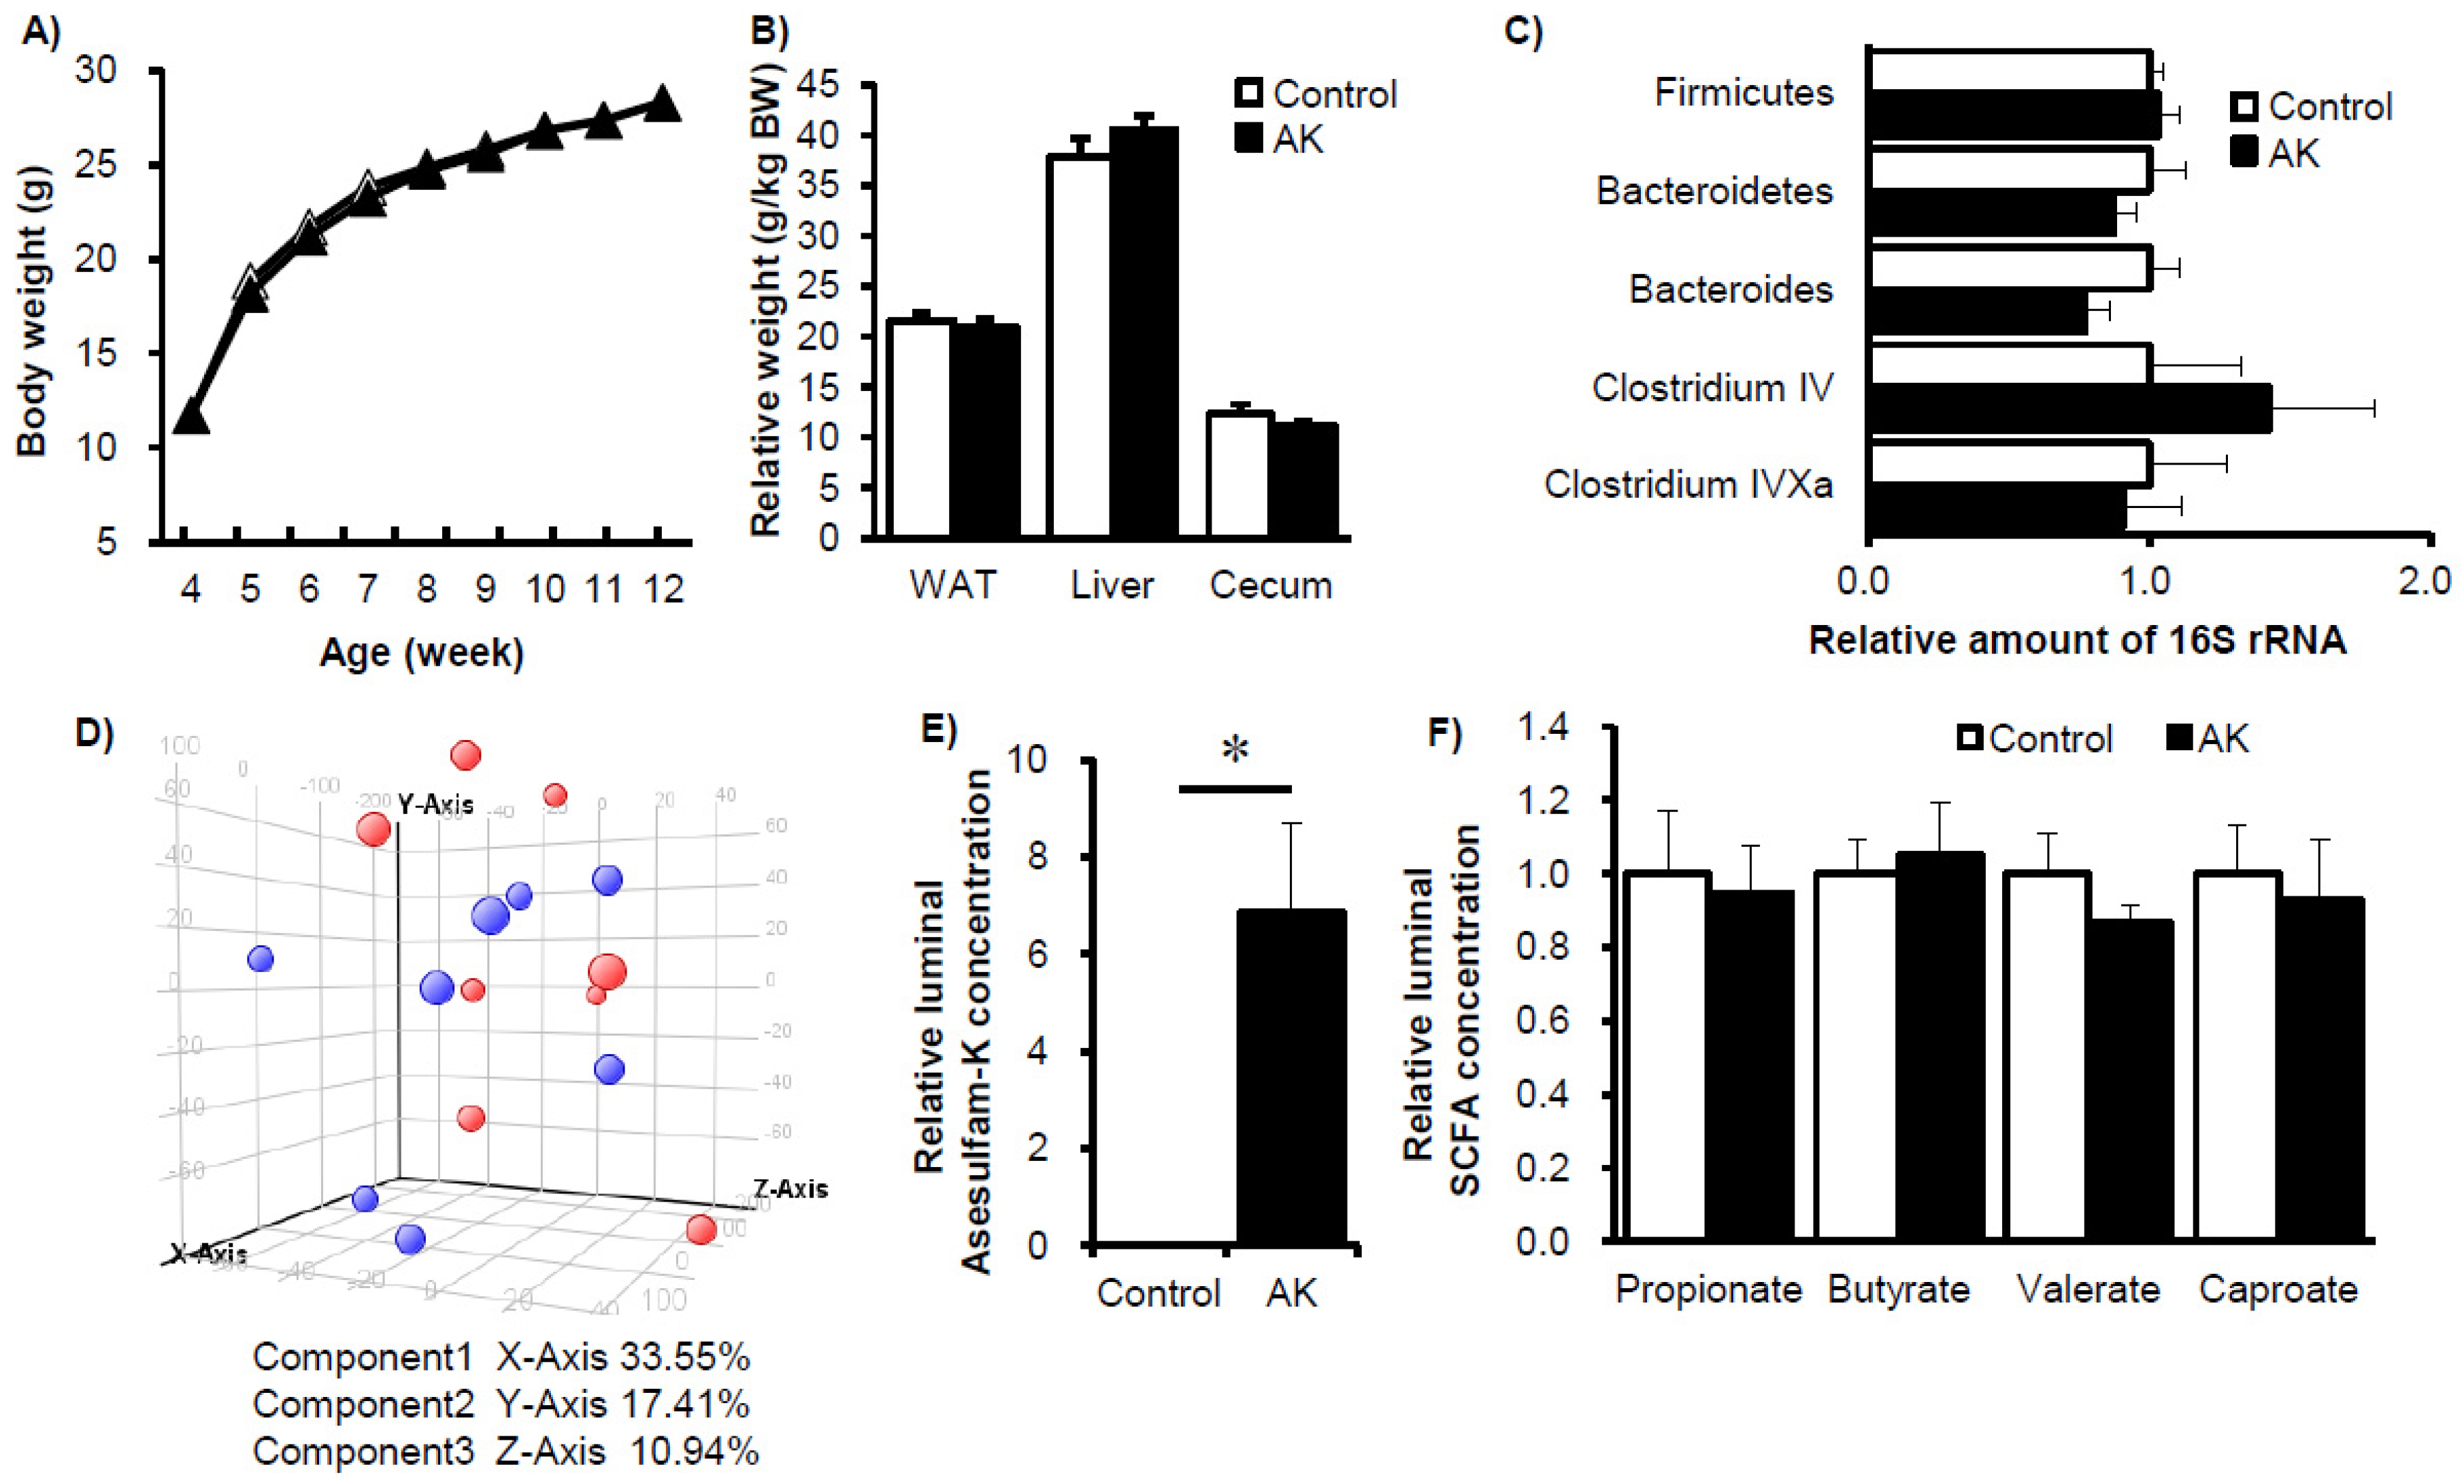
3. Results
4. Discussion and Conclusions
Supplementary Materials
Acknowledgments
Author Contributions
Conflicts of Interest
References
- Gardner, C.; Wylie-Rosett, J.; Gidding, S.S.; Steffen, L.M.; Johnson, R.K.; Reader, D.; Lichtenstein, A.H. Nonnutritive sweeteners: Current use and health perspectives: A scientific statement from the American Heart Association and the American Diabetes Association. Diabetes Care 2012, 35, 1798–1808. [Google Scholar] [CrossRef] [PubMed]
- Fitch, C.; Keim, K.S. Position of the Academy of Nutrition and Dietetics: Use of nutritive and nonnutritive sweeteners. J. Acad. Nutr. Diet. 2012, 112, 739–758. [Google Scholar] [CrossRef] [PubMed]
- Swithers, S.E. Artificial sweeteners produce the counterintuitive effect of inducing metabolic derangements. Trends Endocrinol. Metab. 2013, 24, 431–441. [Google Scholar] [CrossRef] [PubMed]
- Ministry of Health Labour and Welfare in Japan. Reports from the Japan National Health and Nutrition Survey. 2002 and 2015. Available online: http://www.mhlw.go.jp (accessed on 27 March 2017).
- Pereira, M.A. Sugar-sweetened and artificially-sweetened beverages in relation to obesity risk. Adv. Nutr. 2014, 5, 797–808. [Google Scholar] [CrossRef] [PubMed]
- Imamura, F.; O’Connor, L.; Ye, Z.; Mursu, J.; Hayashino, Y.; Bhupathiraju, S.N.; Forouhi, N.G. Consumption of sugar sweetened beverages, artificially sweetened beverages, and fruit juice and incidence of type 2 diabetes: Systematic review, meta-analysis, and estimation of population attributable fraction. BMJ 2015, 351, h3576. [Google Scholar] [CrossRef] [PubMed]
- Cheungpasitporn, W.; Thongprayoon, C.; Edmonds, P.J.; Srivali, N.; Ungprasert, P.; Kittanamongkolchai, W.; Erickson, S.B. Sugar and artificially sweetened soda consumption linked to hypertension: A systematic review and meta-analysis. Clin. Exp. Hypertens. 2015, 37, 587–593. [Google Scholar] [CrossRef] [PubMed]
- Kim, Y.; Je, Y. Prospective association of sugar-sweetened and artificially sweetened beverage intake with risk of hypertension. Arch. Cardiovasc. Dis. 2016, 109, 242–253. [Google Scholar] [CrossRef] [PubMed]
- Cheungpasitporn, W.; Thongprayoon, C.; O’Corragain, O.A.; Edmonds, P.J.; Kittanamongkolchai, W.; Erickson, S.B. Associations of sugar-sweetened and artificially sweetened soda with chronic kidney disease: A systematic review and meta-analysis. Nephrology (Carlton) 2014, 19, 791–797. [Google Scholar] [CrossRef] [PubMed]
- Suez, J.; Korem, T.; Zeevi, D.; Zilberman-Schapira, G.; Thaiss, C.A.; Maza, O.; Israeli, D.; Zmora, N.; Gilad, S.; Weinberger, A.; et al. Artificial sweeteners induce glucose intolerance by altering the gut microbiota. Nature 2014, 514, 181–186. [Google Scholar] [CrossRef] [PubMed]
- John, B.A.; Wood, S.G.; Hawkins, D.R. The pharmacokinetics and metabolism of sucralose in the mouse. Food Chem. Toxicol. 2000, 38 (Suppl. S2), 107–110. [Google Scholar] [CrossRef]
- Kidd, M.; Modlin, I.M.; Gustafsson, B.I.; Drozdov, I.; Hauso, O.; Pfragner, R. Luminal regulation of normal and neoplastic human EC cell serotonin release is mediated by bile salts, amines, tastants, and olfactants. Am. J. Physiol. Gastrointest. Liver Physiol. 2008, 295, G260–G272. [Google Scholar] [CrossRef] [PubMed]
- Sikander, A.; Rana, S.V.; Prasad, K.K. Role of serotonin in gastrointestinal motility and irritable bowel syndrome. Clin. Chim. Acta 2009, 403, 47–55. [Google Scholar] [CrossRef] [PubMed]
- Abou-Donia, M.B.; El-Masry, E.M.; Abdel-Rahman, A.A.; McLendon, R.E.; Schiffman, S.S. Splenda alters gut microflora and increases intestinal p-glycoprotein and cytochrome p-450 in male rats. J. Toxicol. Environ. Health A 2008, 71, 1415–1429. [Google Scholar] [CrossRef] [PubMed]
- Wang, Q.P.; Lin, Y.Q.; Zhang, L.; Wilson, Y.A.; Oyston, L.J.; Cotterell, J.; Qi, Y.; Khuong, T.M.; Bakhshi, N.; Planchenault, Y.; et al. Sucralose Promotes Food Intake through NPY and a Neuronal Fasting Response. Cell Metab. 2016, 24, 75–90. [Google Scholar] [CrossRef] [PubMed]
- Mattes, R.D.; Popkin, B.M. Nonnutritive sweetener consumption in humans: effects on appetite and food intake and their putative mechanisms. Am. J. Clin. Nutr. 2009, 89, 1–14. [Google Scholar] [CrossRef] [PubMed]
- Uebanso, T.; Taketani, Y.; Fukaya, M.; Sato, K.; Takei, Y.; Sato, T.; Sawada, N.; Amo, K.; Harada, N.; Arai, H.; et al. Hypocaloric high-protein diet improves fatty liver and hypertriglyceridemia in sucrose-fed obese rats via two pathways. Am. J. Physiol. Endocrinol. Metab. 2009, 297, E76–E84. [Google Scholar] [CrossRef] [PubMed]
- Li, M.; Gong, J.; Cottrill, M.; Yu, H.; de Lange, C.; Burton, J.; Topp, E. Evaluation of QIAamp DNA Stool Mini Kit for ecological studies of gut microbiota. J. Microbiol. Methods 2003, 54, 13–20. [Google Scholar] [CrossRef]
- Walter, J.; Tannock, G.W.; Tilsala-Timisjarvi, A.; Rodtong, S.; Loach, D.M.; Munro, K.; Alatossava, T. Detection and identification of gastrointestinal Lactobacillus species by using denaturing gradient gel electrophoresis and species-specific PCR primers. Appl. Environ. Microbiol. 2000, 66, 297–303. [Google Scholar] [CrossRef] [PubMed]
- Hagio, M.; Matsumoto, M.; Fukushima, M.; Hara, H.; Ishizuka, S. Improved analysis of bile acids in tissues and intestinal contents of rats using LC/ESI-MS. J. Lipid Res. 2009, 50, 173–180. [Google Scholar] [CrossRef] [PubMed]
- Kami, K.; Fujimori, T.; Sato, H.; Sato, M.; Yamamoto, H.; Ohashi, Y.; Sugiyama, N.; Ishihama, Y.; Onozuka, H.; Ochiai, A.; et al. Metabolomic profiling of lung and prostate tumor tissues by capillary electrophoresis time-of-flight mass spectrometry. Metabolomics 2013, 9, 444–453. [Google Scholar] [CrossRef] [PubMed]
- Ohashi, Y.; Hirayama, A.; Ishikawa, T.; Nakamura, S.; Shimizu, K.; Ueno, Y.; Tomita, M.; Soga, T. Depiction of metabolome changes in histidine-starved Escherichia coli by CE-TOFMS. Mol. Biosyst. 2008, 4, 135–147. [Google Scholar] [CrossRef] [PubMed]
- Ridlon, J.M.; Alves, J.M.; Hylemon, P.B.; Bajaj, J.S. Cirrhosis, bile acids and gut microbiota: Unraveling a complex relationship. Gut Microbes 2013, 4, 382–387. [Google Scholar] [CrossRef] [PubMed]
- Evans, J.M.; Morris, L.S.; Marchesi, J.R. The gut microbiome: The role of a virtual organ in the endocrinology of the host. J. Endocrinol. 2013, 218, R37–R47. [Google Scholar] [CrossRef] [PubMed]
- Cho, I.; Yamanishi, S.; Cox, L.; Methe, B.A.; Zavadil, J.; Li, K.; Gao, Z.; Mahana, D.; Raju, K.; Teitler, I.; et al. Antibiotics in early life alter the murine colonic microbiome and adiposity. Nature 2012, 488, 621–626. [Google Scholar] [CrossRef] [PubMed]
- Cox, L.M.; Yamanishi, S.; Sohn, J.; Alekseyenko, A.V.; Leung, J.M.; Cho, I.; Kim, S.G.; Li, H.; Gao, Z.; Mahana, D.; et al. Altering the intestinal microbiota during a critical developmental window has lasting metabolic consequences. Cell 2014, 158, 705–721. [Google Scholar] [CrossRef] [PubMed]
- Kille, J.W.; Tesh, J.M.; McAnulty, P.A.; Ross, F.W.; Willoughby, C.R.; Bailey, G.P.; Wilby, O.K.; Tesh, S.A. Sucralose: Assessment of teratogenic potential in the rat and the rabbit. Food Chem. Toxicol. 2000, 38 (Suppl. S2), 43–52. [Google Scholar] [CrossRef]
- Sayin, S.I.; Wahlstrom, A.; Felin, J.; Jantti, S.; Marschall, H.U.; Bamberg, K.; Angelin, B.; Hyötyläinen, T.; Orešič, M.; Bäckhed, F. Gut microbiota regulates bile acid metabolism by reducing the levels of tauro-beta-muricholic acid, a naturally occurring FXR antagonist. Cell Metab. 2013, 17, 225–235. [Google Scholar] [CrossRef] [PubMed]
- Ridlon, J.M.; Kang, D.J.; Hylemon, P.B. Bile salt biotransformations by human intestinal bacteria. J. Lipid Res. 2006, 47, 241–259. [Google Scholar] [CrossRef] [PubMed]
- Reynier, M.O.; Montet, J.C.; Gerolami, A.; Marteau, C.; Crotte, C.; Montet, A.M.; Mathieu, S. Comparative effects of cholic, chenodeoxycholic, and ursodeoxycholic acids on micellar solubilization and intestinal absorption of cholesterol. J. Lipid Res. 1981, 22, 467–473. [Google Scholar] [PubMed]
- Atarashi, K.; Tanoue, T.; Shima, T.; Imaoka, A.; Kuwahara, T.; Momose, Y.; Cheng, G.; Yamasaki, S.; Saito, T.; Ohba, Y.; et al. Induction of colonic regulatory T cells by indigenous Clostridium species. Science 2011, 331, 337–341. [Google Scholar] [CrossRef] [PubMed]
- Vieira, A.T.; Teixeira, M.M.; Martins, F.S. The role of probiotics and prebiotics in inducing gut immunity. Front. Immunol. 2013, 4, 445. [Google Scholar] [CrossRef] [PubMed]
- Fierer, N.; Jackson, J.A.; Vilgalys, R.; Jackson, R.B. Assessment of soil microbial community structure by use of taxon-specific quantitative PCR assays. Appl. Environ. Microbiol. 2005, 71, 4117–4120. [Google Scholar] [CrossRef] [PubMed]
- Tannock, G.W.; Munro, K.; Harmsen, H.J.; Welling, G.W.; Smart, J.; Gopal, P.K. Analysis of the fecal microflora of human subjects consuming a probiotic product containing Lactobacillus rhamnosus DR20. Appl. Environ. Microbiol. 2000, 66, 2578–2588. [Google Scholar] [CrossRef] [PubMed]
- Guo, X.; Xia, X.; Tang, R.; Zhou, J.; Zhao, H.; Wang, K. Development of a real-time PCR method for Firmicutes and Bacteroidetes in faeces and its application to quantify intestinal population of obese and lean pigs. Lett. Appl. Microbiol. 2008, 47, 367–373. [Google Scholar] [CrossRef] [PubMed]
- Walter, J.; Hertel, C.; Tannock, G.W.; Lis, C.M.; Munro, K.; Hammes, W.P. Detection of Lactobacillus, Pediococcus, Leuconostoc, and Weissella species in human feces by using group-specific PCR primers and denaturing gradient gel electrophoresis. Appl. Environ. Microbiol. 2001, 67, 2578–2585. [Google Scholar] [CrossRef] [PubMed]
- Matsuki, T.; Watanabe, K.; Fujimoto, J.; Takada, T.; Tanaka, R. Use of 16S rRNA gene-targeted group-specific primers for real-time PCR analysis of predominant bacteria in human feces. Appl. Environ. Microbiol. 2004, 70, 7220–7228. [Google Scholar] [CrossRef] [PubMed]
- Matsuki, T.; Watanabe, K.; Fujimoto, J.; Miyamoto, Y.; Takada, T.; Matsumoto, K.; Oyaizu, H.; Tanaka, R. Development of 16S rRNA-gene-targeted group-specific primers for the detection and identification of predominant bacteria in human feces. Appl. Environ. Microbiol. 2002, 68, 5445–5451. [Google Scholar] [CrossRef] [PubMed]
- Layton, A.; McKay, L.; Williams, D.; Garrett, V.; Gentry, R.; Sayler, G. Development of Bacteroides 16S rRNA gene TaqMan-based real-time PCR assays for estimation of total, human, and bovine fecal pollution in water. Appl. Environ. Microbiol. 2006, 72, 4214–4224. [Google Scholar] [CrossRef] [PubMed]
© 2017 by the authors. Licensee MDPI, Basel, Switzerland. This article is an open access article distributed under the terms and conditions of the Creative Commons Attribution (CC BY) license (http://creativecommons.org/licenses/by/4.0/).
Share and Cite
Uebanso, T.; Ohnishi, A.; Kitayama, R.; Yoshimoto, A.; Nakahashi, M.; Shimohata, T.; Mawatari, K.; Takahashi, A. Effects of Low-Dose Non-Caloric Sweetener Consumption on Gut Microbiota in Mice. Nutrients 2017, 9, 560. https://doi.org/10.3390/nu9060560
Uebanso T, Ohnishi A, Kitayama R, Yoshimoto A, Nakahashi M, Shimohata T, Mawatari K, Takahashi A. Effects of Low-Dose Non-Caloric Sweetener Consumption on Gut Microbiota in Mice. Nutrients. 2017; 9(6):560. https://doi.org/10.3390/nu9060560
Chicago/Turabian StyleUebanso, Takashi, Ai Ohnishi, Reiko Kitayama, Ayumi Yoshimoto, Mutsumi Nakahashi, Takaaki Shimohata, Kazuaki Mawatari, and Akira Takahashi. 2017. "Effects of Low-Dose Non-Caloric Sweetener Consumption on Gut Microbiota in Mice" Nutrients 9, no. 6: 560. https://doi.org/10.3390/nu9060560
APA StyleUebanso, T., Ohnishi, A., Kitayama, R., Yoshimoto, A., Nakahashi, M., Shimohata, T., Mawatari, K., & Takahashi, A. (2017). Effects of Low-Dose Non-Caloric Sweetener Consumption on Gut Microbiota in Mice. Nutrients, 9(6), 560. https://doi.org/10.3390/nu9060560