Beverage Consumption among U.S. Children Aged 0–24 Months: National Health and Nutrition Examination Survey (NHANES)
Abstract
:1. Introduction
2. Materials and Methods
2.1. Study Design and Participants
2.2. Measures
2.3. Dietary Intake
2.4. Statistical Analysis
3. Results
4. Discussion
5. Conclusions
Supplementary Materials
Acknowledgments
Author Contributions
Conflicts of Interest
References
- Grimes, C.A.; Szymlek-Gay, E.A.; Campbell, K.J.; Nicklas, T.A. Food Sources of Total Energy and Nutrients among U.S. Infants and Toddlers: National Health and Nutrition Examination Survey 2005–2012. Nutrients 2015, 7, 6797–6836. [Google Scholar] [CrossRef] [PubMed]
- Skinner, J.D.; Ziegler, P.; Ponza, M. Transitions in infants’ and toddlers’ beverage patterns. J. Am. Diet. Assoc. 2004, 104, s45–s50. [Google Scholar] [CrossRef] [PubMed]
- Fulgoni, V.L.; Quann, E.E. National trends in beverage consumption in children from birth to 5 years: Analysis of NHANES across three decades. Nutr. J. 2012, 11, 92. [Google Scholar] [CrossRef] [PubMed]
- American Academy of Pediatrics. Food and Feeding—Age Specific Content. Available online: https://www.aap.org/en-us/advocacy-and-policy/aap-health-initiatives/HALF-Implementation-Guide/Age-Specific-Content/Pages/Age-Specific-Content.aspx (accessed on 6 October 2016).
- Rampersaud, G.C.; Bailey, L.B.; Kauwell, G.P. National survey beverage consumption data for children and adolescents indicate the need to encourage a shift toward more nutritive beverages. J. Am. Diet. Assoc. 2003, 103, 97–100. [Google Scholar] [CrossRef] [PubMed]
- Fox, M.K.; Pac, S.; Devaney, B.; Jankowski, L. Feeding Infants and Toddlers Study: What Foods Are Infants and Toddlers Eating? J. Am. Diet. Assoc. 2004, 104, s22–s30. [Google Scholar] [CrossRef] [PubMed]
- Siega-Riz, A.M.; Kinlaw, A.; Deming, D.M.; Reidy, K.C. New findings from the Feeding Infants and Toddlers Study 2008. Nestle Nutr. Workshop Ser. Pediatr. Program 2011, 68, 83–100. [Google Scholar] [PubMed]
- Schwartz, C.; Scholtens, P.A.; Lalanne, A.; Weenen, H.; Nicklaus, S. Development of healthy eating habits early in life. Review of recent evidence and selected guidelines. Appetite 2011, 57, 796–807. [Google Scholar] [CrossRef] [PubMed]
- Lioret, S.; McNaughton, S.A.; Spence, A.C.; Crawford, D.; Campbell, K.J. Tracking of dietary intakes in early childhood: The Melbourne InFANT Program. Eur. J. Clin. Nutr. 2013, 67, 275–281. [Google Scholar] [CrossRef] [PubMed]
- Park, S.; Pan, L.; Sherry, B.; Li, R. The association of sugar-sweetened beverage intake during infancy with sugar-sweetened beverage intake at 6 years of age. Pediatrics 2014, 134, S56–S62. [Google Scholar] [CrossRef] [PubMed]
- Sonneville, K.R.; Long, M.W.; Rifas-Shiman, S.L.; Kleinman, K.; Gillman, M.W.; Taveras, E.M. Juice and water intake in infancy and later beverage intake and adiposity: Could juice be a gateway drink? Obesity 2015, 23, 170–176. [Google Scholar] [CrossRef] [PubMed]
- Institute of Medicine. Dietary Reference Intakes for Water, Potassium, Sodium, Chloride and Sulfate; The National Academies Press: Washington, DC, USA, 2004. [Google Scholar]
- Drewnowski, D.; Rehm, C.D.; Constant, F. Water and beverage consumption among children age 4–13y in the United States: Analyses of 2005–2010 NHANES data. Nutr. J. 2013, 12, 85. [Google Scholar] [CrossRef] [PubMed]
- Raiten, D.; Raghavan, R.; Porter, A.; Obbagy, J.E.; Spahn, J. Executive summary: Evaluating the evidence base to support the inclusion of infants and children from birth to 24 mo of age in the Dietary Guidelines for Americans—“The B-24 Project”. Am. J. Clin. Nutr. 2014, 99, 663S–691S. [Google Scholar] [CrossRef] [PubMed]
- National Health and Nutrition Examination Survey Data. U.S. Department of Health and Human Services, Centers for Disease Control and Prevention: Hyattsville, MD, USA, (2005–2012). Available online: https://wwwn.cdc.gov/nchs/nhanes/Default.aspx (accessed on 23 March 2015).
- Centers for Disease Control and Prevention, National Center for Health Statistics. National Health and Nutrition Examination Survey Questionnaires, Datasets, and Related Documentation. Available online: http://www.webcitation.org/6ZVyAVRTi (accessed on 25 May 2015).
- Centers for Disease Control and Prevention, National Center for Health Statistics. National Health and Nutrition Examination Survey, Survey Methods and Analytic Guidelines. Available online: http://www.webcitation.org/6ZVxsoxgr (accessed on 23 March 2015).
- Centers for Disease Control and Prevention, National Center for Health Statistics. National Health and Nutrition Examination Survey MEC In-Person Dietary Interviewers Procedures Manual. Available online: http://www.webcitation.org/6ZVxoRqpy (accessed on 23 March 2015).
- U.S. Department of Agriculture, Agricultural Research Service. What We Eat in America Food Categories 2009–2010. Available online: http://www.webcitation.org/6ZVxl7Nr3 (accessed on 23 March 2015).
- Briefel, R.R.; Kalb, L.M.; Condon, E.; Deming, D.M.; Clusen, N.A.; Fox, M.K.; Harnack, L.; Gemmill, E.; Stevens, M.; Reidy, K.C. The Feeding Infants and Toddlers Study 2008: Study design and methods. J. Am. Diet. Assoc. 2010, 110, S16–S26. [Google Scholar] [CrossRef] [PubMed]
- Tian, N.; Zhang, Z.; Loustalot, F.; Yang, Q.; Cogswell, M.E. Sodium and potassium intakes among US infants and preschool children, 2003–2010. Am. J. Clin. Nutr. 2013, 98, 113–122. [Google Scholar] [CrossRef] [PubMed]
- U.S. Department of Agriculture, Agricultural Research Service. USDA Food and Nutrient Database for Dietary Studies. Available online: http://www.webcitation.org/6ZVymUPd3 (accessed on 23 March 2015).
- Centers for Disease Control and Prevention, National Center for Health Statistics. National Health and Nutrition Examination Survey: Analytic Guidelines, 2011–2012. Available online: http://www.webcitation.org/6ZVy7rMoa (accessed on 22 April 2015).
- National Health and Nutrition Examination Survey: Analytical Guidelines 1999–2010. Available online: http://www.cdc.gov/nchs/data/series/sr_02/sr02_161.pdf (accessed on 9 December 2016).
- Centers for Disease Control and Prevention. Breastfeeding Report Card United States 2014; Centers for Disease Control and Prevention: Atlanta, GA, USA, 2014.
- Siega-Riz, A.M.; Deming, D.M.; Reidy, K.C.; Fox, M.K.; Condon, E.; Briefel, R.R. Food consumption patterns of infants and toddlers: Where are we now? J. Am. Diet. Assoc. 2010, 110, S38–S51. [Google Scholar] [CrossRef] [PubMed]
- Centers for Disease Control and Prevention. Progress in Increasing Breastfeeding and Reducing Racial/Ethnic Differences—United States, 2000–2008 Births. Morb. Mortal. Wkly. Rep. (MMWR) 2013, 62, 77–80. [Google Scholar]
- Jones, K.M.; Power, M.L.; Queenan, J.T.; Schulkin, J. Racial and ethnic disparities in breastfeeding. Breastfeed. Med. 2015, 10, 186–196. [Google Scholar] [CrossRef] [PubMed]
- American Academy of Pediatrics. Breastfeeding and the Use of Human Milk. Pediatrics 2012, 129, e827–e841. [Google Scholar]
- Han, E.; Powell, L.M. Consumption patterns of sugar-sweetened beverages in the United States. J. Acad. Nutr. Diet. 2013, 113, 43–53. [Google Scholar] [CrossRef] [PubMed]
- Ahluwalia, N.; Herrick, K.A.; Rossen, L.M.; Rhodes, D.; Kit, B.; Moshfegh, A.; Dodd, K.W. Usual nutrient intakes of US infants and toddlers generally meet or exceed Dietary Reference Intakes: Findings from NHANES 2009–2012. Am. J. Clin. Nutr. 2016, 104, 1167–1174. [Google Scholar] [CrossRef] [PubMed]
- Food and Agriculture Organization of the United Nations (FAO). FAO/INFOODS Databases Density Database Version 2.0. Available online: http://www.fao.org/docrep/017/ap815e/ap815e.pdf (accessed on 16 December 2017).
- Nicklas, T.A.; O’Neil, C.E.; Fulgoni, V.L. Consumption of 100% Fruit Juice is Associated with Better Nutrient Intake and Diet Quality but not with Weight Status in Children: NHANES 2007–2010. Int. J. Child Health Nutr. 2015, 4, 112–121. [Google Scholar] [CrossRef]
- U.S. 2015 Dietary Guidelines Advisory Committee. Scientific Report of the 2015 Dietary Guidelines Advisory Committee. Available online: http://www.webcitation.org/6ZVyJBo45 (accessed on 15 March 2015).
- American Academy of Pediatrics Committee on Nutrition. The Use and Misuse of Fruit Juice in Pediatrics. Pediatrics 2001, 107, 1210–1213. [Google Scholar]
- O’Connor, T.; Yang, S.-J.; Nicklas, T.A. Beverage Intake Among Preschool Children and Its Effect on Weight Status. Pediatrics 2006, 118, e1013. [Google Scholar]
- Crowe-White, K.; O’Neil, C.E.; Parrott, J.S.; Benson-Davies, S.; Droke, E.; Gutschall, M.; Stote, K.S.; Wolfram, T.; Ziegler, P. Impact of 100% Fruit Juice Consumption on Diet and Weight Status of Children: An Evidence-based Review. Crit. Rev. Food Sci. Nutr. 2016, 56, 871–884. [Google Scholar] [CrossRef] [PubMed]
- O’Neil, C.; Nicklas, T.; Rampersaud, G.; Fulgoni, V.R. One hundred percent orange juice consumption is associated with better diet quality, improved nutrient adequacy, and no increased risk for overweight/obesity in children. Nutr. Res. 2011, 31, 673–682. [Google Scholar] [CrossRef] [PubMed]
- Nicklas, T.A.; O’Neil, C.E.; Kleinman, R. Association between 100% juice consumption and nutrient intake and weight of children aged 2 to 11 years. Arch. Pediatr. Adolesc. Med. 2008, 162, 557–565. [Google Scholar] [CrossRef] [PubMed]
- O’Neil, C.; Nicklas, T. A Review of the Relationship between 100% Fruit Juice Consumption and Weight in Children and Adolescents. Am. J. Lifestyle Med. 2008, 2, 315–354. [Google Scholar] [CrossRef]
- Taveras, E.M.; Gillman, M.W.; Kleinman, K.; Rich-Edwards, J.W.; Rifas-Shiman, S.L. Racial/ethnic differences in early-life risk factors for childhood obesity. Pediatrics 2010, 125, 686–695. [Google Scholar] [CrossRef] [PubMed]
- Brener, N.D.; Merlo, C.; Eaton, D.; Kann, L. Beverage Consumption Among High School Students - United States, 2010. Morb. Mortal. Wkly. Rep. (MMWR) 2011, 60, 778–780. [Google Scholar]
- Grimm, G.C.; Harnack, L.; Story, M. Factors associated with soft drink consumption in school-aged children. J. Am. Diet. Assoc. 2004, 104, 1244–1249. [Google Scholar] [CrossRef] [PubMed]
- Dixon, B.; Pena, M.M.; Taveras, E.M. Lifecourse approach to racial/ethnic disparities in childhood obesity. Adv. Nutr. 2012, 3, 73–82. [Google Scholar] [CrossRef] [PubMed]
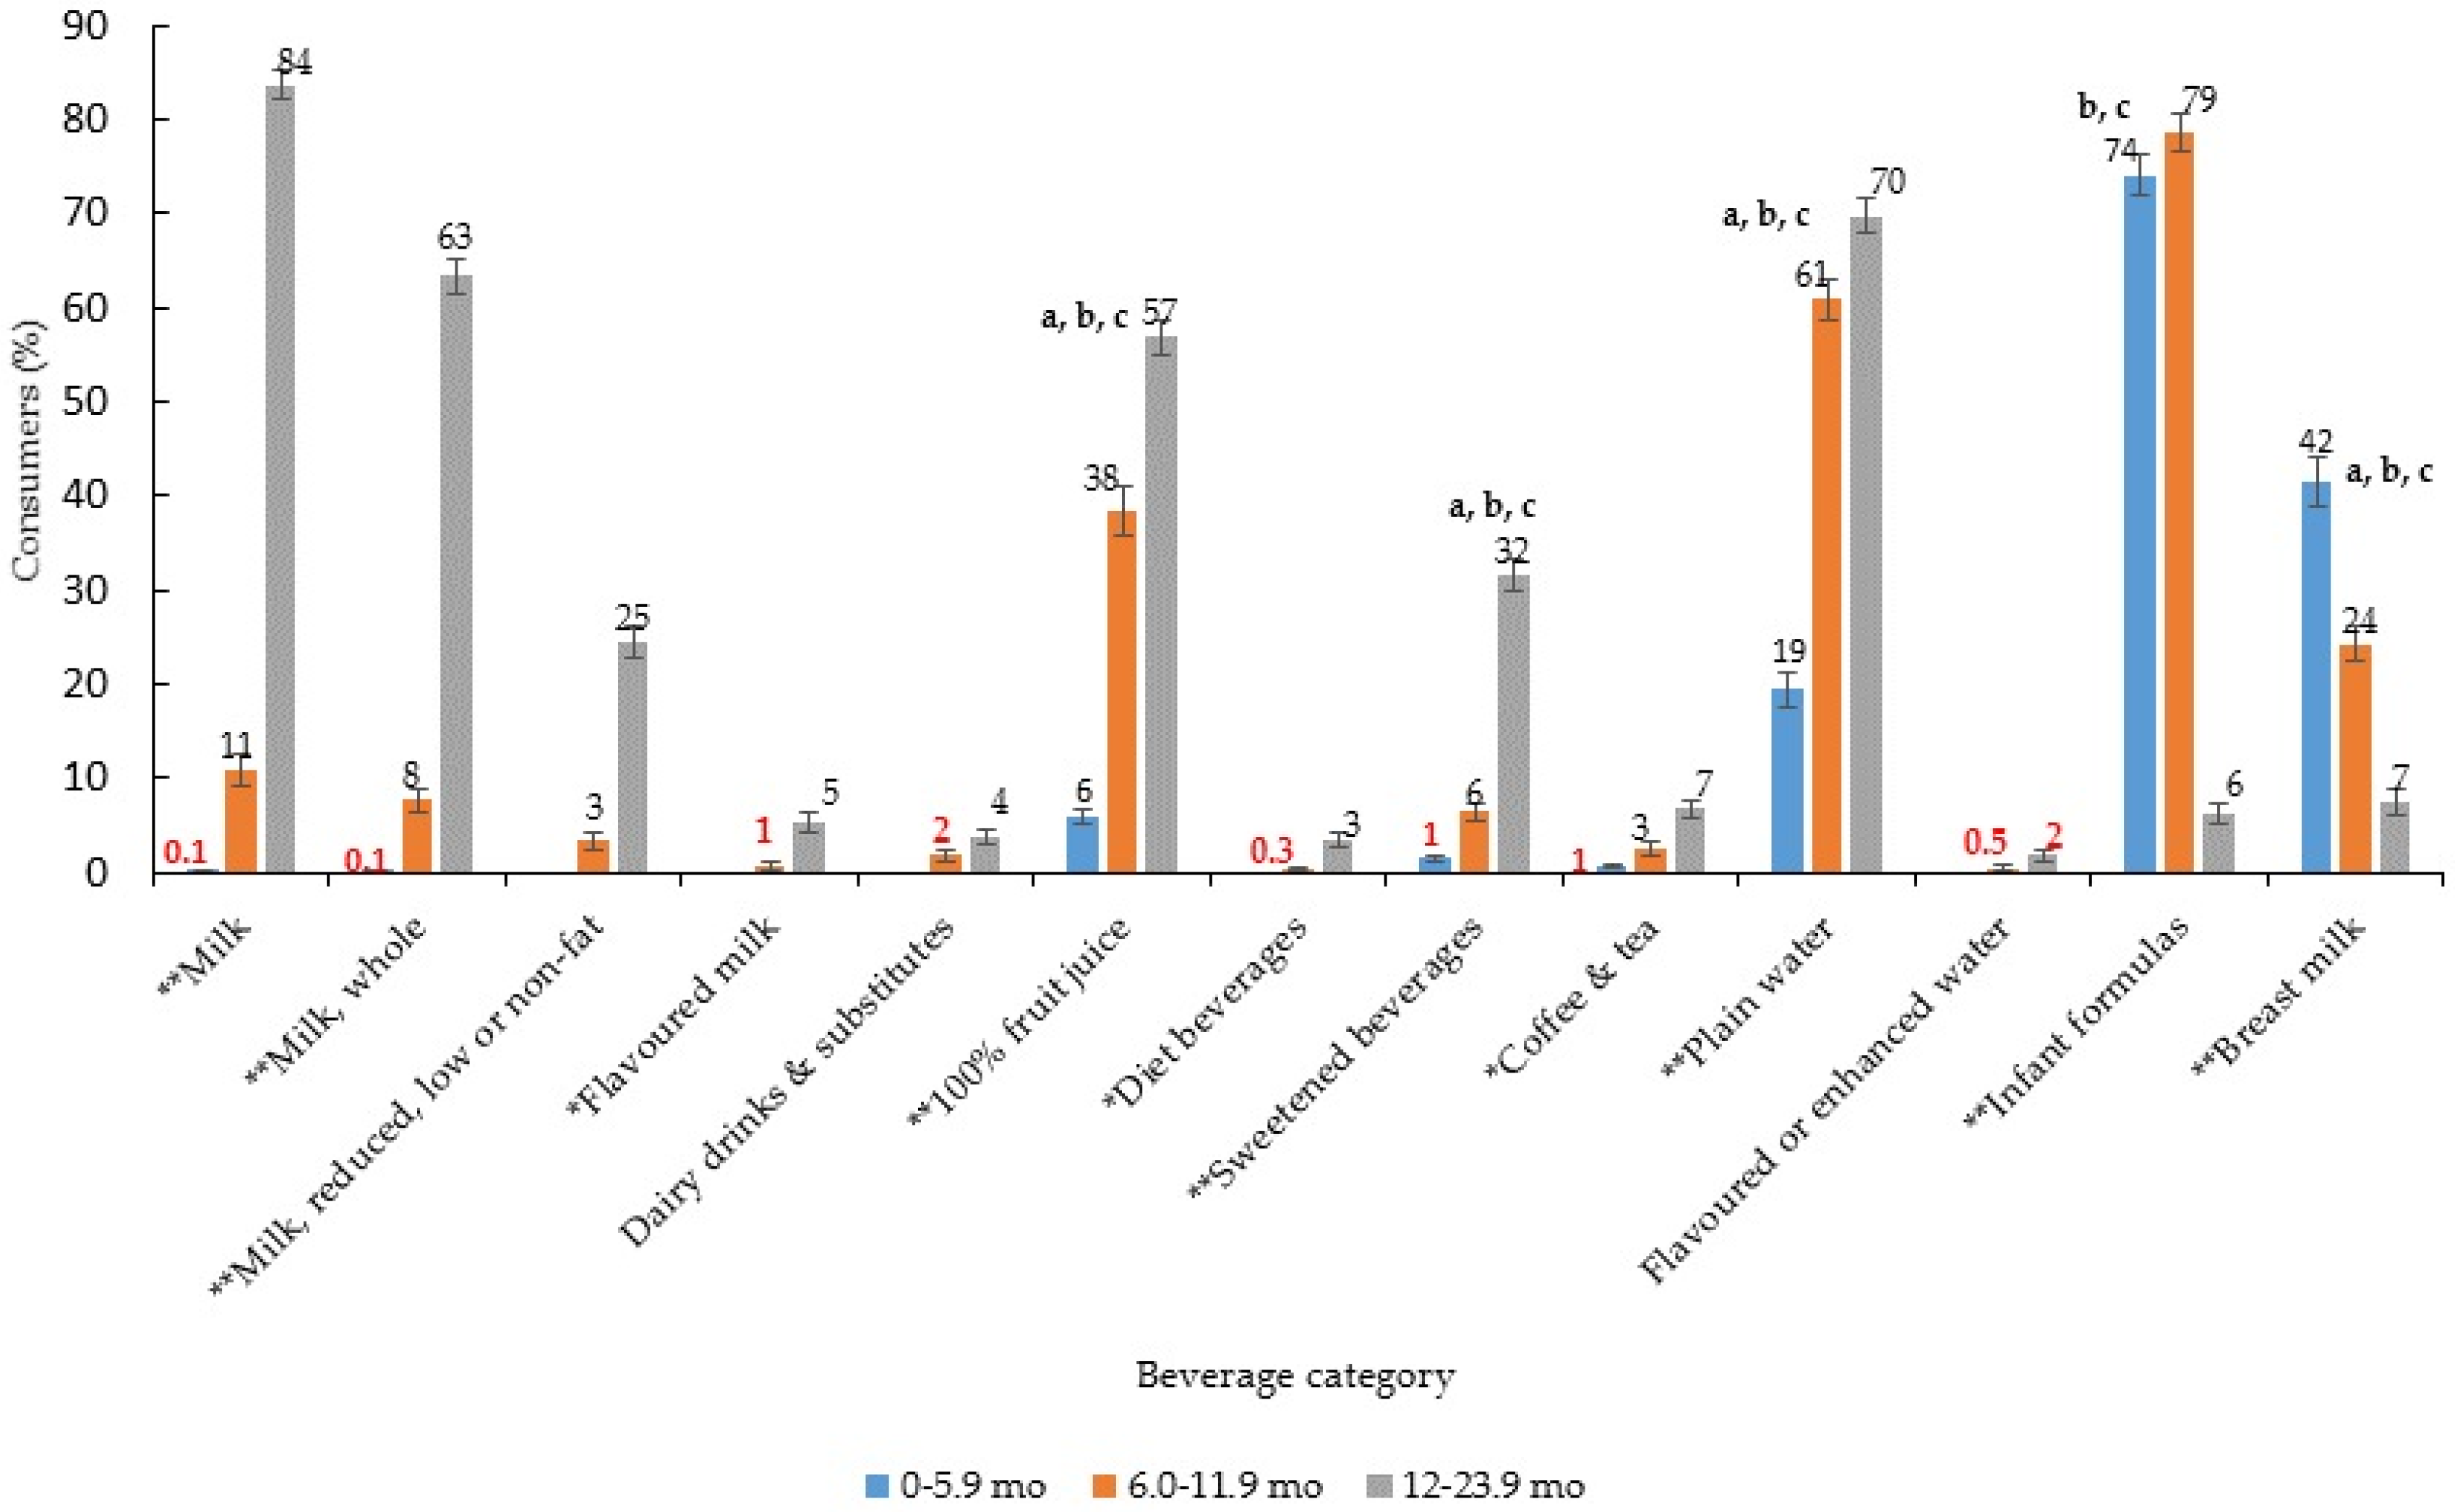
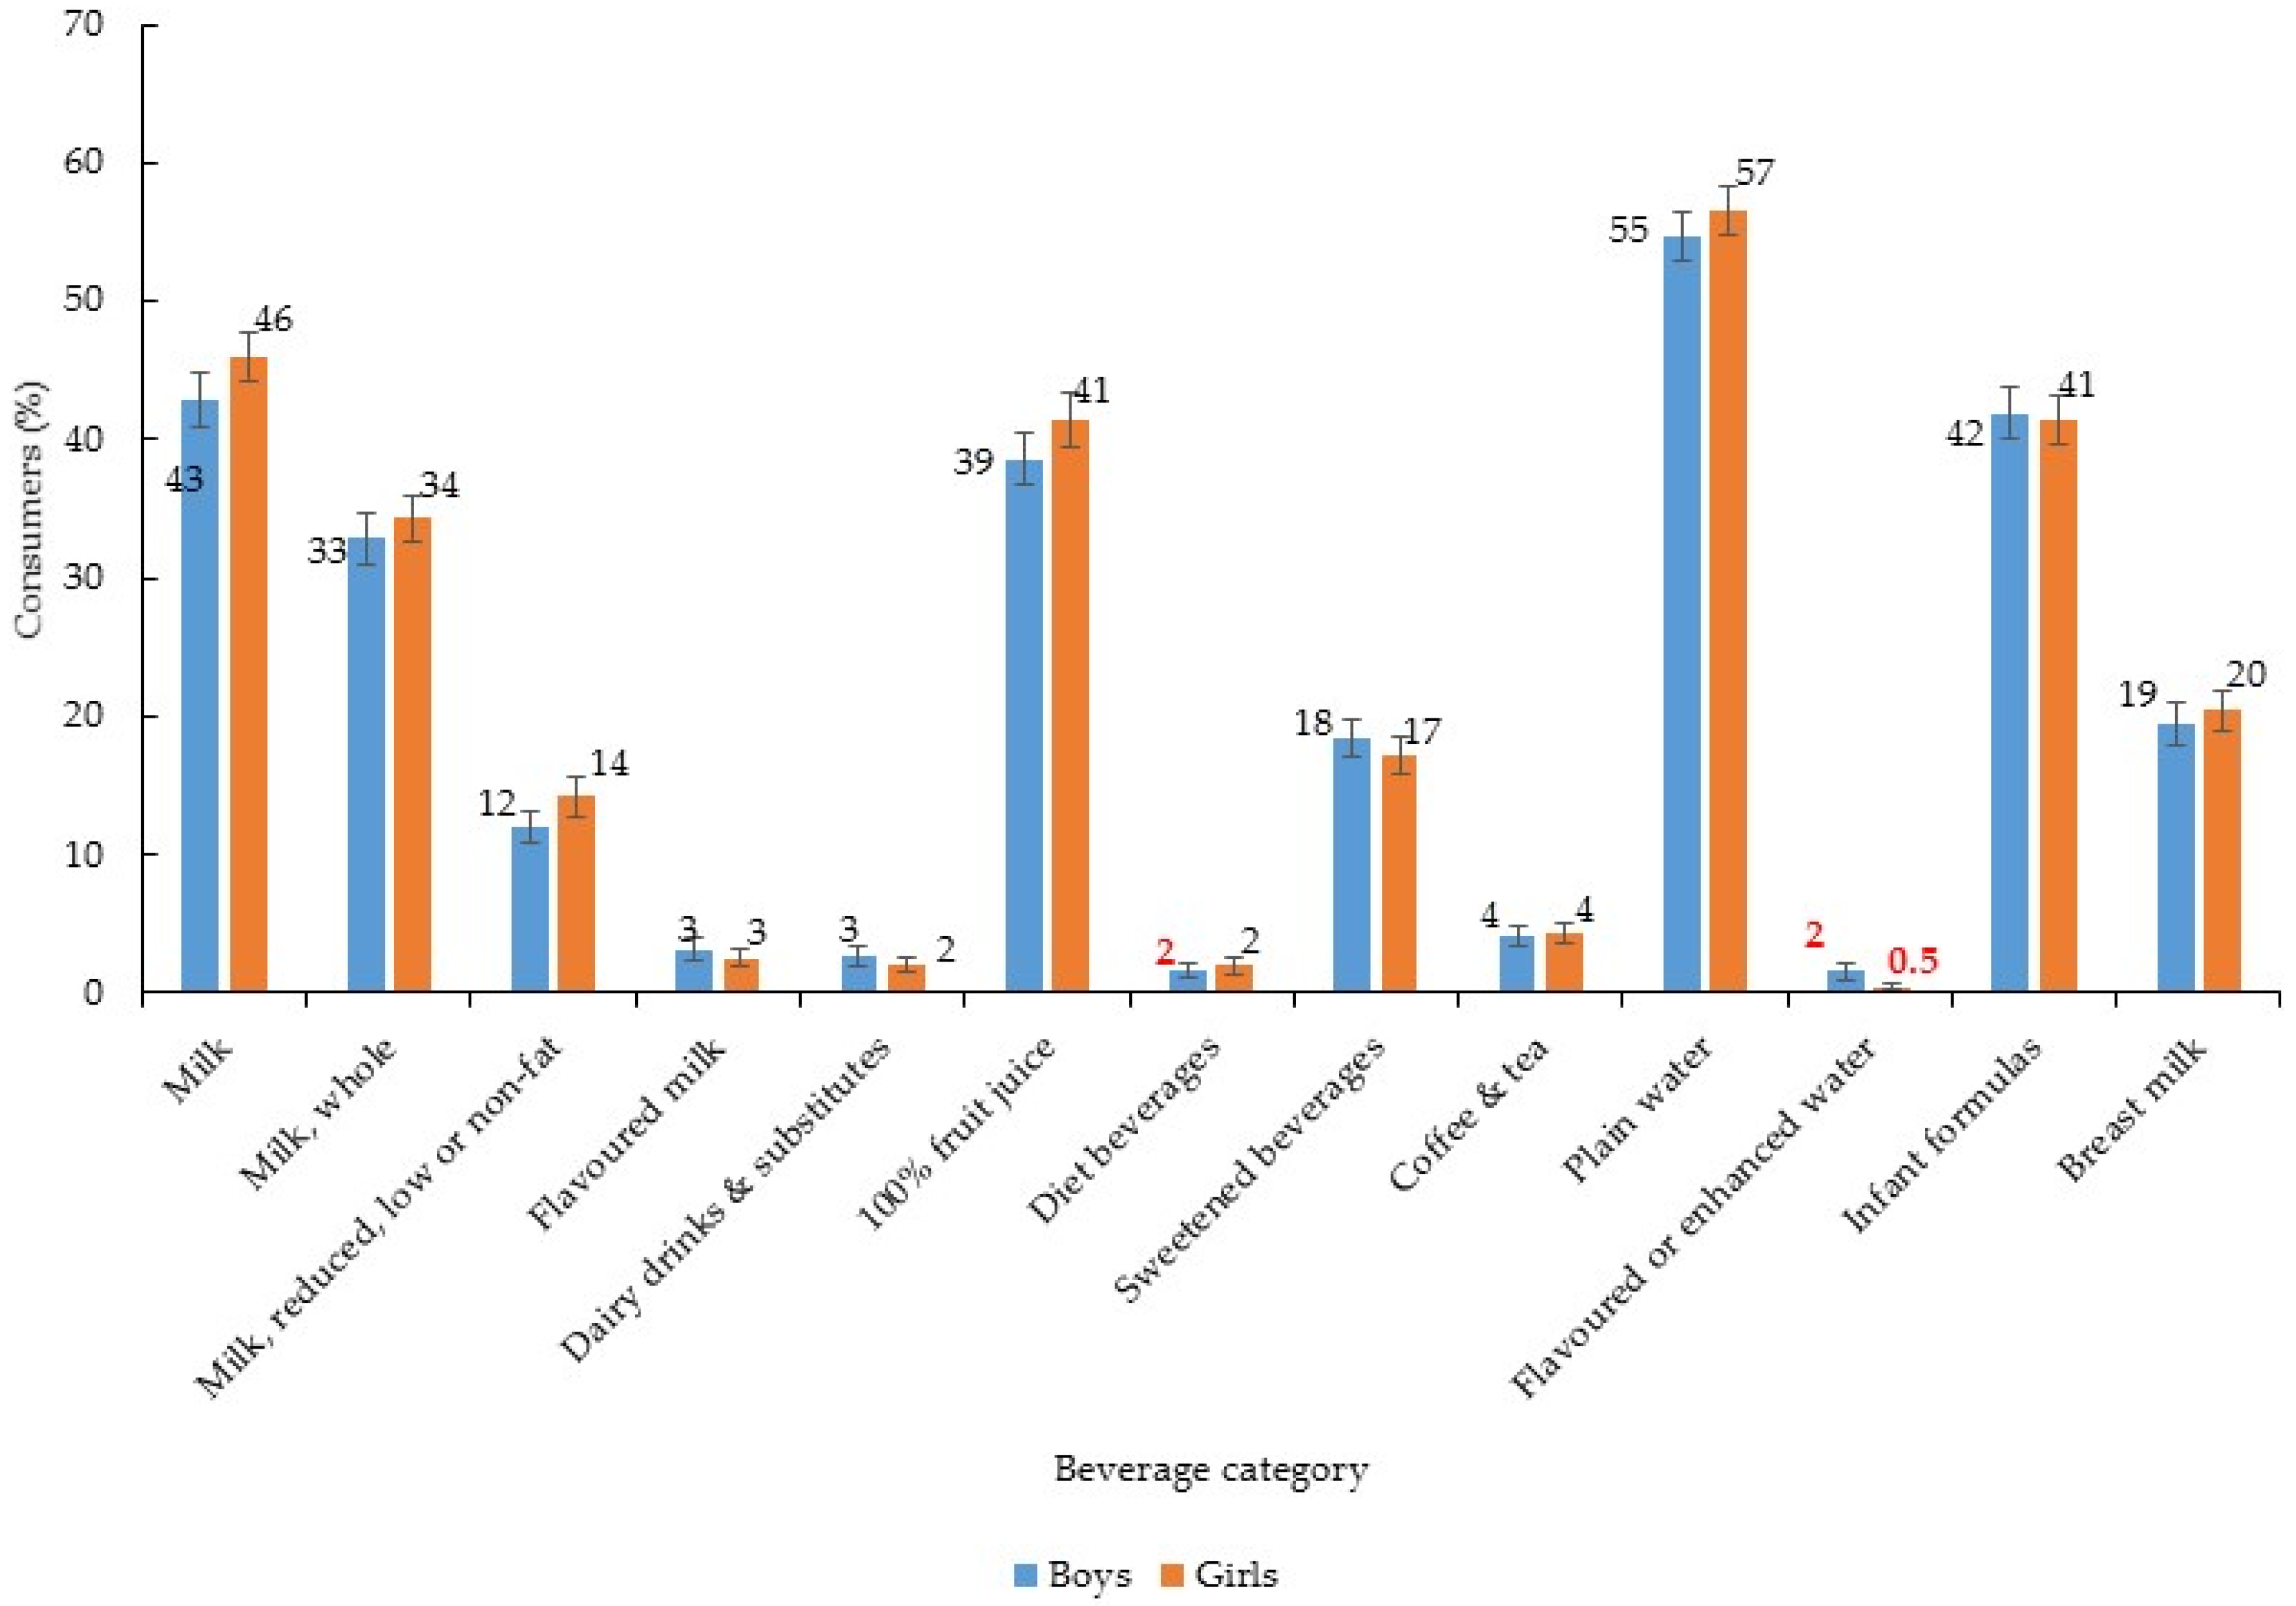
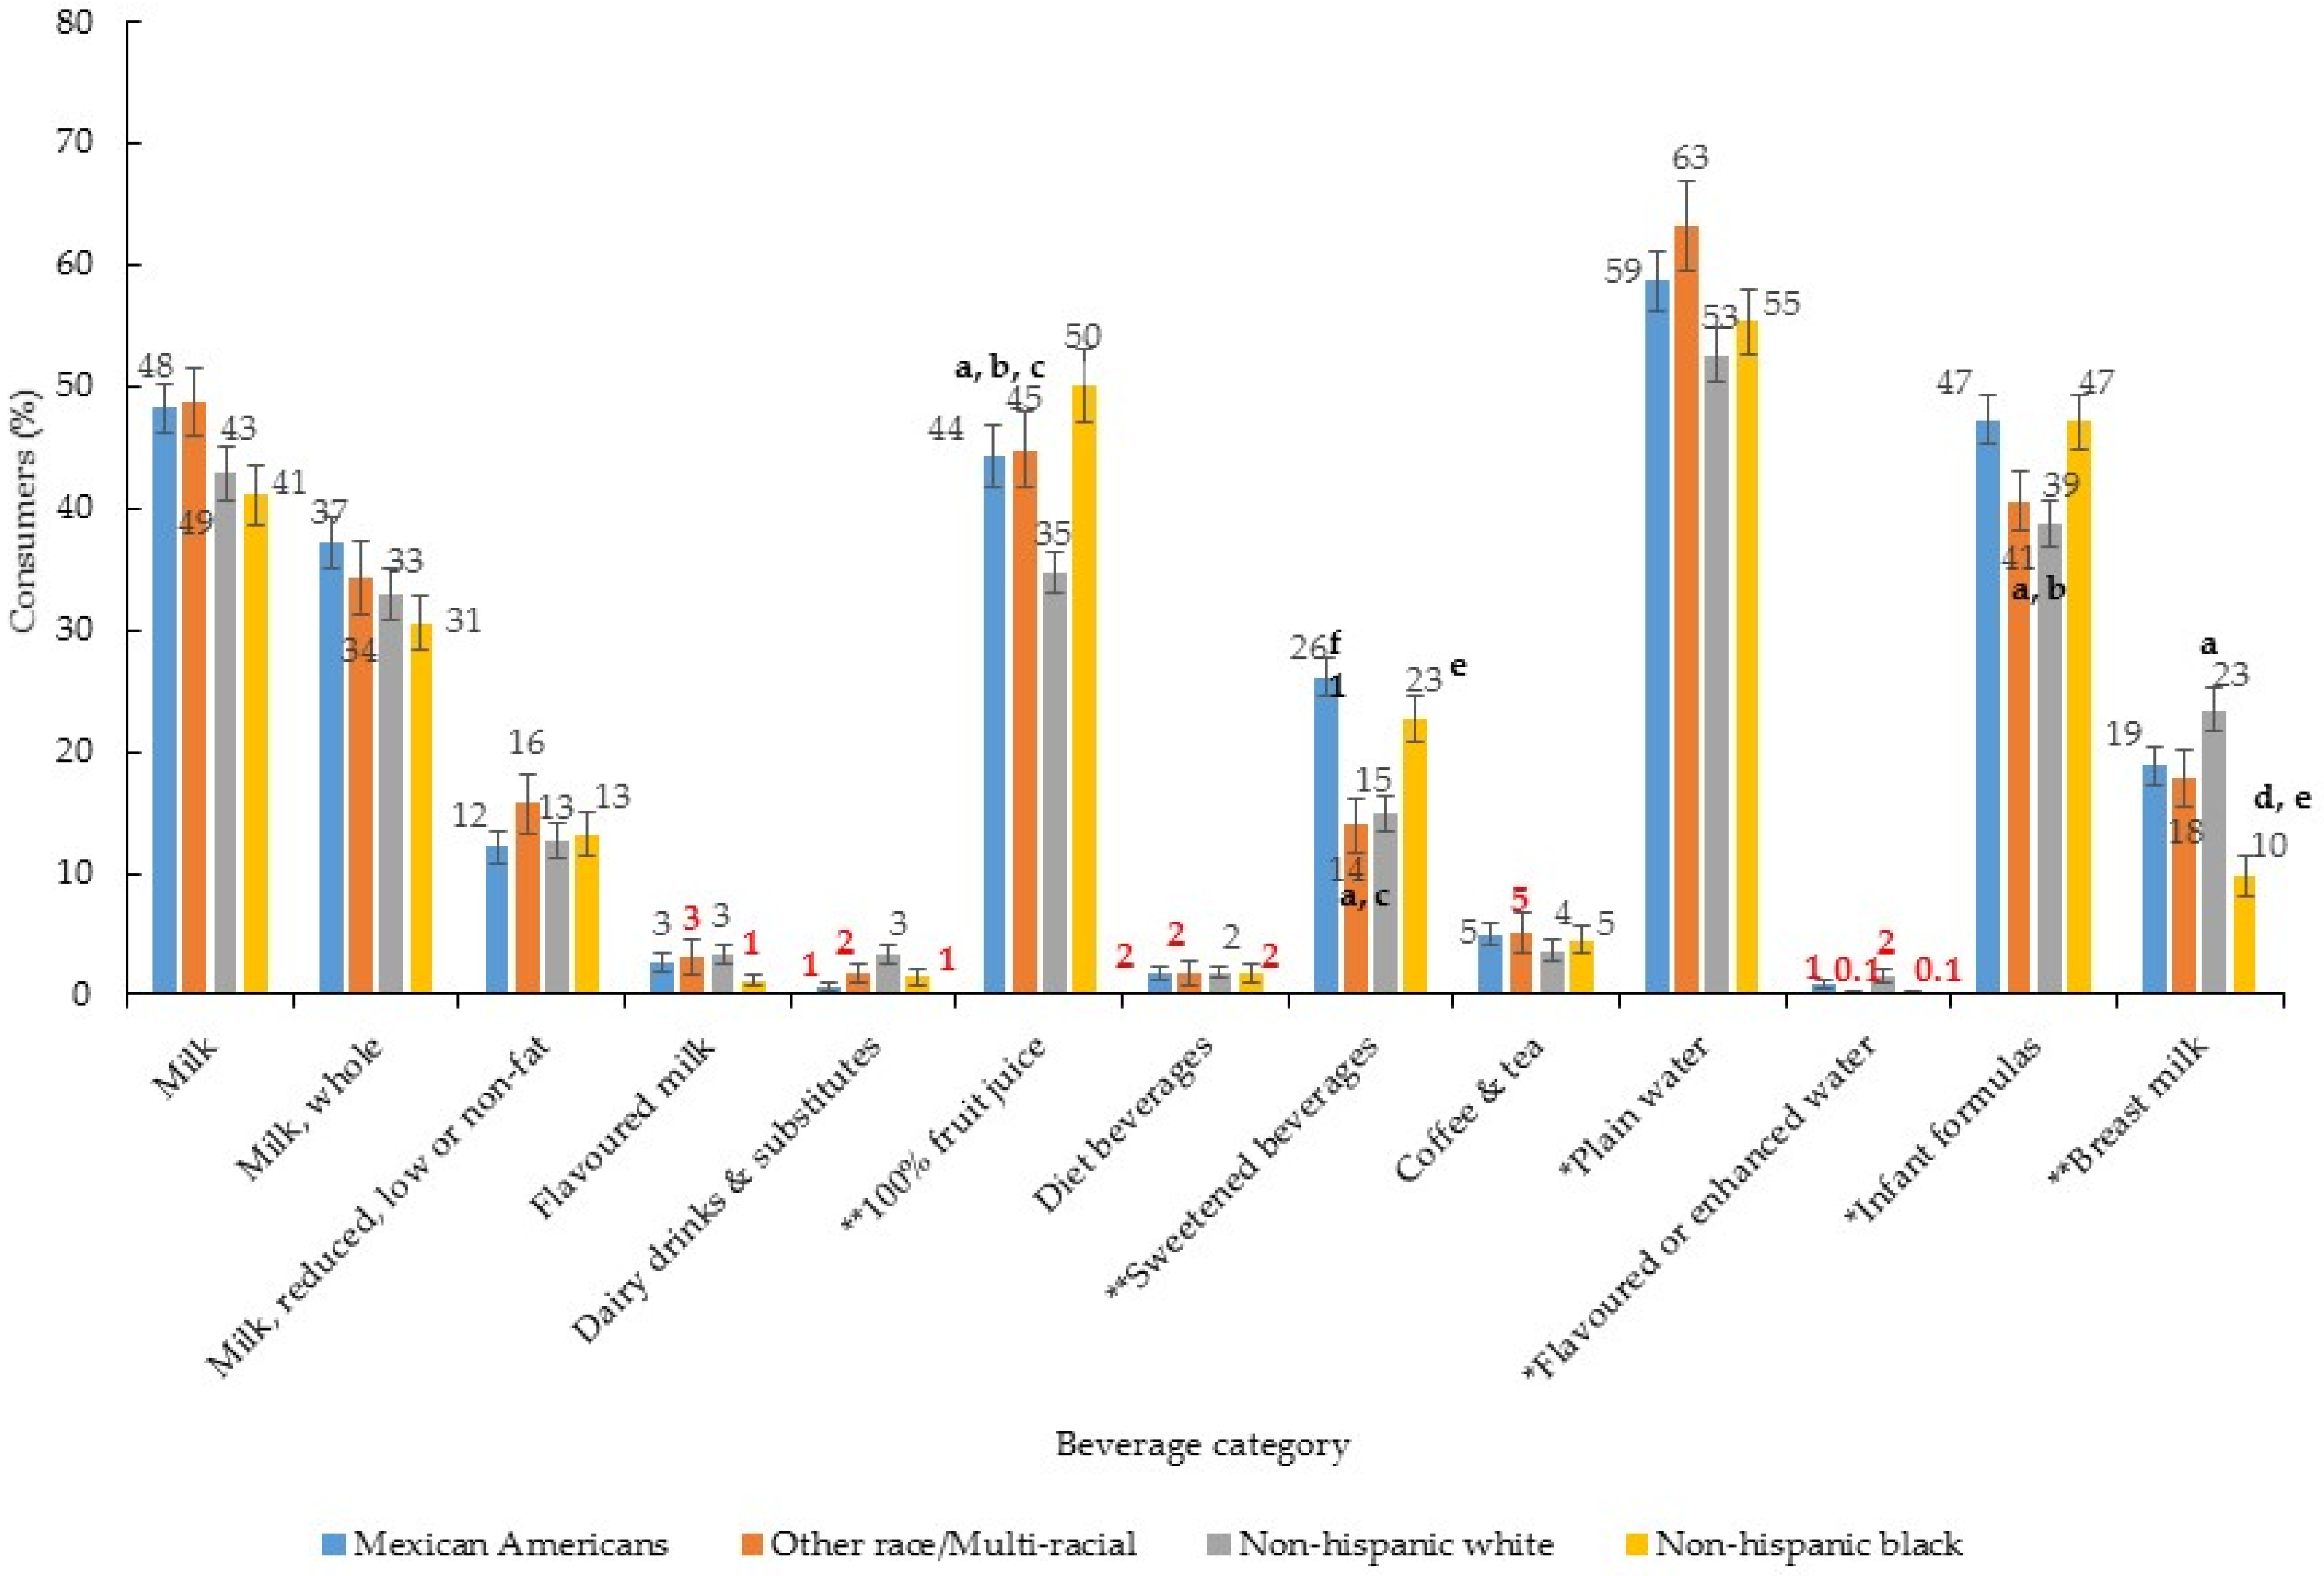
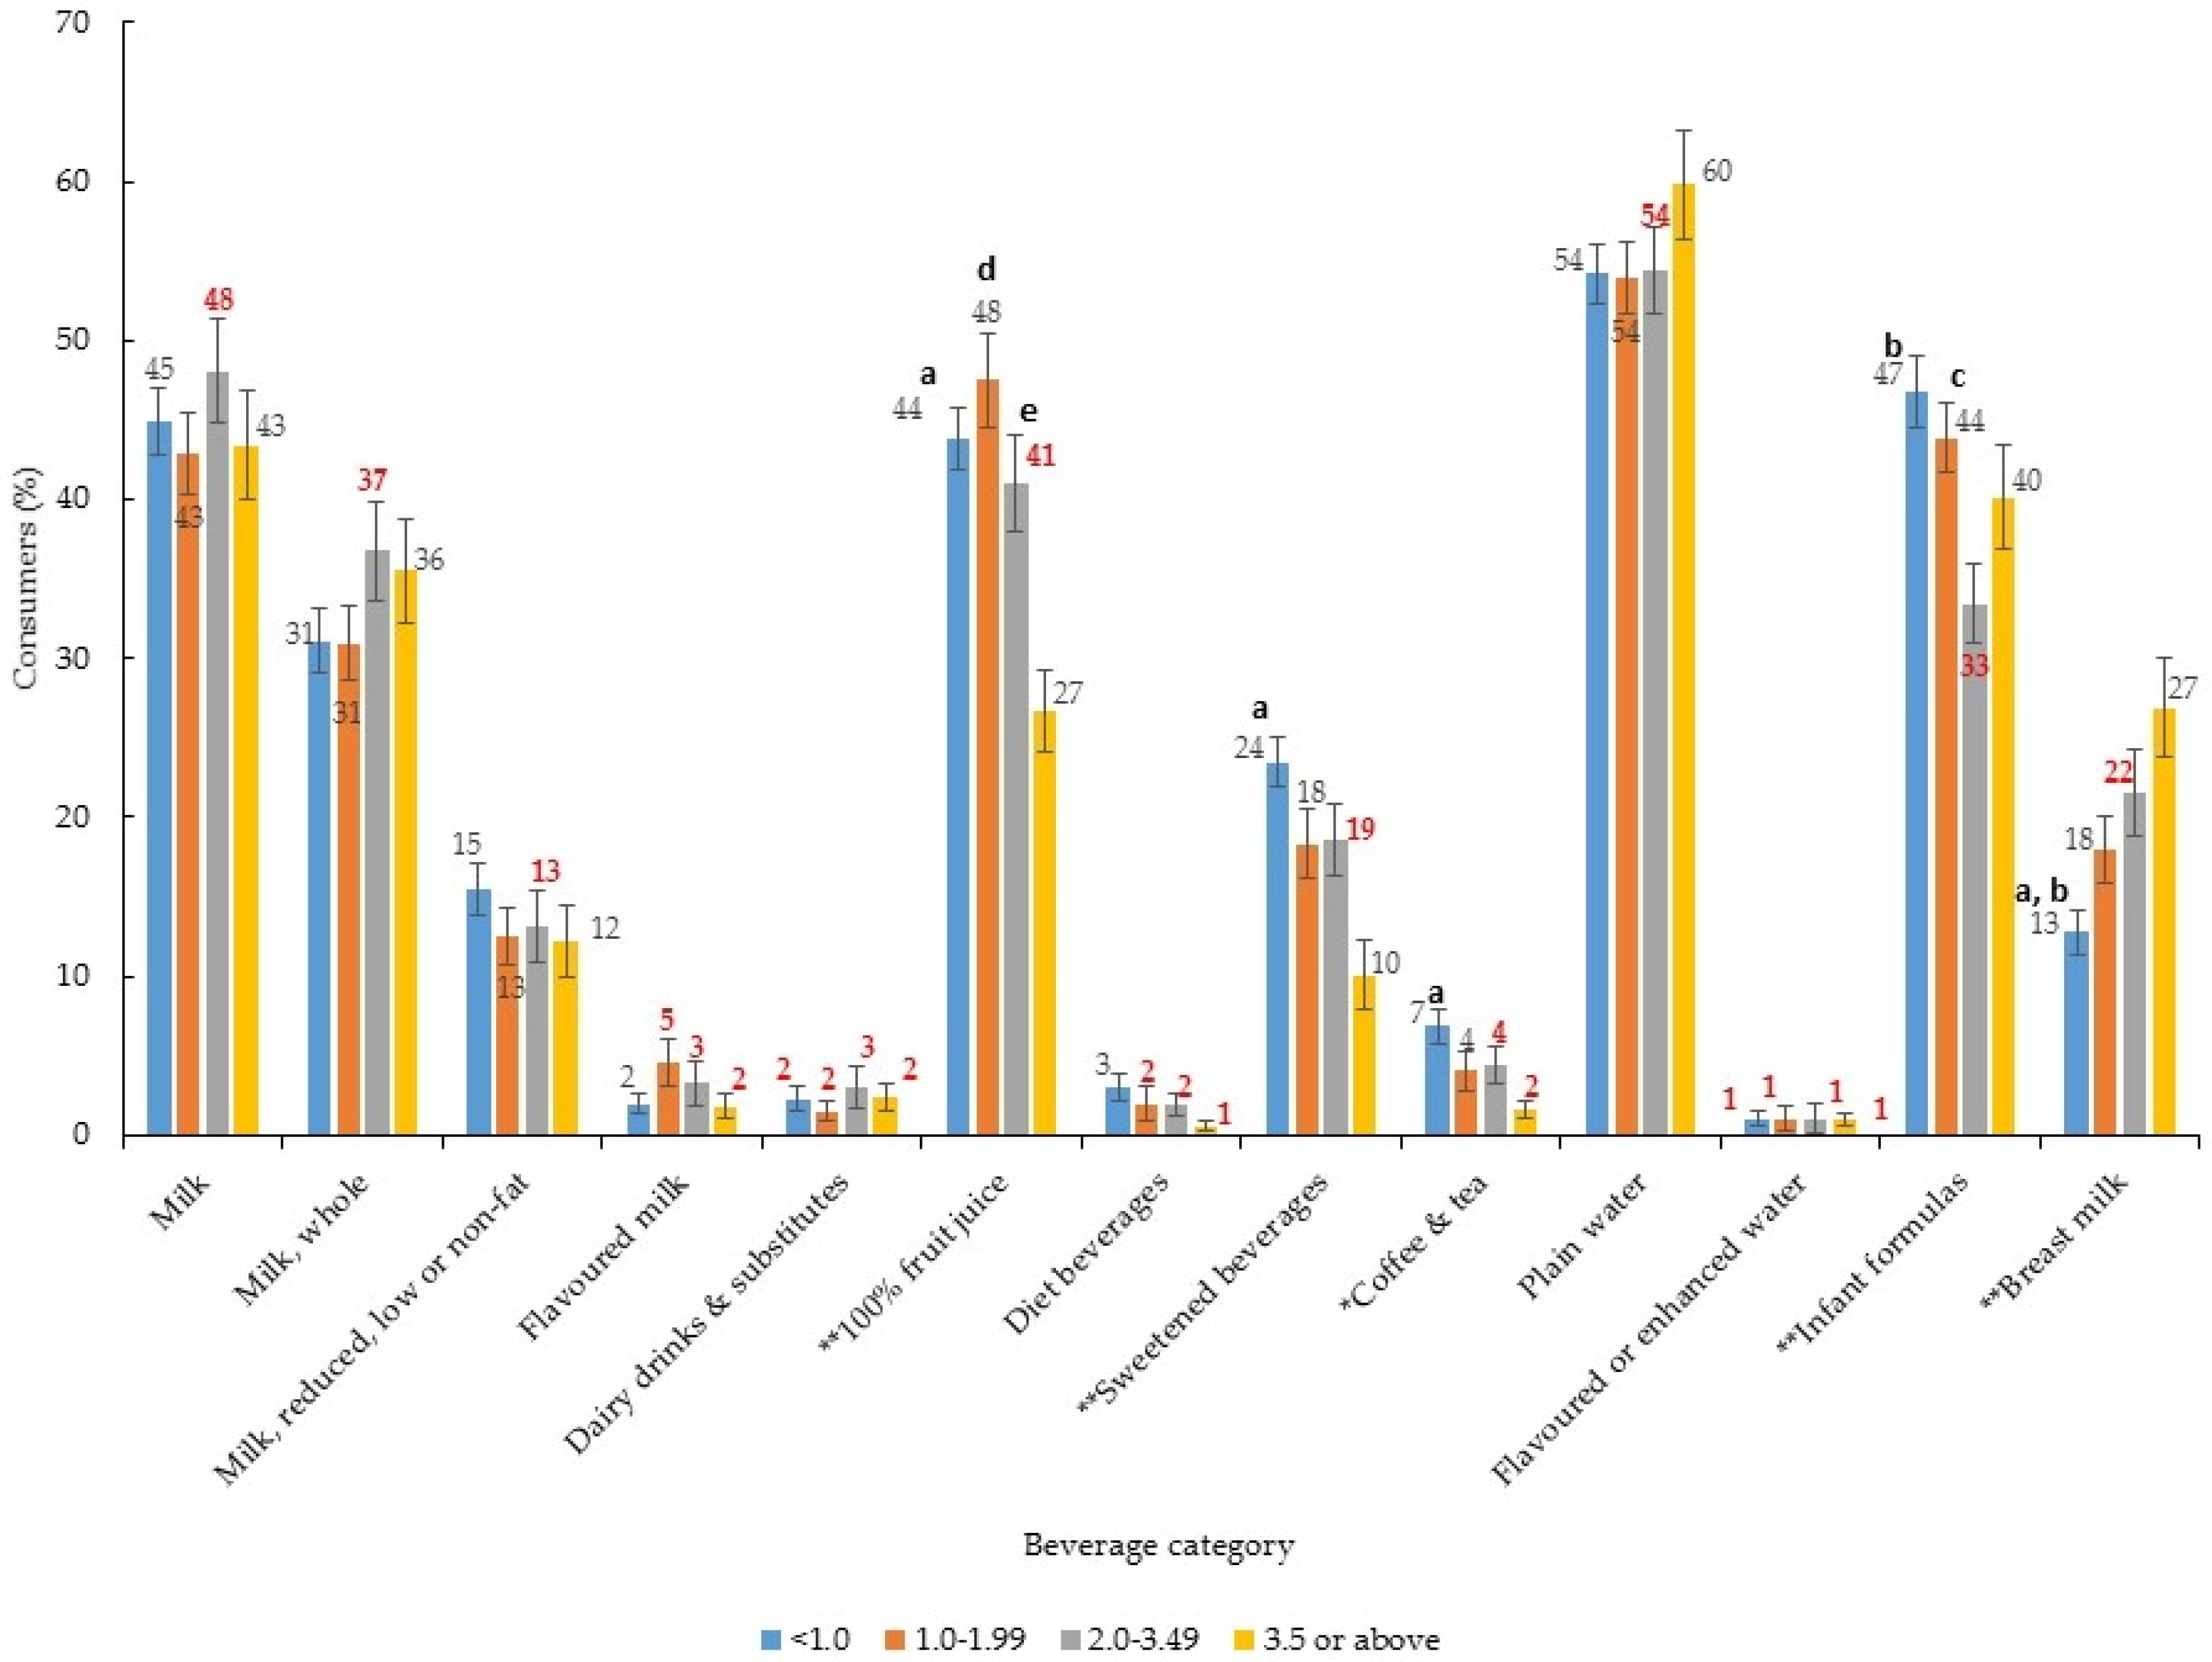
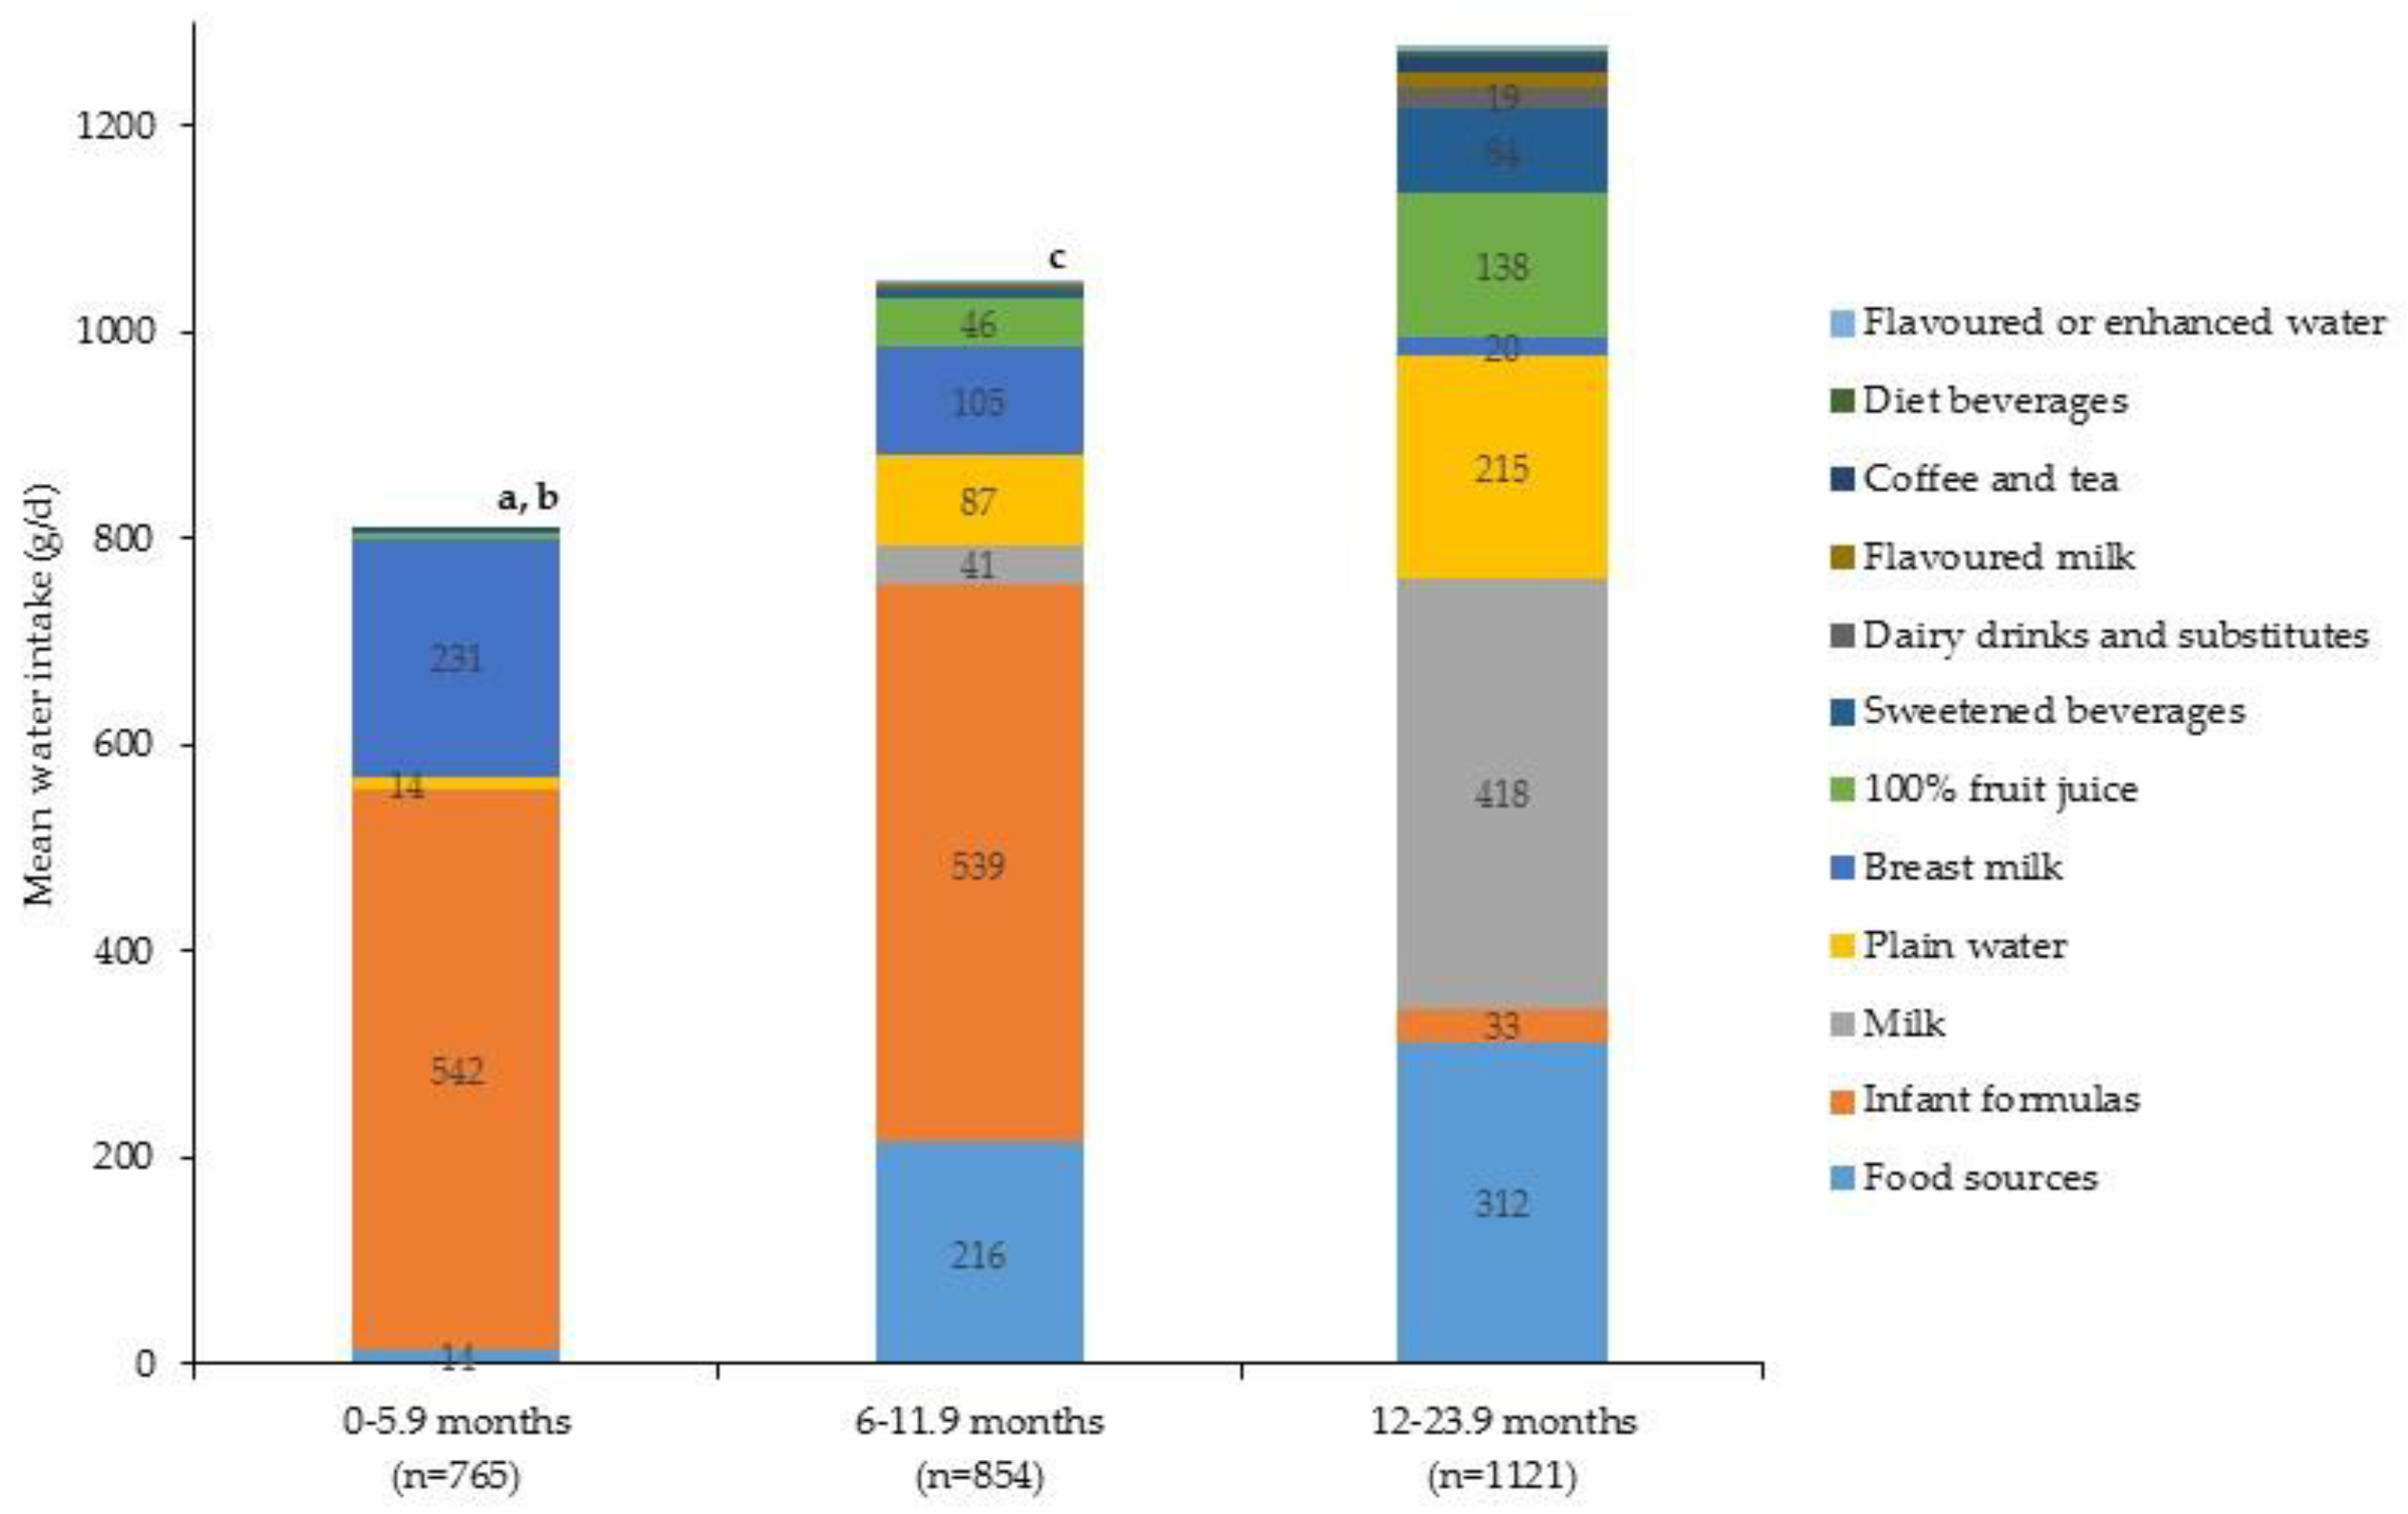
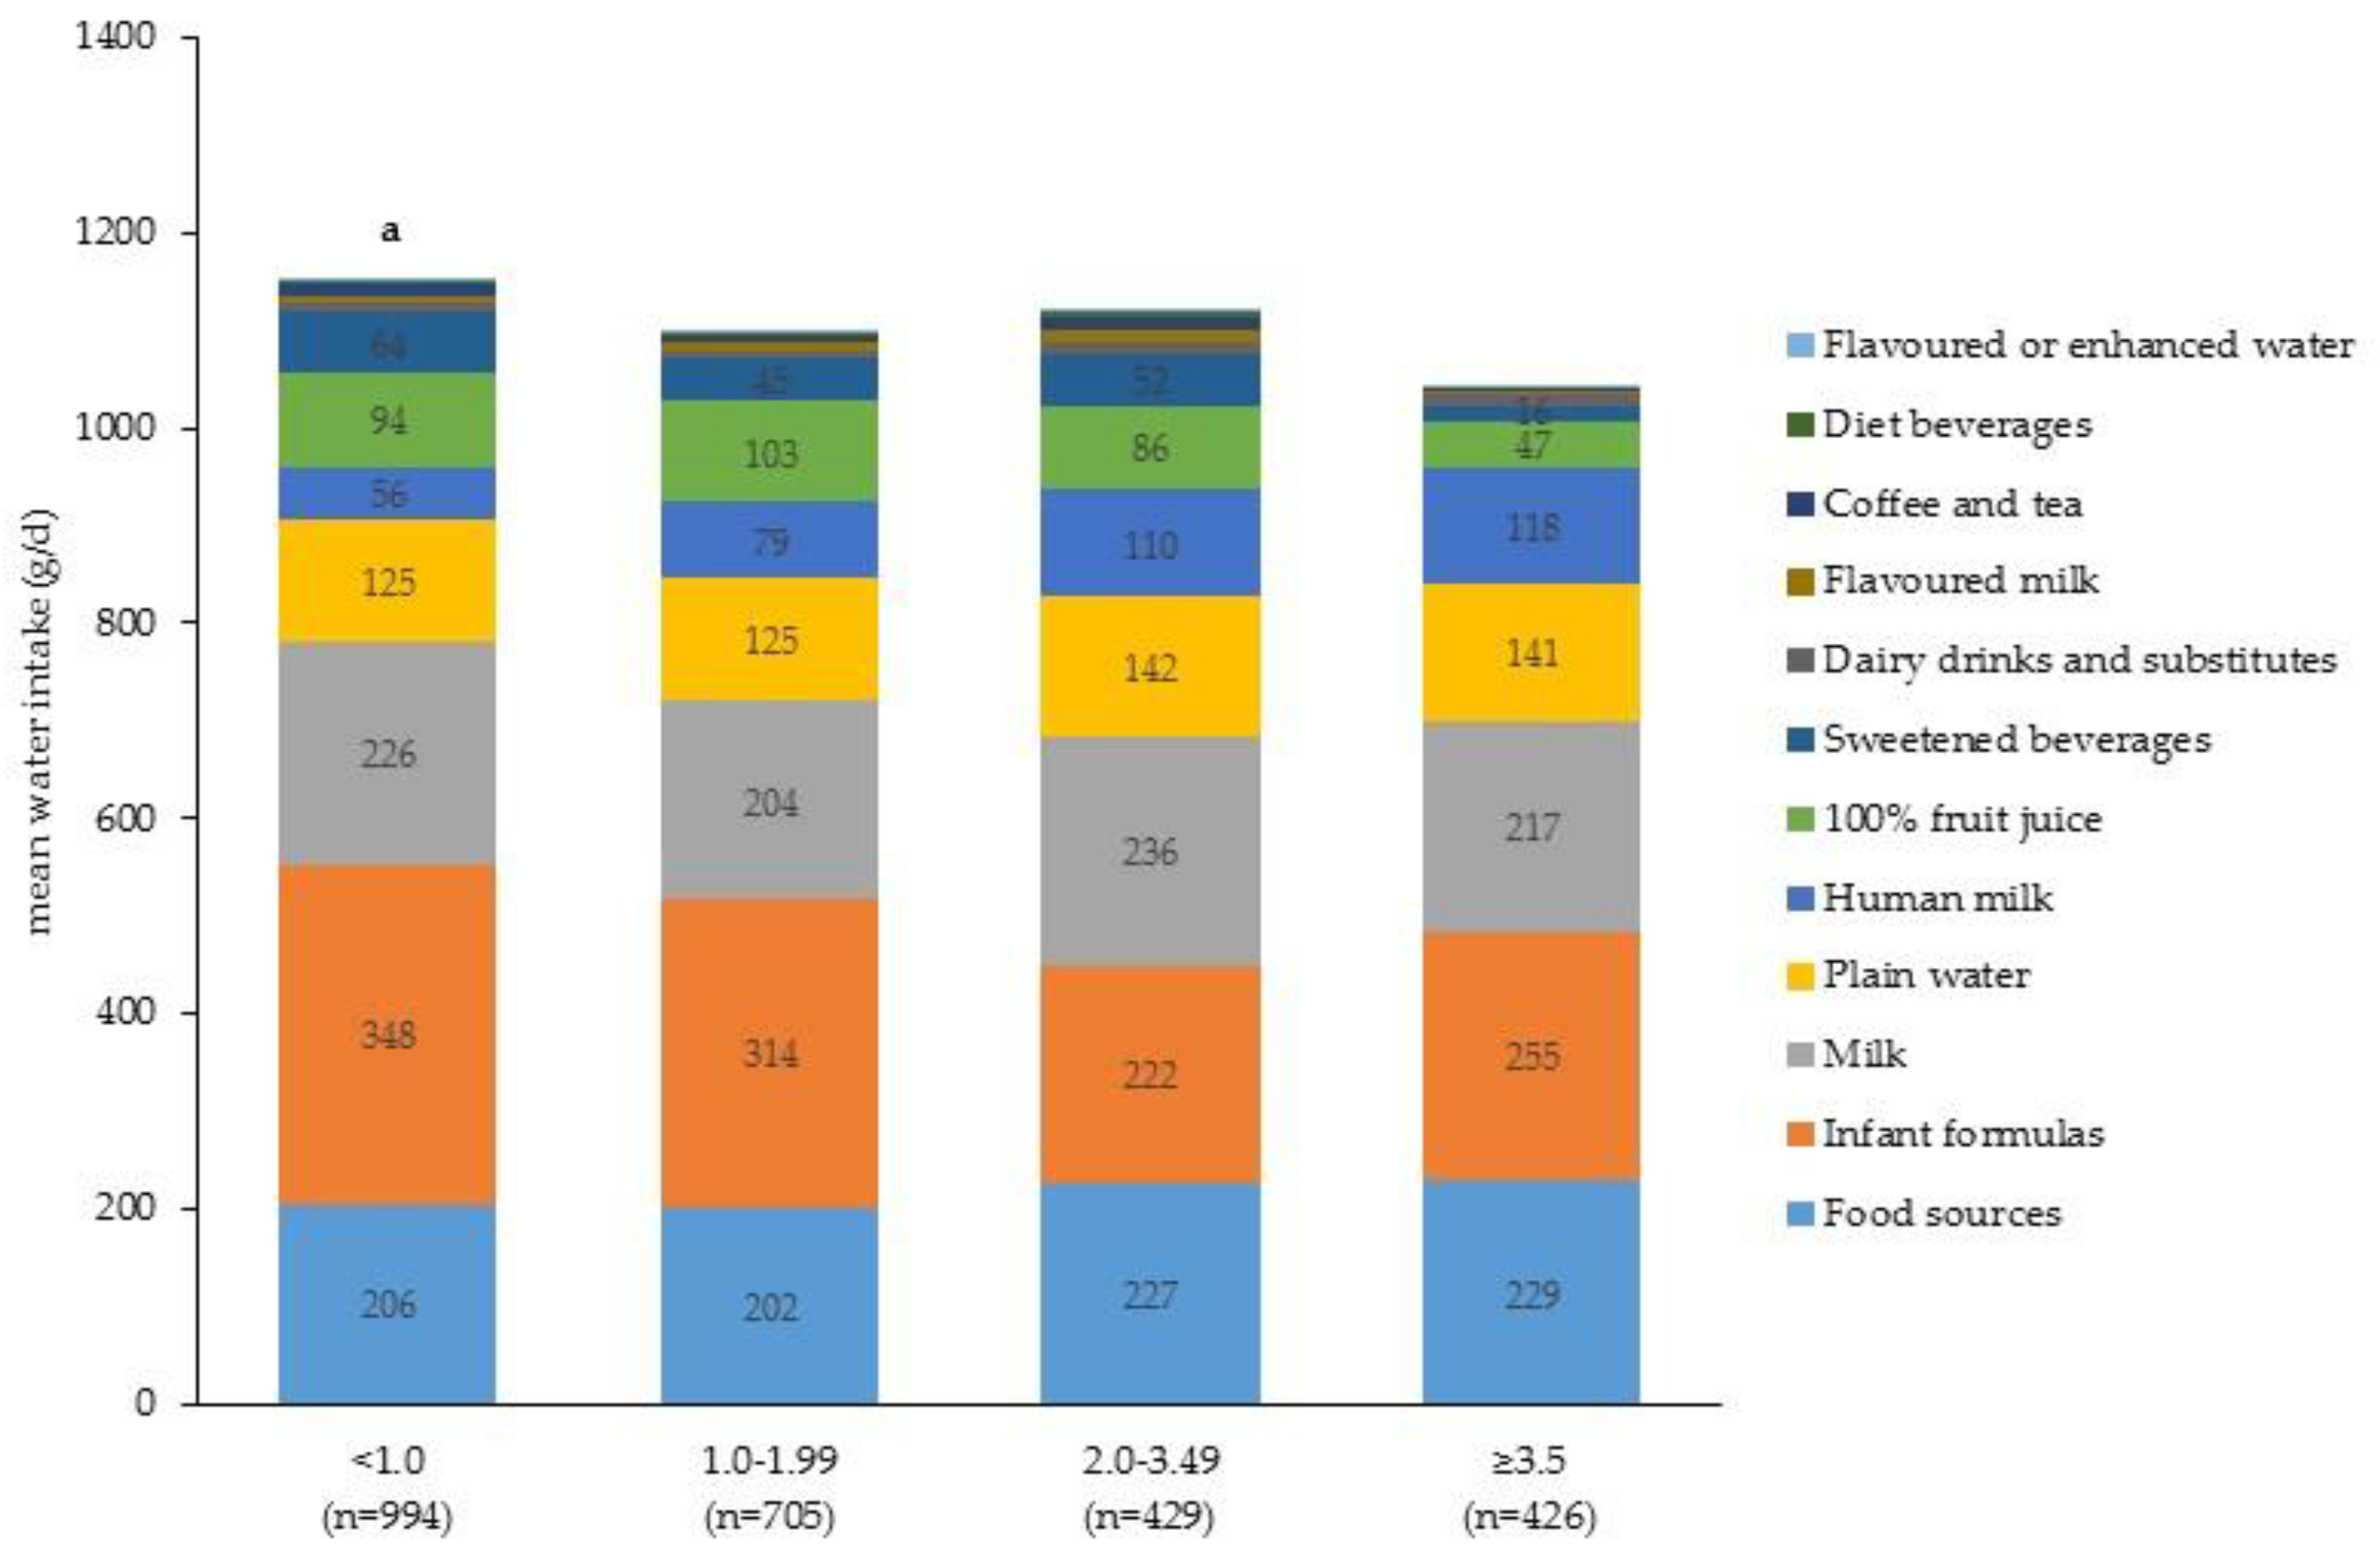
| Beverage Category | Per Capita Mean Intake ± SE (g/Day) | Per Consumer Mean Intake ± SE (g/Day) | ||||||
|---|---|---|---|---|---|---|---|---|
| 0–5.9 Months | 6.0–11.9 Months | 12.0–23.9 Months | p-Value 1 | 0–5.9 Months | 6.0–11.9 Months | 12.0–23.9 Months | p-Value 1 | |
| Milk 2 | 0 0 | 46 ± 8 | 472 ± 14.4 | <0.001 | 7.6 †† | 426 ± 41 | 565 ± 14 | <0.001 |
| Milk, whole 2 | 0 ± 0 | 35 ± 7 | 363 ± 12.7 | <0.001 | 7.6 †† | 460 ± 48 | 572 ± 15 | 0.03 |
| Milk, reduced, low or non-fat 3 | 0 | 11 ± 4 | 109 ± 9.1 | <0.001 | n/a | 325 ± 76 | 446 ± 26 | 0.14 3 |
| Flavoured milk 3 | 0 | 1 ± 0.3 † | 20 ± 4.8 | <0.001 | n/a | 95 ± 29 † | 363 ± 59 | <0.001 |
| Dairy drinks & substitutes 3 | 0 | 4 ± 2 † | 21 ± 4.8 | 0.03 | n/a | 234 ± 105 †,c | 542 ± 79 | 0.04 |
| 100% fruit juice | 6 ± 1 a,b | 53 ± 4 c | 158 ± 10.0 | <0.001 | 99 ± 12 a,b | 138 ± 7 c | 278 ± 13 | <0.001 |
| Diet beverages 3 | 0 | 0.7 ± 0.4 † | 6 ± 1.3 | <0.001 | n/a | 22 ± 17 † | 183 ± 24 | <0.001 |
| Sweetened beverages | 2 ± 1 †,a,b | 10 ± 2 †,c | 94 ± 8.0 | <0.001 | 155 ± 74 † | 163 ± 23 c | 296 ± 20 | <0.001 |
| Coffee & tea | 1 ± 0.5 †,b | 2 ± 1 †,c | 15 ± 3.6 | <0.001 | 132 ± 33 | 77 ± 14 c | 223 ± 44 | 0.01 |
| Plain water | 15 ± 2 a,b | 87 ± 6 c | 215 ± 9.6 | <0.001 | 75 ± 10 a,b | 143 ± 10 c | 308 ± 10 | <0.001 |
| Flavoured or enhanced water 3 | 0 | 0 ± 0.4 † | 4 ± 2.1 † | 0.07 | n/a | 87 ± 16 | 236 ± 52 | 0.01 |
| Infant formulas | 618 ± 23 b | 615 ± 20 c | 38 ± 6.8 | <0.001 | 834 ± 17 b | 783 ± 15 c | 591 ± 48 | <0.001 |
| Breast milk | 264 ± 18 a,b | 119 ± 11 c | 23 ± 4.0 | <0.001 | 635 ± 17 a,b | 492 ± 15 c | 304 ± 33 | <0.001 |
| Total beverage intake | 905 ± 10 b | 938 ± 13 c | 1065 ± 18.3 | <0.001 | n/a | n/a | n/a | |
| Beverage Category | Per Capita Mean Intake ± SE (g/Day) | Per Consumer Mean Intake ± SE (g/Day) | ||||
|---|---|---|---|---|---|---|
| Boys | Girls | p-Value 1 | Boys | Girls | p-Value 1 | |
| Milk | 245 ± 13.2 | 249 ± 13.2 | 0.82 | 571 ± 18 | 541 ± 16 | 0.19 |
| Milk, whole | 188 ± 11.5 | 192 ± 11.3 | 0.83 | 572 ± 20 | 558 ± 17 | 0.57 |
| Milk, reduced, low or non-fat | 57 ± 6.7 | 58 ± 7.2 | 0.94 | 475 ± 37 | 405 ± 30 | 0.13 |
| Flavoured milk | 10 ± 4.1 † | 10 ± 2.8 | 0.96 | 314 ± 88 | 383 ± 64 | 0.53 |
| Dairy drinks & substitutes | 11 ± 3.2 † | 12 ± 3.8 † | 0.72 | 392 ± 81 | 598 ± 98 | 0.13 |
| 100% fruit juice | 91 ± 6.9 | 97 ± 7.7 | 0.57 | 236 ± 13 | 235 ± 13 | 0.95 |
| Diet beverages | 2 ± 0.7 † | 4 ± 1.4 † | 0.17 | 122 ± 29 | 216 ± 44 | 0.16 |
| Sweetened beverages | 55 ± 6.3 | 44 ± 4.4 | 0.15 | 302 ± 25 | 258 ± 24 | 0.23 |
| Coffee & tea | 9 ± 3.3 † | 7 ± 1.7 | 0.66 | 219 ± 73 | 173 ± 24 | 0.56 |
| Plain water | 132 ± 8.2 | 136 ± 7.0 | 0.70 | 240 ± 11 † | 240 ± 11 | 0.98 |
| Flavoured or enhanced water | 3 ± 2.0 † | 1 ± 0.6 † | 0.23 | 224 ± 58 | 194 ± 76 † | 0.76 |
| Infant formulas | 335 ± 15.9 | 322 ± 14.8 | 0.51 | 800 ± 17 | 778 ± 17 | 0.36 |
| Breast milk | 102 ± 9.0 | 108 ± 8.1 | 0.69 | 526 ± 20 | 526 ± 17 | 0.99 |
| Total beverage intake | 996 ± 13.6 | 991 ± 14.1 | 0.79 | n/a | n/a | |
| Beverage Category | Per Capita Mean Intake ± SE (g/Day) | Per Consumer Mean Intake ± SE (g/Day) | ||||||||
|---|---|---|---|---|---|---|---|---|---|---|
| Non-HW | Non-HB | MA | Non-HA/OH/OR | p-Value 1 | Non-HW | Non-HB | MA | Non-HA/OH/OR | p-Value 1 | |
| Milk | 246 ± 15 | 210 ± 18 | 271 ± 15 | 255 ± 19 | 0.08 | 574 ± 20 | 511 ± 26 | 563 ± 24 | 522 ± 30 | 0.08 |
| Milk, whole | 189 ± 13 | 167 ± 17 | 210 ± 16 | 190 ± 21 | 0.33 | 573 ± 22 | 546 ± 36 | 566 ± 30 | 554 ± 36 | 0.86 |
| Milk, reduced, low or non-fat | 57 ± 8 | 43 ± 7 | 61 ± 8 | 65 ± 12 | 0.34 | 453 ± 38 | 329 ± 39 b | 502 ± 40 | 412 ± 45 | 0.02 |
| Flavoured milk | 12 ± 4 † | 4 ± 2 † | 11 ± 4 † | 7 ± 4 † | 0.16 | 357 ± 82 | 344 ± 88 | 396 ± 119 † | 238 ± 29 | 0.28 |
| Dairy drinks & substitutes | 16 ± 4 | 5 ± 3 † | 3 ± 2 † | 10 ± 6 † | 0.06 | 491 ± 78 | 340 ± 82 | 404 ± 184 † | 559 ± 220 † | 0.54 |
| 100% fruit juice | 80 ± 7 a | 146 ± 17 b | 84 ± 7 | 111 ± 13 | 0.001 | 230 ± 14 | 292 ± 25 b | 189 ± 10 | 249 ± 23 | 0.01 |
| Diet beverages | 3 ± 1 | 2 ± 1 † | 3 ± 1 † | 2 ± 2 † | 0.85 | 197 ± 41 | 135 ± 38 | 160 ± 53 † | 141 ± 49 † | 0.63 |
| Sweetened beverages | 38 ± 7 a | 73 ± 8 | 69 ± 11 | 50 ± 14 | 0.001 | 256 ± 37 | 320 ± 23 | 262 ± 37 | 361 ± 76 | 0.51 |
| Coffee & tea | 9.0 ± 3 | 11 ± 3 † | 7 ± 2 | 6 ± 2 † | 0.62 | 236 ± 71 | 233 ± 55 | 149 ± 26 | 118 ± 23 | 0.02 |
| Plain water | 102 ± 7 | 122 ± 10 | 108 ± 7 | 129 ± 12 | 0.52 | 243 ± 12 | 249 ± 14 | 208 ± 11 | 222 ± 14 | 0.05 |
| Flavoured or enhanced water | 4 ± 2 | 0.3 ± 0.3 † | 2 ± 0.8 † | 0.1 ± 0.1 † | 0.11 | 226 ± 63 | 237 †† | 186 ± 41 e | 46 †† | 0.001 |
| Infant formulas | 296 ± 17 a | 404 ± 25 | 363 ± 15 | 338 ± 21 | 0.003 | 765 ± 20 a | 859 ± 27 b | 767 ± 20 | 832 ± 18 | <0.01 |
| Breast milk | 126 ± 9 a | 48 ± 9 b,c | 91 ± 9 | 99 ± 15 | <0.001 | 535 ± 18 | 486 ± 31 | 483 ± 21 | 558 ± 27 | 0.19 |
| Total beverage intake | 932 ± 17 a | 1025 ± 22 | 1010 ± 18 | 1008 ± 22 | 0.01 | n/a | n/a | n/a | n/a | |
| Beverage Category | Per Capita Mean Intake ± SE (g/Day) | Per Consumer Mean Intake ± SE (g/Day) | ||||||||
|---|---|---|---|---|---|---|---|---|---|---|
| PIR < 1.0 | PIR1.0–1.99 | PIR 2.0–3.49 | PIR ≥ 3.5 | p-Value 2 | PIR < 1.0 | PIR1.0–1.99 | PIR2.0–3.49 | PIR ≥ 3.5 | p-Value 2 | |
| Milk | 256 ± 16 | 231 ± 16 | 267 ± 25 | 245 ± 27 | 0.62 | 569 ± 22 | 538 ± 25 | 556 ± 37 | 565 ± 30 | 0.86 |
| Milk, whole | 184 ± 12 | 177 ± 16 | 200 ± 21 | 202 ± 24 | 0.77 | 592 ± 23 | 570 ± 29 | 543 ± 39 | 569 ± 29 | 0.70 |
| Milk, reduced, low or non-fat | 71 ± 11 | 54 ± 8 | 68 ± 16 | 43 ± 9 | 0.21 | 462 ± 50 | 434 ± 41 | 513 ± 56 | 353 ± 42 | 0.14 |
| Flavoured milk | 7 ± 3 | 11 ± 3 † | 16 ± 9 † | 7 ± 4 † | 0.65 | 351 ± 105 † | 240 ± 43 | 483 ± 141 | 368 ± 133 † | 0.31 |
| Dairy drinks & substitutes | 12 ± 5 † | 7 ± 4 † | 15 ± 7 † | 12 ± 6 † | 0.73 | 531 ± 95 | 492 ± 89 | 489 ± 133 | 485 ± 155 † | 0.99 |
| 100% fruit juice | 108 ± 9 a | 118 ± 12 c | 99 ± 13 d | 54 ± 8 | 0.001 | 246 ± 15 | 249 ± 19 | 240 ± 25 | 202 ± 23 | 0.46 |
| Diet beverages | 4 ± 1 | 3 ± 2 † | 5 ± 2 † | 2 ± 1 † | 0.49 | 124 ± 29 a | 170 ± 59 † | 233 ± 63 | 301 ± 47 | 0.02 |
| Sweetened beverages | 71 ± 8 a | 51 ± 10 c | 57 ± 16 | 18 ± 5 | <0.001 | 304 ± 23 a | 275 ± 43 | 305 ± 72 | 178 ± 26 | <0.01 |
| Coffee & tea | 13 ± 3 a | 5 ± 2 † | 14 ± 8 † | 2 ± 1 † | 0.004 | 182 ± 29 | 128 ± 38 † | 308 ± 138 † | 119 ± 27 † | 0.32 |
| Plain water | 109 ± 7 | 96 ± 7 | 121 ± 12 | 116 ± 11 | 0.50 | 230 ± 11 | 216 ± 13 e | 258 ± 19 | 234 ± 17 | 0.33 |
| Flavoured or enhanced water | 2 ± 1 † | 2.0 ± 1 † | 4 ± 4 † | 2 ± 0.9 † | 0.93 | 170 ± 62 † | 147 ± 34 | 414 ± 21 d | 169 ± 55 † | 0.001 |
| Infant formulas | 397 ± 21 a,b | 359 ± 20 e | 252 ± 19 | 291 ± 29 | <0.001 | 848 ± 20 a,b | 817 ± 17 c | 755 ± 28 | 726 ± 31 | <0.01 |
| Breast milk | 64 ± 7.0 a,b | 90 ± 12 | 126 ± 15 | 135 ± 17 | <0.001 | 505 ± 26 | 504 ± 30 | 584 ± 25 | 503 ± 27 | 0.09 |
| Total beverage intake | 1042 ± 16 a | 973 ± 18 c | 975 ± 33 | 834 ± 19 | <0.001 | n/a | n/a | n/a | n/a | |
© 2017 by the authors. Licensee MDPI, Basel, Switzerland. This article is an open access article distributed under the terms and conditions of the Creative Commons Attribution (CC BY) license ( http://creativecommons.org/licenses/by/4.0/).
Share and Cite
Grimes, C.A.; Szymlek-Gay, E.A.; Nicklas, T.A. Beverage Consumption among U.S. Children Aged 0–24 Months: National Health and Nutrition Examination Survey (NHANES). Nutrients 2017, 9, 264. https://doi.org/10.3390/nu9030264
Grimes CA, Szymlek-Gay EA, Nicklas TA. Beverage Consumption among U.S. Children Aged 0–24 Months: National Health and Nutrition Examination Survey (NHANES). Nutrients. 2017; 9(3):264. https://doi.org/10.3390/nu9030264
Chicago/Turabian StyleGrimes, Carley A., Ewa A. Szymlek-Gay, and Theresa A. Nicklas. 2017. "Beverage Consumption among U.S. Children Aged 0–24 Months: National Health and Nutrition Examination Survey (NHANES)" Nutrients 9, no. 3: 264. https://doi.org/10.3390/nu9030264
APA StyleGrimes, C. A., Szymlek-Gay, E. A., & Nicklas, T. A. (2017). Beverage Consumption among U.S. Children Aged 0–24 Months: National Health and Nutrition Examination Survey (NHANES). Nutrients, 9(3), 264. https://doi.org/10.3390/nu9030264


