Iron Intake and Dietary Sources in the Spanish Population: Findings from the ANIBES Study

 ,
,  ,
,  , ,
, ,  , ,
, ,  and
and 
Abstract
:1. Introduction
2. Materials and Methods
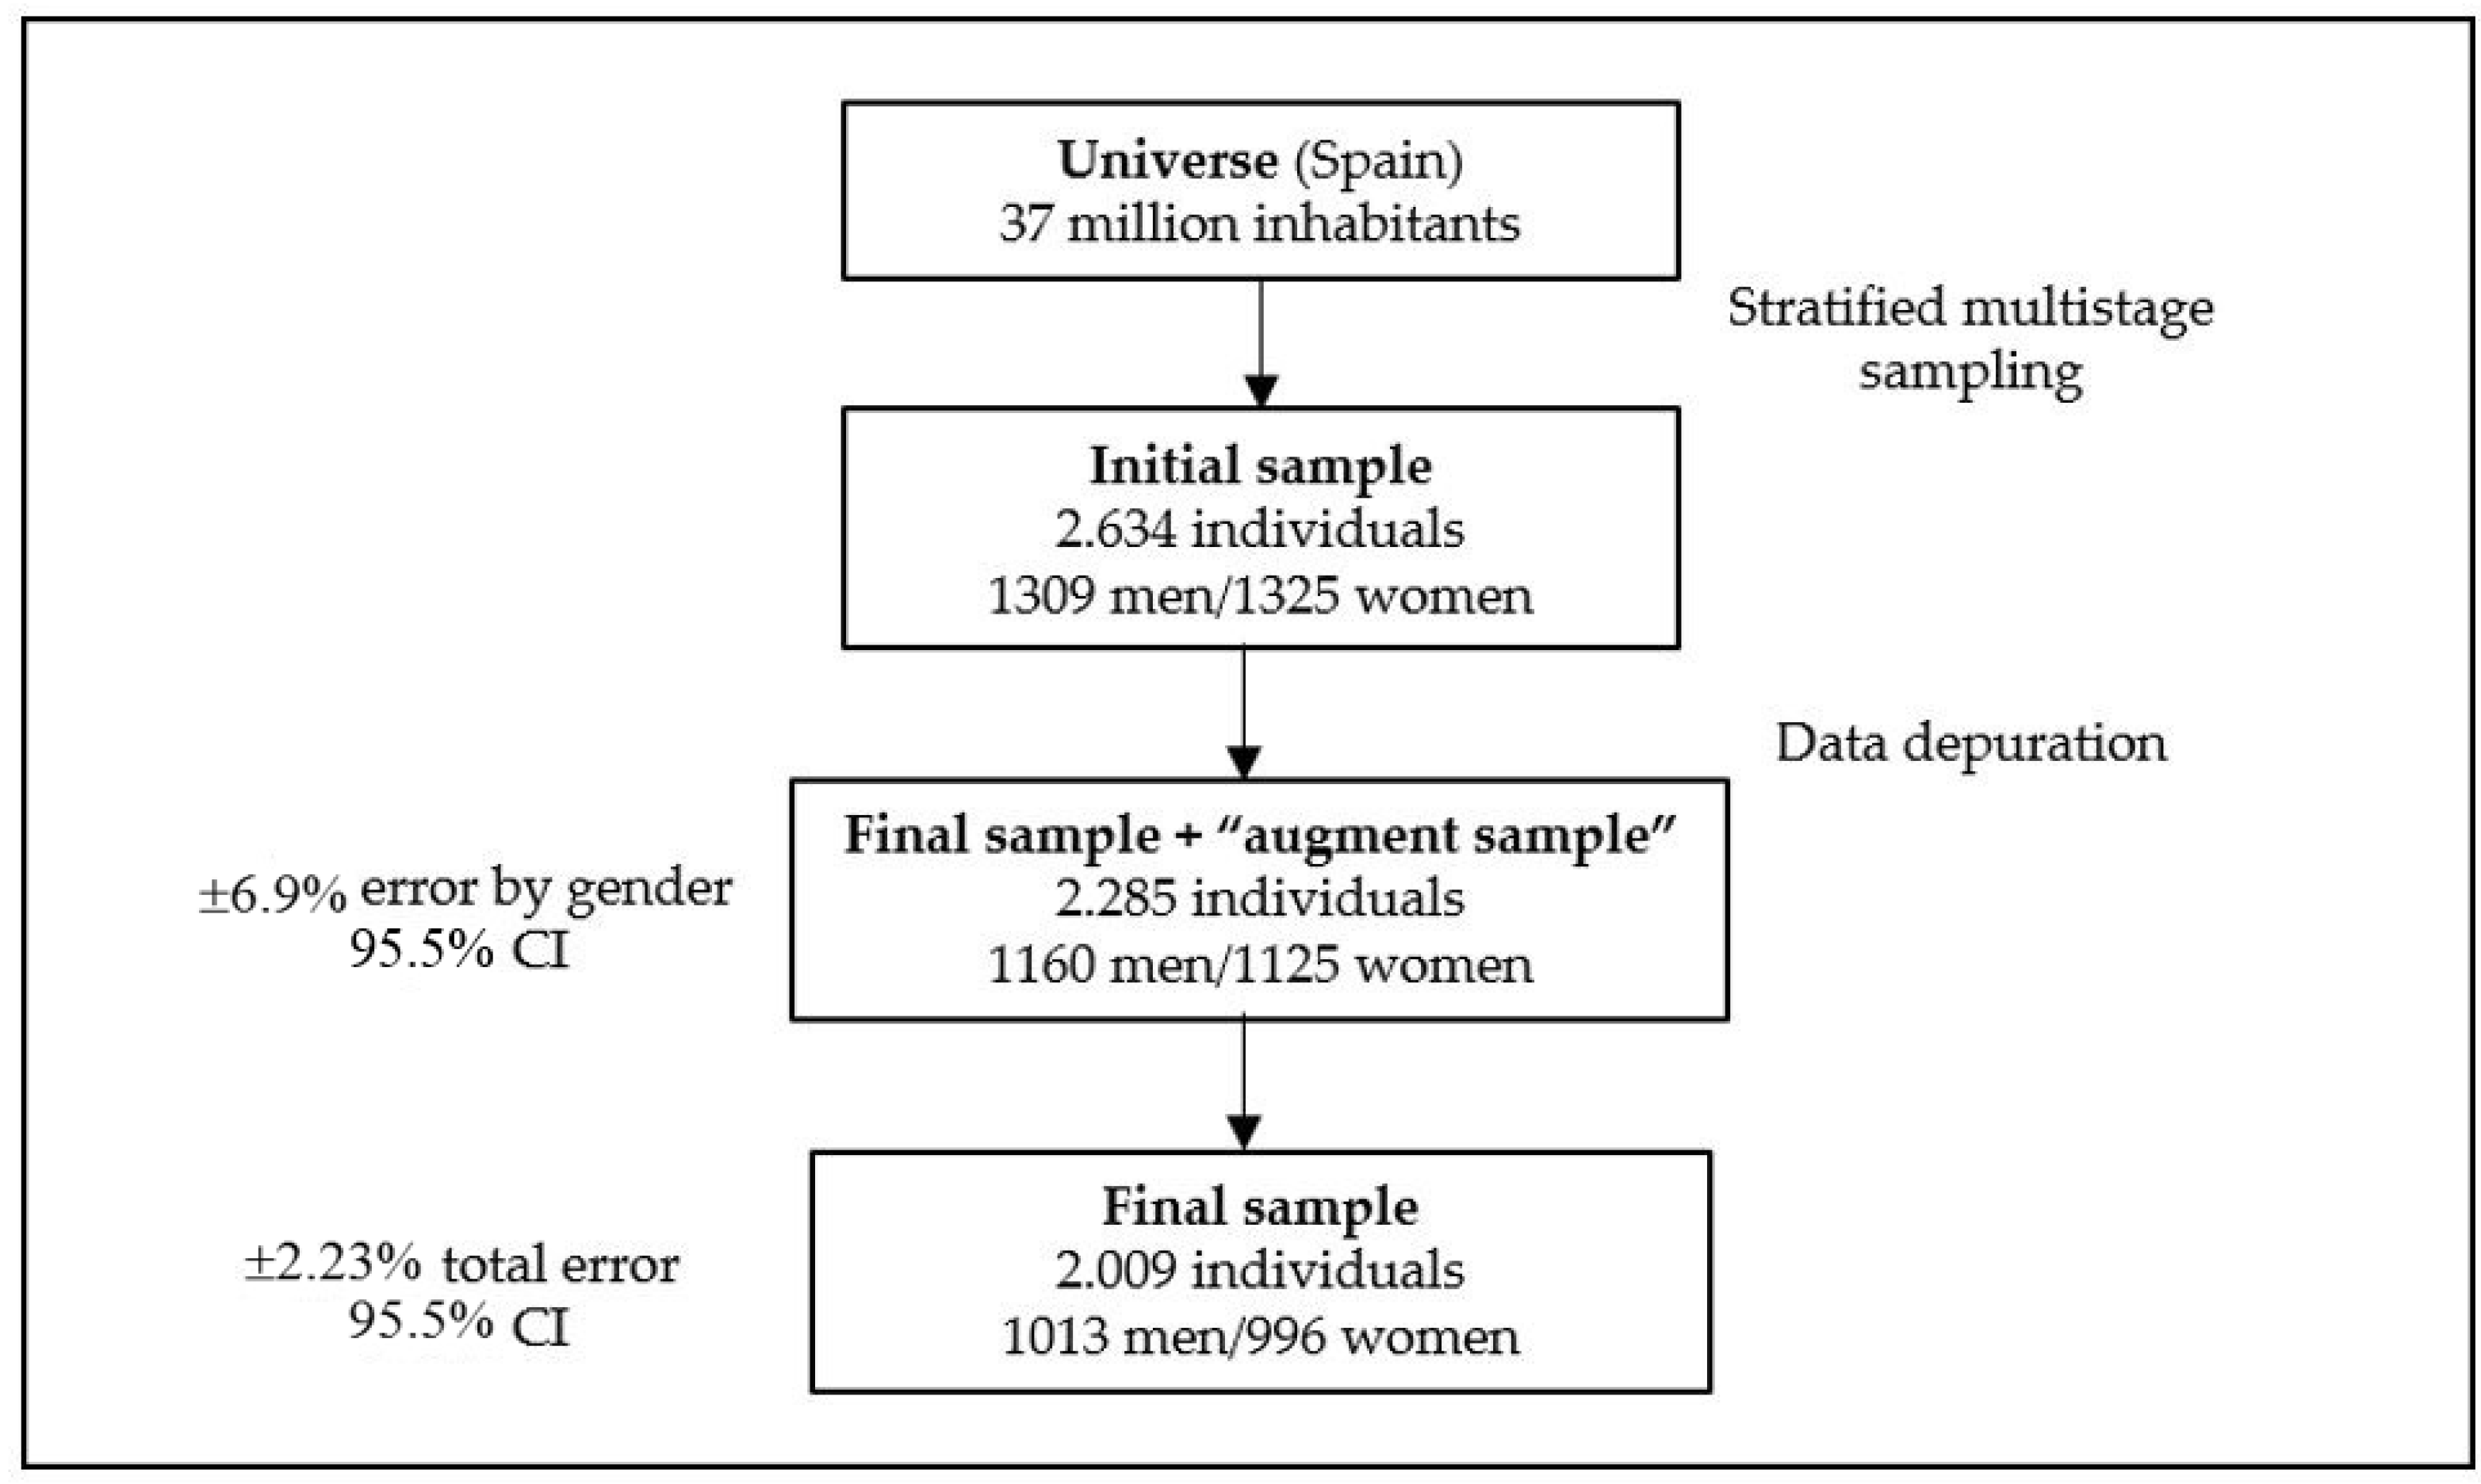
2.1. Sample
2.2. Food and Beverage Records
2.3. Evaluation of Misreporting
2.4. Statistical Analysis
3. Results
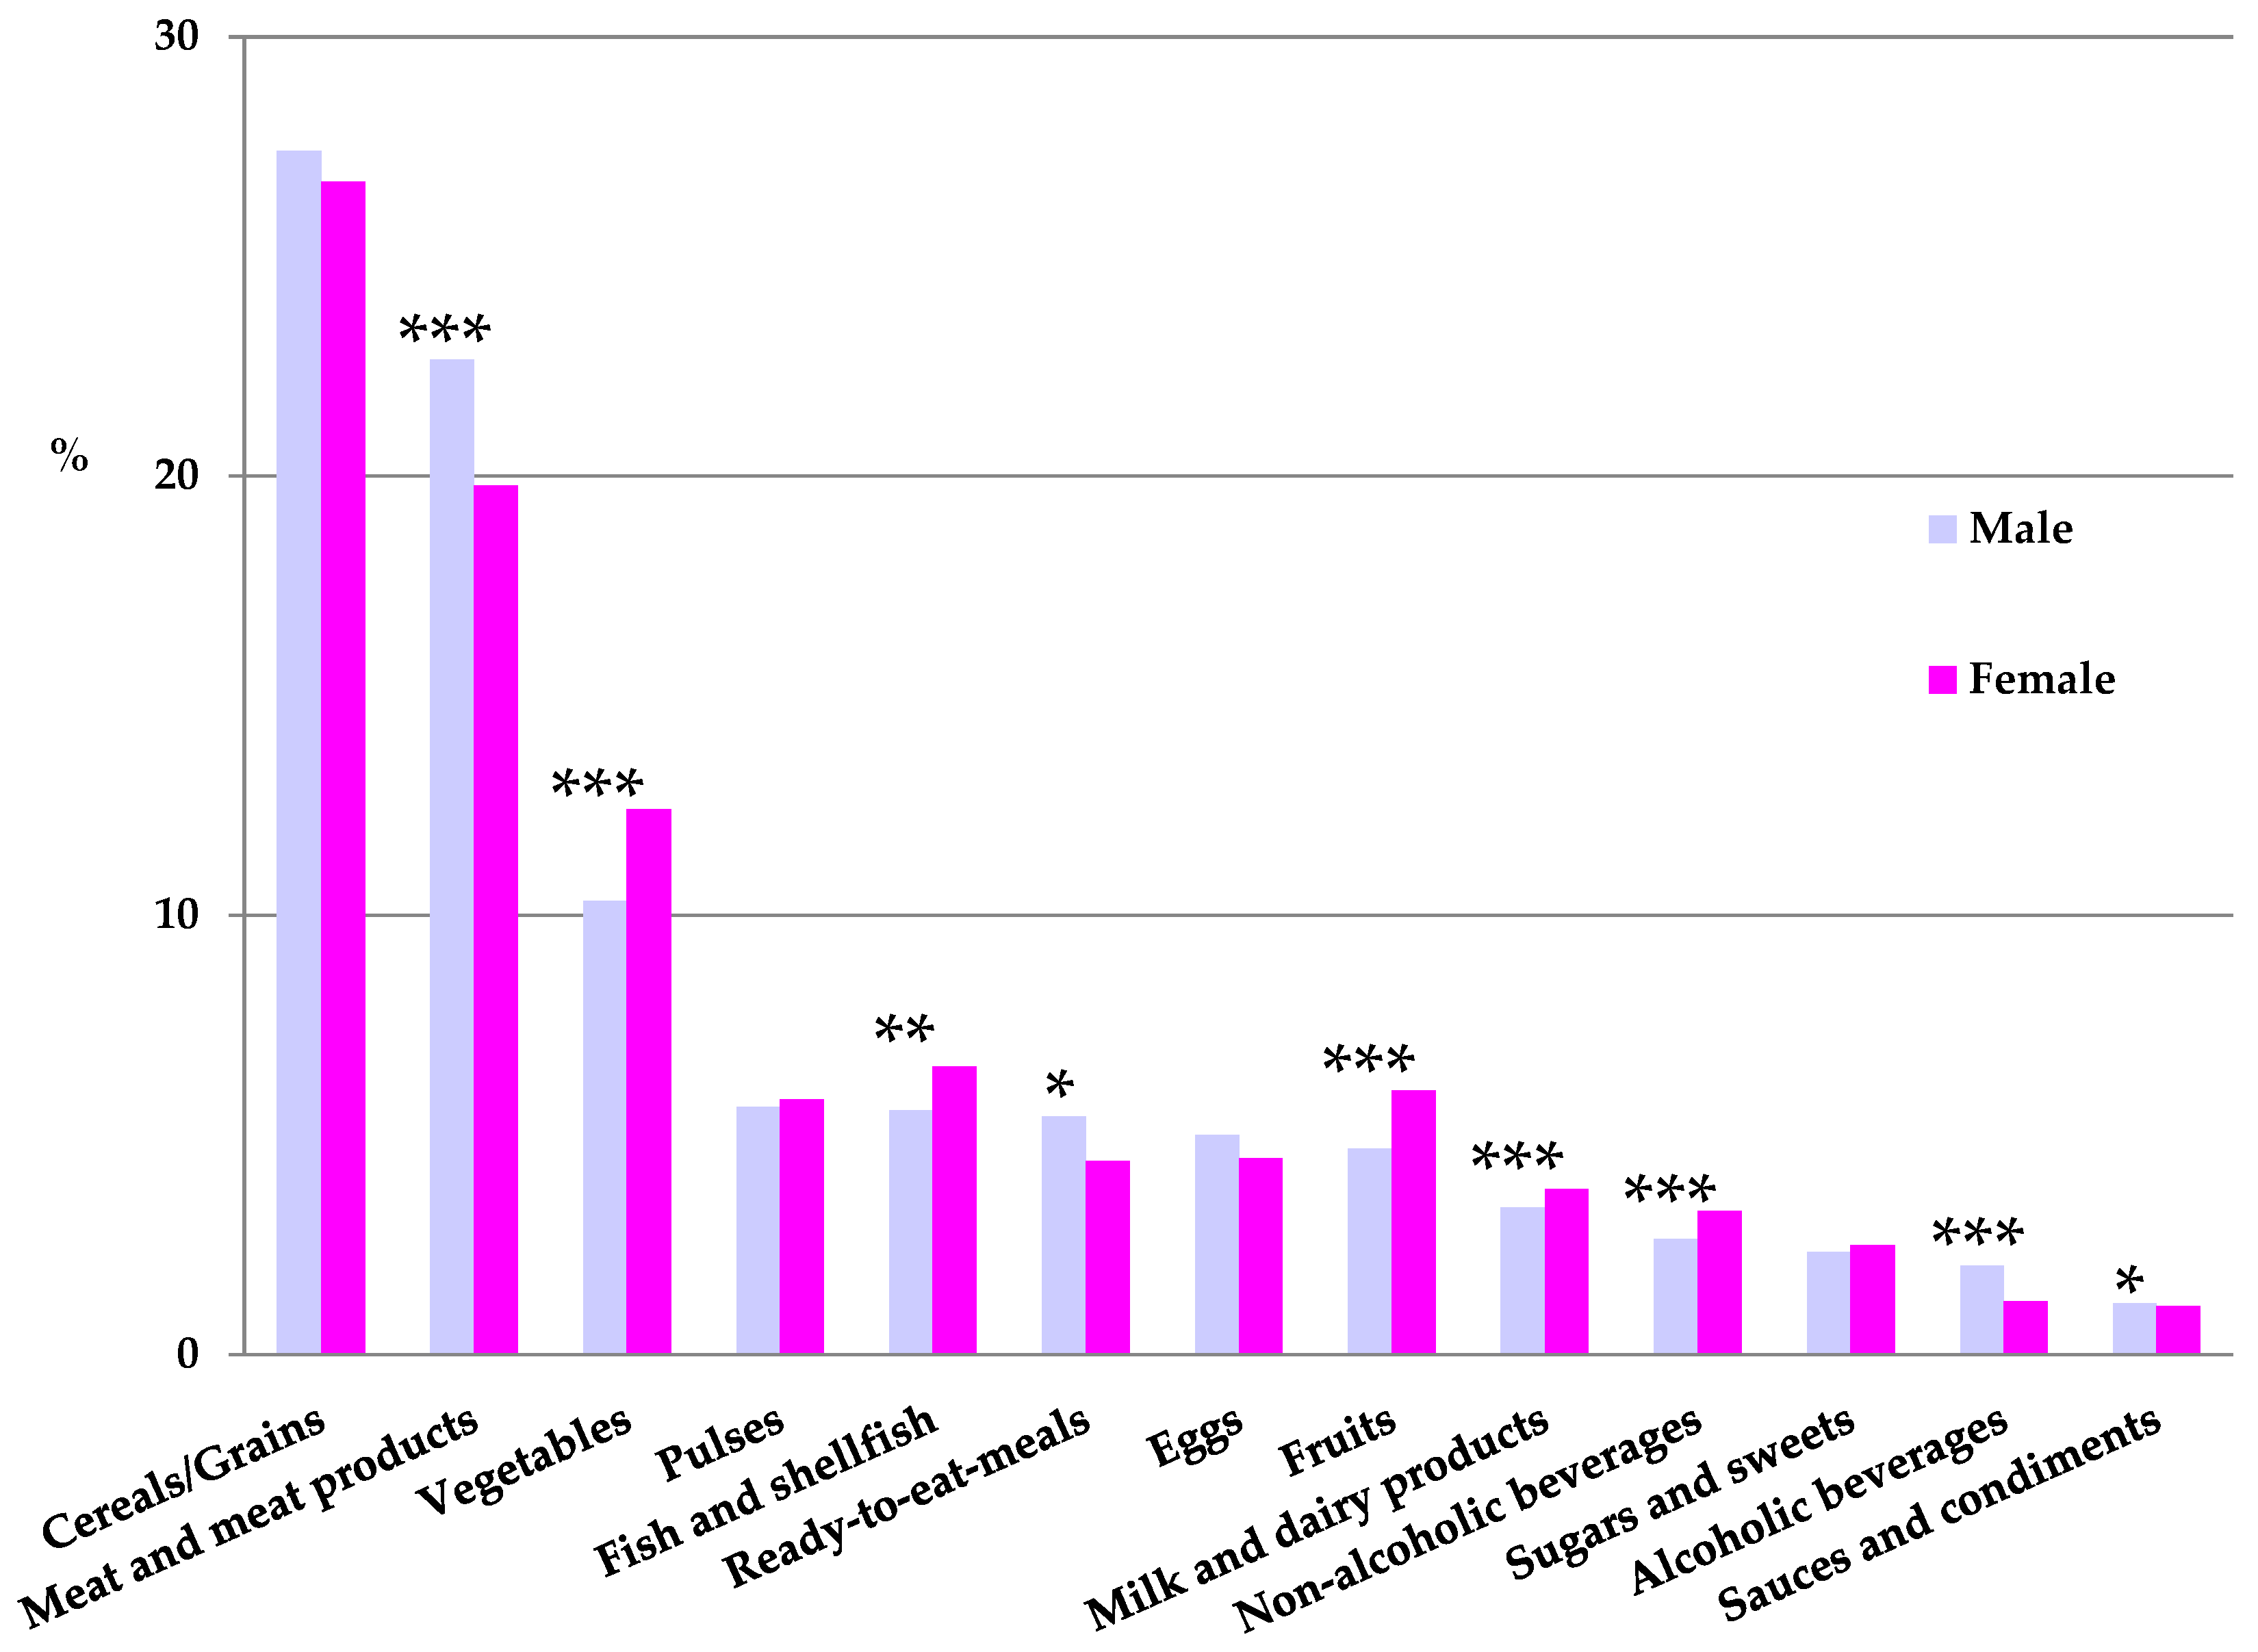
Contribution of Food and Beverage Groups to Iron Intake
4. Discussion
4.1. Iron Deficiency and Vulnerable Population Groups
4.2. Misreporting
4.3. Iron Food Sources
5. Conclusions
Acknowledgments
Author Contributions
Conflicts of Interest
References
- Hallberg, L.; Asp, N.G. Iron Nutrition in Health and Disease; John Libbey: London, UK, 1996; p. 364. [Google Scholar]
- World Health Organization. Centers for Disease Control and Prevention Atlanta; Worldwide Prevalence of Anaemia 1993–2005: WHO Global Database on Anaemia; World Health Organization: Geneva, Switzerland, 2008. [Google Scholar]
- The Scientific Advisory Committee on Nutrition. Iron and Health; TSO: London, UK, 2010. [Google Scholar]
- World Health Organization. The Global Prevalence of Anaemia in 2011; World Health Organization: Geneva, Switzerland, 2015. [Google Scholar]
- Roman Viñas, B.; Ribas Barba, L.; Ngo, J.; Gurinovic, M.; Novakovic, R.; Cavelaars, A.; de Groot, L.C.; van’t Veer, P.; Matthys, C.; Serra Majem, L. Projected prevalence of inadequate nutrient intakes in Europe. Ann. Nutr. Metab. 2011, 59, 84–95. [Google Scholar] [CrossRef] [PubMed]
- FAO/WHO. Human Vitamin and Mineral Requirements; Chapter 13: Iron; FAO/WHO: Geneva, Switzerland, 2002. [Google Scholar]
- Hurrell, R.; Egli, I. Iron bioavailability and dietary reference values. Am. J. Clin. Nutr. 2010, 91, 1461S–1467S. [Google Scholar] [CrossRef] [PubMed]
- Hurrell, R.F. Preventing iron deficiency through food fortification. Nutr. Rev. 1997, 55, 210–222. [Google Scholar] [CrossRef] [PubMed]
- FFI. Wheat Flour Fortification Status—December 2016. Map of Global Progress. Countries with Mandatory Wheat Flour Fortification Regulations. Flour Fortification Innitiative (FFI). Available online: http://www.ffinetwork.org/global_progress/index.php (accessed on 15 December 2016).
- Pasricha, S.-R.; Low, M.; Thompson, J.; Farrell, A.; De-Regil, L.-M. Iron Supplementation Benefits Physical Performance in Women of Reproductive Age: A Systematic Review and Meta-Analysis. J. Nutr. 2014, 144, 906–914. [Google Scholar] [CrossRef] [PubMed]
- Sharp, P.A. Intestinal Iron Absorption: Regulation by Dietary & Systemic Factors. Int. J. Vitam. Nutr. Res. 2010, 80, 231–242. [Google Scholar] [PubMed]
- Moreiras, O.; Carvajal, A.; Cabrera, L.; Cuadrado, C. Ingestas Recomendadas de Energía y Nutrientes Para la Población Española (Revisadas 2015). In Tablas de Composición de los Alimentos; Pirámide: Madrid, Spain, 2015; pp. 258–259. (In Spanish) [Google Scholar]
- Institute of Medicine. Food and Nutrition Board. Dietary Reference Intakes for Vitamin A, Vitamin K, Arsenic, Boron, Chromium, Copper, Iodine, Iron, Manganese, Molybdenum, Nickel, Silicon, Vanadium, and Zinc: A Report of the Panel on Micronutrients and of Interpretation and Uses of Dietary Reference Intakes, and the Standing Committee on the Scientific Evaluation of Dietary Reference Intakes; National Academy Press: Washington, DC, USA, 2001. [Google Scholar]
- Ngo, J.; Engelen, A.; Molag, M.; Roesle, J.; García-Segovia, P.; Serra-Majem, L. A review of the use of information and communication technologies for dietary assessment. Br. J. Nutr. 2009, 101, S102–S112. [Google Scholar] [CrossRef] [PubMed]
- Ruiz, E.; Ávila, J.M.; Castillo, A.; Valero, T.; del Pozo, S.; Rodriguez, P.; Bartrina, J.A.; Gil, Á.; González-Gross, M.; Ortega, R.M.; et al. The ANIBES Study on Energy Balance in Spain: Design, Protocol and Methodology. Nutrients 2015, 7, 970–998. [Google Scholar] [CrossRef] [PubMed]
- Ruiz, E.; Ávila, J.M.; Valero, T.; del Pozo, S.; Rodriguez, P.; Aranceta-Bartrina, J.; Gil, Á.; González-Gross, M.; Ortega, R.M.; Serra-Majem, L.; et al. Energy Intake, Profile, and Dietary Sources in the Spanish Population: Findings of the ANIBES Study. Nutrients 2015, 7, 4739–4762. [Google Scholar] [CrossRef] [PubMed]
- Varela Moreiras, G.; Ávila, J.M.; Ruiz, E. Energy Balance, a new paradigm and methodological issues: The ANIBES study in Spain. Nutr. Hosp. 2015, 31, 101–112. [Google Scholar] [PubMed]
- Roman-Viñas, B.; Serra-Majem, L.; Hagstromer, M.; Ribas-Barba, L.; Sjostrom, M.; Segura, R. International physical activity questionnaire: Reliability and validity in a Spanish population. Eur. J. Sport Sci. 2010, 10, 297–304. [Google Scholar] [CrossRef]
- Moreiras, O.; Carvajal, A.; Cabrera, L.; Cuadrado, C. Tablas de Composición de Alimentos, 15th ed.; Pirámide: Madrid, Spain, 2011. (In Spanish) [Google Scholar]
- Aranceta Bartrina, J.; Majem, L.S. Objetivos nutricionales para la población española. Consenso de la Sociedad Española de Nutrición Comunitaria 2011. Rev. Esp. Nutr. Comunitaria 2011, 17, 178–199. [Google Scholar]
- Archer, E.; Hand, G.A.; Blair, S.N. Validity of US nutritional surveillance: National Health and Nutrition Examination Survey caloric energy intake data, 1971–2010. PLoS ONE 2013, 8, e76632. [Google Scholar] [CrossRef]
- Ambrus, Á.; Horváth, Z.; Farkas, Z.; Dorogházi, E.; Cseh, J.; Petrova, S.; Dimitrov, P.; Duleva, V.; Rangelova, L.; Chikova-Iscener, E.; et al. Pilot study in the view of a Pan-European dietary survey—Adolescents, adults and elderly. EFSA Support. Publ. 2013, 10. [Google Scholar] [CrossRef]
- Goldberg, G.; Black, A.E.; Jebb, S.A.; Cole, T.J.; Murgatroyd, P.R.; Coward, W.A.; Prentice, A.M. Critical evaluation of energy intake data using fundamental principles of energy physiology: 1. Derivation of cut-off limits to identify under-recording. Eur. J. Clin. Nutr. 1991, 45, 569–581. [Google Scholar] [PubMed]
- Black, A. The sensitivity and specificity of the Goldberg cut-off for EI: BMR for identifying diet reports of poor validity. Eur. J. Clin. Nutr. 2000, 54, 395–404. [Google Scholar] [CrossRef] [PubMed]
- EFSA Panel on Dietetic Products, Nutrition and Allergies. Scientific Opinion on Dietary Reference Values for iron. EFSA J. 2015, 13, 4254. [Google Scholar]
- Hercberg, S.; Preziosi, P.; Galan, P. Iron deficiency in Europe. Public Health Nutr. 2001, 4, 537–545. [Google Scholar] [CrossRef] [PubMed]
- Serra-Majem, L.; Ribas, L.; Pérez-Rodrigo, C.; García-Closas, R.; Peña-Quintana, L.; Aranceta, J. Determinants of Nutrient Intake among Children and Adolescents: Results from the enKid Study. Ann. Nutr. Metab. 2002, 46, 31–38. [Google Scholar] [CrossRef] [PubMed]
- Aranceta Bartrina, J.; Serra-Majem, L. Hábitos Alimentarios y Consumo de Alimentos en la Población Infantil y Juvenil Española (1998–2000). In Estudio Enkid; Masson: Barcelona, Spain, 2000. [Google Scholar]
- Serra-Majem, L.; García-Closas, R.; Ribas, L.; Pérez-Rodrigo, C.; Aranceta, J. Food patterns of Spanish schoolchildren and adolescents: The enKid Study. Public Health Nutr. 2001, 4, 1433–1438. [Google Scholar] [CrossRef] [PubMed]
- Quintas, M.E.; Requejo, A.M.; Ortega, R.M.; Redondo, M.R.; López-Sobaler, A.M.; Gaspar, M.J. The female Spanish population: A group at risk of nutritional iron deficiency. Int. J. Food Sci. Nutr. 1997, 48, 271–279. [Google Scholar] [CrossRef] [PubMed]
- Beaton, G.H. Approaches to analysis of dietary data: Relationship between planned analyses and choice of methodology. Am. J. Clin. Nutr. 1994, 59, 253S–261S. [Google Scholar] [PubMed]
- Livingstone, M.B.E.; Black, A.E. Markers of the validity of reported energy intake. J. Nutr. 2003, 133, 895S–920S. [Google Scholar] [PubMed]
- Macdiarmid, J.; Blundell, J. Assessing dietary intake: Who, what and why of under-reporting. Nutr. Res. Rev. 1998, 11, 231–253. [Google Scholar] [CrossRef] [PubMed]
- Lioret, S.; Touvier, M.; Balin, M.; Huybrechts, I.; Dubuisson, C.; Dufour, A.; Bertin, M.; Maire, B.; Lafay, L. Characteristics of energy under-reporting in children and adolescents. Br. J. Nutr. 2011, 105, 1671–1680. [Google Scholar] [CrossRef] [PubMed]
- McAfee, A.J.; McSorley, E.M.; Cuskelly, G.J.; Moss, B.W.; Wallace, J.M.; Bonham, M.P.; Fearon, A.M. Red meat consumption: An overview of the risks and benefits. Meat Sci. 2010, 84, 1–13. [Google Scholar] [CrossRef] [PubMed]
- Agencia Española de Seguridad Alimentaria y Nutrición (AESAN). Encuesta Nacional de Ingesta Dietética Española (ENIDE), 2011. Ministerio de Sanidad, Política Social e Igualdad. Available online: http://www.msps.es/novedades/docs/PresentacionENIDE010311.pdf (accessed on 10 April 2015).

| Age Group (Years) | Moreiras et al. [12] | EFSA [25] |
|---|---|---|
| Fe (mg/Day) | Fe (mg/Day) | |
| Men | ||
| 9 | 9 | 11 |
| 10 | 12 | 11 |
| 11 | 12 | 11 |
| 12 | 12 | 11 |
| 13–17 | 15 | 11 |
| 18–19 | 15 | 11 |
| 20–49 | 10 | 11 |
| 50–59 | 10 | 11 |
| ≥60 | 10 | 11 |
| Women | ||
| 9 | 9 | 11 |
| 10 | 18 | 11 |
| 11 | 18 | 11 |
| 12 | 18 | 13 |
| 13–17 | 18 | 13 |
| 18–19 | 18 | 16 |
| 20–49 | 18 | 16 a |
| 50–59 | 10 | 16 a |
| ≥60 | 10 | 11 |
| Gender | Reporting | |
|---|---|---|
| Plausible Reporters | Non-Plausible Reporters | |
| Female | 57.3% (n = 311) | 46.7% (n = 685) |
| Male | 42.7% (n = 232) | 53.3% (n = 781) |
| Children | Adolescents | Adults | Elderly | ||
|---|---|---|---|---|---|
| Gender | Female | 7.7% | 6.6% | 76.2% | 9.5% |
| (n = 87) | (n = 74) | (n = 857) | (n = 107) | ||
| Male | 10.9% | 11.8% | 68.8% | 8.5% | |
| (n = 126) | (n = 137) | (n = 137) | (n = 137) | ||
| Reporting | Plausible reporters | 17.8% | 11.3% | 64.2% | 6.7% |
| (n = 120) | (n = 76) | (n = 433) | (n = 45) | ||
| Non-plausible reporters | 5.8% | 8.4% | 75.9% | 10.0% | |
| (n = 93) | (n = 135) | (n = 1222) | (n = 161) |
| Gender | Iron (mg/Day) | % Above 80% RDI Moreiras (Spain) | % Above 80% RDI EFSA | RDI Agreement (Kappa) Moreiras vs. EFSA |
|---|---|---|---|---|
| Women | ||||
| Total n = 996 | 9.8 (7.9–11.9) | 17.0 | 27.3 ## | 0.526 |
| Plausible n = 331 | 12.0 *** (10.3–13.8) | 24.8 | 50.5 ### | 0.570 |
| Non-plausible n = 685 | 8.8 (7.3–10.6) | 13.4 | 19.8 ### | 0.462 |
| Men | ||||
| Total n = 1013 | 11.3 (9.0–14.0) | 57.3 | 77.2 | 0.697 |
| Plausible n = 232 | 14.7 *** (12.4–17.1) | 84.0 | 100.0 ## | - |
| Non-plausible n = 781 | 10.3 (8.4–12.7) | 49.3 | 70.4 ## | 0.694 |
| Age Group | Iron (mg/Day) | % Above 80% RDI Moreiras (Spain) | % Above 80% RDI EFSA | RDI Agreement (Kappa) Moreiras vs. EFSA |
|---|---|---|---|---|
| Children | ||||
| Total n = 213 | 11.0 (9.2–12.8) | 40.9 | 77.9 ### | 0.345 |
| Plausible n = 120 | 12.2 *** (10.4–14.0) | 54.2 | 94.2 ### | 0.255 |
| Non-plausible n = 93 | 9.2 (8.0–11.1) | 23.7 | 57.0 ## | 0.540 |
| Adolescents | ||||
| Total n = 211 | 11.4 (9.1–13.4) | 15.2 | 73.0 ### | 0.243 |
| Plausible n = 76 | 13.3 *** (11.6–15.4) | 27.6 | 90.8 ### | 0.212 |
| Non-plausible n = 135 | 10.0 (8.1–11.8) | 8.2 | 63.0 ### | 0.277 |
| Adults | ||||
| Total n = 1655 | 10.4 (8.4–12.9) | 36.9 | 47.9 ### | 0.233 |
| Plausible n = 433 | 13.0 *** (11.0–15.6) | 47.8 | 63.3 ## | 0.730 |
| Non-plausible n = 1222 | 9.6 (7.8–11.8) | 33.0 | 42.5 ### | 0.709 |
| Elderly | ||||
| Total n = 206 | 10.2 (7.9–12.6) | 52.9 | 68.0 ### | 0.170 |
| Plausible n = 45 | 12.7 *** (10.9–17.2) | 88.9 | 100.0 ### | - |
| Non-plausible n = 161 | 9.5 (7.5–11.5) | 42.9 | 59.0 ### | 0.842 |
| Geographical Distribution (Nielsen Areas) | Iron (mg/Day) |
|---|---|
| Barcelona (Metropolitan Area) | 10.8 (8.8–13.1) |
| Canary Islands | 10.1 (7.8–13.3) |
| Center | 9.9 (8.2–13.2) |
| East | 10.6 (8.3–13.2) |
| Madrid (Metropolitan Area) | 10.2 * (8.1–12.7) |
| Northeast | 10.9 (8.7–13.4) |
| Northwest | 10.6 (8.6–12.7) |
| North Central | 11.4 (9.6–14.0) |
| South | 10.1 ** (8.2–12.4) |
| Children | Adolescents | Adults | Elderly | |||||
|---|---|---|---|---|---|---|---|---|
| Male | Female | Male | Female | Male | Female | Male | Female | |
| Cereals/Grains (%) | 30.7 a | 31.8 a | 33.1 a | 31.3 a | 26.9 b | 26.9 b | 24.0 c | 24.6 b,c |
| Meat and meat products (%) | 23.1 d | 20.1 d,e | 23.5 d | 20.3 d,e | 22.9 d | 20.1 e | 18.0 e | 17.0 e |
| Vegetables (%) | 7.1 f | 7.9 f | 6.7 f | 7.7 f | 10.8 g | 12.4 h | 13.0 h,i | 14.7 i |
| Pulses (%) | 4.5 | 6.4 | 4.9 | 5.7 | 5.6 | 5.8 | 7.6 | 6.0 |
| Fish and shellfish (%) | 3.8 j | 4.0 j | 3.7 j | 4.3 j | 5.7 k | 6.5 l | 6.9 l,m | 7.9 m |
| Ready-to-eat-meals (%) | 6.6 n | 5.7 n,o,p | 7.6 n,o | 6.2 n | 5.3 o,p | 4.6 p | 2.9 p | 2.1 q |
| Eggs (%) | 4.6 | 4.3 | 5.0 | 4.7 | 5.0 | 4.4 | 5.5 | 5.3 |
| Fruits (%) | 3.3 r | 3.8 r | 2.4 s | 3.8 r | 4.6 r | 5.7 t | 8.4 u | 10.2 w |
| Milk and dairy products (%) | 4.7 x | 4.3 y | 3.8 y | 4.0 | 3.3 y | 3.7 z | 2.8 z | 3.9 y |
| Non-alcoholic beverages (%) | 2.5 α | 2.6 α,β | 2.0 α | 2.6 α | 2.8 β | 3.2 γ | 2.9 β,γ | 3.4 δ |
| Sugars and sweets (%) | 6.1 ε | 5.8 ε,ζ | 4.7 ζ | 6.5 ε,ζ | 2.0 η | 2.4 θ | 1.2 ι | 0.7 ι |
| Alcoholic beverages (%) | - | - | - | - | 2.1 κ | 1.3 λ | 4.8 μ | 2.0 λ |
| Sauces and condiments (%) | 1.0 ν | 1.6 ν | 1.1 ν | 1.3 ν | 1.2 ν | 1.1 ν | 0.7 ξ | 0.8 π |
| Children | Adolescents | Adults | Elderly | |||||
|---|---|---|---|---|---|---|---|---|
| Male | Female | Male | Female | Male | Female | Male | Female | |
| Meat (total) (%) | 12.9 a,b | 9.8 a | 13.5 b | 10.7 a | 13.3 b | 12.1 a | 10.6 a | 10.9 a |
| Red meat (%) | 5.3 | 5.1 | 5.4 | 2.8 | 5.5 | 4.8 | 5.1 | 4.8 |
| White meat (%) | 2.9 c,d | 1.7 e | 3.3 c,d | 3.1 c,d | 3.3 d | 3.0 c,d | 2.4 c,d,e | 2.1 c,e |
| Poultry (%) | 4.7 f | 3.0 g | 4.8 f | 4.9 f,g | 4.5 f | 4.3 f,g | 3.1 f,g | 4.0 f,g |
| Viscera and offal (%) | 0.0 h,i | 0.3 h,i | 0.0 h | 0.1 h,i | 0.6 i | 0.4 h,i | 1.0 j | 0.6 h,i |
| Sausages and other meat products (%) | 10.2 k | 10.0 k | 10.0 k | 9.5 k | 9.0 k | 7.5 l | 6.4 l,m | 5.5 m |
| Fish and shellfish (total) (%) | 3.8 n | 4.0 n | 3.7 n | 4.3 n | 5.7 o | 6.5 p | 6.9 p,q | 7.9 q |
| White fish (%) | 1.1 r,s,t | 1.6 s,t,u | 0.7 r | 0.8 r | 1.1 r | 1.2 r,s | 2.0 t,u | 2.5 u |
| Blue Fish (%) | 0.5 v,w | 0.7 v,w | 0.3 v | 1.0 v,w | 0.8 w | 1.0 w | 1.6 y | 0.9 w |
| Shellfish (%) | 1.6 z,α | 1.1 z | 1.7 z | 1.5 z | 2.2 α | 2.6 α | 2.2 α | 2.7 z,α |
| Canned Fish (%) | 0.6 β | 0.6 β | 1.0 β | 0.9 β | 1.7 γ | 1.7 γ | 1.0 β,γ | 1.8 γ |
© 2017 by the authors. Licensee MDPI, Basel, Switzerland. This article is an open access article distributed under the terms and conditions of the Creative Commons Attribution (CC BY) license ( http://creativecommons.org/licenses/by/4.0/).
Share and Cite
Samaniego-Vaesken, M.D.L.; Partearroyo, T.; Olza, J.; Aranceta-Bartrina, J.; Gil, Á.; González-Gross, M.; Ortega, R.M.; Serra-Majem, L.; Varela-Moreiras, G. Iron Intake and Dietary Sources in the Spanish Population: Findings from the ANIBES Study. Nutrients 2017, 9, 203. https://doi.org/10.3390/nu9030203
Samaniego-Vaesken MDL, Partearroyo T, Olza J, Aranceta-Bartrina J, Gil Á, González-Gross M, Ortega RM, Serra-Majem L, Varela-Moreiras G. Iron Intake and Dietary Sources in the Spanish Population: Findings from the ANIBES Study. Nutrients. 2017; 9(3):203. https://doi.org/10.3390/nu9030203
Chicago/Turabian StyleSamaniego-Vaesken, Mᵃ De Lourdes, Teresa Partearroyo, Josune Olza, Javier Aranceta-Bartrina, Ángel Gil, Marcela González-Gross, Rosa M. Ortega, Lluis Serra-Majem, and Gregorio Varela-Moreiras. 2017. "Iron Intake and Dietary Sources in the Spanish Population: Findings from the ANIBES Study" Nutrients 9, no. 3: 203. https://doi.org/10.3390/nu9030203
APA StyleSamaniego-Vaesken, M. D. L., Partearroyo, T., Olza, J., Aranceta-Bartrina, J., Gil, Á., González-Gross, M., Ortega, R. M., Serra-Majem, L., & Varela-Moreiras, G. (2017). Iron Intake and Dietary Sources in the Spanish Population: Findings from the ANIBES Study. Nutrients, 9(3), 203. https://doi.org/10.3390/nu9030203