Assessing the Validity and Reproducibility of an Iron Dietary Intake Questionnaire Conducted in a Group of Young Polish Women


Abstract
:1. Introduction
2. Materials and Methods
2.1. Designing an Iron Dietary Intake Questionnaire (IRONIC-FFQ—IRON Intake Calculation-Food Frequency Questionnaire)
2.2. Validation of the IRONIC-FFQ
2.3. Statistical Analysis
- (1)
- Calculation of root mean square errors of prediction (RMSEP) and the median absolute percentage errors (MdAPE) of iron intake in the assessment of validity (FFQ1 vs. 3-day record) and of reproducibility (FFQ1 vs. FFQ2).
- (2)
- Assessment of the share of individuals classified into the same tertile and misclassified (classified into opposite tertiles) in the assessment of validity (FFQ1 vs. 3-day record) and of reproducibility (FFQ1 vs. FFQ2).
- (3)
- Calculation of the weighted κ statistic with linear weighting to indicate the level of agreement between the classifications into tertiles in the assessment of validity (FFQ1 vs. 3-day record) and of reproducibility (FFQ1 vs. FFQ2)—according to the criteria of Landis and Koch [28], values <0.20 were treated as slight agreement, 0.21–0.40—as fair, 0.41–0.60—as moderate, 0.61–0.80—as substantial, and 0.81–1.0—as almost perfect agreement.
- (4)
- Analysis of the correlations between results obtained in the assessment of validity (FFQ1 vs. 3-day record) and of reproducibility (FFQ1 vs. FFQ2)—the normality of distribution of the results was analysed using the Shapiro–Wilk test and then Spearman’s rank correlation was applied for nonparametric distribution.
- (5)
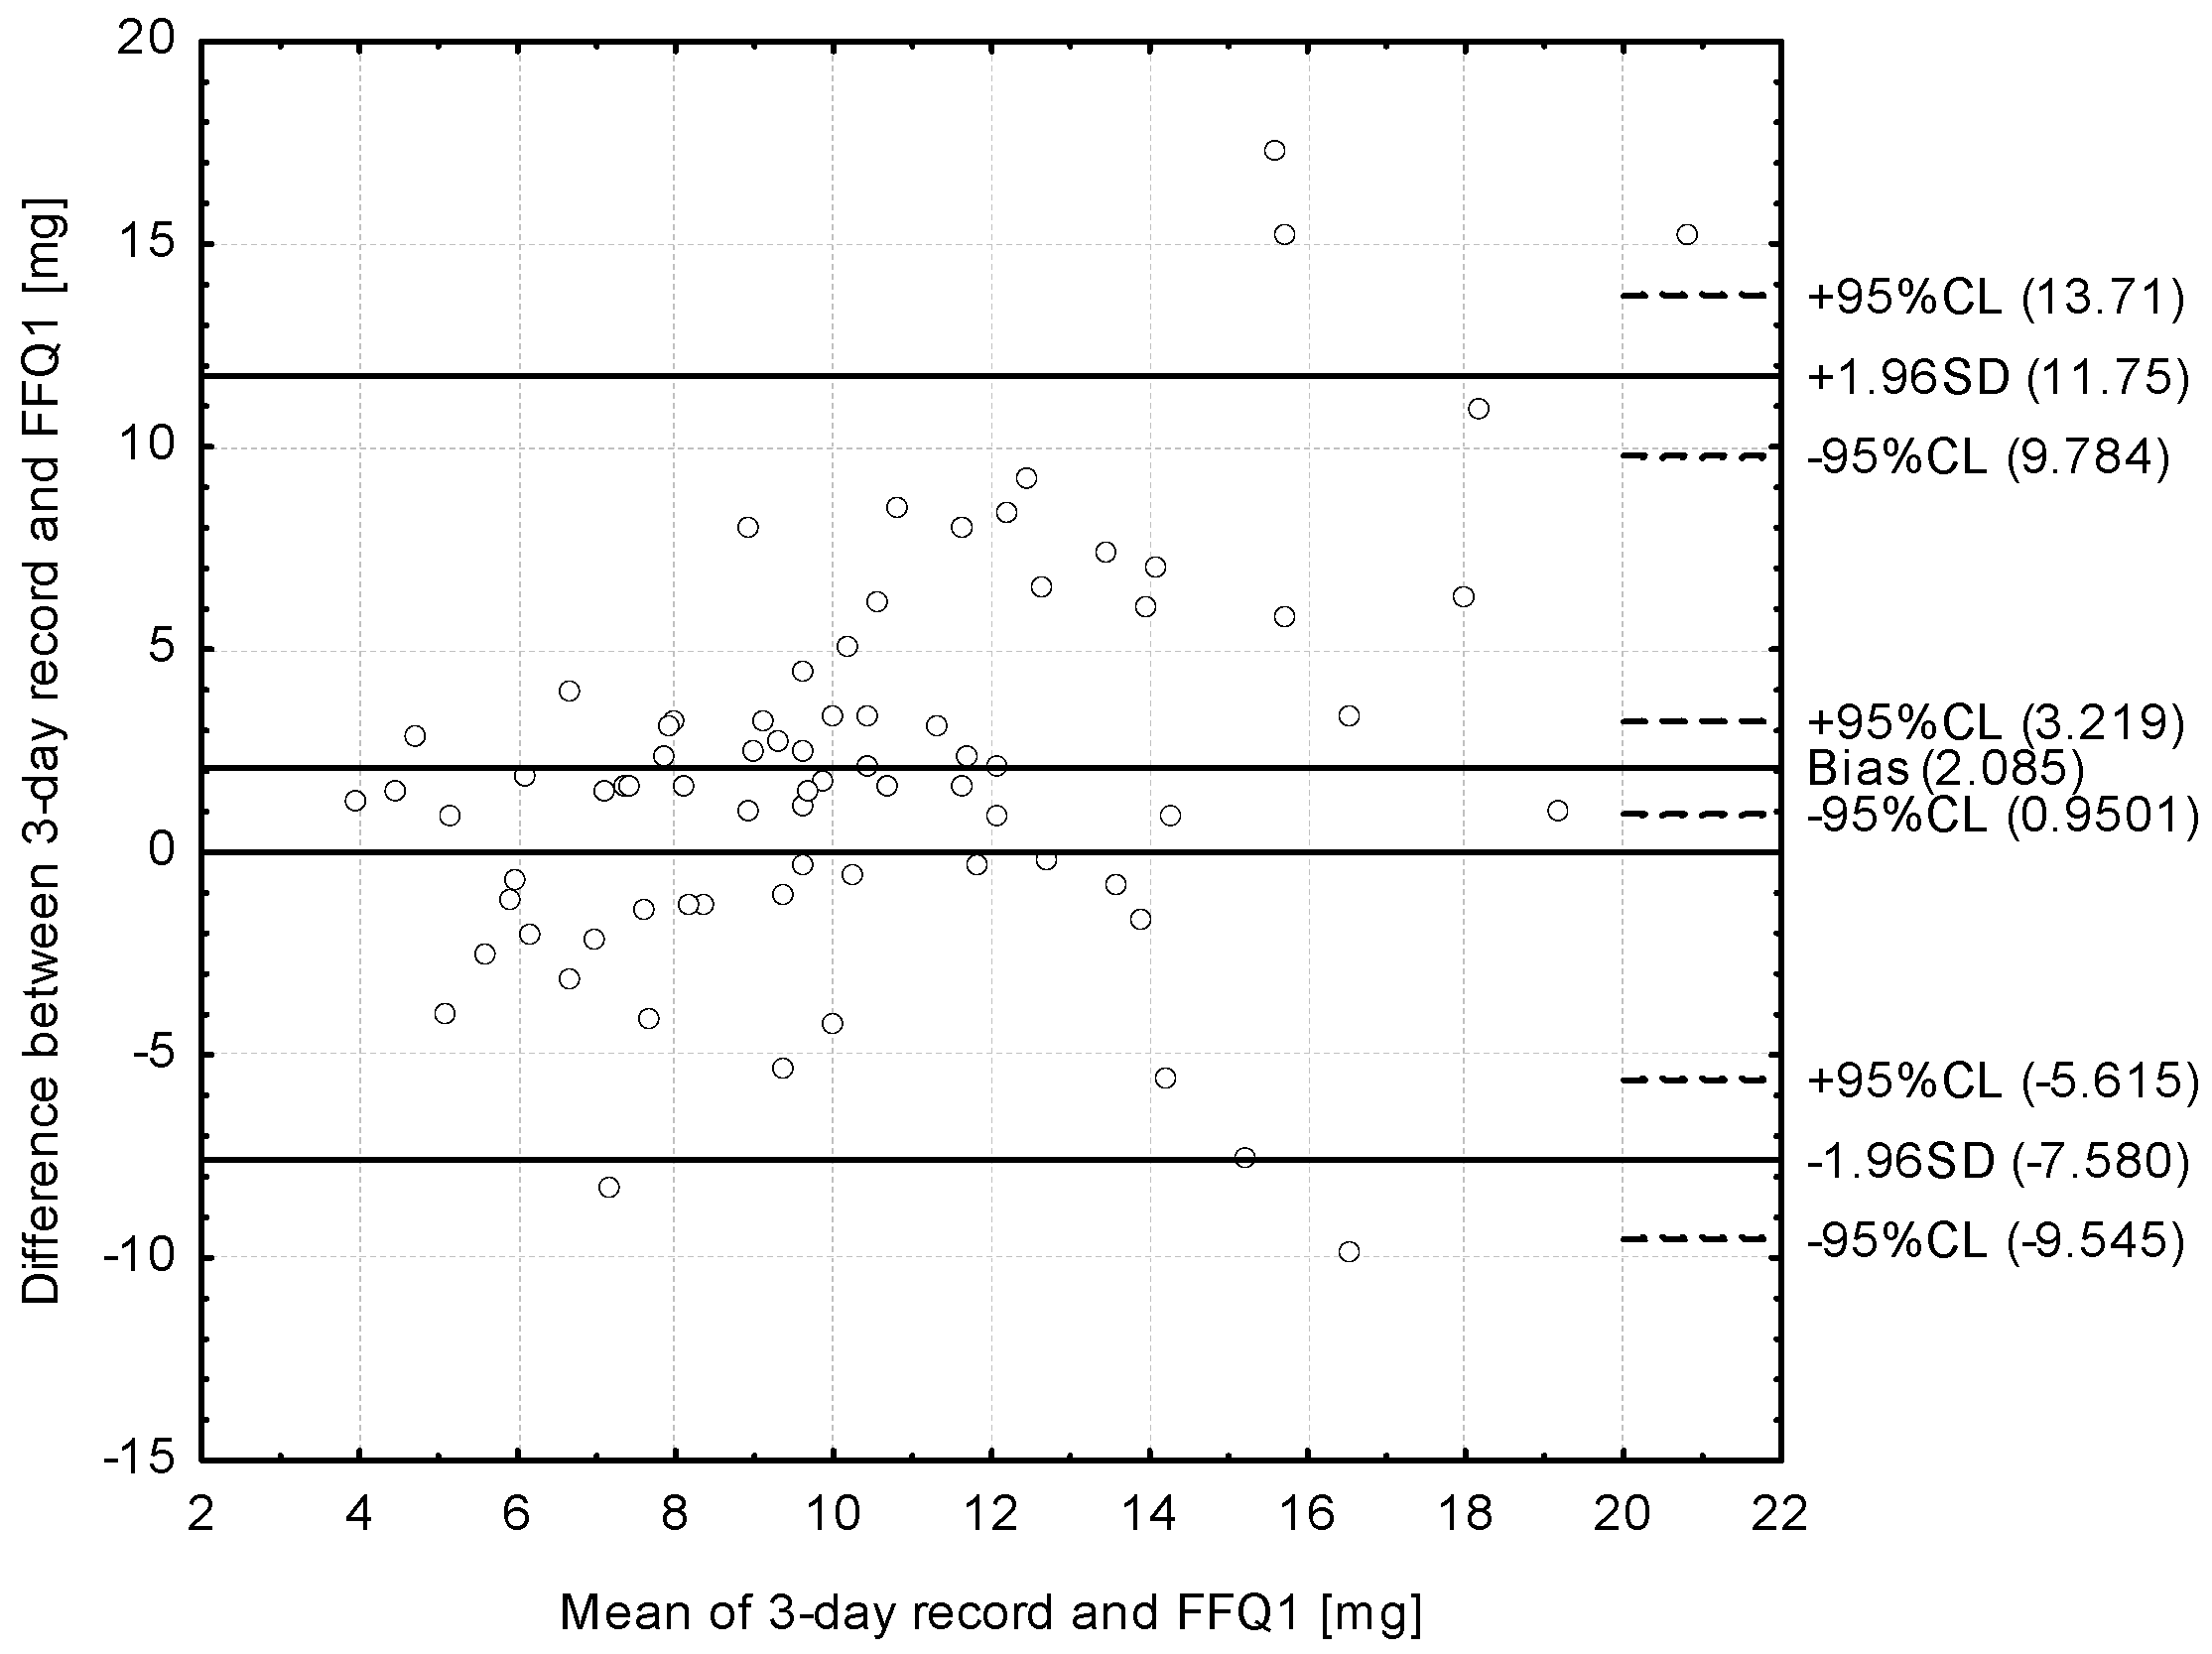
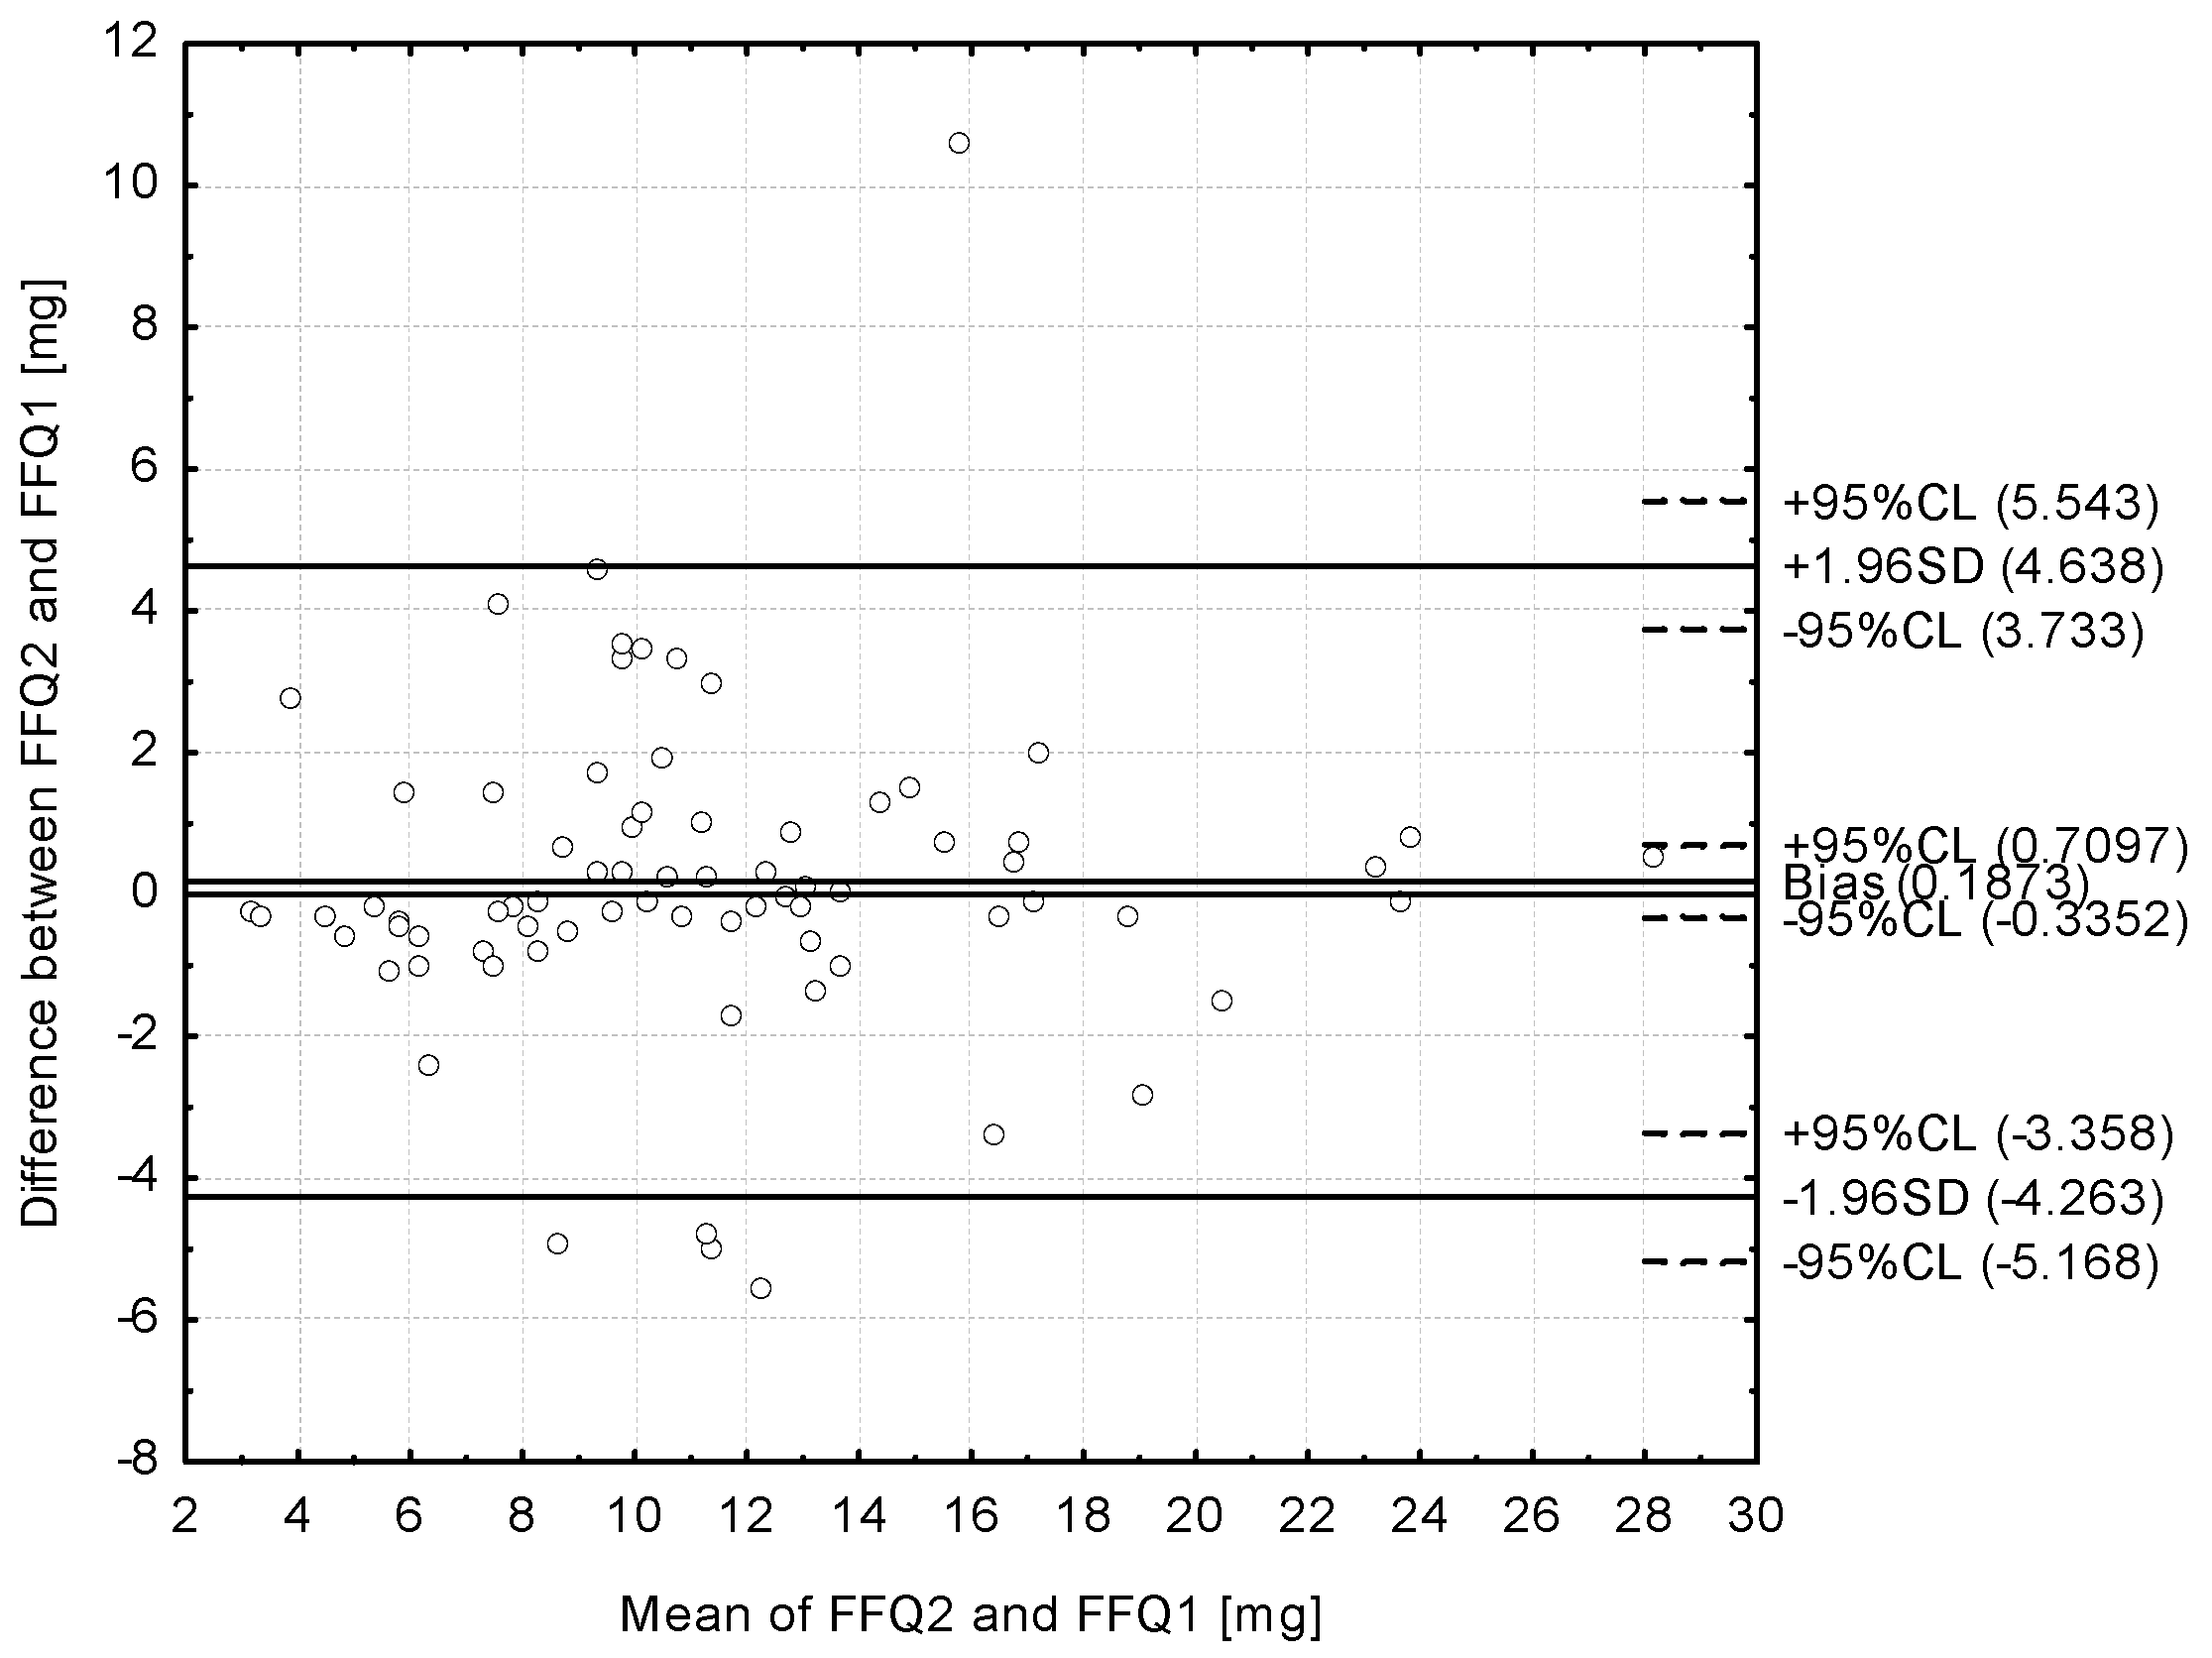
- Analysis of the Bland–Altman plots in the assessment of validity (FFQ1 vs. 3-day record) and of reproducibility (FFQ1 vs. FFQ2)—the results were interpreted using the Bland–Altman index, whereas the limits of agreement value (LOA) was calculated as the sum of the mean absolute differences of iron intake measured by the two methods, and the ± standard deviation of the absolute difference of iron intake recorded for the two methods magnified by 1.96. In the analysis conducted with the Bland–Altman method to assess agreement between the measurements, a Bland–Altman index of a maximum of 5% (95% of individuals observed to be beyond the LOA) was interpreted, as commonly assumed [29], as positive validation of the method of measurement.
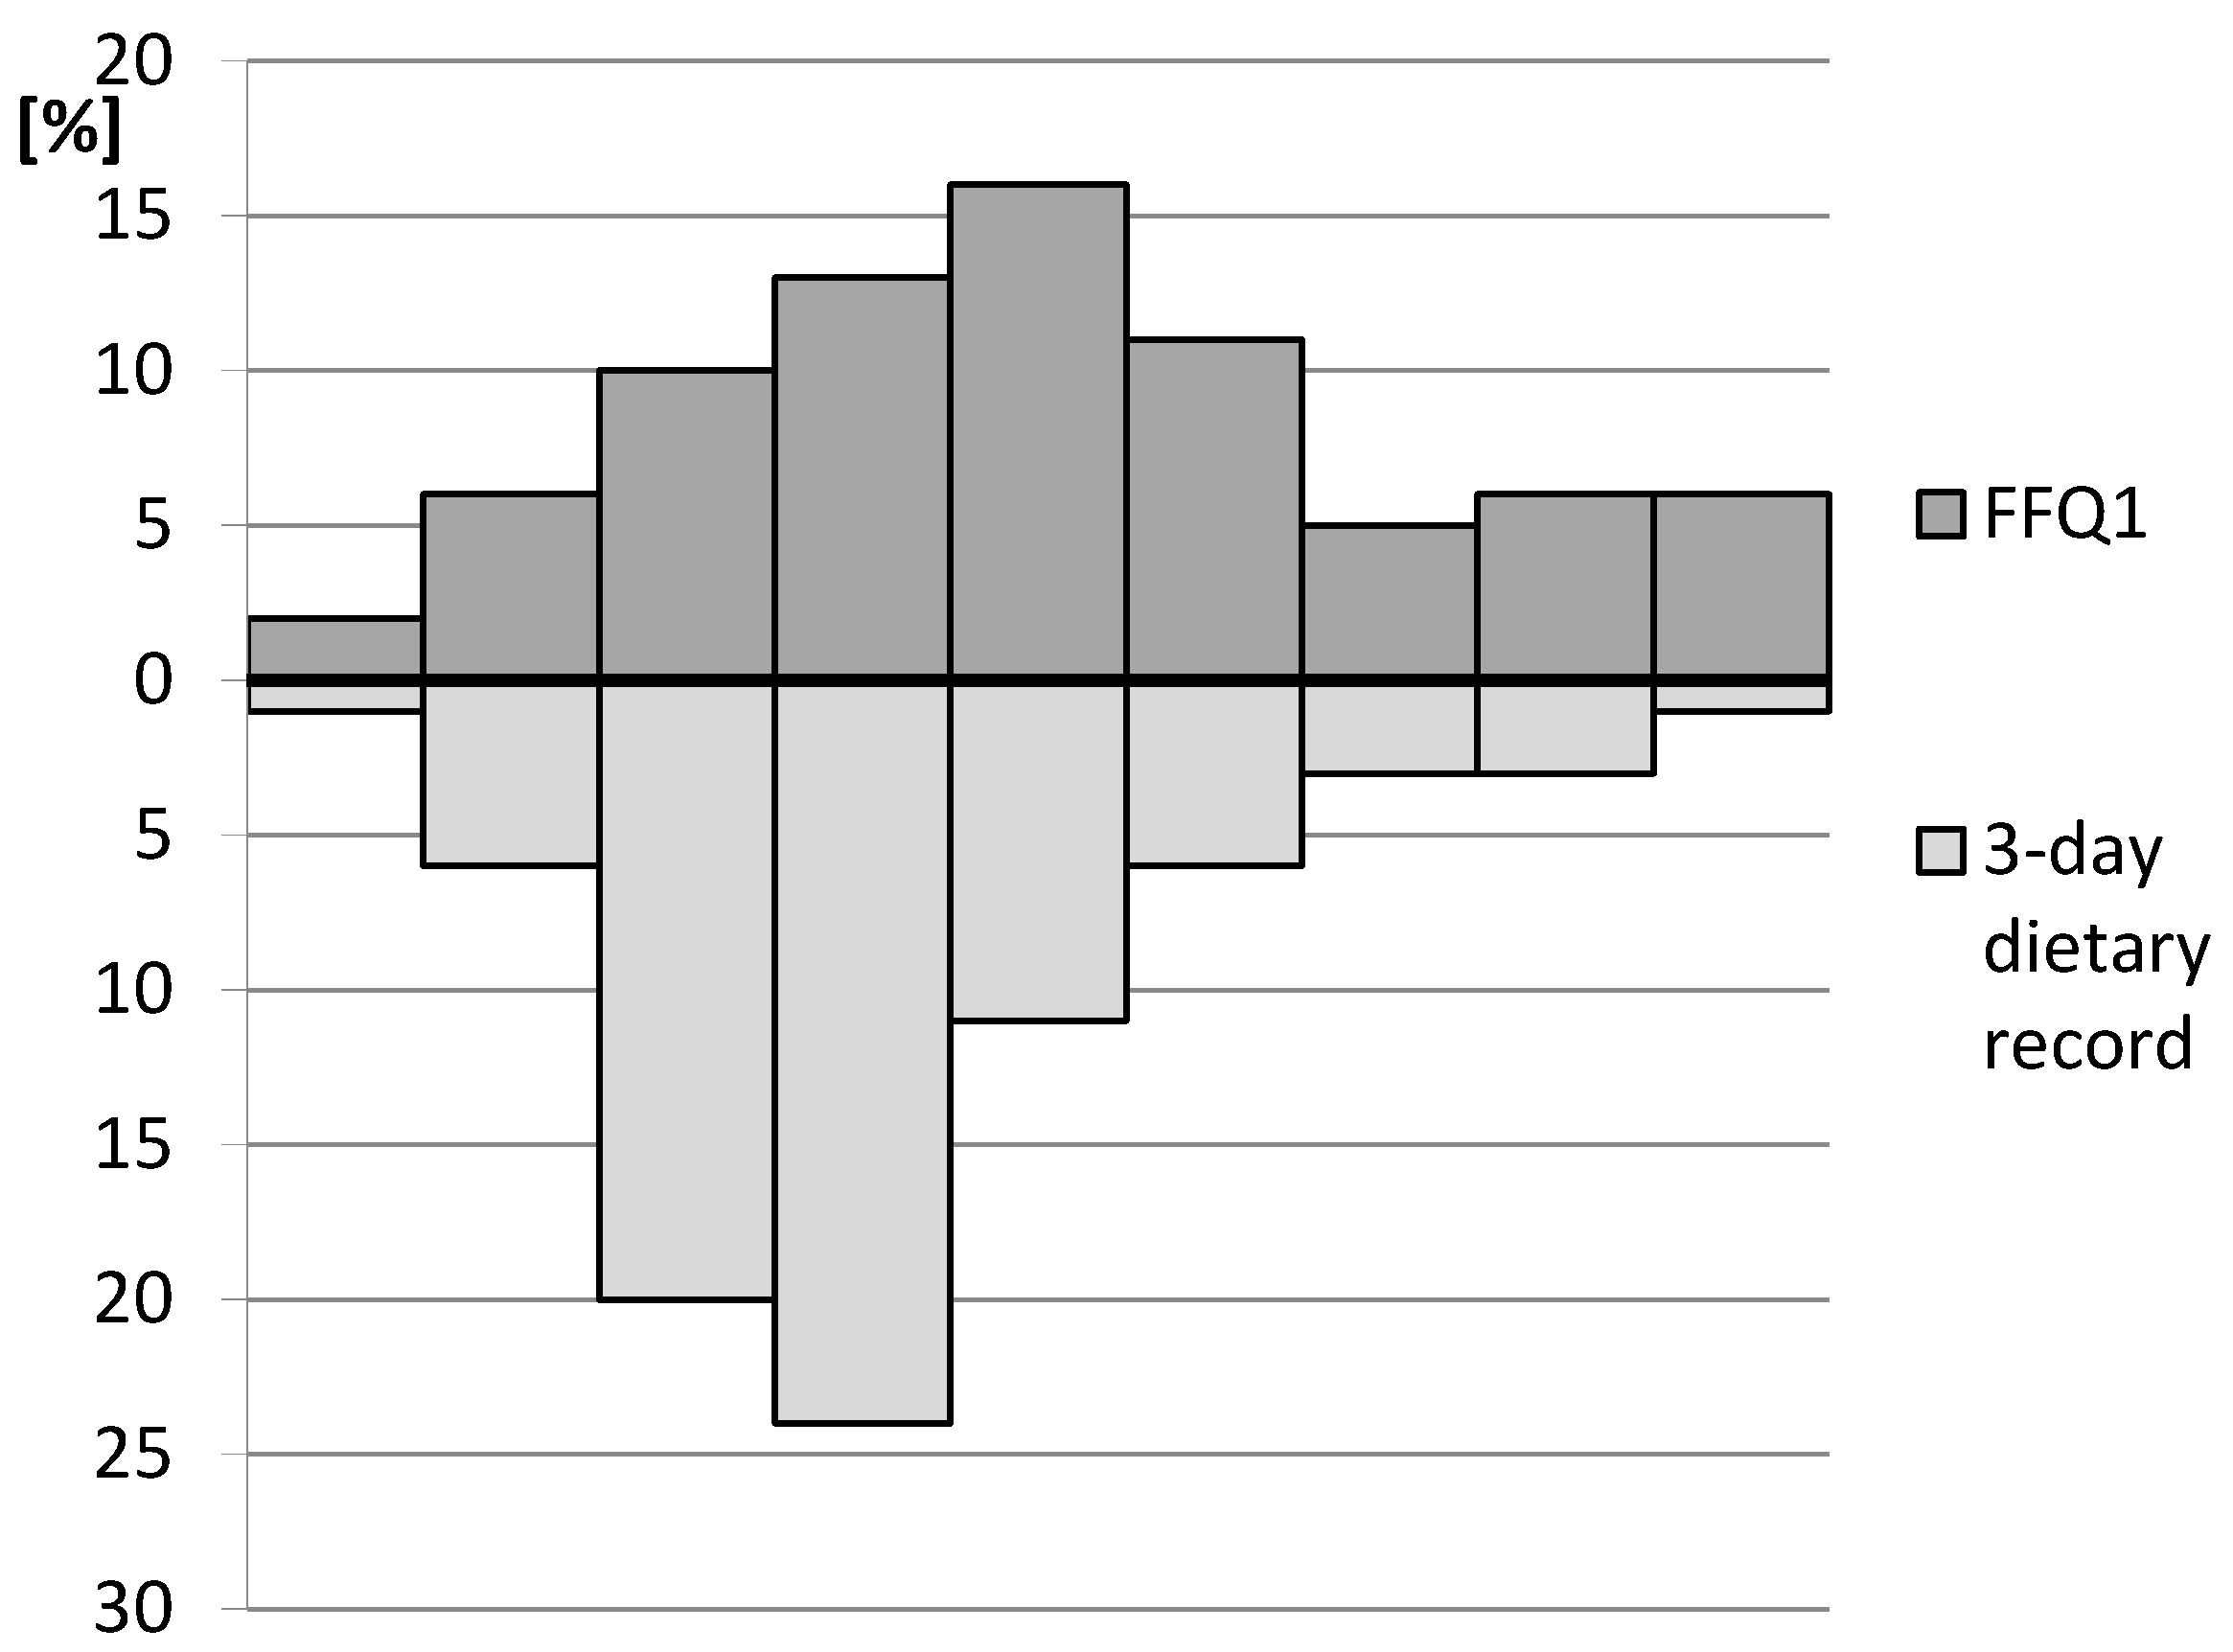
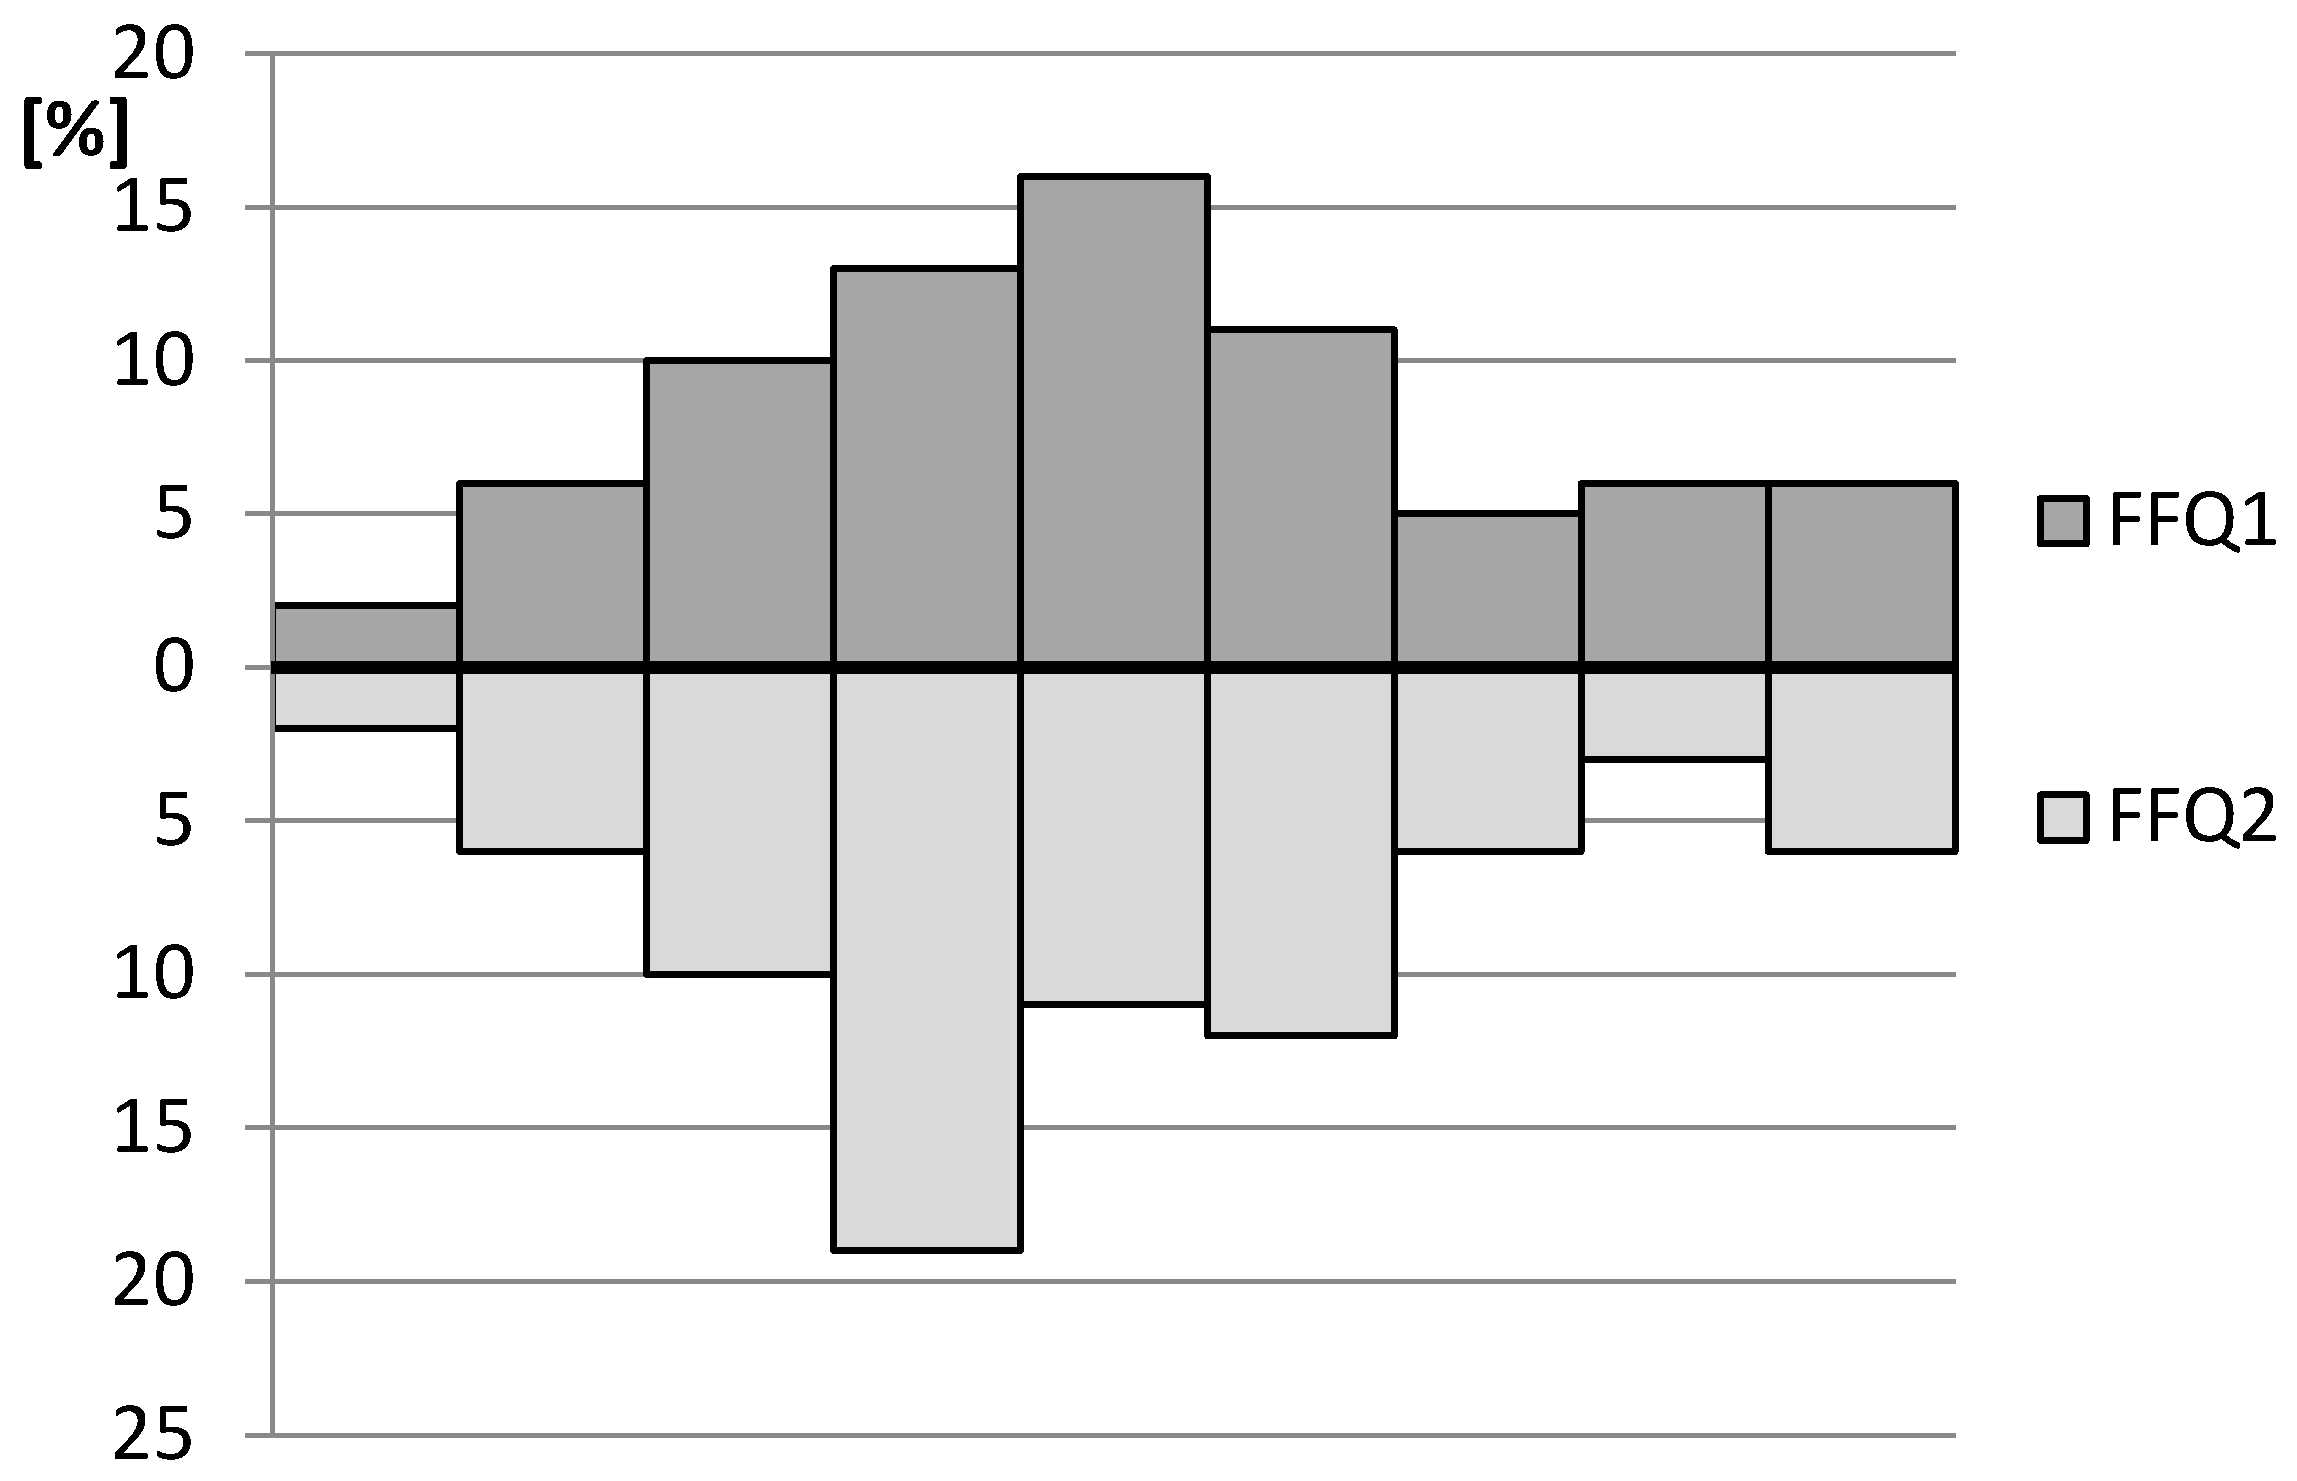
3. Results
4. Discussion
5. Conclusions
- (1)
- Assessment of the IRONIC-FFQ revealed a satisfactory level of validity and positively validated reproducibility.
- (2)
- The IRONIC-FFQ may be indicated as a practical tool for the assessment of iron intake and for analysis of the results of dietary intervention in the anemia risk group of young women.
Acknowledgments
Author Contributions
Conflicts of Interest
Abbreviations
| FFQ | Food Frequency Questionnaire |
| IRONIC-FFQ | IRON Intake Calculation-Food Frequency Questionnaire |
| WHO | World Health Organization |
| LOA | Limits of Agreement Value |
References
- World Health Organization. The World Health Report, Reducing Risks, Promoting Healthy Life; World Health Organization: Geneva, Switzerland, 2002. [Google Scholar]
- World Health Organization. The Global Prevalence of Anaemia in 2011; World Health Organization: Geneva, Switzerland, 2015. [Google Scholar]
- World Health Organization. Worldwide Prevalence of Anaemia 1993–2005, WHO Global Database of Anaemia; De Benoist, B., McLean, E., Egli, I., Cogswell, M., Eds.; World Health Organization: Geneva, Switzerland, 2008. [Google Scholar]
- World Health Organization. Iron Deficiency Anaemia Assessment, Prevention, and Control. A Guide for Programme Managers; WHO/NHD/01.3; United Nations Children’s Fund; United Nations University; World Health Organization: Geneva, Switzerland, 2001. [Google Scholar]
- World Health Organization. Global Nutrition Targets 2025, Policy Brief Series; WHO/NMH/NHD/14.2; World Health Organization: Geneva, Switzerland, 2014. [Google Scholar]
- Stevens, G.A.; Finucane, M.M.; De-Regil, L.M.; Paciorek, C.J.; Flaxman, S.R.; Branca, F.; Peña-Rosas, J.P.; Bhutta, Z.A.; Ezzati, M. Global, regional, and national trends in haemoglobin concentration and prevalence of total and severe anaemia in children and pregnant and non-pregnant women for 1995–2011, a systematic analysis of population-representative data. Lancet Glob. Health. 2013, 1, e16–e25. [Google Scholar] [CrossRef]
- Black, R.E.; Victora, C.G.; Walker, S.P.; Bhutta, Z.A.; Christian, P.; de Onis, M.; Ezzati, M.; Grantham-McGregor, S.; Katz, J.; Martorell, R.; et al. Maternal and child undernutrition and overweight in low-income and middle-income countries. Lancet 2013, 382, 427–451. [Google Scholar] [CrossRef]
- Jarosz, M.; Rychlik, E. The problem of malnutrition in Poland and across the world. Prog. Med. 2012, 12, 917–923. [Google Scholar]
- Hamułka, J.; Wawrzyniak, A.; Piątkowska, D.; Górnicka, M. Evaluation of iron, vitamin B12 and folate intake in the selected group of women at childbearing age. Rocz. Panstw. Zakl. Hig. 2011, 62, 263–270. (In Polish) [Google Scholar] [PubMed]
- Beck, K.L.; Kruger, R.; Conlon, C.; Heath, A.L.; Coad, J.; Matthys, C.; Jones, B.; Stonehouse, W. The relative validity and reproducibility of an iron food frequency questionnaire for identifying iron-related dietary patterns in young women in New Zealand. J. Acad. Nutr. Diet. 2012, 112, 1177–1187. [Google Scholar] [CrossRef] [PubMed]
- Branca, F.; Mahy, L.; Mustafa, T.S. The lack of progress in reducing anaemia among women, the inconvenient truth. Bull. World Health Organ. 2014. [Google Scholar] [CrossRef] [PubMed]
- The United Kingdom National Screening Committee (UK NSC). National Screening Committee’s Policy—Anemia Screening; National Screening Committee: London, UK, 2006.
- World Bank. Anemia Prevention and Control: What Works Part 1. The Micronutrient Initiative, the United Nations International Children’s Emergency Fund, the Canadian International Development Agency, the United Nations Food and Agriculture Organization, the United Nations Standing Committee on Nutrition and the World Health Organization; World Bank Nutrition Publications & Reports, The Population, Health and Nutrition Information Project; United States Agency for International Development: Washington, DC, USA, 2003.
- Kaur, M.; Bassi, R.; Sharma, S. Impact of nutrition education in reducing iron deficiency anemia in adolescent girls. Ind. J. Fund. Appl. Life Sci. 2011, 1, 222–228. [Google Scholar]
- Thompson, F.E.; Subar, A.F. Dietary assessment methodology. In Nutrition in the Prevention and Treatment of Disease, 1st ed.; Coulston, A.M., Boushey, C.J., Ferruzzi, M.G., Eds.; Elsevier Academic Press: Oxford, UK, 2008. [Google Scholar]
- Głąbska, D.; Włodarek, D. Minerals. In Diet Therapy; Włodarek, D., Lange, E., Kozłowska, L., Głąbska, D., Eds.; PZWL Medical Publishing Group: Warsaw, Poland, 2014. (In Polish) [Google Scholar]
- Kunachowicz, H.; Nadolna, J.; Przygoda, B.; Iwanow, K. (Eds.) Food Composition Tables; PZWL Medical Publishing Group: Warsaw, Poland, 2005. (In Polish)
- Ratkovska, B.; Kunachowicz, H.; Przygoda, B. Krajowy rynek produktów wzbogaconych w witaminy i składniki mineralne wobec wymagań prawnych UE. Zywn. Nauk. Technol. Jakosc 2007, 6, 90–99. (In Polish) [Google Scholar]
- Szponar, L.; Wolnicka, K.; Rychlik, E. Atlas of Food Products and Dishes Portion Sizes; National Food and Nutrition Institute: Warsaw, Poland, 2012. (In Polish) [Google Scholar]
- Mills, V.C.; Skidmore, P.M.; Watson, E.O.; Taylor, R.W.; Fleming, E.A.; Heath, A.L. Relative validity and reproducibility of a food frequency questionnaire for identifying the dietary patterns of toddlers in New Zealand. J. Acad. Nutr. Diet. 2015, 115, 551–558. [Google Scholar] [CrossRef] [PubMed]
- The Central Statistical Office in Poland. Demographic Yearbook of Poland; The Central Statistical Publishing Office in Poland: Warsaw, Poland, 2014. (In Polish)
- Roman Viñas, B.; Ribas Barba, L.; Ngo, J.; Gurinovic, M.; Novakovic, R.; Cavelaars, A.; De Groot, L.C.; van’t Veer, P.; Matthys, C.; Serra Majem, L. Projected prevalence of inadequate nutrient intakes in Europe. Ann. Nutr. Metab. 2011, 59, 84–95. [Google Scholar] [CrossRef] [PubMed]
- Głąbska, D.; Guzek, D.; Sidor, P.; Włodarek, D. Vitamin D dietary intake questionnaire validation conducted among young Polish women. Nutrients 2016, 5, 36. [Google Scholar] [CrossRef] [PubMed]
- Pysz, K.; Leszczyńska, T.; Kopeć, A.; Bieżanowska-Kopeć, R.; Domagała, D. Chemical analysis of minerals content in daily diets of children and adolescents grown up in Krakow orphanages. Rocz. Panstw. Zakl. Hig. 2015, 66, 129–136. (In Polish) [Google Scholar] [PubMed]
- Cade, J.; Thompson, R.; Burley, V.; Warm, D. Development, validation and utilisation of food-frequency questionnaires—A review. Public Health Nutr. 2002, 5, 567–587. [Google Scholar] [CrossRef] [PubMed]
- Willett, W.; Lenart, E. Reproducibility and validity of food frequency questionnaires. In Nutritional Epidemiology, 3rd ed.; Willett, W., Ed.; Oxford University Press: Oxford, UK, 1985. [Google Scholar]
- Ortega, R.M.; Pérez-Rodrigo, C.; López-Sobaler, A.M. Dietary assessment methods: Dietary records. Nutr. Hosp. 2015, 31, 38–45. [Google Scholar] [PubMed]
- Landis, J.R.; Koch, G.G. The measurement of observer agreement for categorical data. Biometrics 1977, 33, 159–174. [Google Scholar] [CrossRef] [PubMed]
- Myles, P.S.; Cui, J. Using the Bland-Altman method to measure agreement with repeated measures. Br. J. Anaesth. 2007, 99, 309–311. [Google Scholar] [CrossRef] [PubMed]
- Jarosz, M. (Ed.) Human Nutrition Recommendations for Polish Population; National Food and Nutrition Institute: Warsaw, Poland, 2012. (In Polish)
- Palmer, M.A.; Morgan, C.L. How well are we validating food frequency questionnaires that measure dietary iron intakes of Australian and New Zealand adults? Nutr. Diet. 2012, 69, 159–166. [Google Scholar] [CrossRef]
- Heath, A.L.; Skeaff, C.M.; Gibson, R.S. The relative validity of a computerized food frequency questionnaire for estimating intake of dietary iron and its absorption modifiers. Eur. J. Clin. Nutr. 2000, 54, 592–599. [Google Scholar] [CrossRef] [PubMed]
- Barrett, J.S.; Gibson, P.R. Development and validation of a comprehensive semi-quantitative food frequency questionnaire that includes FODMAP intake and glycemic index. J. Am. Diet. Assoc. 2010, 110, 1469–1476. [Google Scholar] [CrossRef] [PubMed]
- Kelley, K.; Clark, B.; Brown, V.; Sitzia, J. Good practice in the conduct and reporting of survey research. Int. J. Qual. Health Care 2003, 15, 261–266. [Google Scholar] [CrossRef] [PubMed]
- Choi, B.C.; Pak, A.W. A catalog of biases in questionnaires. Prev. Chronic. Dis. 2005, 2, A13. [Google Scholar] [PubMed]
- Fayet, F.; Flood, V.; Petocz, P.; Samman, S. Relative and biomarker-based validity of a food frequency questionnaire that measures the intakes of vitamin B(12), folate, iron, and zinc in young women. Nutr. Res. 2011, 31, 14–20. [Google Scholar] [CrossRef] [PubMed]
- Galante, A.P.; Colli, C. Development and use of an on-line semi-quantitative food-frequency questionnaire to evaluate calcium and iron intake. Braz. J. Epidemiol. 2008, 11, 1–9. [Google Scholar]
- Sichieri, R.; Everhart, J.E. Validity of Brazilian food frequency questionnaire against dietary recalls and estimated energy intake. Nutr. Res. 1998, 18, 1649–1659. [Google Scholar] [CrossRef]
- Molag, M.L.; De Vries, J.H.; Ocké, M.C.; Dagnelie, P.C.; Van den Brandt, P.A.; Jansen, M.C.; van’t Veer, P. Design characteristics of food frequency questionnaires in relation to their validity. Am. J. Epidemiol. 2007, 166, 1468–1478. [Google Scholar] [CrossRef] [PubMed]
- Williams, P.L.; Innis, S.M. Food frequency questionnaire for assessing infant iron nutrition. Can. J. Diet. Pract. Res. 2005, 66, 176–182. [Google Scholar] [CrossRef] [PubMed]
- Kim, S.H.; Choi, H.N.; Hwang, J.-Y.; Chang, N.; Kim, W.Y.; Chung, H.W.; Yang, Y.J. Development and evaluation of a food frequency questionnaire for Vietnamese female immigrants in Korea: The Korean Genome and Epidemiology Study (KoGES). Nutr. Res. Pract. 2011, 5, 260–265. [Google Scholar] [CrossRef] [PubMed]
- Jayawardena, R.; Swaminathan, S.; Byrne, N.M.; Soares, M.J.; Katulanda, P.; Hills, A.P. Development of a food frequency questionnaire for Sri Lankan adults. Nutr. J. 2012, 11, 63. [Google Scholar] [CrossRef] [PubMed]
- Masson, L.F.; McNeill, G.; Tomany, J.O.; Simpson, J.A.; Peace, H.S.; Wei, L.; Bolton-Smith, C. Statistical approaches for assessing the relative validity of a food-frequency questionnaire, use of correlation coefficients and the kappa statistic. Public Health Nutr. 2003, 6, 313–321. [Google Scholar] [CrossRef] [PubMed]
- Willett, W. Invited commentary, a further look at dietary questionnaire validation. Am. J. Epidemiol. 2001, 154, 1100–1102. [Google Scholar] [CrossRef] [PubMed]
- Kowalkowska, J.; Slowinska, M.A.; Slowinski, D.; Dlugosz, A.; Niedzwiedzka, E.; Wadolowska, L. Comparison of a full food-frequency questionnaire with the three-day unweighted food records in young Polish adult women, implications for dietary assessment. Nutrients 2013, 19, 2747–2776. [Google Scholar] [CrossRef] [PubMed]
- Cade, J.E.; Burley, V.J.; Warm, D.L.; Thompson, R.L.; Margetts, B.M. Food-frequency questionnaires: A review of their design, validation and utilization. Nutr. Res. 2004, 17, 5–22. [Google Scholar] [CrossRef] [PubMed]
- Yang, Y.J.; Kim, M.K.; Hwang, S.H.; Ahn, Y.; Shim, J.E.; Kim, D.H. Relative validities of 3-day food records and the food frequency questionnaire. Nutr. Res. Pract. 2010, 4, 142–148. [Google Scholar] [CrossRef] [PubMed]

| Group of Products | Products | Serving Size | Iron Content/Serving (mg) |
|---|---|---|---|
| Meat | Liver (pork, beef, calf, poultry), pork kidney | 100 g (palm of small hand) | 13.30 |
| Other pork offal, poultry stomach | 100 g (palm of small hand) | 3.30 | |
| Beef, calf, lamb, horse, goose, duck meat | 100 g (palm of small hand) | 2.60 | |
| Pork meat | 100 g (palm of small hand) | 1.00 | |
| Poultry meat | 100 g (palm of small hand) | 1.00 | |
| Broth | 250 g (1 glass) | 0.25 | |
| Meat products | Blood pudding sausage | 25 g (e.g., 1/2 of wiener, medium slice of ham, 5 slices of sausage) | 4.22 |
| Other offal cold cuts | 25 g (e.g., 1/2 of wiener, medium slice of ham, 5 slices of sausage) | 1.35 | |
| Loin cold cuts, ham, poultry sausages | 25 g (e.g., 1/2 of wiener, medium slice of ham, 5 slices of sausage) | 0.21 | |
| Other sausages, wiener, smoked gammon, spam, pate, salami, brawn cold cut, bacon | 25 g (e.g., 1/2 of wiener, medium slice of ham, 5 slices of sausage) | 0.48 | |
| Eggs | 50 g (1 egg) | 1.10 | |
| Fish | Sardines | 50 g (deck of cards) | 1.07 |
| Other fish and fish products | 50 g (deck of cards) | 0.45 | |
| Dairy products | Milk and milk beverages (yoghurt, kefir, buttermilk, cream) | 250 g (1 glass) | 0.37 |
| Cottage cheese | 50 g (1 thick slice, 2 tablespoons) | 0.10 | |
| Rennet and processed cheese | 25 g (1 slice, 1 triangle serving) | 0.15 | |
| Cereal products | White wheat and rye bread, bakery wares | 35 g (1 slice, small roll) | 0.37 |
| Dark bread, wholemeal, with grains, graham bread, pumpernickel bread | 35 g (1 slice, small roll) | 0.70 | |
| Crispbread | 10 g (1 slice) | 0.40 | |
| Wheat bran, wheat germs | 10 g (1 spoon) | 1.20 | |
| Iron-fortified corn flakes and cereals | 35 g (1 glass) | 4.30 | |
| Other cereal products (uncooked) | 100 g (e.g., 1 glass of pasta or oatmeal, 1/2 glass of rice or groats) | 2.70 | |
| Fruits | Fresh fruits | 100 g (1 medium piece, 1 glass) | 0.65 |
| Dried fruits | 50 g (handful) | 1.28 | |
| Vegetables | Dry legumes | 100 g (1/2 of glass) | 6.80 |
| Other vegetables | 100 g (1 medium piece, 1 glass) | 1.10 | |
| Potatoes | 100 g (1 large piece) | 0.50 | |
| Fats | 10 g (1 spoon) | 0.20 | |
| Nuts and seeds | Poppy, pumpkin and flaxseed | 30 g (handful, 3 spoons of seeds) | 3.78 |
| Other nuts and seeds | 30 g (handful, 3 spoons of seeds) | 1.28 | |
| Cocoa products | Cocoa | 10 g (1 spoon) | 1.07 |
| Chocolate | 20 g (1/5 of bar) | 0.41 |
| 3-Day Dietary Record | FFQ1 | FFQ2 | |||
|---|---|---|---|---|---|
| Mean (mg) | 9.38 | 11.47 | 11.28 | ||
| Standard deviation (mg) | 3.54 | 5.18 | 5.14 | ||
| Median (mg) | 8.32 * | 10.73 * | 10.49 * | ||
| Minimum (mg) | 3.31 | 3.01 | 2.44 | ||
| Maximum (mg) | 21.46 | 28.45 | 27.90 | ||
| Share of individuals characterised in comparison with recommendation by Jarosz [30] | adequate intake | n | 47 | 55 | 55 |
| (%) | 62.7 | 73.3 | 73.3 | ||
| inadequate intake | n | 28 | 20 | 20 | |
| (%) | 37.3 | 26.7 | 26.7 | ||
| Group of Products | Mean ± Standard Deviation (%) | Median (%) | Minimum–Maximum (%) |
|---|---|---|---|
| Meat | 10.65 ± 9.17 | 8.29 * | 0–58.50 |
| Meat products | 6.23 ± 6.72 | 4.13 * | 0–46.92 |
| Eggs | 4.86 ± 3.37 | 4.88 * | 0–24.72 |
| Fish | 1.23 ± 1.52 | 0.79 * | 0–8.05 |
| Dairy products | 3.90 ± 2.21 | 3.51 * | 0–14.10 |
| Cereal products | 32.31 ± 12.78 | 30.35 * | 5.43–73.37 |
| Fruits | 8.12 ± 5.59 | 7.29 * | 0–36.88 |
| Vegetables including dry legumes | 19.30 ± 11.69 | 18.37 * | 0–55.89 |
| Potatoes | 2.56 ± 2.60 | 1.92 * | 0–16.76 |
| Fats | 0.16 ± 0.29 | 0.11 * | 0–3.29 |
| Nuts and seeds | 7.90 ± 7.73 | 6.17 * | 0–35.94 |
| Cocoa products | 2.77 ± 3.00 | 1.97 * | 0–19.32 |
| FFQ1 vs. 3-Day Dietary Record | FFQ1 vs. FFQ2 | |||
|---|---|---|---|---|
| Individuals classified into the same tertile | n | 40 | 59 | |
| % | 53.3 | 78.7 | ||
| Individuals classified into adjacent tertiles | n | 26 | 14 | |
| % | 34.7 | 18.7 | ||
| Individuals misclassified (classified into opposite tertiles) | n | 9 | 2 | |
| % | 12.0 | 2.7 | ||
| Weighted κ statistic | 0.36 | 0.73 | ||
| Individuals of the | same iron intake adequacy category | n | 49 | 67 |
| % | 65.3 | 89.3 | ||
| conflicting iron intake adequacy category | n | 26 | 8 | |
| % | 34.7 | 10.7 | ||
© 2017 by the authors. Licensee MDPI, Basel, Switzerland. This article is an open access article distributed under the terms and conditions of the Creative Commons Attribution (CC BY) license ( http://creativecommons.org/licenses/by/4.0/).
Share and Cite
Głąbska, D.; Guzek, D.; Ślązak, J.; Włodarek, D. Assessing the Validity and Reproducibility of an Iron Dietary Intake Questionnaire Conducted in a Group of Young Polish Women. Nutrients 2017, 9, 199. https://doi.org/10.3390/nu9030199
Głąbska D, Guzek D, Ślązak J, Włodarek D. Assessing the Validity and Reproducibility of an Iron Dietary Intake Questionnaire Conducted in a Group of Young Polish Women. Nutrients. 2017; 9(3):199. https://doi.org/10.3390/nu9030199
Chicago/Turabian StyleGłąbska, Dominika, Dominika Guzek, Joanna Ślązak, and Dariusz Włodarek. 2017. "Assessing the Validity and Reproducibility of an Iron Dietary Intake Questionnaire Conducted in a Group of Young Polish Women" Nutrients 9, no. 3: 199. https://doi.org/10.3390/nu9030199
APA StyleGłąbska, D., Guzek, D., Ślązak, J., & Włodarek, D. (2017). Assessing the Validity and Reproducibility of an Iron Dietary Intake Questionnaire Conducted in a Group of Young Polish Women. Nutrients, 9(3), 199. https://doi.org/10.3390/nu9030199