Mediterranean Diet and Phase Angle in a Sample of Adult Population: Results of a Pilot Study

 ,
, 
 ,
, 


Abstract
:1. Introduction
2. Subjects and Methods
2.1. Design and Setting
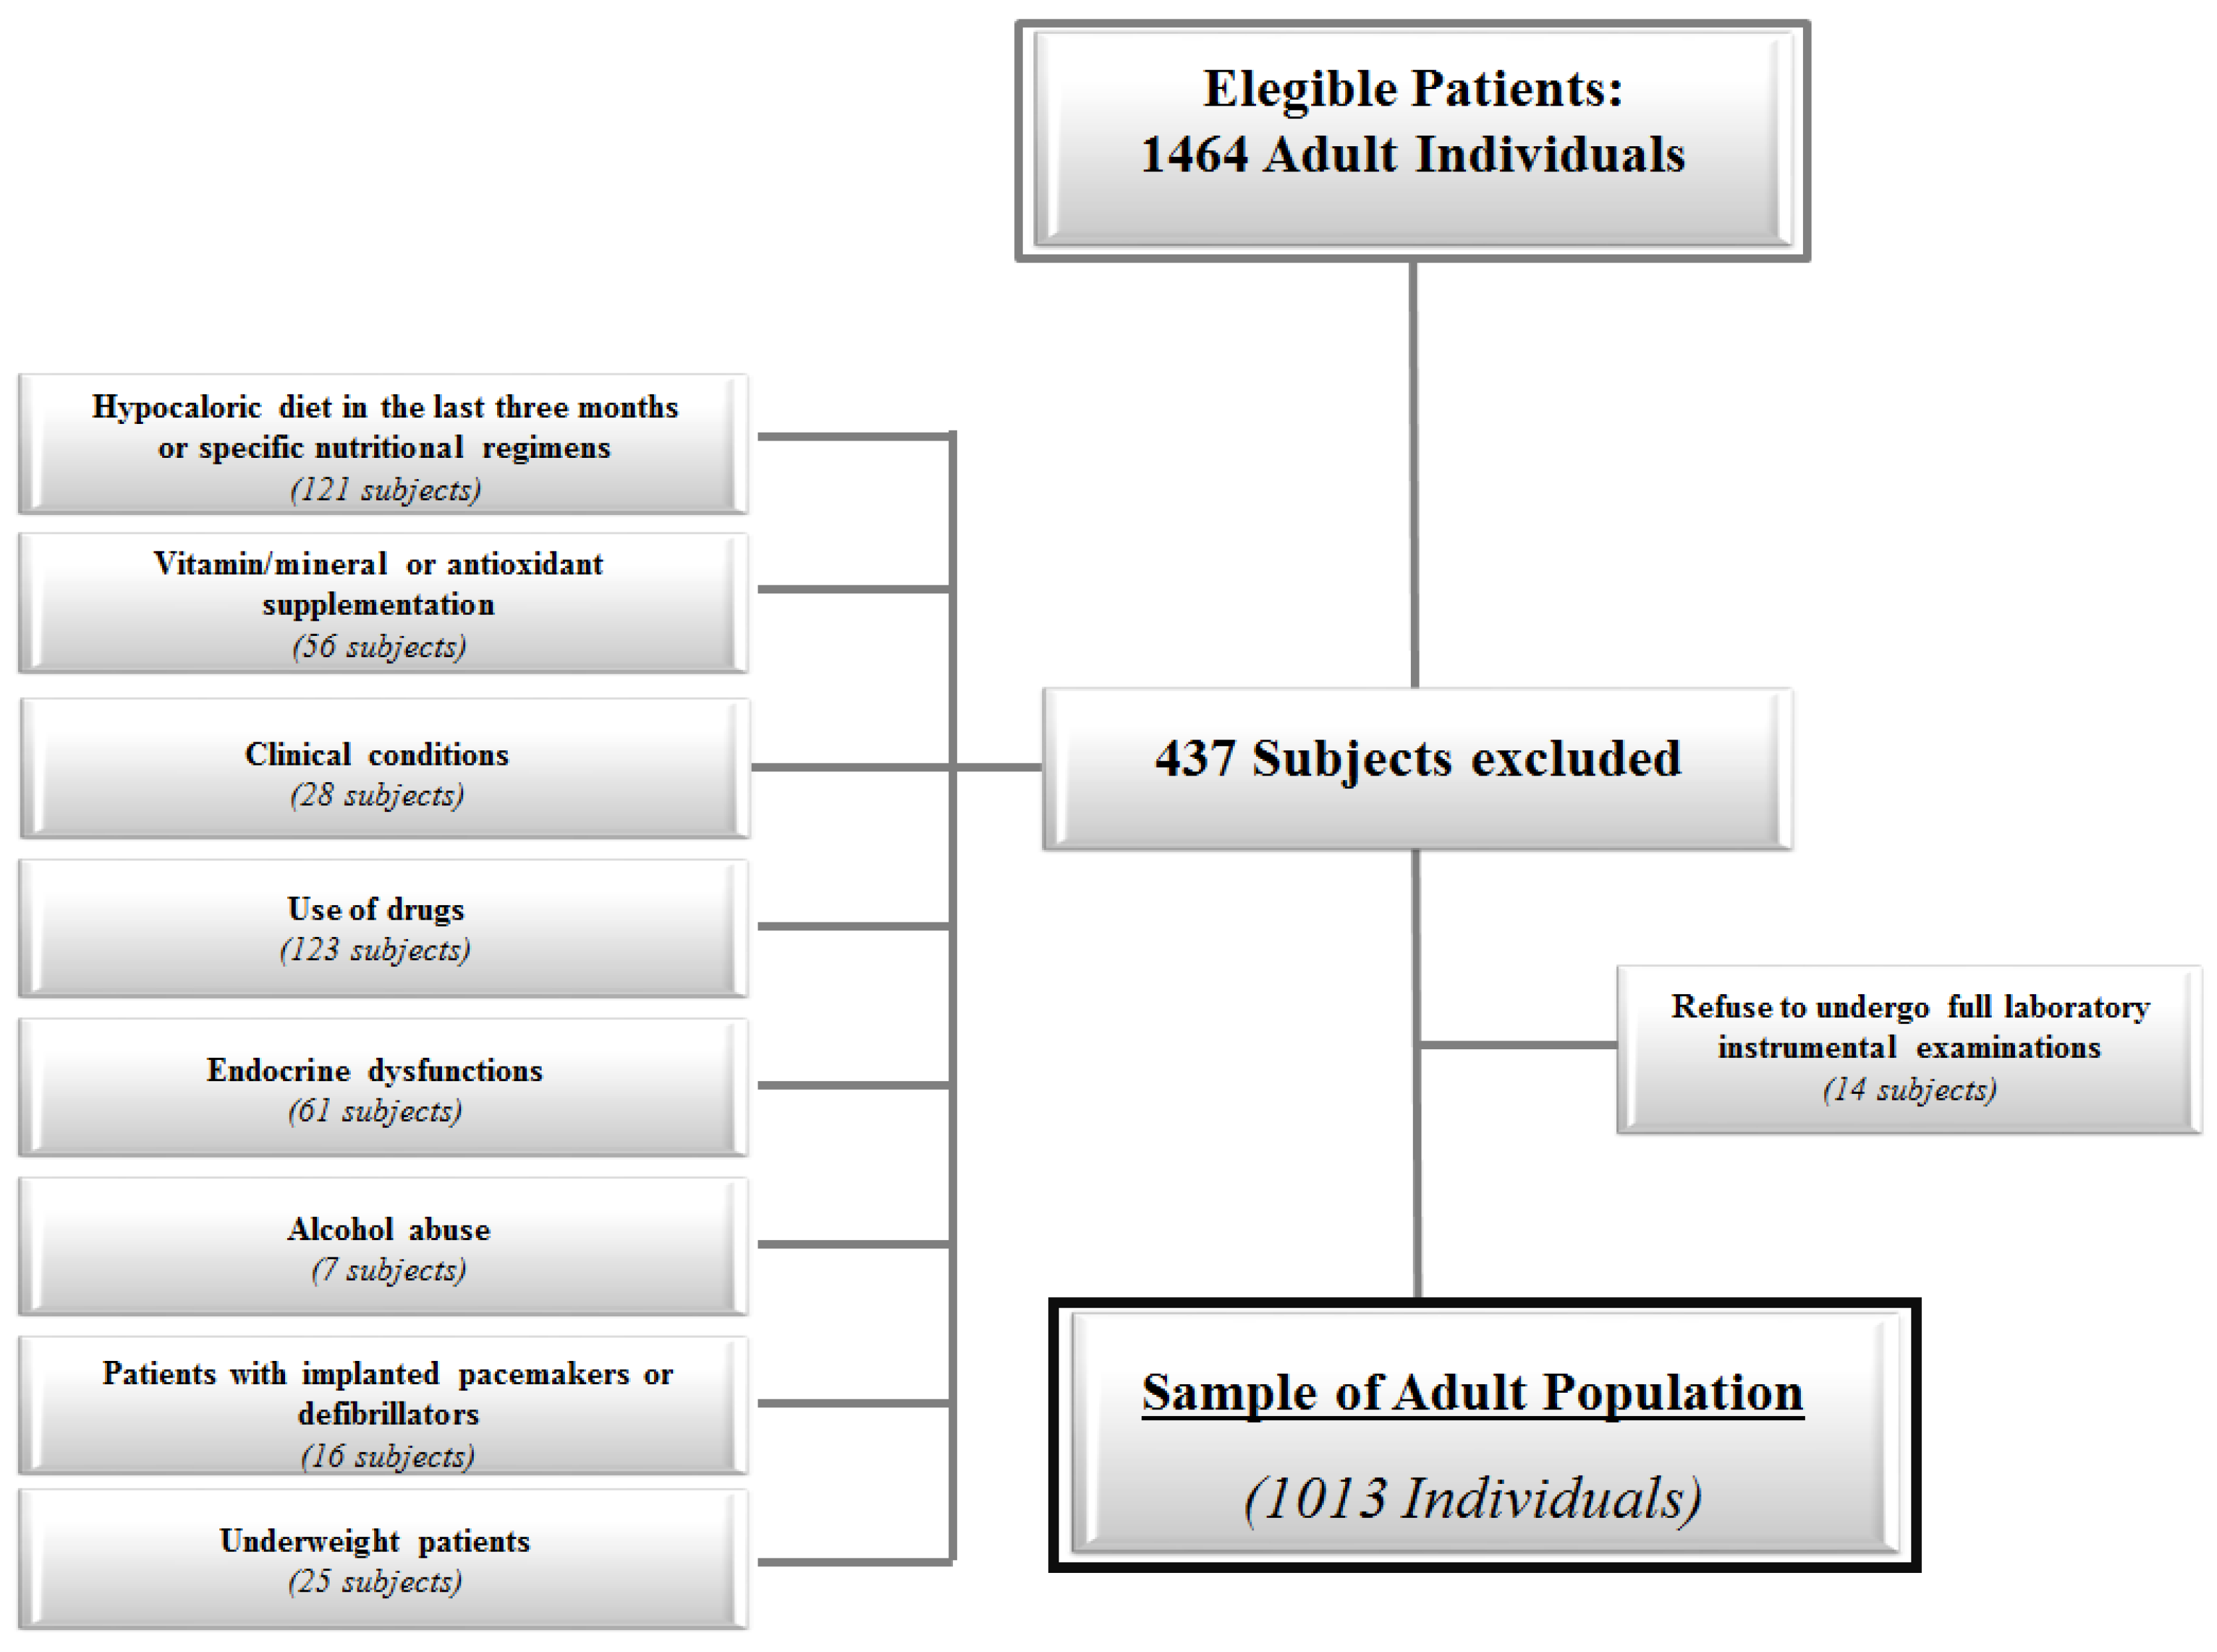
2.2. Population Study
2.3. Anthropometric Measurements
2.4. Adherence to the Mediterranean Diet
2.5. Bioelectrical Impedance Analysis
2.6. Statistical Analysis
3. Results
Correlation Studies
4. Discussion
Supplementary Materials
Acknowledgments
Author Contributions
Conflicts of Interest
Abbreviations
| PhA | Phase Angle |
| BMI | Body Mass Index |
| PREDIMED | PREvención con DIeta MEDiterránea |
References
- Martínez-González, M.A. Benefits of the Mediterranean diet beyond the Mediterranean Sea and beyond food patterns. BMC Med. 2016, 14, 157. [Google Scholar] [CrossRef] [PubMed]
- Martínez-González, M.A.; Salas-Salvadó, J.; Estruch, R.; Corella, D.; Fitó, M.; Ros, E.; PREDIMED INVESTIGATORS. Benefits of the Mediterranean Diet: Insights From the PREDIMED Study. Prog. Cardiovasc. Dis. 2015, 58, 50–60. [Google Scholar]
- Oliviero, F.; Spinella, P.; Fiocco, U.; Ramonda, R.; Sfriso, P.; Punzi, L. How the Mediterranean diet and some of its components modulate inflammatory pathways in arthritis. Swiss Med. Wkly. 2015, 145, w14190. [Google Scholar] [CrossRef]
- Barceló, F.; Perona, J.S.; Prades, J.; Funari, S.S.; Gomez-Gracia, E.; Conde, M.; Estruch, R.; Ruiz-Gutiérrez, V. Mediterranean-style diet effect on the structural properties of the erythrocyte cell membrane of hypertensive patients: The Prevencion con Dieta Mediterranea Study. Hypertension 2009, 54, 1143–1150. [Google Scholar] [CrossRef] [PubMed]
- Ares, G.; Gámbaro, A. Influence of gender, age and motives underlying food choice on perceived healthiness and willingness to try functional foods. Appetite 2007, 49, 148–158. [Google Scholar] [CrossRef] [PubMed]
- Westenhoefer, J. Age and gender dependent profile of food choice. In Diet Diversification and Health Promotion; Karger Publishers: Basel, Switzerland, 2005; pp. 44–51. [Google Scholar]
- Sánchez-Villegas, A.; Delgado-Rodríguez, M.; Martínez-González, M.A.; de Irala-Estévez, J. Seguimiento Universidad de Navarra group. Gender, age, socio-demographic and lifestyle factors associated with major dietary patterns in the Spanish Project SUN (Seguimiento Universidad de Navarra). Eur. J. Clin. Nutr. 2003, 57, 285–292. [Google Scholar] [CrossRef] [PubMed]
- Baumgartner, R.N.; Chumlea, W.C.; Roche, A.F. Bioelectric impedance phase angle and body composition. Am. J. Clin. Nutr. 1988, 48, 16–23. [Google Scholar]
- Norman, K.; Stobäus, N.; Pirlich, M.; Bosy-Westphal, A. Bioelectrical phase angle and impedance vector analysis—Clinical relevance and applicability of impedance parameters. Clin. Nutr. 2012, 31, 854–861. [Google Scholar] [CrossRef] [PubMed]
- Stobäus, N.; Pirlich, M.; Valentini, L.; Schulzke, J.D.; Norman, K. Determinants of bioelectrical phase angle in disease. Br. J. Nutr. 2012, 107, 1217–1220. [Google Scholar] [CrossRef] [PubMed]
- Norman, K.; Stobäus, N.; Zocher, D.; Bosy-Westphal, A.; Szramek, A.; Scheufele, R.; Smoliner, C.; Pirlich, M. Cutoff percentiles of bioelectrical phase angle predict functionality, quality of life, and mortality in patients with cancer. Am. J. Clin. Nutr. 2010, 92, 612–619. [Google Scholar] [CrossRef] [PubMed]
- Xu, Y.; Xie, X.; Duan, Y.; Wang, L.; Cheng, Z.; Cheng, J. A review of impedance measurements of whole cells. Biosens. Bioelectron. 2016, 77, 824–836. [Google Scholar] [CrossRef] [PubMed]
- Barbosa-Silva, M.C.; Barros, A.J.; Wang, J.; Heymsfield, S.B.; Pierson, R.N., Jr. Bioelectrical impedance analysis: Population reference values for phase angle by age and sex. Am. J. Clin. Nutr. 2005, 82, 49–52. [Google Scholar] [PubMed]
- Bosy-Westphal, A.; Danielzik, S.; Dörhöfer, R.P.; Later, W.; Wiese, S.; Müller, M.J. Phase angle from bioelectrical impedance analysis: Population reference values by age, sex, and body mass index. JPEN J. Parenter. Enter. Nutr. 2006, 30, 309–316. [Google Scholar] [CrossRef] [PubMed]
- Kumar, S.; Dutt, A.; Hemraj, S.; Bhat, S.; Manipadybhima, B. Phase Angle Measurement in Healthy Human Subjects through Bio-Impedance Analysis. Iran. J. Basic Med. Sci. 2012, 15, 1180–1184. [Google Scholar] [PubMed]
- Kyle, U.G.; Soundar, E.P.; Genton, L.; Pichard, C. Can phase angle determined by bioelectrical impedance analysis assess nutritional risk? A comparison between healthy and hospitalized subjects. Clin. Nutr. 2012, 31, 875–881. [Google Scholar] [CrossRef] [PubMed]
- Dittmar, M. Reliability and variability of bioimpedance measures in normal adults: Effects of age, gender, and body mass. Am. J. Phys. Anthropol. 2003, 122, 361–370. [Google Scholar] [CrossRef] [PubMed]
- Dittmar, M.; Reber, H.; Kahaly, G.J. Bioimpedance phase angle indicates catabolism in Type 2 diabetes. Diabet. Med. 2015, 32, 1177–1185. [Google Scholar] [CrossRef] [PubMed]
- De Luis, D.A.; Aller, R.; Romero, E.; Dueñas, A.; Perez Castrillon, J.L. Relation of phase angle tertiles with blood adipocytokines levels, insulin resistance and cardiovascular risk factors in obese women patients. Eur. Rev. Med. Pharmacol. Sci. 2010, 14, 521–526. [Google Scholar] [PubMed]
- Barrea, L.; Macchia, P.E.; Di Somma, C.; Napolitano, M.; Balato, A.; Falco, A.; Savanelli, M.C.; Balato, B.N.; Colao, A.; Savastano, S. Bioelectrical phase angle and psoriasis: A novel association with psoriasis severity, quality of life and metabolic syndrome. J. Transl. Med. 2016, 14, 130. [Google Scholar] [CrossRef] [PubMed]
- Barrea, L.; Balato, N.; Di Somma, C.; Macchia, P.E.; Napolitano, M.; Savanelli, M.C.; Esposito, K.; Colao, A.; Savastano, S. Nutrition and psoriasis: is there any association between the severity of the disease and adherence to the Mediterranean diet? J. Transl. Med. 2015, 13, 18. [Google Scholar] [CrossRef] [PubMed]
- Schloerb, P.R.; Forster, J.; Delcore, R.; Kindscher, J.D. Bioelectrical impedance in the clinical evaluation of liver disease. Am. J. Clin. Nutr. 1996, 64, 510–514. [Google Scholar]
- De França, N.A.G.; Callegari, A.; Gondo, F.F.; Corrente, J.E.; Mclellan, K.C.P.; Burini, R.C.; de Oliveira, E.P. Higher dietary quality and muscle mass decrease the odds of low phase angle in bioelectrical impedance analysis in Brazilian individuals. Nutr. Dietet. 2016, 73, 474–481. [Google Scholar] [CrossRef]
- Hu, F.B. Dietary pattern analysis: A new direction in nutritional epidemiology. Curr. Opin. Lipidol. 2002, 13, 3–9. [Google Scholar] [CrossRef] [PubMed]
- Available online: http://www.campussalute.it/onlus/.
- Martínez-González, M.A.; García-Arellano, A.; Toledo, E.; Salas-Salvadó, J.; Buil-Cosiales, P.; Corella, D.; Covas, M.I.; Schröder, H.; Arós, F.; Gómez-Gracia, E.; et al. A 14-item Mediterranean diet assessment tool and obesity indexes among high-risk subjects: The PREDIMED trial. PLoS ONE 2012, 7, e43134. [Google Scholar] [CrossRef] [PubMed]
- Yanovski, S.Z.; Hubbard, V.S.; Heymsfield, S.B.; Lukaski, H.C. Bioelectrical impedance analysis in body composition measurement: National Institutes of Health Technology Assessment Conference Statement. Am. J. Clin. Nutr. 1996, 64, 524S–532S. [Google Scholar]
- Kyle, U.G.; Bosaeus, I.; de Lorenzo, A.D.; Deurenberg, P.; Elia, M.; Manuel Gómez, J.; Heitmann, B.L.; Kent-Smith, L.; Melchior, J.-C.; Pirlich, M.; et al. Bioelectrical impedance analysis—Part II: Utilization in clinical practice. Clin. Nutr. 2004, 23, 1430–1453. [Google Scholar] [CrossRef] [PubMed]
- Kushner, R.F. Bioelectrical impedance analysis: A review of principles and applications. J. Am. Coll. Nutr. 1992, 11, 199–209. [Google Scholar] [PubMed]
- Available online: http://www.istat.it/it/campania.
- Available online: http://www.R-project.org.
- Schröder, H.; Marrugat, J.; Vila, J.; Covas, M.I.; Elosua, R. Adherence to the traditional mediterranean diet is inversely associated with body mass index and obesity in a Spanish population. J. Nutr. 2004, 134, 3355–3361. [Google Scholar] [PubMed]
- Mendez, M.A.; Popkin, B.M.; Jakszyn, P.; Berenguer, A.; Tormo, M.J.; Sanchéz, M.J.; Quirós, J.R.; Pera, G.; Navarro, C.; Martinez, C.; et al. Adherence to a Mediterranean diet is associated with reduced 3-year incidence of obesity. J. Nutr. 2006, 136, 2934–2938. [Google Scholar] [PubMed]

| Parameters | Subjects n = 1013 |
|---|---|
| Age (years) | 37 (18–58) |
| Anthropometric measures | |
| Weight (kg) | 95.0 (47.0–186.0) |
| Height (m) | 1.70 (1.50–1.92) |
| BMI (kg/m2) | 33.5 (19.5–57.9) |
| Normal weight n (%) | 164 (16.2%) |
| Overweight n (%) | 202 (19.9%) |
| Obesity grade I n (%) | 195 (19.2%) |
| Obesity grade II n (%) | 203 (20.0%) |
| Obesity grade III n (%) | 249 (24.6%) |
| Adherence to the Mediterranean diet | |
| PREDIMED score | 7.1 ± 3.0 |
| Low adherence n (%) | 382 (37.7%) |
| Average adherence n (%) | 398 (39.3%) |
| High adherence n (%) | 233 (23.0%) |
| Bioelectrical variables | |
| R (Ohm, Ω) | 471.0 (250.0–781.0) |
| Xc (Ohm, Ω) | 48.0 (20.0–85.0) |
| PhA (°) | 5.8 ± 0.8 |
| PhA (°) Male | 6.1 ± 0.8 |
| PhA (°) Female | 5.6 ± 0.7 |
| BMI | Males n = 461 | Females n = 552 | p | ||||||||
|---|---|---|---|---|---|---|---|---|---|---|---|
| PREDIMED Score | PREDIMED Score | ||||||||||
| n | Mean | SD | 10th | 5th | n | Mean | SD | 10th | 5th | ||
| Normal weight | |||||||||||
| 18–28 years | 25 | 6.9 | ±3.34 | 3.00 | 2.20 | 31 | 10.0 | ±2.51 | 5.00 | 4.50 | <0.001 |
| 29–38 years | 15 | 11.0 | ±1.79 | 9.00 | 8.70 | 25 | 12.1 | ±1.94 | 11.40 | 9.40 | 0.041 |
| 39–48 years | 14 | 11.1 | ±2.09 | 8.30 | 7.30 | 31 | 10.9 | ±1.45 | 9.00 | 8.50 | 0.748 |
| 49–58 years | 12 | 8.5 | ±2.97 | 4.20 | 3.10 | 11 | 8.8 | ±2.40 | 5.00 | 4.50 | 0.779 |
| p | <0.001 | <0.001 | |||||||||
| Overweight | |||||||||||
| 18–28 years | 33 | 6.7 | ±2.82 | 4.00 | 3.00 | 27 | 8.5 | ±2.71 | 5.00 | 4.30 | 0.001 |
| 29–38 years | 30 | 8.8 | ±2.03 | 5.90 | 5.00 | 13 | 10.7 | ±1.43 | 8.40 | 8.00 | 0.012 |
| 39–48 years | 27 | 9.3 | ±2.22 | 5.60 | 5.00 | 31 | 9.2 | ±2.40 | 7.00 | 6.00 | 0.818 |
| 49–58 years | 27 | 7.7 | ±2.70 | 4.00 | 3.30 | 14 | 7.5 | ±3.37 | 4.00 | 3.65 | 0.874 |
| p | <0.001 | 0.013 | |||||||||
| Obesity grade I | |||||||||||
| 18–28 years | 32 | 6.2 | ±3.09 | 2.00 | 1.55 | 34 | 7.2 | ±1.79 | 5.00 | 5.00 | 0.008 |
| 29–38 years | 17 | 7.8 | ±2.46 | 4.20 | 3.00 | 25 | 9.6 | ±1.15 | 9.00 | 8.20 | 0.001 |
| 39–48 years | 16 | 7.6 | ±2.85 | 4.00 | 2.75 | 27 | 8.3 | ±1.54 | 6.60 | 6.00 | 0.353 |
| 49–58 years | 22 | 6.8 | ±2.34 | 3.00 | 3.00 | 22 | 6.0 | ±2.33 | 4.00 | 4.00 | 0.252 |
| p | 0.198 | <0.001 | |||||||||
| Obesity grade II | |||||||||||
| 18–28 years | 27 | 4.2 | ±2.05 | 2.00 | 1.30 | 33 | 5.6 | ±1.67 | 4.00 | 3.60 | 0.003 |
| 29–38 years | 18 | 8.4 | ±1.50 | 6.70 | 5.85 | 30 | 8.1 | ±1.88 | 5.00 | 5.00 | 0.489 |
| 39–48 years | 21 | 6.4 | ±1.80 | 5.00 | 4.00 | 30 | 7.2 | ±1.90 | 4.00 | 4.00 | 0.026 |
| 49–58 years | 21 | 5.0 | ±1.38 | 3.00 | 3.00 | 23 | 6.3 | ±2.18 | 4.00 | 4.00 | 0.011 |
| p | <0.001 | <0.001 | |||||||||
| Obesity grade III | |||||||||||
| 18–28 years | 30 | 3.0 | ±1.35 | 1.90 | 1.00 | 31 | 4.0 | ±0.91 | 3.00 | 2.50 | 0.001 |
| 29–38 years | 21 | 6.7 | ±1.80 | 5.00 | 4.00 | 52 | 6.4 | ±1.96 | 5.00 | 5.00 | 0.412 |
| 39–48 years | 33 | 4.4 | ±2.13 | 2.00 | 1.60 | 39 | 4.7 | ±0.76 | 4.00 | 4.00 | 0.641 |
| 49–58 years | 20 | 2.7 | ±1.18 | 1.00 | 1.00 | 23 | 3.6 | ±1.03 | 2.00 | 2.00 | 0.007 |
| p | <0.001 | <0.001 | |||||||||
| BMI | Males n = 461 | Females n = 552 | p | ||||||||
|---|---|---|---|---|---|---|---|---|---|---|---|
| PhA | PhA | ||||||||||
| n | Mean | SD | 10th | 5th | n | Mean | SD | 10th | 5th | ||
| Normal weight | |||||||||||
| 18–28 years | 25 | 6.08 | ±0.43 | 5.60 | 5.52 | 31 | 5.65 | ±0.21 | 5.40 | 5.25 | <0.001 |
| 29–38 years | 15 | 6.72 | ±0.39 | 6.30 | 6.27 | 25 | 6.07 | ±0.16 | 5.90 | 5.90 | <0.001 |
| 39–48 years | 14 | 6.84 | ±0.38 | 6.43 | 6.33 | 31 | 5.74 | ±0.15 | 5.60 | 5.60 | <0.001 |
| 49–58 years | 12 | 6.10 | ±0.34 | 5.60 | 5.60 | 11 | 5.52 | ±0.06 | 5.50 | 5.50 | <0.001 |
| p | <0.001 | <0.001 | |||||||||
| Overweight | |||||||||||
| 18–28 years | 33 | 6.58 | ±0.62 | 5.92 | 5.80 | 27 | 6.30 | ±0.22 | 6.00 | 6.00 | 0.001 |
| 29–38 years | 30 | 7.24 | ±0.46 | 6.79 | 6.48 | 13 | 6.86 | ±0.12 | 6.80 | 6.76 | <0.001 |
| 39–48 years | 27 | 6.86 | ±0.32 | 6.40 | 6.40 | 31 | 6.47 | ±0.25 | 6.3 | 6.2 | <0.001 |
| 49–58 years | 27 | 6.41 | ±0.45 | 5.90 | 5.90 | 14 | 5.98 | ±0.33 | 5.63 | 5.53 | <0.001 |
| p | <0.001 | <0.001 | |||||||||
| Obesity grade I | |||||||||||
| 18–28 years | 32 | 5.88 | ±0.73 | 4.90 | 4.90 | 34 | 5.55 | ±0.28 | 5.13 | 5.10 | 0.021 |
| 29–38 years | 17 | 7.08 | ±0.51 | 6.34 | 6.08 | 25 | 6.40 | ±0.37 | 6.10 | 5.94 | <0.001 |
| 39–48 years | 16 | 6.72 | ±0.47 | 6.10 | 6.00 | 27 | 5.85 | ±0.29 | 5.46 | 5.40 | <0.001 |
| 49–58 years | 22 | 5.54 | ±0.45 | 4.82 | 4.70 | 22 | 5.21 | ±0.38 | 4.81 | 4.70 | 0.012 |
| p | <0.001 | <0.001 | |||||||||
| Obesity grade II | |||||||||||
| 18–28 years | 27 | 5.39 | ±0.70 | 4.46 | 4.26 | 33 | 5.10 | ±0.35 | 4.70 | 4.66 | 0.041 |
| 29–38 years | 18 | 6.53 | ±0.30 | 6.10 | 6.08 | 30 | 6.13 | ±0.29 | 5.89 | 5.74 | <0.001 |
| 39–48 years | 21 | 5.93 | ±0.40 | 5.50 | 5.40 | 30 | 5.36 | ±0.41 | 4.90 | 4.84 | <0.001 |
| 49–58 years | 21 | 5.23 | ±0.61 | 4.40 | 4.30 | 23 | 4.55 | ±0.30 | 4.20 | 4.20 | <0.001 |
| p | <0.001 | <0.001 | |||||||||
| Obesity grade III | |||||||||||
| 18–28 years | 30 | 4.96 | ±0.40 | 4.39 | 4.30 | 31 | 4.63 | ±0.31 | 4.20 | 4.15 | <0.001 |
| 29–38 years | 21 | 6.31 | ±0.27 | 6.00 | 5.97 | 52 | 5.61 | ±0.47 | 5.10 | 5.10 | <0.001 |
| 39–48 years | 33 | 5.73 | ±0.44 | 5.22 | 5.16 | 39 | 4.99 | ±0.21 | 4.70 | 4.69 | <0.001 |
| 49–58 years | 20 | 4.8 | ±0.34 | 4.40 | 4.39 | 23 | 4.50 | ±0.29 | 4.12 | 4.01 | <0.001 |
| p | <0.001 | <0.001 | |||||||||
| PREDIMED Score | Males n = 461 | Females n = 552 | ||
|---|---|---|---|---|
| n | Mean ± SD | n | Mean ± SD | |
| Low adherence | ||||
| 1 | 13 | 4.89 ± 0.33 | 0 | - |
| 2 | 32 | 5.08 ± 0.63 | 6 | 4.10 ± 0.16 |
| 3 | 46 | 5.40 ± 0.73 | 19 | 4.68 ± 0.59 |
| 4 | 38 | 5.58 ± 0.64 | 71 | 4.85 ± 0.39 |
| 5 | 65 | 5.92 ± 0.77 | 94 | 5.24 ± 0.42 |
| Average adherence | ||||
| 6 | 35 | 6.14 ± 0.66 | 36 | 5.32 ± 0.43 |
| 7 | 31 | 6.28 ± 0.54 | 54 | 5.66 ± 0.50 |
| 8 | 43 | 6.53 ± 0.62 | 54 | 5.81 ± 0.52 |
| 9 | 67 | 6.45 ± 0.57 | 76 | 5.94 ± 0.47 |
| High adherence | ||||
| 10 | 36 | 6.61 ± 0.45 | 35 | 6.00 ± 0.45 |
| 11 | 27 | 6.92 ± 0.39 | 40 | 6.04 ± 0.62 |
| 12 | 18 | 6.96 ± 0.41 | 38 | 6.10 ± 0.44 |
| 13 | 7 | 6.97 ± 0.72 | 27 | 6.12 ± 0.41 |
| 14 | 3 | 6.99 ± 0.29 | 2 | 6.15 ± 0.21 |
| Body Weight | n | PhA | n | PhA | ||||||
|---|---|---|---|---|---|---|---|---|---|---|
| Males n = 461 | Females n = 552 | |||||||||
| Simple Correlation | After Adjuster for Age and BMI | Simple Correlation | After Adjuster for Age and BMI | |||||||
| r | p | r | p | r | p | r | p | |||
| PREDIMED score | 66 | 0.501 | <0.001 | 0.362 | 0.003 | 98 | 0.683 | <0.001 | 0.357 | <0.001 |
| Normal weight | ||||||||||
| PREDIMED score | 117 | 0.516 | <0.001 | 0.617 | <0.001 | 85 | 0.508 | 0.001 | 0.503 | <0.001 |
| Over weight | ||||||||||
| PREDIMED score | 87 | 0.439 | <0.001 | 0.428 | <0.001 | 108 | 0.743 | <0.001 | 0.736 | <0.001 |
| Obesity grade I | ||||||||||
| PREDIMED score | 87 | 0.733 | <0.001 | 0.678 | <0.001 | 116 | 0.512 | <0.001 | 0.558 | <0.001 |
| Obesity grade II | ||||||||||
| PREDIMED score | 104 | 0.680 | <0.001 | 0.455 | <0.001 | 145 | 0.862 | <0.001 | 0.751 | <0.001 |
| Obesity grade III | ||||||||||
| Step | Variable Inserted | p Value | β | t | R2 | 95% CI |
|---|---|---|---|---|---|---|
| Model 1 Males | ||||||
| 1 | PREDIMED score | <0.001 | 0.667 | 19.18 | 0.445 | 0.160–0.197 |
| 2 | PREDIMED score BMI | <0.001 | 0.476 | 11.75 | 0.445 | 0.106–0.149 |
| <0.001 | −0.324 | −7.99 | 0.514 | −0.041–−0.025 | ||
| 3 | PREDIMED score BMI Age | <0.001 | 0.486 | 12.03 | 0.444 | 0.109–0.151 |
| <0.001 | −0.315 | −7.79 | 0.511 | −0.040–−0.024 | ||
| 0.009 | −0.086 | −2.63 | 0.521 | −0.011–−0.002 | ||
| Model 2 Females | ||||||
| 1 | PREDIMED score | <0.001 | 0.688 | 22.21 | 0.473 | 0.145–0.173 |
| 2 | PREDIMED score BMI | <0.001 | 0.545 | 13.08 | 0.473 | 0.107–0.145 |
| <0.001 | −0.208 | −5.00 | 0.496 | −0.025–−0.011 | ||
| 3 | PREDIMED score BMI Age | <0.001 | 0.533 | 12.09 | 0.473 | 0.105–0.142 |
| <0.001 | −0.211 | −5.12 | 0.496 | −0.025–−0.011 | ||
| <0.001 | −0.109 | 0.508 | 0.508 | −0.010–−0.003 |
© 2017 by the authors. Licensee MDPI, Basel, Switzerland. This article is an open access article distributed under the terms and conditions of the Creative Commons Attribution (CC BY) license ( http://creativecommons.org/licenses/by/4.0/).
Share and Cite
Barrea, L.; Muscogiuri, G.; Macchia, P.E.; Di Somma, C.; Falco, A.; Savanelli, M.C.; Colao, A.; Savastano, S. Mediterranean Diet and Phase Angle in a Sample of Adult Population: Results of a Pilot Study. Nutrients 2017, 9, 151. https://doi.org/10.3390/nu9020151
Barrea L, Muscogiuri G, Macchia PE, Di Somma C, Falco A, Savanelli MC, Colao A, Savastano S. Mediterranean Diet and Phase Angle in a Sample of Adult Population: Results of a Pilot Study. Nutrients. 2017; 9(2):151. https://doi.org/10.3390/nu9020151
Chicago/Turabian StyleBarrea, Luigi, Giovanna Muscogiuri, Paolo Emidio Macchia, Carolina Di Somma, Andrea Falco, Maria Cristina Savanelli, Annamaria Colao, and Silvia Savastano. 2017. "Mediterranean Diet and Phase Angle in a Sample of Adult Population: Results of a Pilot Study" Nutrients 9, no. 2: 151. https://doi.org/10.3390/nu9020151
APA StyleBarrea, L., Muscogiuri, G., Macchia, P. E., Di Somma, C., Falco, A., Savanelli, M. C., Colao, A., & Savastano, S. (2017). Mediterranean Diet and Phase Angle in a Sample of Adult Population: Results of a Pilot Study. Nutrients, 9(2), 151. https://doi.org/10.3390/nu9020151