Explicit and Implicit Approach vs. Avoidance Tendencies towards High vs. Low Calorie Food Cues in Patients with Obesity and Active Binge Eating Disorder

Abstract
1. Introduction
2. Materials and Methods
2.1. Participants
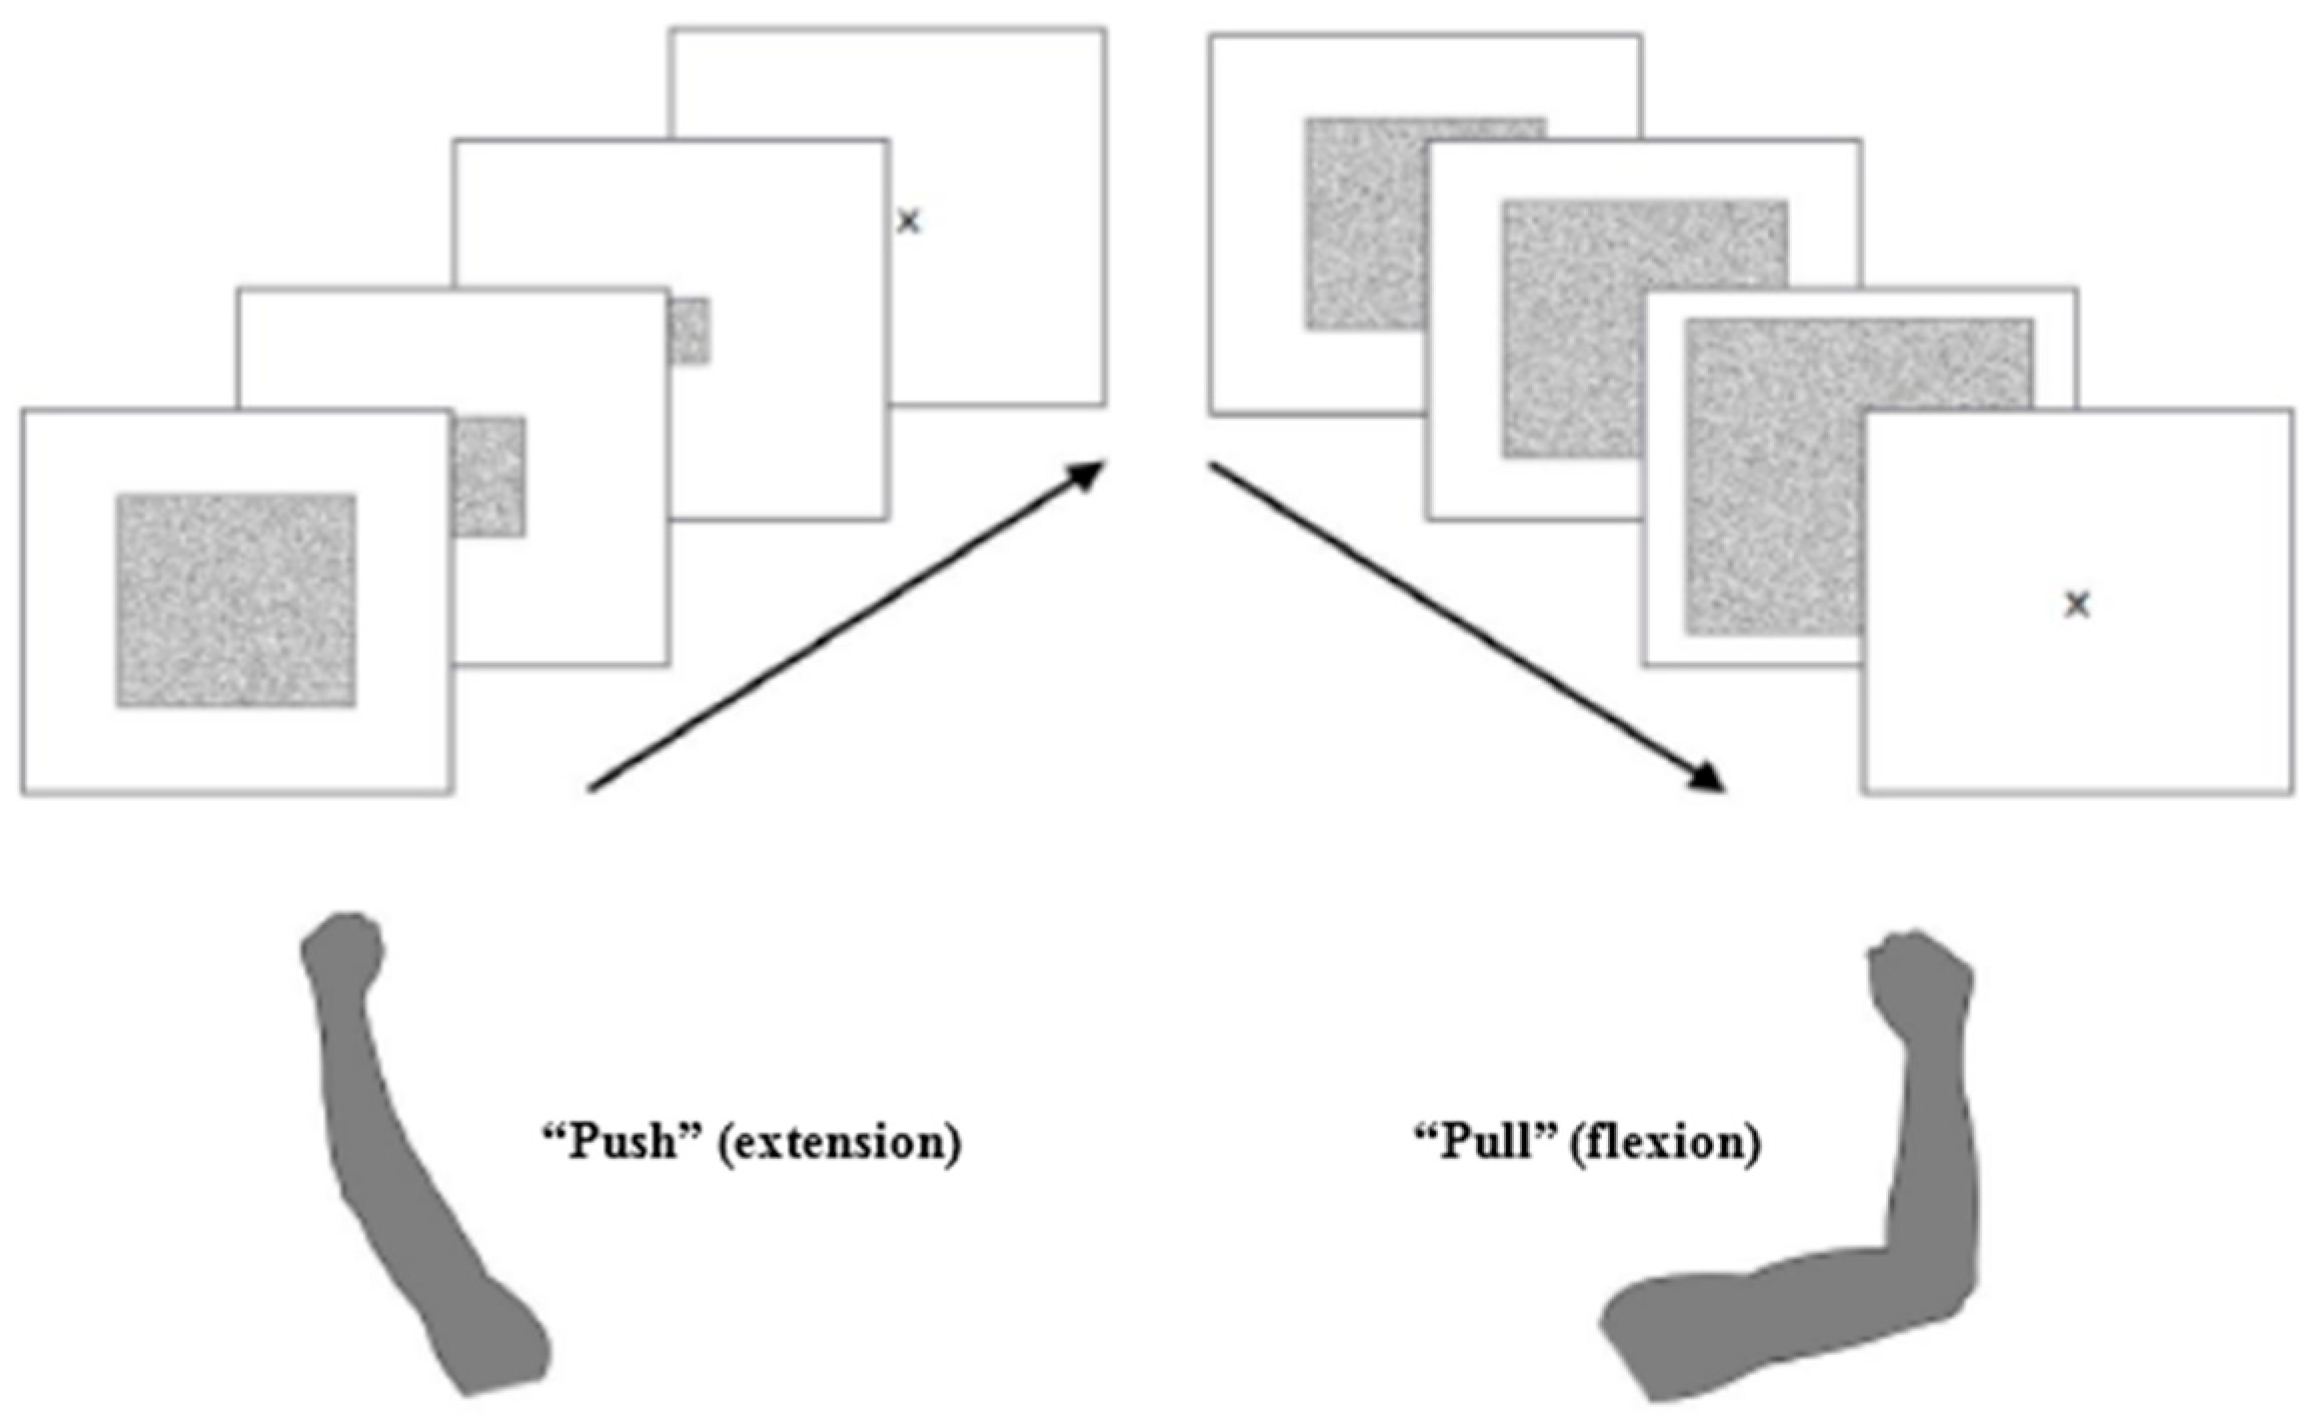
2.2. Test Procedure
2.3. Stimuli
2.4. Anthropometric and Self-Report Measures
2.5. Explicit Ratings
2.6. Data Analysis
3. Results
3.1. Explicit Ratings
3.2. Errors
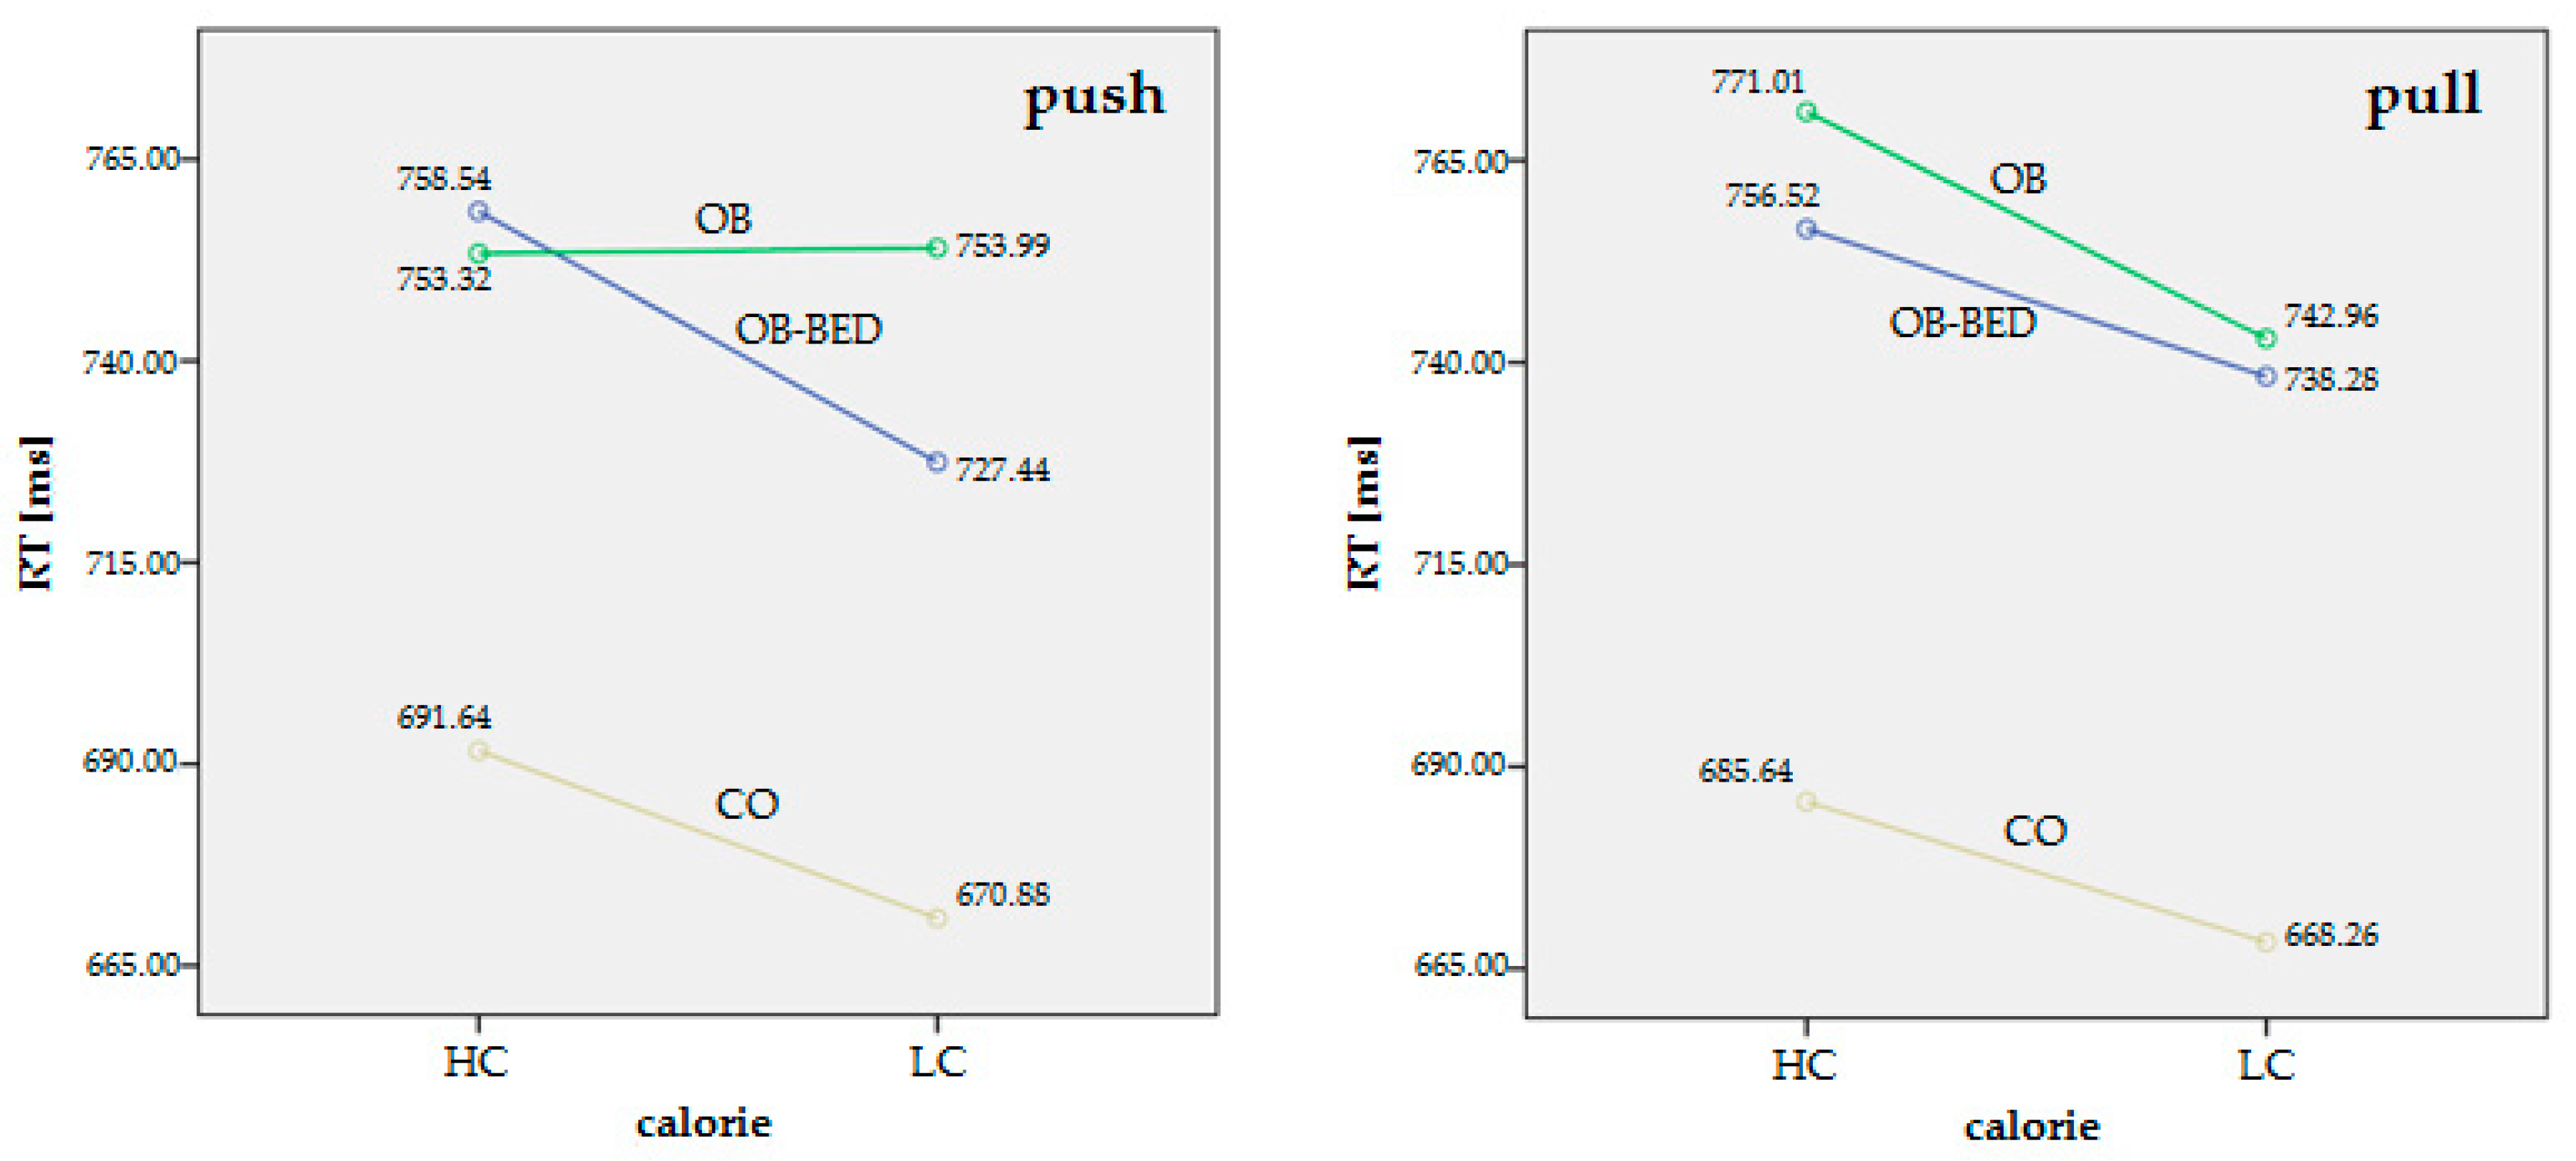
3.3. Response Time (RT)
4. Discussion
Acknowledgments
Author Contributions
Conflicts of Interest
References
- Kessler, R.C.; Berglund, P.A.; Chiu, W.T.; Deitz, A.C.; Hudson, J.I.; Shahly, V.; Aguilar-Gaxiola, S.; Alonso, J.; Angermeyer, M.C.; Benjet, C.; et al. The prevalence and correlates of binge eating disorder in the world health organization world mental health surveys. Biol. Psychiatry 2013, 73, 904–914. [Google Scholar] [CrossRef] [PubMed]
- Association, A.P. Diagnostic and Statistical Manual of Mental Disorders, 5th ed.; American Psychiatric Association Publishing: Washington, DC, USA, 2013. [Google Scholar]
- De Zwaan, M. Binge eating disorder and obesity. Int. J. Obes. Relat. Metab. Disord. 2001, 25 (Suppl. 1), S51–S55. [Google Scholar] [CrossRef] [PubMed]
- Ural, C.; Belli, H.; Akbudak, M.; Solmaz, A.; Bektas, Z.D.; Celebi, F. Relation of binge eating disorder with impulsiveness in obese individuals. World J. Psychiatry 2017, 7, 114–120. [Google Scholar] [CrossRef] [PubMed]
- Elliot, A.J.; Covington, M.V. Approach and avoidance motivation. Educ. Psychol. Rev. 2001, 13, 73–92. [Google Scholar] [CrossRef]
- Cloninger, C.R. A systematic method for clinical description and classification of personality variants. A proposal. Arch. Gen. Psychiatry 1987, 44, 573–588. [Google Scholar] [CrossRef] [PubMed]
- Elliot, A.J. Handbook of Approach and Avoidance Motivation; Psychology Press: New York, NY, USA, 2008. [Google Scholar]
- Krieglmeyer, R.; Deutsch, R.; De Houwer, J.; De Raedt, R. Being moved: Valence activates approach-avoidance behavior independently of evaluation and approach-avoidance intentions. Psychol. Sci. 2010, 21, 607–613. [Google Scholar] [CrossRef] [PubMed]
- Phaf, R.H.; Mohr, S.E.; Rotteveel, M.; Wicherts, J.M. Approach, avoidance, and affect: A meta-analysis of approach-avoidance tendencies in manual reaction time tasks. Front. Psychol. 2014, 5, 378. [Google Scholar] [CrossRef] [PubMed]
- DelParigi, A.; Chen, K.; Salbe, A.D.; Hill, J.O.; Wing, R.R.; Reiman, E.M.; Tataranni, P.A. Successful dieters have increased neural activity in cortical areas involved in the control of behavior. Int. J. Obes. 2007, 31, 440–448. [Google Scholar] [CrossRef] [PubMed]
- Passamonti, L.; Rowe, J.B.; Schwarzbauer, C.; Ewbank, M.P.; von dem Hagen, E.; Calder, A.J. Personality predicts the brain's response to viewing appetizing foods: The neural basis of a risk factor for overeating. J. Neurosci. 2009, 29, 43–51. [Google Scholar] [CrossRef] [PubMed]
- Schur, E.A.; Kleinhans, N.M.; Goldberg, J.; Buchwald, D.; Schwartz, M.W.; Maravilla, K. Activation in brain energy regulation and reward centers by food cues varies with choice of visual stimulus. Int. J. Obes. 2009, 33, 653–661. [Google Scholar] [CrossRef] [PubMed]
- Brignell, C.; Griffiths, T.; Bradley, B.P.; Mogg, K. Attentional and approach biases for pictorial food cues. Influence of external eating. Appetite 2009, 52, 299–306. [Google Scholar] [CrossRef] [PubMed]
- Hofmann, W.; Friese, M.; Wiers, R.W. Impulsive versus reflective influences on health behavior: A theoretical framework and empirical review. Health Psychol. Rev. 2008, 2, 111–137. [Google Scholar] [CrossRef]
- Hofmann, W.; Gschwendner, T.; Friese, M.; Wiers, R.W.; Schmitt, M. Working memory capacity and self-regulatory behavior: Toward an individual differences perspective on behavior determination by automatic versus controlled processes. J. Personal. Soc. Psychol. 2008, 95, 962–977. [Google Scholar] [CrossRef] [PubMed]
- Nederkoorn, C.; Houben, K.; Hofmann, W.; Roefs, A.; Jansen, A. Control yourself or just eat what you like? Weight gain over a year is predicted by an interactive effect of response inhibition and implicit preference for snack foods. Health Psychol. 2010, 29, 389–393. [Google Scholar] [CrossRef] [PubMed]
- Stice, E.; Spoor, S.; Ng, J.; Zald, D.H. Relation of obesity to consummatory and anticipatory food reward. Physiol. Behav. 2009, 97, 551–560. [Google Scholar] [CrossRef] [PubMed]
- Heatherton, T.F.; Wagner, D.D. Cognitive neuroscience of self-regulation failure. Trends Cogn. Sci. 2011, 15, 132–139. [Google Scholar] [CrossRef] [PubMed]
- Hohlstein, L.; Smith, G.; Atlas, J. An application of expectancy theory to eating disorders: Development and validation of measures of eating and dieting expectancies. Psychol. Assess. 1998, 10, 49–58. [Google Scholar] [CrossRef]
- Wilfley, D.E.; Wilson, G.T.; Agras, W.S. The clinical significance of binge eating disorder. Int. J. Eat. Disord. 2003, 34, S96–S106. [Google Scholar] [CrossRef] [PubMed]
- Balodis, I.M.; Kober, H.; Worhunsky, P.D.; White, M.A.; Stevens, M.C.; Pearlson, G.D.; Sinha, R.; Grilo, C.M.; Potenza, M.N. Monetary reward processing in obese individuals with and without binge eating disorder. Biol. Psychiatry 2013, 73, 877–886. [Google Scholar] [CrossRef] [PubMed]
- Danner, U.N.; Ouwehand, C.; van Haastert, N.L.; Hornsveld, H.; de Ridder, D.T. Decision-making impairments in women with binge eating disorder in comparison with obese and normal weight women. Eur. Eat. Disord. Rev. 2012, 20, e56–e62. [Google Scholar] [CrossRef] [PubMed]
- Geliebter, A.; Ladell, T.; Logan, M.; Schneider, T.; Sharafi, M.; Hirsch, J. Responsivity to food stimuli in obese and lean binge eaters using functional mri. Appetite 2006, 46, 31–35. [Google Scholar] [CrossRef] [PubMed]
- Mobbs, O.; Iglesias, K.; Golay, A.; Van der Linden, M. Cognitive deficits in obese persons with and without binge eating disorder. Investigation using a mental flexibility task. Appetite 2011, 57, 263–271. [Google Scholar] [CrossRef] [PubMed]
- Svaldi, J.; Tuschen-Caffier, B.; Peyk, P.; Blechert, J. Information processing of food pictures in binge eating disorder. Appetite 2010, 55, 685–694. [Google Scholar] [CrossRef] [PubMed]
- Bargh, J.A. The four horsemen of automaticity: Awareness, intention, efficiency, and control in social cognition. In Handbook of Social Cognition; Wyer, R., Srull, T., Eds.; Lawrence Erlbaum: Hillsdale, NJ, USA, 1994. [Google Scholar]
- Fazio, R.H.; Olson, M.A. Implicit measures in social cognition. Research: Their meaning and use. Annu. Rev. Psychol. 2003, 54, 297–327. [Google Scholar] [CrossRef] [PubMed]
- Rinck, M.; Becker, E.S. Approach and avoidance in fear of spiders. J. Behav. Ther. Exp. Psychiatry 2007, 38, 105–120. [Google Scholar] [CrossRef] [PubMed]
- De Houwer, J. What are implicit measures and why are we using them. In Handbook of Implicit Cognition and Addiction; SAGE Publications, Inc.: Thousand Oaks, CA, USA, 2006; pp. 11–28. [Google Scholar]
- Wiers, R.W.; Eberl, C.; Rinck, M.; Becker, E.S.; Lindenmeyer, J. Retraining automatic action tendencies changes alcoholic patients' approach bias for alcohol and improves treatment outcome. Psychol. Sci. 2011, 22, 490–497. [Google Scholar] [CrossRef] [PubMed]
- Wiers, R.W.; Rinck, M.; Kordts, R.; Houben, K.; Strack, F. Retraining automatic action-tendencies to approach alcohol in hazardous drinkers. Addiction 2010, 105, 279–287. [Google Scholar] [CrossRef] [PubMed]
- Wiers, R.W.; Gladwin, T.E.; Rinck, M. Should we train alcohol-dependent patients to avoid alcohol? Front. Psychiatry 2013, 4, 33. [Google Scholar] [CrossRef] [PubMed]
- Paslakis, G.; Kuhn, S.; Schaubschlager, A.; Schieber, K.; Roder, K.; Rauh, E.; Erim, Y. Explicit and implicit approach vs. Avoidance tendencies towards high vs. Low calorie food cues in patients with anorexia nervosa and healthy controls. Appetite 2016, 107, 171–179. [Google Scholar] [CrossRef] [PubMed]
- Brockmeyer, T.; Hahn, C.; Reetz, C.; Schmidt, U.; Friederich, H.C. Approach bias and cue reactivity towards food in people with high versus low levels of food craving. Appetite 2015, 95, 197–202. [Google Scholar] [CrossRef] [PubMed]
- Leehr, E.J.; Schag, K.; Brinkmann, A.; Ehlis, A.C.; Fallgatter, A.J.; Zipfel, S.; Giel, K.E.; Dresler, T. Alleged approach-avoidance conflict for food stimuli in binge eating disorder. PLoS ONE 2016, 11, e0152271. [Google Scholar] [CrossRef] [PubMed]
- Blechert, J.; Meule, A.; Busch, N.A.; Ohla, K. Food-pics: An image database for experimental research on eating and appetite. Front. Psychol. 2014, 5, 617. [Google Scholar] [CrossRef] [PubMed]
- Fairburn, C.G.; Beglin, S.J. Assessment of eating disorders: Interview or self-report questionnaire? Int. J. Eat. Disord. 1994, 16, 363–370. [Google Scholar] [PubMed]
- Hilbert, A.; Tuschen-Caffier, B.; Karwautz, A.; Niederhofer, H.; Munsch, S. Eating disorder examination-questionnaire. Diagnostica 2007, 53, 144–154. [Google Scholar] [CrossRef]
- Paul, T.; Thiel, A. Eating Disorder Inventory-2 (edi-2): German Version; Hogrefe: Goettingen, Germany, 2005. [Google Scholar]
- Cousijn, J.; Goudriaan, A.E.; Wiers, R.W. Reaching out towards cannabis: Approach-bias in heavy cannabis users predicts changes in cannabis use. Addiction 2011, 106, 1667–1674. [Google Scholar] [CrossRef] [PubMed]
- Wiers, R.W.; Rinck, M.; Dictus, M.; van den Wildenberg, E. Relatively strong automatic appetitive action-tendencies in male carriers of the oprm1 g-allele. Genes Brain Behav. 2009, 8, 101–106. [Google Scholar] [CrossRef] [PubMed]
- Brooks, S.; Prince, A.; Stahl, D.; Campbell, I.C.; Treasure, J. A systematic review and meta-analysis of cognitive bias to food stimuli in people with disordered eating behaviour. Clin. Psychol. Rev. 2011, 31, 37–51. [Google Scholar] [CrossRef] [PubMed]
- Garcia-Garcia, I.; Narberhaus, A.; Marques-Iturria, I.; Garolera, M.; Radoi, A.; Segura, B.; Pueyo, R.; Ariza, M.; Jurado, M.A. Neural responses to visual food cues: Insights from functional magnetic resonance imaging. Eur. Eat. Disord. Rev. 2013, 21, 89–98. [Google Scholar] [CrossRef] [PubMed]
- Giel, K.E.; Teufel, M.; Friederich, H.C.; Hautzinger, M.; Enck, P.; Zipfel, S. Processing of pictorial food stimuli in patients with eating disorders—A systematic review. Int. J. Eat. Disord. 2011, 44, 105–117. [Google Scholar] [CrossRef] [PubMed]
- Karhunen, L.J.; Vanninen, E.J.; Kuikka, J.T.; Lappalainen, R.I.; Tiihonen, J.; Uusitupa, M.I. Regional cerebral blood flow during exposure to food in obese binge eating women. Psychiatry Res. 2000, 99, 29–42. [Google Scholar] [CrossRef]
- Schag, K.; Teufel, M.; Junne, F.; Preissl, H.; Hautzinger, M.; Zipfel, S.; Giel, K.E. Impulsivity in binge eating disorder: Food cues elicit increased reward responses and disinhibition. PLoS ONE 2013, 8, e76542. [Google Scholar] [CrossRef] [PubMed]
- Schienle, A.; Schafer, A.; Hermann, A.; Vaitl, D. Binge-eating disorder: Reward sensitivity and brain activation to images of food. Biol. Psychiatry 2009, 65, 654–661. [Google Scholar] [CrossRef] [PubMed]
- Svaldi, J.; Naumann, E.; Trentowska, M.; Schmitz, F. General and food-specific inhibitory deficits in binge eating disorder. Int. J. Eat. Disord. 2014, 47, 534–542. [Google Scholar] [CrossRef] [PubMed]
- Weygandt, M.; Schaefer, A.; Schienle, A.; Haynes, J.D. Diagnosing different binge-eating disorders based on reward-related brain activation patterns. Hum. Brain Mapp. 2012, 33, 2135–2146. [Google Scholar] [CrossRef] [PubMed]
- Friese, M.; Hofmann, W.; Wanke, M. When impulses take over: Moderated predictive validity of explicit and implicit attitude measures in predicting food choice and consumption behaviour. Br. J. Soc. Psychol. 2008, 47, 397–419. [Google Scholar] [CrossRef] [PubMed]
- Roefs, A.; Huijding, J.; Smulders, F.T.; MacLeod, C.M.; de Jong, P.J.; Wiers, R.W.; Jansen, A.T. Implicit measures of association in psychopathology research. Psychol. Bull. 2011, 137, 149–193. [Google Scholar] [CrossRef] [PubMed]
- Werthmann, J.; Jansen, A.; Roefs, A. Worry or craving? A selective review of evidence for food-related attention biases in obese individuals, eating-disorder patients, restrained eaters and healthy samples. Proc. Nutr. Soc. 2015, 74, 99–114. [Google Scholar] [CrossRef] [PubMed]
- Castellanos, E.H.; Charboneau, E.; Dietrich, M.S.; Park, S.; Bradley, B.P.; Mogg, K.; Cowan, R.L. Obese adults have visual attention bias for food cue images: Evidence for altered reward system function. Int. J. Obes. 2009, 33, 1063–1073. [Google Scholar] [CrossRef] [PubMed]
- Jansen, A.; Houben, K.; Roefs, A. A cognitive profile of obesity and its translation into new interventions. Front. Psychol. 2015, 6, 1807. [Google Scholar] [CrossRef] [PubMed]
- Nijs, I.M.; Franken, I.H. Attentional processing of food cues in overweight and obese individuals. Curr. Obes. Rep. 2012, 1, 106–113. [Google Scholar] [CrossRef] [PubMed]
- Nijs, I.M.; Muris, P.; Euser, A.S.; Franken, I.H. Differences in attention to food and food intake between overweight/obese and normal-weight females under conditions of hunger and satiety. Appetite 2010, 54, 243–254. [Google Scholar] [CrossRef] [PubMed]
- Werthmann, J.; Roefs, A.; Nederkoorn, C.; Mogg, K.; Bradley, B.P.; Jansen, A. Can(not) take my eyes off it: Attention bias for food in overweight participants. Health Psychol. 2011, 30, 561–569. [Google Scholar] [CrossRef] [PubMed]
- Popien, A.; Frayn, M.; von Ranson, K.M.; Sears, C.R. Eye gaze tracking reveals heightened attention to food in adults with binge eating when viewing images of real-world scenes. Appetite 2015, 91, 233–240. [Google Scholar] [CrossRef] [PubMed]
- Schmidt, R.; Luthold, P.; Kittel, R.; Tetzlaff, A.; Hilbert, A. Visual attentional bias for food in adolescents with binge-eating disorder. J. Psychiatr. Res. 2016, 80, 22–29. [Google Scholar] [CrossRef] [PubMed]
- Schmitz, F.; Naumann, E.; Trentowska, M.; Svaldi, J. Attentional bias for food cues in binge eating disorder. Appetite 2014, 80, 70–80. [Google Scholar] [CrossRef] [PubMed]
- Frank, S.; Laharnar, N.; Kullmann, S.; Veit, R.; Canova, C.; Hegner, Y.L.; Fritsche, A.; Preissl, H. Processing of food pictures: Influence of hunger, gender and calorie content. Brain Res. 2010, 1350, 159–166. [Google Scholar] [CrossRef] [PubMed]
- Killgore, W.D.; Young, A.D.; Femia, L.A.; Bogorodzki, P.; Rogowska, J.; Yurgelun-Todd, D.A. Cortical and limbic activation during viewing of high- versus low-calorie foods. NeuroImage 2003, 19, 1381–1394. [Google Scholar] [CrossRef]
- Siep, N.; Roefs, A.; Roebroeck, A.; Havermans, R.; Bonte, M.L.; Jansen, A. Hunger is the best spice: An fmri study of the effects of attention, hunger and calorie content on food reward processing in the amygdala and orbitofrontal cortex. Behav. Brain Res. 2009, 198, 149–158. [Google Scholar] [CrossRef] [PubMed]
- Loeber, S.; Grosshans, M.; Korucuoglu, O.; Vollmert, C.; Vollstadt-Klein, S.; Schneider, S.; Wiers, R.W.; Mann, K.; Kiefer, F. Impairment of inhibitory control in response to food-associated cues and attentional bias of obese participants and normal-weight controls. Int. J. Obes. 2012, 36, 1334–1339. [Google Scholar] [CrossRef] [PubMed]
- Deluchi, M.; Costa, F.S.; Friedman, R.; Goncalves, R.; Bizarro, L. Attentional bias to unhealthy food in individuals with severe obesity and binge eating. Appetite 2017, 108, 471–476. [Google Scholar] [CrossRef] [PubMed]
- Shafran, R.; Lee, M.; Cooper, Z.; Palmer, R.L.; Fairburn, C.G. Effect of psychological treatment on attentional bias in eating disorders. Int. J. Eat. Disord. 2008, 41, 348–354. [Google Scholar] [CrossRef] [PubMed]
- Giel, K.E.; Rieber, N.; Enck, P.; Friederich, H.C.; Meile, T.; Zipfel, S.; Teufel, M. Effects of laparoscopic sleeve gastrectomy on attentional processing of food-related information: Evidence from eye-tracking. Surg. Obes. Relat. Dis. 2014, 10, 277–282. [Google Scholar] [CrossRef] [PubMed]
- Marteau, T.M.; Hollands, G.J.; Fletcher, P.C. Changing human behavior to prevent disease: The importance of targeting automatic processes. Science 2012, 337, 1492–1495. [Google Scholar] [CrossRef] [PubMed]
- Beck, A.T.; Haigh, E.A. Advances in cognitive theory and therapy: The generic cognitive model. Annu. Rev. Clin. Psychol. 2014, 10, 1–24. [Google Scholar] [CrossRef] [PubMed]
- Wiers, R.W.; Stacy, A.W. Implicit cognition and addiction. Curr. Dir. Psychol. Sci. 2006, 15, 292–296. [Google Scholar] [CrossRef]
- Neimeijer, R.A.; de Jong, P.J.; Roefs, A. Automatic approach/avoidance tendencies towards food and the course of anorexia nervosa. Appetite 2015, 91, 28–34. [Google Scholar] [CrossRef] [PubMed]
- Dickson, H.; Kavanagh, D.J.; MacLeod, C. The pulling power of chocolate: Effects of approach-avoidance training on approach bias and consumption. Appetite 2016, 99, 46–51. [Google Scholar] [CrossRef] [PubMed]
- Schumacher, S.E.; Kemps, E.; Tiggemann, M. Bias modification training can alter approach bias and chocolate consumption. Appetite 2016, 96, 219–224. [Google Scholar] [CrossRef] [PubMed]
- Kakoschke, N.; Kemps, E.; Tiggemann, M. Approach bias modification training and consumption: A review of the literature. Addic. Behav. 2017, 64, 21–28. [Google Scholar] [CrossRef] [PubMed]


Recurrent episodes of binge eating. An episode of binge eating is characterized by both of the following:
|
The binge-eating episodes are associated with three (or more) of the following:
|
| Marked distress regarding binge eating is present |
| The binge eating occurs, on average, at least once a week for three months |
| The binge eating is not associated with the recurrent use of inappropriate compensatory behavior (e.g., purging) and does not occur exclusively during the course anorexia nervosa, bulimia nervosa, or avoidant/restrictive food intake disorder |
| OB-BED | OB | CO | F (p) | Post Hoc | |
|---|---|---|---|---|---|
| EDE-Q | 3.67 ± 1.23 | 3.56 ± 1.57 | 0.59 ± 0.55 | F2,78 = 52.02 (p < 0.001) ** | OB-BED > CO and OB > CO, p < 0.001 ** |
| EDE-Q shape concern | 4.46 ± 1.13 | 4.18 ± 1.58 | 0.91 ± 0.77 | F2,78 = 64.66 (p < 0.001) ** | OB-BED > CO and OB > CO, p < 0.001 ** |
| EDE-Q weight concern | 3.87 ± 1.18 | 3.76 ± 1.50 | 0.65 ± 0.76 | F2,78 = 58.39 (p < 0.001) ** | OB-BED > CO and OB > CO, p < 0.001 ** |
| EDE-Q eating concern | 2.61 ± 1.70 | 2.37 ± 1.85 | 0.22 ± 0.35 | F2,78 = 19.69 (p < 0.001) ** | OB-BED > CO and OB > CO, p < 0.001 ** |
| EDI-2 | 315.04 ± 69.75 | 309.66 ± 63.82 | 180.68 ± 29.65 | F2,78 = 44.87 (p < 0.001) ** | OB-BED > CO and OB > CO, p < 0.001 ** |
| OB-BED | OB | CO | F (p) | Post Hoc | |
|---|---|---|---|---|---|
| rating urge HC | 55.61 ± 19.10 | 55.08 ± 13.32 | 58.74 ± 14.90 | F2,76 = 0.42 (p = 0.66) | -- |
| rating regret HC | 71.61 ± 20.18 | 72.85 ± 15.80 | 49.21 ± 17.45 | F2,76 = 14.64 (p < 0.001) ** | OB-BED > CO and OB > CO, p ≤ 0.001 ** |
| rating healthiness HC | 11.28 ± 6.42 | 10.21 ± 4.46 | 16.55 ± 5.93 | F2,76 = 9.82 (p < 0.001) ** | OB-BED < CO and OB < CO, p ≤ 0.01 * |
| rating urge LC | 68.60 ± 18.69 | 79.82 ± 10.18 | 76.63 ± 9.30 | F2,76 = 5.03 (p = 0.01) * | OB-BED < OB, p = 0.04 * |
| rating regret LC | 10.76 ± 11.77 | 5.87 ± 6.07 | 12.59 ± 12.64 | F2,76 = 3.25 (p = 0.04) * | OB < CO, p = 0.05 * |
| rating healthiness LC | 91.67 ± 8.20 | 95.42 ± 4.03 | 90.88 ± 4.70 | F2,76 = 5.07 (p = 0.01) * | OB > CO, p = 0.001 ** |
| OB-BED n = 24 | OB n = 32 | CO n = 25 | F (p) | Post Hoc | |
|---|---|---|---|---|---|
| Errors push/HC: (% total trials) | 11.58 ± 7.90 (14.06) | 9.38 ± 6.68 (11.80) | 5.88 ± 4.06 (7.35) | F2.78 = 4.95 (p = 0.01) * | OB-BED > CO and OB > CO, p ≤ 0.05 * |
| Errors pull/HC: (% total trials) | 11.88 ± 8.51 (14.84) | 8.91 ± 6.37 (11.13) | 6.44 ± 4.07 (8.15) | F2.78 = 4.25 (p = 0.02) * | OB-BED > CO, p = 0.02 * |
| Errors push/LC: (% total trials) | 10.96 ± 7.63 (13.70) | 9.31 ± 6.77 (11.64) | 6.20 ± 3.46 (7.75) | F2.78 = 3.70 (p = 0.03) * | OB-BED > CO, p = 0.02 * |
| Errors pull/LC: (% total trials) | 11.96 ± 6.99 (14.95) | 8.94 ± 6.30 (11.17) | 6.52 ± 3.57 (8.15) | F2.78 = 5.33 (p = 0.01) * | OB-BED > CO, p = 0.01 * |
| OB-BED n = 24 | OB n = 32 | CO n = 25 | F (p) | Post Hoc | |
|---|---|---|---|---|---|
| RT push/HC: median ± SD (range) | 751.40 ± 129.02 (550.00–1051.00) | 751.78 ± 130.58 (508.00–1067.00) | 691.64 ± 118.09 (517.00–905.00) | F2.78 = 1.95 (p = 0.15) | -- |
| RT pull/HC: median ± SD (range) | 756.06 ± 143.51 (502.50–1058.50) | 767.77 ± 121.17 (565.50–1070.00) | 685.64 ± 107.24 (521.00–862.00) | F2.78 = 3.39 (p = 0.04) * | OB > CO, p = 0.02 * |
| RT push/LC: median ± SD (range) | 720.42 ± 127.54 (503.00–1038.00) | 750.75 ± 126.79 (537.00–991.00) | 670.88 ± 108.28 (518.00–838.00) | F2.78 = 3.04 (p = 0.05) * | OB > CO, p = 0.04 * |
| RT pull/LC: median ± SD (range) | 744.08 ± 151.44 (489.50–1067.00) | 741.84 ± 119.91 (542.50–1021.00) | 668.26 ± 101.74 (503.00–847.50) | F2.78 = 3.07 (p = 0.05) * | OB > CO, p = 0.04 * |
© 2017 by the authors. Licensee MDPI, Basel, Switzerland. This article is an open access article distributed under the terms and conditions of the Creative Commons Attribution (CC BY) license (http://creativecommons.org/licenses/by/4.0/).
Share and Cite
Paslakis, G.; Kühn, S.; Grunert, S.; Erim, Y. Explicit and Implicit Approach vs. Avoidance Tendencies towards High vs. Low Calorie Food Cues in Patients with Obesity and Active Binge Eating Disorder. Nutrients 2017, 9, 1068. https://doi.org/10.3390/nu9101068
Paslakis G, Kühn S, Grunert S, Erim Y. Explicit and Implicit Approach vs. Avoidance Tendencies towards High vs. Low Calorie Food Cues in Patients with Obesity and Active Binge Eating Disorder. Nutrients. 2017; 9(10):1068. https://doi.org/10.3390/nu9101068
Chicago/Turabian StylePaslakis, Georgios, Simone Kühn, Sebastian Grunert, and Yesim Erim. 2017. "Explicit and Implicit Approach vs. Avoidance Tendencies towards High vs. Low Calorie Food Cues in Patients with Obesity and Active Binge Eating Disorder" Nutrients 9, no. 10: 1068. https://doi.org/10.3390/nu9101068
APA StylePaslakis, G., Kühn, S., Grunert, S., & Erim, Y. (2017). Explicit and Implicit Approach vs. Avoidance Tendencies towards High vs. Low Calorie Food Cues in Patients with Obesity and Active Binge Eating Disorder. Nutrients, 9(10), 1068. https://doi.org/10.3390/nu9101068