Role of Young Child Formulae and Supplements to Ensure Nutritional Adequacy in U.K. Young Children


 , ,
, ,
Abstract
:1. Introduction
2. Materials and Methods
2.1. Dietary Survey and Study Sample
2.2. Food Database
2.3. Diet Quality Indicators
2.4. Individual Diet Modeling with Linear Programming
2.5. Statistical Analysis
2.5.1. Comparison of Characteristics and Observed Diets in the 4 Groups of Children
2.5.2. Diets Modeled with “Repertoire-Only Foods”
2.5.3. Diets Modeled with “All-Foods”
3. Results
3.1. Description of the Sample
3.2. Nutrients in Observed Diets
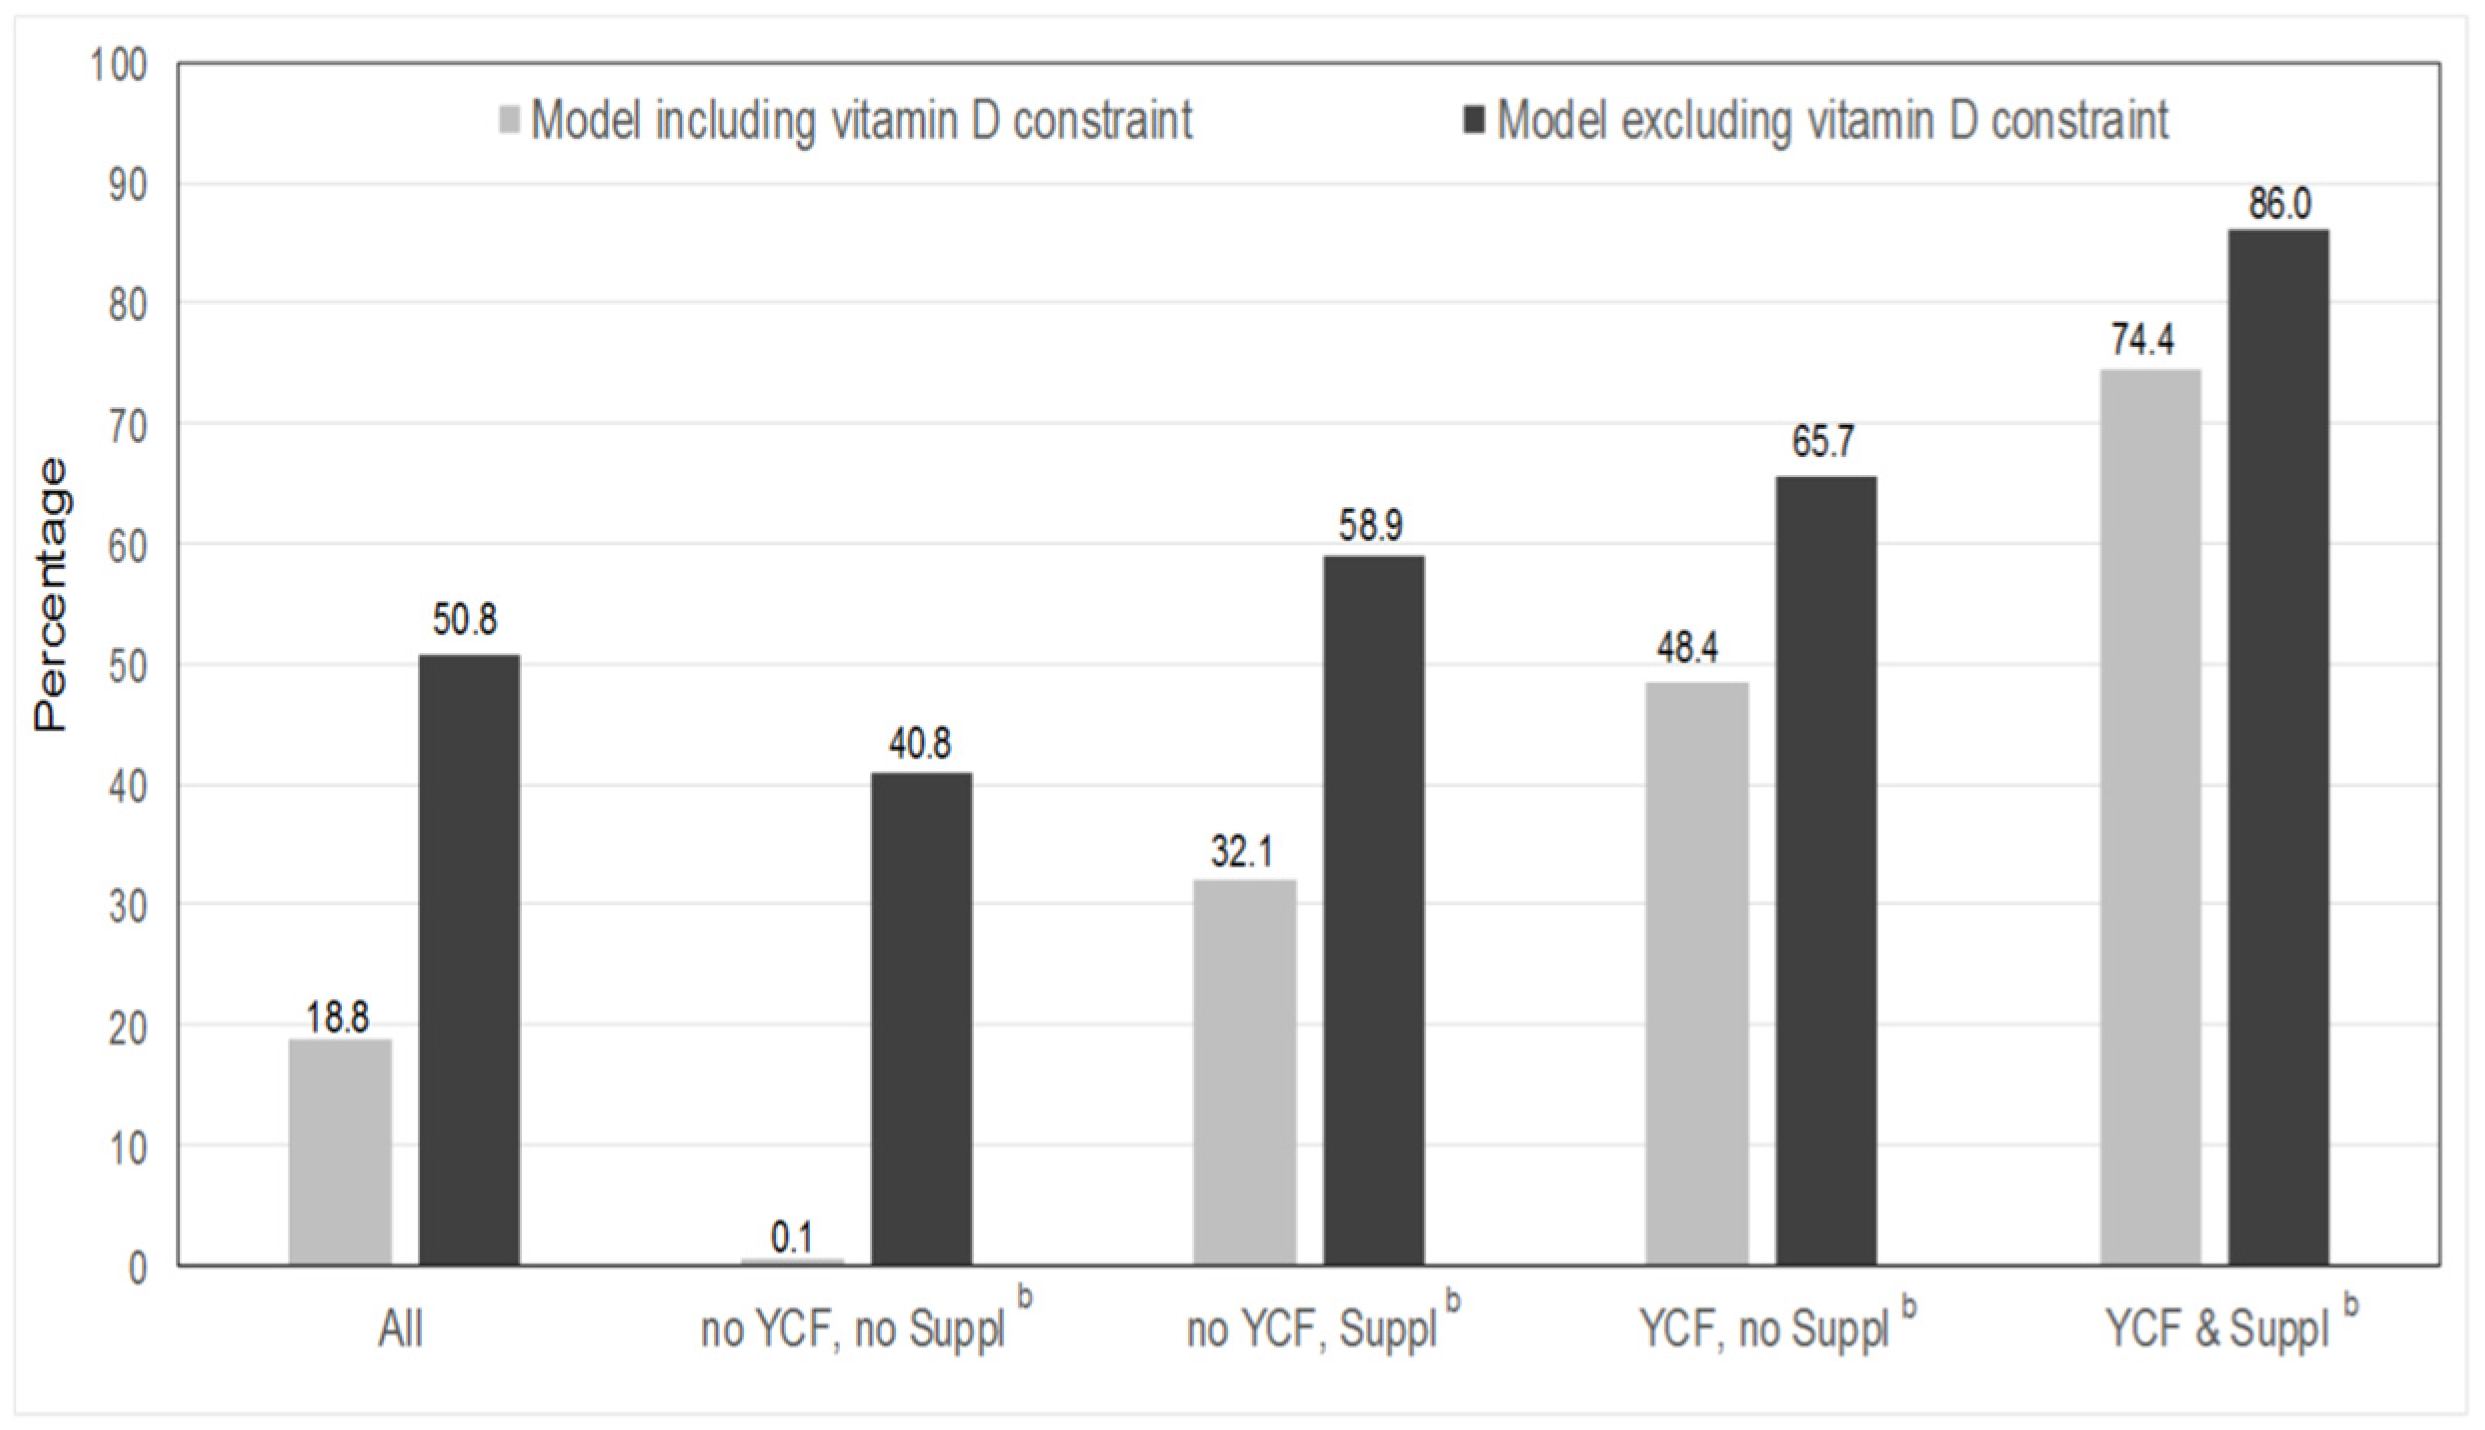
3.3. Feasibility of Repertoire-Only Models
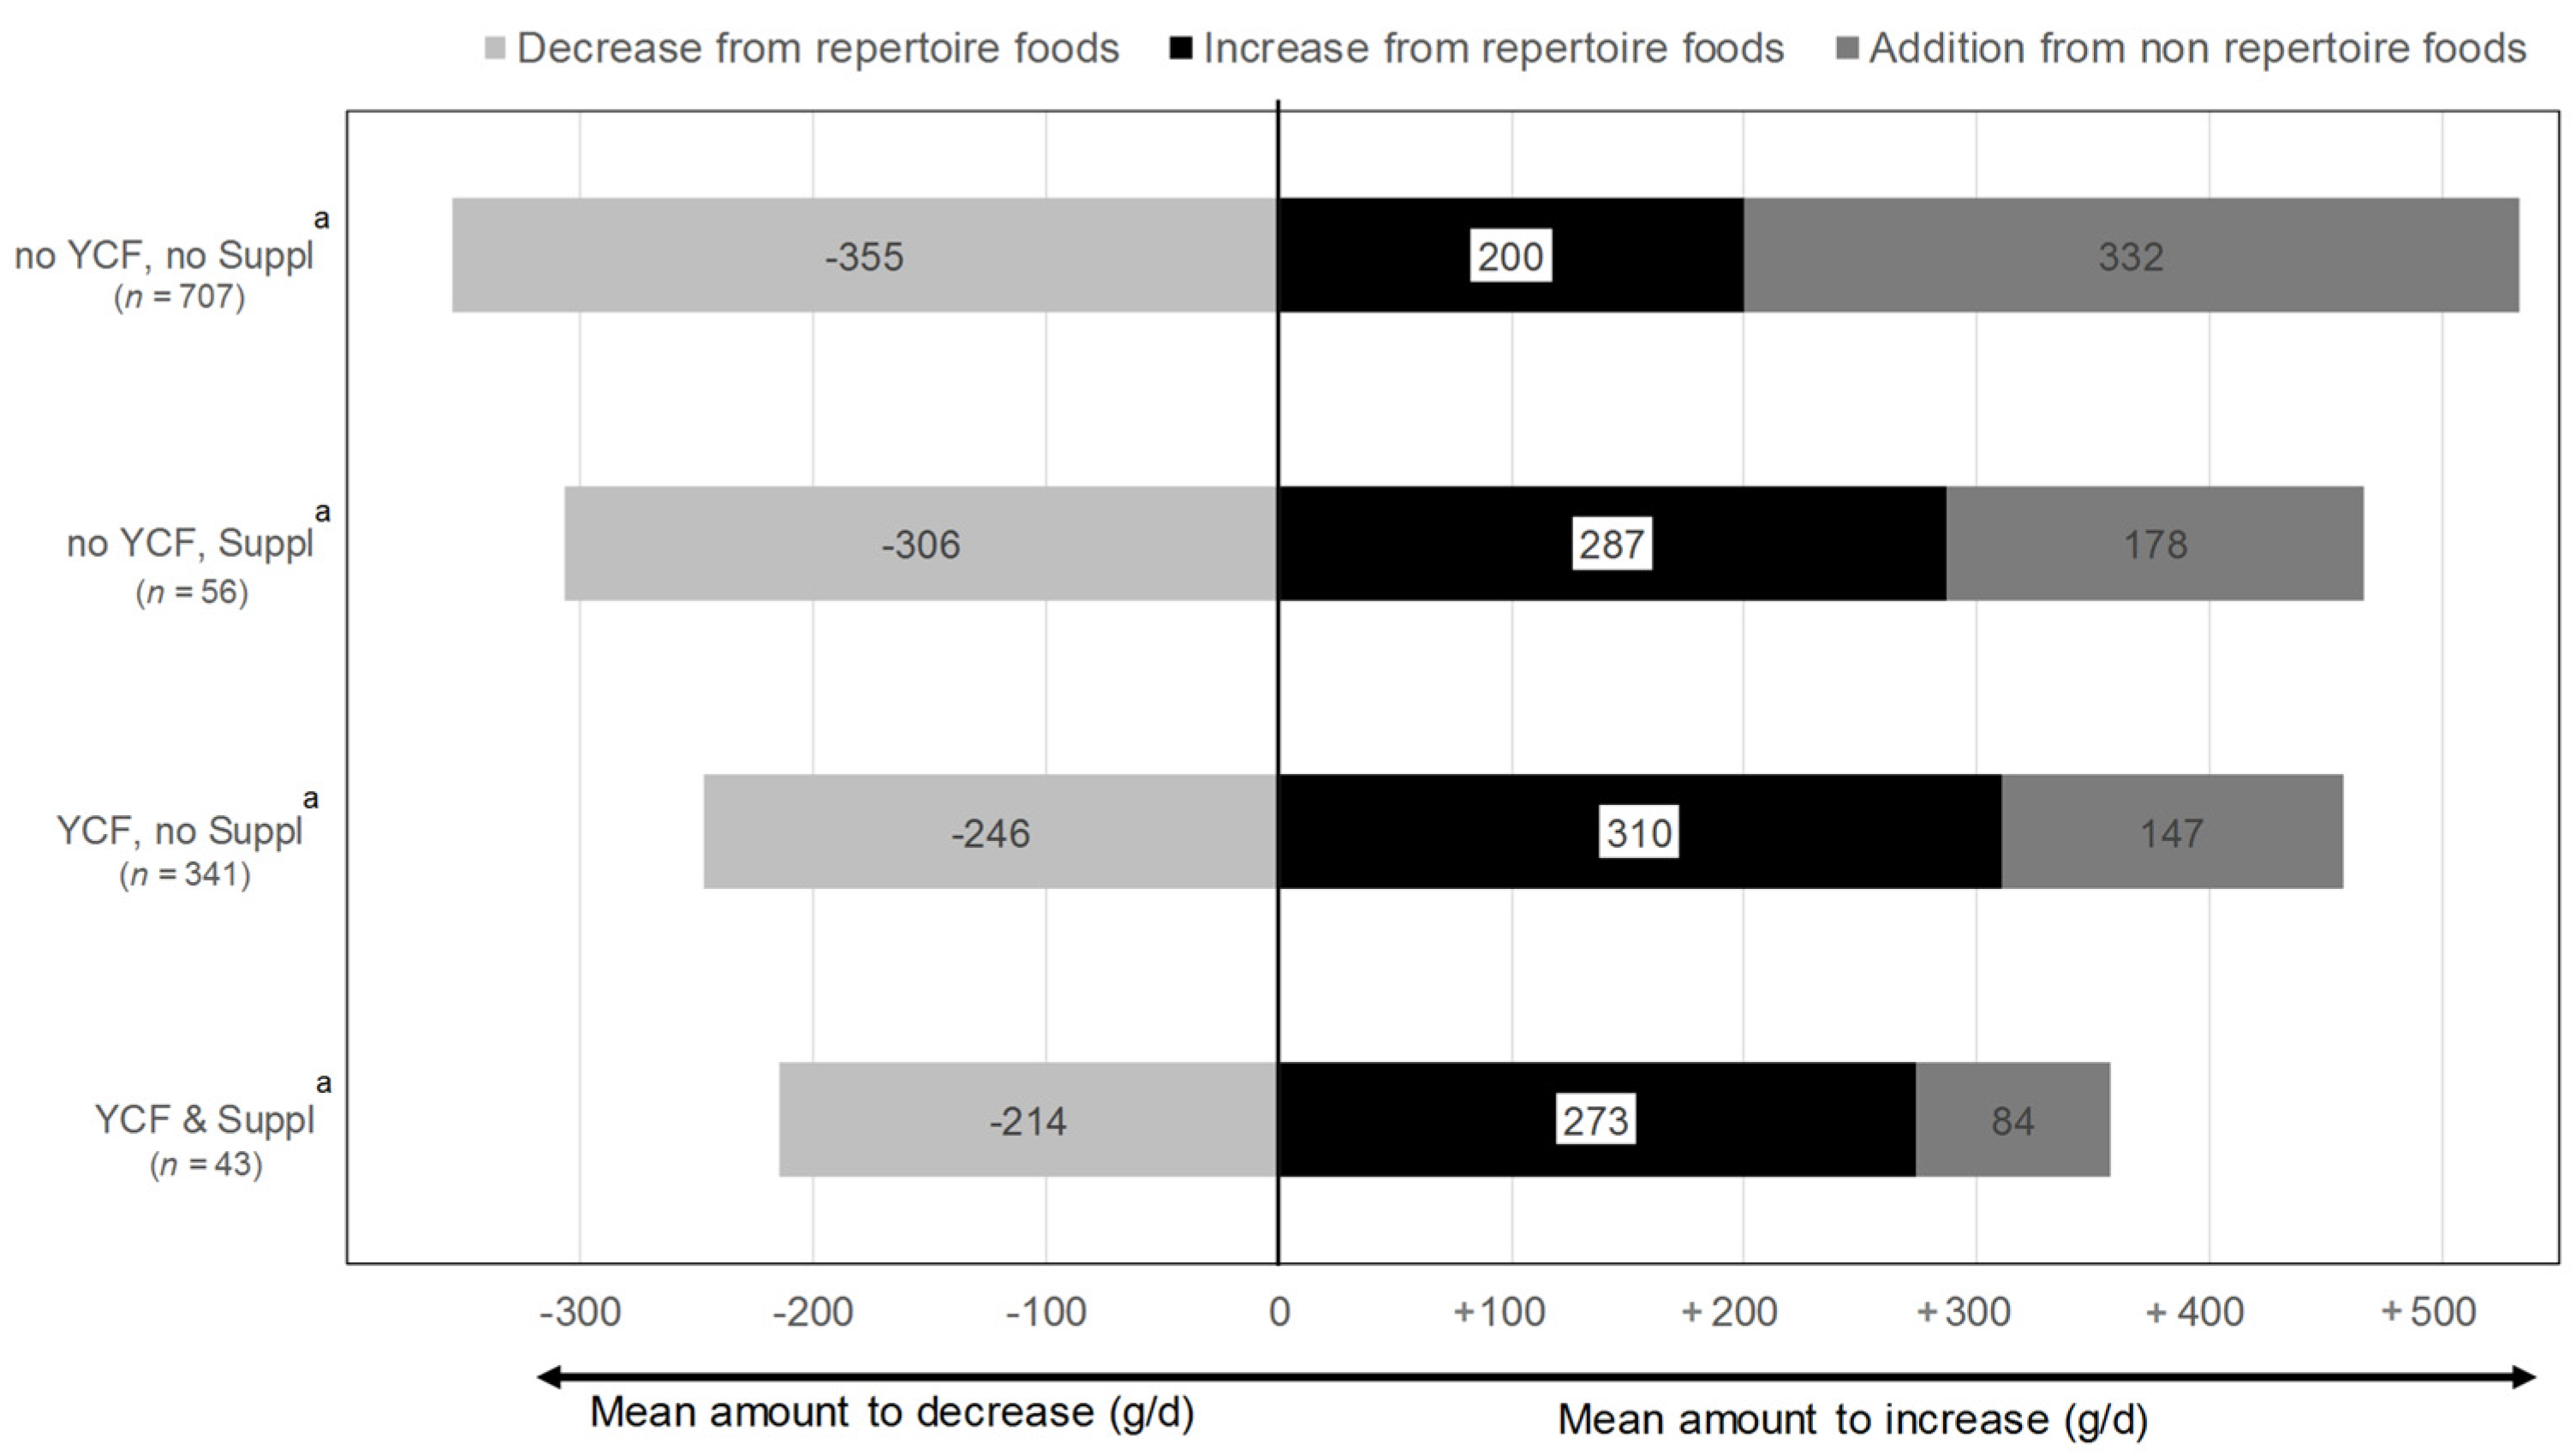
3.4. Dietary Changes Induced by the All-Foods Models
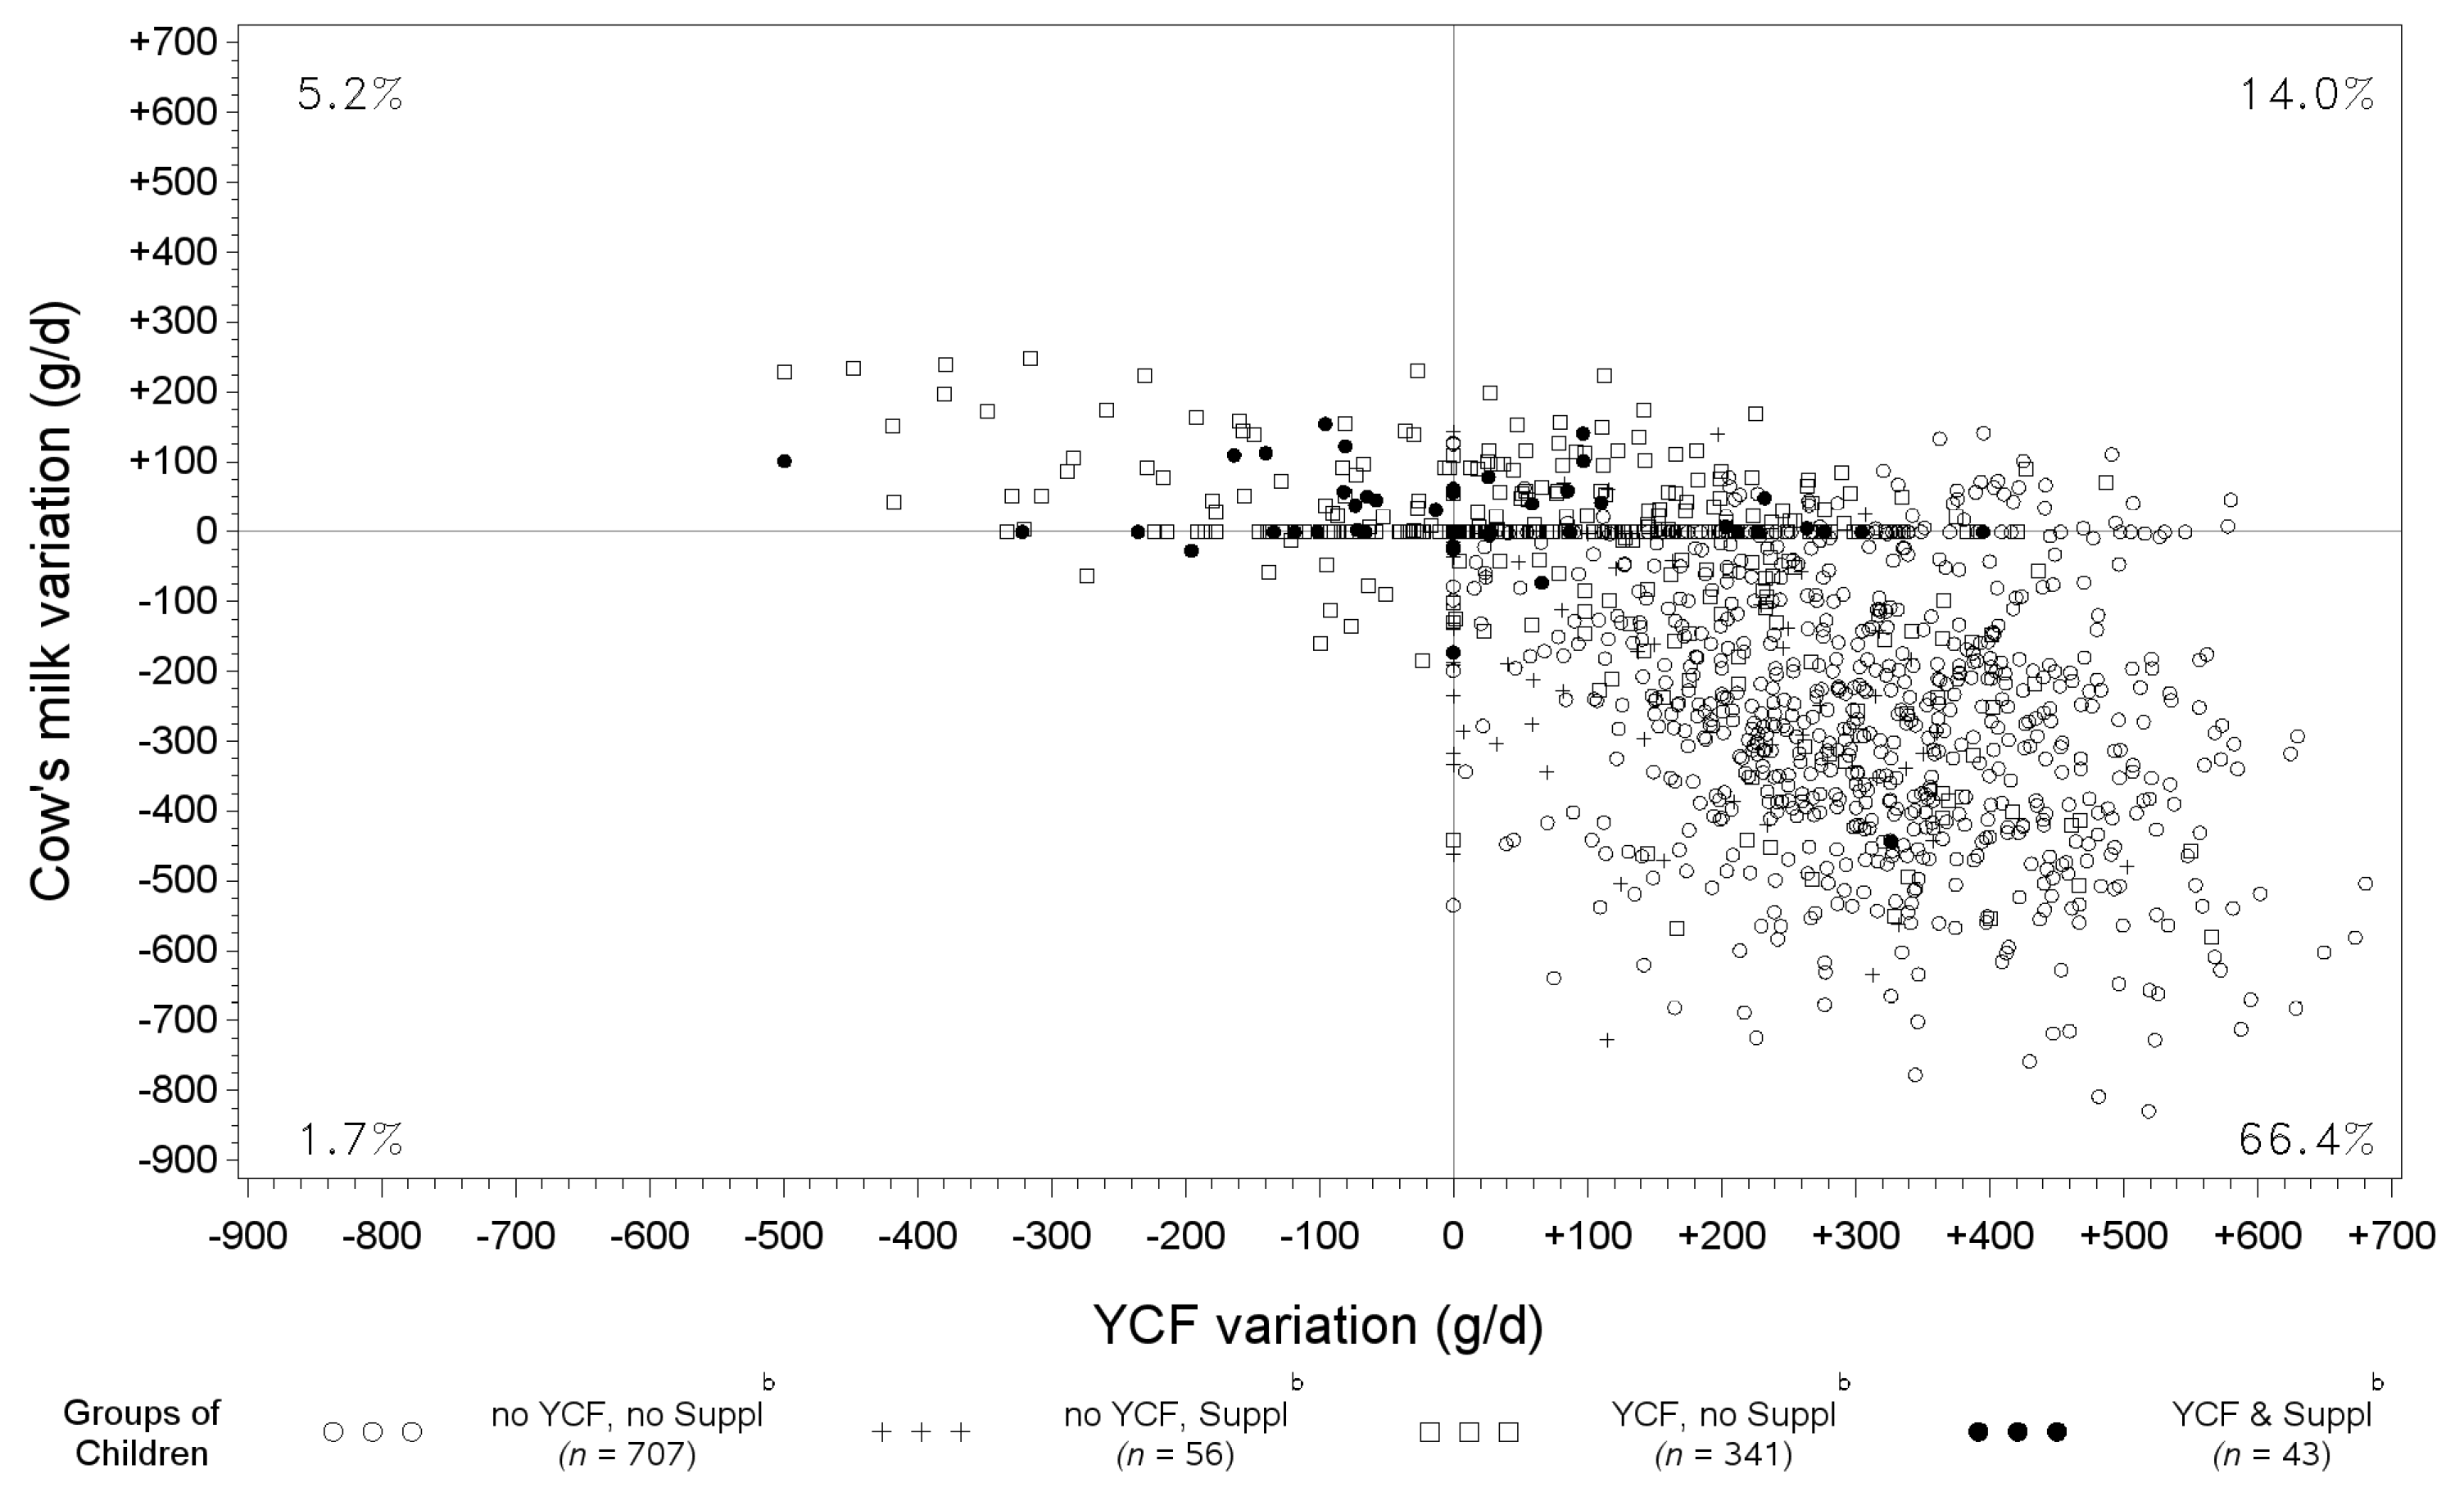
3.5. Variation of YCF and Cow’s Milk between Observed Diets and Those Modeled with All-Foods Models
4. Discussion
5. Conclusions
Supplementary Materials
Acknowledgments
Author Contributions
Conflicts of Interest
Appendix A. Individual Diet Modeling with Linear Programming
Appendix A.1. Principle of Diet Modeling
Appendix A.2. Types of Models Defined by Two Sets of Food Variables
Appendix A.3. Nutritional and Acceptability Constraints
Appendix A.4. Objective Function
References
- Skinner, J.D.; Ziegler, P.; Pac, S.; Devaney, B. Meal and snack patterns of infants and toddlers. J. Am. Diet. Assoc. 2004, 104, 65–70. [Google Scholar] [CrossRef] [PubMed]
- Ziegler, E.E.; Nelson, S.E.; Jeter, J.M. Iron supplementation of breastfed infants. Nutr. Rev. 2011, 69, 71–77. [Google Scholar] [CrossRef] [PubMed]
- Dewey, K.G. The challenge of meeting nutrient needs of infants and young children during the period of complementary feeding: An evolutionary perspective. J. Nutr. 2013, 143, 2050–2054. [Google Scholar] [CrossRef] [PubMed]
- The NDA Panel. Scientific Opinion on the essential composition of infant and follow-on formulae. EFSA J. 2014, 12, 106. [Google Scholar]
- Koletzko, B.; Baker, S.; Cleghorn, G.; Neto, U.F.; Gopalan, S.; Hernell, O.; Hock, Q.S.; Jirapinyo, P.; Lonnerdal, B.; Pencharz, P.; et al. Global standard for the composition of infant formula: Recommendations of an ESPGHAN coordinated international expert group. J. Pediatr. Gastroenterol. Nutr. 2005, 41, 584–599. [Google Scholar] [CrossRef] [PubMed]
- Suthutvoravut, U.; Abiodun, P.O.; Chomtho, S.; Chongviriyaphan, N.; Cruchet, S.; Davies, P.S.W.; Fuchs, G.J.; Gopalan, S.; van Goudoever, J.B.; de la Nel, E.R.; et al. Composition of Follow-Up Formula for Young Children Aged 12–36 Months: Recommendations of an International Expert Group Coordinated by the Nutrition Association of Thailand and the Early Nutrition Academy. Ann. Nutr. Metab. 2015, 67, 119–132. [Google Scholar] [CrossRef] [PubMed]
- Scientific Committee for Food. Report of the Scientific Committee for Food of the Commission for the EEC on Nutrient and Energy Intakes for the European Community; Commission of the European Communities: Brussels, Belgium, 1993. [Google Scholar]
- EFSA Panel on Dietetic Products Nutrition and Allergies (NDA). Scientific Opinion on nutrient requirements and dietary intakes of infants and young children in the European Union. EFSA J. 2013, 11, 103. [Google Scholar]
- Briend, A.; Darmon, N.; Ferguson, E.; Erhardt, J.G. Linear programming: A mathematical tool for analyzing and optimizing children’s diets during the complementary feeding period. J. Pediatr. Gastroenterol. Nutr. 2003, 36, 12–22. [Google Scholar] [CrossRef] [PubMed]
- WHO. Feeding the Non-Breastfed Child 6–24 Months of Age; WHO: Geneva, Switzerland, 2004. [Google Scholar]
- Ferguson, E.L.; Darmon, N.; Fahmida, U.; Fitriyanti, S.; Harper, T.B.; Premachandra, I.M. Design of optimal food-based complementary feeding recommendations and identification of key “problem nutrients” using goal programming. J. Nutr. 2006, 136, 2399–2404. [Google Scholar] [PubMed]
- Maillot, M.; Vieux, F.; Amiot, M.J.; Darmon, N. Individual diet modeling translates nutrient recommendations into realistic and individual-specific food choices. Am. J. Clin. Nutr. 2010, 91, 421–430. [Google Scholar] [CrossRef] [PubMed]
- UK Department of health and Food Standard Agency. Diet and Nutrition Survey of Infants and Young Children; UK Department of health and Food Standard Agency: London, UK, 2011.
- Mendenhall, W.; Beaver, R.; Beaver, B. Introduction to Probability and Statistics; Cengage Learning: Boston, MA, USA, 2012. [Google Scholar]
- Smithers, G. MAFF’s nutrient databank. Nutr. Food Sci. 1993, 93, 16–19. [Google Scholar] [CrossRef]
- Keller, H.H.; Ostbye, T.; Bright-See, E. Predictors of dietary intake in Ontario seniors. Can. J. Public Health 1997, 88, 305–309. [Google Scholar] [PubMed]
- Dubois, L.; Girard, M.; Bergeron, N. The choice of a diet quality indicator to evaluate the nutritional health of populations. Public Health Nutr. 2000, 3, 357–365. [Google Scholar] [CrossRef] [PubMed]
- Kant, A.K. Indexes of overall diet quality: A review. J. Am. Diet. Assoc. 1996, 96, 785–791. [Google Scholar] [CrossRef]
- Guthrie, H.A.; Scheer, J.C. Validity of a dietary score for assessing nutrient adequacy. J. Am. Diet. Assoc. 1981, 78, 240–245. [Google Scholar] [PubMed]
- Madden, J.P.; Goodman, S.J.; Guthrie, H.A. Validity of the 24-h recall. Analysis of data obtained from elderly subjects. J. Am. Diet. Assoc. 1976, 68, 143–147. [Google Scholar] [PubMed]
- Ziegler, E.E.; Fomon, S.J. Potential renal solute load of infant formulas. J. Nutr. 1989, 119, 1785–1788. [Google Scholar] [PubMed]
- Fomon, S.J.; Ziegler, E.E. Renal solute load and potential renal solute load in infancy. J. Pediatr. 1999, 134, 11–14. [Google Scholar] [CrossRef]
- Fomon, S.J. Potential renal solute load: Considerations relating to complementary feedings of breastfed infants. Pediatrics 2000, 106, 1284. [Google Scholar] [PubMed]
- Bonnet, F.; Lepicard, E.M.; Cathrin, L.; Letellier, C.; Constant, F.; Hawili, N.; Friedlander, G. French children start their school day with a hydration deficit. Ann. Nutr. Metab. 2012, 60, 257–263. [Google Scholar] [PubMed]
- Maillot, M.; Vieux, F.; Ferguson, E.F.; Volatier, J.-L.; Amiot, M.J.; Darmon, N. To meet nutrient recommendations, most French adults need to expand their habitual food repertoire. J. Nutr. 2009, 139, 1721–1727. [Google Scholar] [CrossRef] [PubMed]
- Nordic Council of Ministers. Nordic Nutrition Recommendations 2012. Part 1—Summary, Principles and Use; Nordic Council of Ministers: Copenhagen, Denmark, 2013. [Google Scholar]
- British Nutrition Foundation 5532-a-day. Available online: https://www.nutrition.org.uk/attachments/article/734/BNF Toddler Eatwell Poster_OL.pdf (accessed on 15 April 2016).
- Carriquiry, A.L. Assessing the prevalence of nutrient inadequacy. Public Health Nutr. 1999, 2, 23–33. [Google Scholar] [CrossRef] [PubMed]
- Jessiman, T.; Cameron, A.; Wiggins, M.; Lucas, P.J. A qualitative study of uptake of free vitamins in England. Arch. Dis. Child. 2013, 98, 587–591. [Google Scholar] [CrossRef] [PubMed]
- Maillot, M.; Drewnowski, A.; Vieux, F.; Darmon, N. Quantifying the contribution of foods with unfavourable nutrient profiles to nutritionally adequate diets. Br. J. Nutr. 2011, 105, 1133–1137. [Google Scholar] [CrossRef] [PubMed]
- Maillot, M.; Issa, C.; Vieux, F.; Lairon, D.; Darmon, N. The shortest way to reach nutritional goals is to adopt Mediterranean food choices: Evidence from computer-generated personalized diets. Am. J. Clin. Nutr. 2011, 94, 1127–1137. [Google Scholar] [CrossRef] [PubMed]
- Kersting, M.; Alexy, U.; Clausen, K. Using the concept of Food Based Dietary Guidelines to Develop an Optimized Mixed Diet (OMD) for German children and adolescents. J. Pediatr. Gastroenterol. Nutr. 2005, 40, 301–308. [Google Scholar] [CrossRef] [PubMed]
- Deutsche Gesellschaft fur Ernahrung (DGE). Referenzwerte fur die Nahrstoffzufuhr [Reference Values of Nutrient Intakes]; Deutsche Gesellschaft fur Ernahrung (DGE): Frankfurt, Germany, 2000. [Google Scholar]
- Aggett, P.J.; Haschke, F.; Heine, W.; Hernell, O.; Koletzko, B.; Lafeber, H.; Ormission, A.; Rey, J.; Tormo, R. Committee report: Childhood diet and prevention of coronary heart disease. ESPGAN Committee on Nutrition. European Society of Pediatric Gastroenterology and Nutrition. J. Pediatr. Gastroenterol. Nutr. 1994, 19, 261–269. [Google Scholar] [PubMed]
- Ghisolfi, J.; Fantino, M.; Turck, D.; de Courcy, G.P.; Vidailhet, M. Nutrient intakes of children aged 1–2 years as a function of milk consumption, cows’ milk or growing-up milk. Public Health Nutr. 2013, 16, 524–534. [Google Scholar] [CrossRef] [PubMed]
- Walton, J.; Flynn, A. Nutritional adequacy of diets containing growing up milks or unfortified cow’s milk in Irish children (aged 12–24 months). Food Nutr. Res. 2013, 57. [Google Scholar] [CrossRef] [PubMed]
- Tympa-Psirropoulou, E.; Vagenas, C.; Psirropoulos, D.; Dafni, O.; Matala, A.; Skopouli, F. Nutritional risk factors for iron-deficiency anaemia in children 12–24 months old in the area of Thessalia in Greece. Int. J. Food Sci. Nutr. 2005, 56, 1–12. [Google Scholar] [CrossRef] [PubMed]
- Eussen, S.R.B.M.; Pean, J.; Olivier, L.; Delaere, F.; Lluch, A. Theoretical impact of replacing whole cow’s milk by young-child formula on nutrient intakes of uk young children: Results of a simulation study. Ann. Nutr. Metab. 2015, 67, 247–256. [Google Scholar] [CrossRef] [PubMed]
- Chen, X.; Wang, Y. Tracking of blood pressure from childhood to adulthood: A systematic review and meta-regression analysis. Circulation 2008, 117, 3171–3180. [Google Scholar] [CrossRef] [PubMed]
- Pomeranz, A.; Korzets, Z.; Vanunu, D.; Krystal, H.; Wolach, B. Elevated Salt and Nitrate Levels in Drinking Water Cause an Increase of Blood Pressure in Schoolchildren. Kidney Blood Press. Res. 2000, 23, 400–403. [Google Scholar] [CrossRef] [PubMed]
- US Department of Agriculture. What is the Effect of a Reduced Sodium Intake on Blood Pressure in Children from Birth to Age 18 Years? US Department of Agriculture: Washington, DC, USA, 2015.
- Girardet, J.-P.; Rieu, D.; Bocquet, A.; Bresson, J.-L.; Briend, A.; Chouraqui, J.-P.; Darmaun, D.; Dupont, C.; Frelut, M.-L.; Hankard, R. Les enfants consomment-ils trop de sel? (Salt intake in children). Arch. Pédiatr. 2014, 21, 521–528. [Google Scholar] [CrossRef] [PubMed]
- Rolland-Cachera, M.F.; Deheeger, M.; Akrut, M.; Bellisle, F. Influence of macronutriments on adiposity developpement: A follow-up study of nutrition and growth from 10 months to 8 years of age. Int. J. Obes. Relat. Metab. Disord. 1995, 19, 573–578. [Google Scholar] [PubMed]
- Rolland-Cachera, M.F.; Deheeger, M.; Maillot, M.; Bellisle, F. Early adiposity rebound: Causes and consequences for obesity in children and adults. Int. J. Obes. 2006, 30, S11–S17. [Google Scholar] [CrossRef] [PubMed]
- Scaglioni, S.; Agostoni, C.; De Notaris, R.; Radaelli, G.; Radice, N.; Valenti, M.; Giovannini, M.; Riva, E. Early macronutrient intake and overweight at five years of age. Int. J. Obes. 2000, 24, 777–781. [Google Scholar] [CrossRef]
- Hörnell, A.; Lagström, H.; Lande, B.; Thorsdottir, I. Protein intake from 0 to 18 years of age and its relation to health: A systematic literature review for the 5th Nordic Nutrition Recommendations. Food Nutr. Res. 2013, 57. [Google Scholar] [CrossRef]
- Michaelsen, K.F.; Greer, F.R. Protein needs early in life and long-term health. Am. J. Clin. Nutr. 2014, 99, 718S–722S. [Google Scholar] [CrossRef] [PubMed]
- Dantzig, G.B. The Diet Problem. Interfaces 1990, 20, 43–47. [Google Scholar] [CrossRef]
- Gibson, S.; Boyd, A. Associations between added sugars and micronutrient intakes and status: Further analysis of data from the National Diet and Nutrition Survey of Young People aged 4 to 18 years. Br. J. Nutr. 2009, 101, 100–107. [Google Scholar] [CrossRef] [PubMed]

| All | No YCF, No Suppl a | No YCF, Suppl a | YCF, No Suppl a | YCF & Suppl a | p * | |
|---|---|---|---|---|---|---|
| Number of children (n) | 1147 | 707 | 56 | 341 | 43 | |
| Gender (%) | ||||||
| Male | 50.9 | 51.6 | 53.6 | 49.6 | 46.5 | 0.83 |
| Female | 49.1 | 48.4 | 46.4 | 50.4 | 53.5 | |
| Child's age (in months) | <0.001 1 | |||||
| Mean | 14.3 | 14.6 | 14.5 | 13.8 | 14.4 | |
| SD | 1.62 | 1.58 | 1.56 | 1.61 | 1.60 | |
| Anthropometric data | ||||||
| Infant height (cm) | ||||||
| Mean | 79.7 | 79.8 | 79.8 | 79.5 | 79.2 | 0.31 |
| SD | 3.46 | 3.50 | 3.35 | 3.24 | 4.52 | |
| n missing | 145 | 89 | 6 | 45 | 5 | |
| Infant weight (kg) | ||||||
| Mean | 10.9 | 11.0 | 10.7 | 10.9 | 10.6 | 0.12 |
| SD | 1.31 | 1.33 | 1.22 | 1.29 | 1.31 | |
| Number of missing values | 42 | 27 | 2 | 10 | 3 | |
| BMI (kg/m2) | ||||||
| Mean | 17.1 | 17.2 | 16.7 | 17.1 | 16.8 | 0.16 |
| SD | 1.56 | 1.54 | 1.54 | 1.62 | 1.52 | |
| Number of missing values | 158 | 96 | 7 | 49 | 6 | |
| Reported breastfeeding (%) | ||||||
| Still breastfeeding | 7.41 | 8.49 | 14.3 | 4.40 | 4.65 | 0.02 |
| No longer breastfeeding | 68.3 | 64.6 | 67.9 | 74.8 | 79.1 | 0.004 1 |
| Never breastfed | 24.1 | 26.7 | 17.9 | 20.8 | 16.3 | 0.06 |
| Number of missing values | 1 | 1 | 0 | 0 | 0 | |
| Energy (kcal/day) | ||||||
| Mean | 968 | 983 | 972 | 938 | 950 | 0.005 1 |
| SD | 196 | 199 | 228 | 183 | 166 | |
| Diet quality indicators | ||||||
| Mean adequacy ratio (%) | ||||||
| Mean | 90.9 | 88.6 | 92.5 | 94.8 | 97.5 | <0.001 1,2,3,4,5 |
| SD | 6.05 | 5.34 | 4.73 | 5.28 | 2.16 | |
| PRSL (mmol) | ||||||
| Mean | 312 | 332 | 328 | 272 | 277 | <0.001 1,3,5,6 |
| SD | 78.8 | 76.2 | 87.3 | 66.6 | 66.9 |
| Nutrients | Reference Value | All (n = 1147) | No YCF, No Suppl a | No YCF, Suppl a | YCF, No Suppl a | YCF & Suppl a | p-Unadjusted Analysis * | p-Adjusted Analysis ** |
|---|---|---|---|---|---|---|---|---|
| (n = 707) | (n = 56) | (n = 341) | (n = 43) | |||||
| Macronutrients | ||||||||
| Water (H2O) | ≥1100 mL/day b | 28.2 | 29.3 | 26.8 | 25.2 | 37.2 | 0.30 | 0.18 |
| Proteins | ≥1.14 g/kg body weight c | 99.9 | 100 | 100 | 99.7 | 100 | 0.50 *** | 0.99 *** |
| Carbohydrates | 45%–60% energy d | 82.0 | 80.9 | 83.9 | 85.6 | 69.8 | 0.04 | 0.03 |
| Carbohydrates min | ≥45% of energy d | 90.0 | 86.3 | 87.5 | 97.1 | 97.7 | <0.001 | <0.0001 |
| Carbohydrates max | ≤60% of energy d | 92.0 | 94.6 | 96.4 | 88.6 | 72.1 | <0.001 | <0.0001 |
| Fiber | >10 g/day b | 20.6 | 15.3 | 10.7 | 30.8 | 39.5 | <0.001 | <0.001 |
| Total fats | 35%–40% energy d | 43.7 | 45.0 | 51.8 | 41.9 | 25.6 | 0.04 | 0.08 |
| Total fats min | ≥35% of energy d | 59.0 | 62.9 | 66.1 | 54.0 | 25.6 | <0.001 | <0.001 |
| Total fats max | ≤40% of energy d | 84.7 | 82.0 | 85.7 | 88.0 | 100 | 0.002 | 0.009 |
| n-6 FA | ≥3% energy f | 86.7 | 81.2 | 80.4 | 97.6 | 100.0 | <0.001 | <0.001 *** |
| n-3 FA | ≥0.5% energy f | 77.0 | 68.3 | 69.6 | 93.5 | 97.7 | <0.001 | <0.001 |
| Vitamins | ||||||||
| Thiamin | ≥0.5 mg/day c | 95.1 | 94.1 | 98.2 | 96.2 | 100.0 | 0.12 *** | 0.03 *** |
| Riboflavin | ≥0.8 mg/day b | 93.1 | 93.5 | 96.4 | 90.9 | 100.0 | 0.08 *** | 0.37 *** |
| Niacin | ≥9 mg nicotinic acid eq/day c | 97.3 | 98.6 | 98.2 | 94.4 | 97.7 | 0.001 *** | 0.007 |
| Pantothenic acid | ≥4 mg/day b | 77.3 | 83.0 | 89.3 | 63.3 | 79.1 | <0.001 | <0.001 |
| Vitamin B6 min | ≥0.7 mg/day c | 86.9 | 93.5 | 96.4 | 71.5 | 88.4 | <0.001 | <0.001 |
| Vitamin B6 max | ≤5 mg/day e | 100.0 | 100.0 | 100.0 | 100.0 | 100.0 | N.A. | N.A. |
| Biotin | ≥20 μg/day b | 60.1 | 66.0 | 67.9 | 48.4 | 44.2 | <0.001 | <0.001 |
| Folates | ≥100 μg/day c | 88.7 | 87.1 | 92.9 | 90.0 | 100.0 | 0.03 | 0.02 *** |
| Vitamin B12 | ≥0.9 μg/day c | 99.6 | 99.6 | 100.0 | 99.7 | 100.0 | 0.92 *** | 0.91 *** |
| Vitamin C | ≥20 mg/day c | 95.9 | 93.3 | 100.0 | 100.0 | 100.0 | <0.001 *** | 0.99 *** |
| Vitamin D min | ≥10 μg/day b | 7.9 | 0 | 16.1 | 15.5 | 67.4 | <0.001 *** | <0.001 *** |
| Vitamin D max | ≤50 μg/day e | 100.0 | 100.0 | 100.0 | 100.0 | 100.0 | N.A. | N.A. |
| Vitamin E | ≥6 mg tocopherol eq/d b | 29.2 | 5.7 | 33.9 | 70.4 | 83.7 | <0.001 | <0.001 |
| Retinol equivalent | ≥400 μg /day b | 79.2 | 70.9 | 94.6 | 92.1 | 95.3 | <0.001 | <0.001 |
| Retinol | ≤800 μg/day e | 98.5 | 99.6 | 89.3 | 99.4 | 86.0 | <0.001 *** | <0.001 *** |
| Minerals | ||||||||
| Sodium | ≥170 mg/day b | 99.8 | 100.0 | 100.0 | 99.4 | 100.0 | 0.19 *** | 0.97 *** |
| Potassium | ≥800 mg/day c | 97.4 | 98.2 | 98.2 | 95.3 | 100.0 | 0.03 *** | 0.05 *** |
| Magnesium | ≥85 mg/day c | 93.3 | 95.3 | 94.6 | 89.1 | 90.7 | 0.002 *** | 0.001 *** |
| Chloride | ≥270 mg/day b | 100.0 | 100.0 | 100.0 | 100.0 | 100.0 | N.A. | N.A. |
| Calcium | ≥600 mg/day c | 78.2 | 82.6 | 76.8 | 69.2 | 79.1 | <0.001 | <0.001 |
| Phosphorus | ≥460 mg/day c | 94.2 | 96.0 | 96.4 | 90.0 | 93.0 | 0.001 *** | 0.002 *** |
| Iodine min | ≥90 µg/day b,c | 88.1 | 91.65 | 91.1 | 81.2 | 79.1 | <0.001 | <0.001 |
| Iodine max | ≤200 µg/day e | 62.1 | 49.1 | 50.0 | 87.7 | 88.4 | <0.001 | <0.001 |
| Iron | ≥8 mg/day b,c | 28.2 | 9.9 | 19.6 | 61.0 | 79.1 | <0.001 | <0.001 |
| Copper min | ≥0.4 mg/day c | 71.9 | 64.9 | 69.6 | 84.2 | 93.0 | <0.001 | <0.001 |
| Copper max | ≤1 mg/day e | 99.5 | 99.9 | 98.2 | 98.8 | 100.0 | 0.08 *** | 0.13 *** |
| Zinc min | ≥4 mg/day c | 91.6 | 89.1 | 89.3 | 96.2 | 100.0 | <0.001 *** | <0.001 *** |
| Zinc max | ≤7 mg/day e | 91.2 | 97.2 | 91.1 | 81.8 | 67.4 | <0.001 *** | <0.001 *** |
| Selenium min | ≥20 µg/day c | 59.4 | 55.3 | 60.7 | 66.3 | 69.8 | 0.004 | <0.001 |
| Selenium max | ≤60 µg/day e | 100.0 | 100.0 | 100.0 | 100.0 | 100.0 | N.A. | N.A. |
| Manganese | ≥0.5 mg/day b | 96.4 | 97.0 | 100.0 | 94.4 | 97. 7 | 0.07 *** | 0.94 *** |
| All 1 (n = 1147) | No YCF, No Suppl b2 (n = 707) | No YCF, Suppl b3 (n = 56) | YCF, No Suppl b4 (n = 341) | YCF & Suppl b5 (n = 43) | Test of Modeled vs. Observed Variation Across Groups | |||||||||||||||||
|---|---|---|---|---|---|---|---|---|---|---|---|---|---|---|---|---|---|---|---|---|---|---|
| Observed | Modeled | Observed | Modeled | Observed | Modeled | Observed | Modeled | Observed | Modeled | Unadjusted p | Adjusted p ** | |||||||||||
| Mean | SD | Mean | SD | Mean | SD | Mean | SD | Mean | SD | Mean | SD | Mean | SD | Mean | SD | Mean | SD | Mean | SD | |||
| Supplements 1,2,3,4 | 0.11 | 0.54 | 0.74 | 1.03 | 0.00 | 0.00 | 0.81 | 1.03 | 1.30 | 1.34 | 1.82 | 1.55 | 0.00 | 0.00 | 0.36 | 0.59 | 1.29 | 1.37 | 1.35 | 1.36 | <0.001 | <0.001 |
| Dairy products 1,2,3,4 | 503 | 185 | 529 | 134 | 484 | 185 | 512 | 128 | 519 | 207 | 441 | 157 | 536 | 178 | 577 | 126 | 539 | 177 | 551 | 124 | 0.001 | <0.001 |
| YCF 1,2,3,4 | 119 | 200 | 345 | 154 | 0.00 | 0.00 | 312 | 132 | 0.00 | 0.00 | 157 | 135 | 353 | 186 | 439 | 143 | 383 | 190 | 399 | 155 | <0.001 | <0.001 |
| Cow’s milk 1,2,3,4 | 303 | 228 | 122 | 87.9 | 399 | 200 | 133 | 86.9 | 413 | 203 | 192 | 125 | 113 | 142 | 88.2 | 69.3 | 88.8 | 117 | 106 | 76.9 | <0.001 | <0.001 |
| Breast milk | 20.7 | 89.0 | 20.7 | 89.0 | 24.1 | 94.5 | 24.1 | 94.5 | 46.2 | 155 | 46.2 | 155 | 11.6 | 63.1 | 11.6 | 63.1 | 4.65 | 21.3 | 4.65 | 21.3 | ||
| Fresh dairy products 1,2,3,4,5 | 51.5 | 40.0 | 33.9 | 33.1 | 52.0 | 40.3 | 34.7 | 33.6 | 51.6 | 39.1 | 38.2 | 34.0 | 50.5 | 39.3 | 31.8 | 32.1 | 51.7 | 43.1 | 32.7 | 31.8 | 0.73 | 0.79 |
| Cheese and cream 1,2,4 | 8.49 | 9.71 | 7.49 | 8.66 | 8.47 | 9.69 | 7.75 | 8.81 | 8.22 | 9.87 | 7.19 | 8.46 | 8.23 | 9.44 | 6.76 | 7.97 | 11.1 | 11.6 | 9.43 | 11.1 | 0.22 | 0.32 |
| Fruit and vegetable 1,2,3,4,5 | 156 | 99.0 | 222 | 91.1 | 161 | 97.2 | 223 | 90.3 | 185 | 115 | 268 | 94.2 | 139 | 96.0 | 211 | 88.9 | 167 | 112 | 228 | 98.4 | 0.03 | 0.10 |
| Fruits 1,2,3,4 | 78.5 | 63.0 | 94.7 | 65.6 | 81.3 | 62.3 | 94.6 | 64.5 | 95.2 | 73.7 | 116 | 67.1 | 69.5 | 60.2 | 91.8 | 66.5 | 81.1 | 73.1 | 92. 6 | 69.8 | 0.02 | 0.02 |
| Vegetables 1,2,3,4,5 | 56.1 | 44.9 | 106 | 52.5 | 56.7 | 45.1 | 105 | 51.9 | 69.3 | 51.3 | 132 | 53.3 | 51.9 | 43.0 | 103 | 53.4 | 62.3 | 44.5 | 115.3 | 46.6 | 0.09 | 0.04 |
| Fruit juice | 13.0 | 38.7 | 12.4 | 33.1 | 13.2 | 37.7 | 13.2 | 33.8 | 13.3 | 33.3 | 12.4 | 30.5 | 11.4 | 39.6 | 10.1 | 31.1 | 22.1 | 52.4 | 17.8 | 39.0 | 0.77 | 0.90 |
| Soups | 8.63 | 25.3 | 8.37 | 23.9 | 10.3 | 28.8 | 10.2 | 27.9 | 7.45 | 12.6 | 7.29 | 12.4 | 6.20 | 19.6 | 5.48 | 16.3 | 1.36 | 5.63 | 2.36 | 9.16 | 0.48 | 0.39 |
| Starchy foods 1,2,4,5 | 119 | 60.8 | 105 | 60.0 | 128 | 60.4 | 113 | 60.7 | 118 | 56.4 | 115 | 63.7 | 101 | 57.9 | 88. 9 | 54.3 | 111 | 66.7 | 94.9 | 60.5 | 0.13 | 0.08 |
| Bread 1,2,4,5 | 27.9 | 19.8 | 20.6 | 17.4 | 30.9 | 21.0 | 23.2 | 18.6 | 21.4 | 13.9 | 19.1 | 14.1 | 24.0 | 17.6 | 16.6 | 14.5 | 18.2 | 13.0 | 13.1 | 12.5 | 0.03 | 0.02 |
| Other starchy foods 1,2 | 91.0 | 57.1 | 84.7 | 54.8 | 97.0 | 56.2 | 89.9 | 55.0 | 96.6 | 55.5 | 95.8 | 59.1 | 77.5 | 55.9 | 72.3 | 51.46 | 92.7 | 67.2 | 81.7 | 58.4 | 0.40 | 0.34 |
| Meat fish eggs 1,2,3,4,5 | 51.5 | 34.8 | 60.5 | 34.7 | 54.9 | 35.3 | 64.9 | 34.9 | 49.2 | 30.4 | 64.5 | 32.6 | 45.5 | 32.1 | 51.4 | 31.6 | 47.3 | 44.9 | 55.5 | 44.2 | <0.001 | 0.001 |
| Meat 3 | 34.6 | 28.6 | 35.1 | 27.9 | 38.1 | 30.1 | 38.3 | 29.0 | 27.5 | 21.1 | 33.4 | 25.3 | 28.9 | 24.6 | 29.4 | 24.2 | 30.1 | 31.9 | 30.7 | 31.8 | <0.001 | <0.001 |
| Fish 1,2 | 9.77 | 14.1 | 10.9 | 14.5 | 9.91 | 14.3 | 11.2 | 14.5 | 11.3 | 16.1 | 11.3 | 17.4 | 9.33 | 13.4 | 10.2 | 14.1 | 9.07 | 13.4 | 10.4 | 14.6 | 0.65 | 0.77 |
| Eggs 1,2,3,4,5 | 7.20 | 11.5 | 14.5 | 17.8 | 6.87 | 11.3 | 15.4 | 19.0 | 10.5 | 14.3 | 19.7 | 19.2 | 7.23 | 11.7 | 11.8 | 14.8 | 8.18 | 9.42 | 14.4 | 15.3 | <0.001 | <0.001 |
| Sweets & salted foods and drinks 1,2,4 | 74.5 | 128 | 65.0 | 120 | 88.6 | 146 | 77.6 | 138 | 70.1 | 112 | 67.8 | 110 | 48.5 | 79.4 | 41.1 | 76.3 | 52.8 | 83.5 | 44.9 | 72.2 | 0.06 | 0.05 |
| Savory foods 1 | 2.16 | 3.78 | 2.00 | 3.62 | 2.51 | 3.99 | 2.35 | 3.84 | 1.76 | 3.91 | 1.81 | 3.99 | 1.57 | 3.21 | 1.38 | 2.93 | 1.60 | 3.65 | 1.51 | 3.64 | 0.86 | 0.75 |
| Soft drinks 1,2 | 42.0 | 120 | 39.3 | 115 | 52.9 | 140 | 48.9 | 133 | 42.2 | 107 | 41.7 | 107 | 21.4 | 70.0 | 20.9 | 69.4 | 25.8 | 64.9 | 24.0 | 64.1 | 0.09 | 0.16 |
| Sweet foods 1,2,4 | 30.3 | 31.4 | 23.7 | 25.7 | 33.2 | 30.6 | 26.3 | 26.7 | 26.1 | 26.1 | 24.2 | 25.4 | 25.5 | 30.3 | 18.8 | 22.8 | 25.5 | 48.7 | 19.4 | 25.7 | 0.29 | 0.24 |
| Toddlers foods and drink 1,2,4 | 62.9 | 108 | 57.0 | 91.9 | 41.9 | 83.1 | 37.9 | 69.4 | 78.4 | 118 | 74.8 | 103 | 94.4 | 129 | 85.5 | 110 | 138 | 170 | 123 | 144 | 0.18 | 0.36 |
| Toddlers foods | 52.7 | 85.1 | 50.9 | 81.9 | 35.6 | 65.8 | 34.5 | 63.0 | 67.7 | 90.6 | 68.2 | 92.9 | 81.4 | 107 | 77.8 | 103 | 86.2 | 92.5 | 83.5 | 89.1 | 0.49 | 0.78 |
| Toddlers drinks 1,2 | 10.2 | 51.4 | 6.15 | 34.6 | 6.32 | 41.6 | 3.31 | 27.9 | 10.8 | 47.4 | 6.55 | 25.2 | 13.0 | 56.1 | 7.72 | 36.0 | 52.3 | 111 | 39.9 | 83.8 | 0.28 | 0.34 |
| Added fats 1,2,3,4,5 | 4.80 | 4.17 | 6.34 | 5.01 | 5.14 | 4.31 | 6.75 | 5.10 | 4.55 | 3.39 | 7.04 | 4.70 | 4.34 | 4.04 | 5.39 | 4.71 | 3.30 | 2.83 | 6.14 | 5.12 | 0.01 | 0.03 |
| Animal fats 1,5 | 1.70 | 3.37 | 1.92 | 3.62 | 1.67 | 3.43 | 1.85 | 3.60 | 1.64 | 2.47 | 1.86 | 2.88 | 1.83 | 3.49 | 1.94 | 3.62 | 1.35 | 2.25 | 2.92 | 4.72 | 0.005 | 0.003 |
| Vegetable fats 1,2,3,4,5 | 3.10 | 3.46 | 4.42 | 4.38 | 3.47 | 3.65 | 4.90 | 4.53 | 2.91 | 3.13 | 5.18 | 4.57 | 2.51 | 3.12 | 3.46 | 3.94 | 1.96 | 2.22 | 3.23 | 3.28 | 0.03 | 0.16 |
| Water 1,2,3,4,5 | 121 | 129 | 231 | 154 | 119 | 134 | 223 | 162 | 158 | 125 | 301 | 152 | 116 | 120 | 235 | 137 | 141 | 124 | 238 | 118 | 0.04 | 0.09 |
| Low calorie drinks, tea and coffee | 97.8 | 174 | 97.3 | 173 | 122 | 197 | 121 | 196 | 32.7 | 70.9 | 32.7 | 70.9 | 67.4 | 130 | 67.4 | 130 | 23.2 | 51.7 | 23.2 | 51.7 | 0.67 | 0.73 |
| Low calorie drinks | 93.9 | 172 | 93.4 | 171 | 118 | 195 | 117 | 193 | 29.3 | 68.3 | 29.3 | 68.3 | 64.0 | 128 | 64.0 | 128 | 19.6 | 51.6 | 19.6 | 51.6 | 0.67 | 0.73 |
| Tea coffee | 3.89 | 20.4 | 3.89 | 20.4 | 4.20 | 22.1 | 4.20 | 22.1 | 3.44 | 13.4 | 3.44 | 13.4 | 3.37 | 18.4 | 3.37 | 18.4 | 3.58 | 12.3 | 3.58 | 12.3 | 0.89 | 0.89 |
| Others c,1,2,3,4 | 7.27 | 11.1 | 8.95 | 12.5 | 7.95 | 10.7 | 10.1 | 12.6 | 5.71 | 8.83 | 7.64 | 9.91 | 6.48 | 12.4 | 7.35 | 12.9 | 4.27 | 8.70 | 5.06 | 9.11 | 0.001 | 0.01 |
© 2016 by the authors; licensee MDPI, Basel, Switzerland. This article is an open access article distributed under the terms and conditions of the Creative Commons Attribution (CC-BY) license (http://creativecommons.org/licenses/by/4.0/).
Share and Cite
Vieux, F.; Brouzes, C.M.C.; Maillot, M.; Briend, A.; Hankard, R.; Lluch, A.; Darmon, N. Role of Young Child Formulae and Supplements to Ensure Nutritional Adequacy in U.K. Young Children. Nutrients 2016, 8, 539. https://doi.org/10.3390/nu8090539
Vieux F, Brouzes CMC, Maillot M, Briend A, Hankard R, Lluch A, Darmon N. Role of Young Child Formulae and Supplements to Ensure Nutritional Adequacy in U.K. Young Children. Nutrients. 2016; 8(9):539. https://doi.org/10.3390/nu8090539
Chicago/Turabian StyleVieux, Florent, Chloé M. C. Brouzes, Matthieu Maillot, André Briend, Régis Hankard, Anne Lluch, and Nicole Darmon. 2016. "Role of Young Child Formulae and Supplements to Ensure Nutritional Adequacy in U.K. Young Children" Nutrients 8, no. 9: 539. https://doi.org/10.3390/nu8090539
APA StyleVieux, F., Brouzes, C. M. C., Maillot, M., Briend, A., Hankard, R., Lluch, A., & Darmon, N. (2016). Role of Young Child Formulae and Supplements to Ensure Nutritional Adequacy in U.K. Young Children. Nutrients, 8(9), 539. https://doi.org/10.3390/nu8090539