1. Introduction
Recently, studies have implied that nutrition during fetal and neonatal life can have profound effects on lifespan, glucose, and lipid metabolism. Human studies conducted in 1944–1945 revealed that undernutrition during early pregnancy was associated with glucose intolerance and increased serum insulin concentrations later in life (50–58 years-old) [
1]. It was the first time that scientists addressed the impact of adverse environmental factors in early life on the occurrence of metabolic diseases in adulthood [
2]. Later work confirmed and extended this hypothesis by showing significant opposite correlations between birth weight and the risk of adult obesity [
3,
4]. One important mechanism believed to be involved in this relationship is DNA methylation. DNA methylation changes normally occur within CpG-rich regions (CpG islands). CpG islands are usually located near the promoter regions of genes. Methylation within the promoter region can negatively affect gene expression [
5]. DNA methylation is a key regulator of normal metabolic balance and the occurrence of disease [
6,
7]. DNA methylation changes are particularly sensitive in “early life window period”. DNA methylation changes occurring in utero may be passed on to offspring and may subsequently lead to metabolic diseases [
8].
An increasing number of studies show that chromium (Cr (III)) supplementation is beneficial in maintaining healthy lipid metabolism, regulating appetite, reducing fat mass, and increasing lean body mass [
9]. The minimum suggested daily chromium intake is 30 μg. However, the average dietary chromium intake for adults is far below this recommendation in many countries [
10,
11]. In particular, pregnant women and elderly individuals are more prone to the chromium deficiency [
12], due to increased metabolic stress and decreased absorption ratio [
13,
14]. Vincent et al. report that a chromium-insufficient diet leads to an increase in serum cholesterol, which can be ameliorated by chromium supplementation [
15]. A recent study shows that chronic maternal chromium deficiency increases body fat and changes the lipid metabolism in rat pups. The mechanism involved is probably augmented by oxidative stress [
16].
We hypothesized that exposure to maternal chromium restriction would have a sustained impact on the methylation of genes involved in lipid metabolism, thus lead to dyslipidemia in mice offspring. To identify this epigenetic alteration, we used a genome-wide DNA methylation approach in adipose tissue and tested whether epigenetic changes were associated with differential gene expression.
2. Materials and Methods
2.1. Animals Protocol
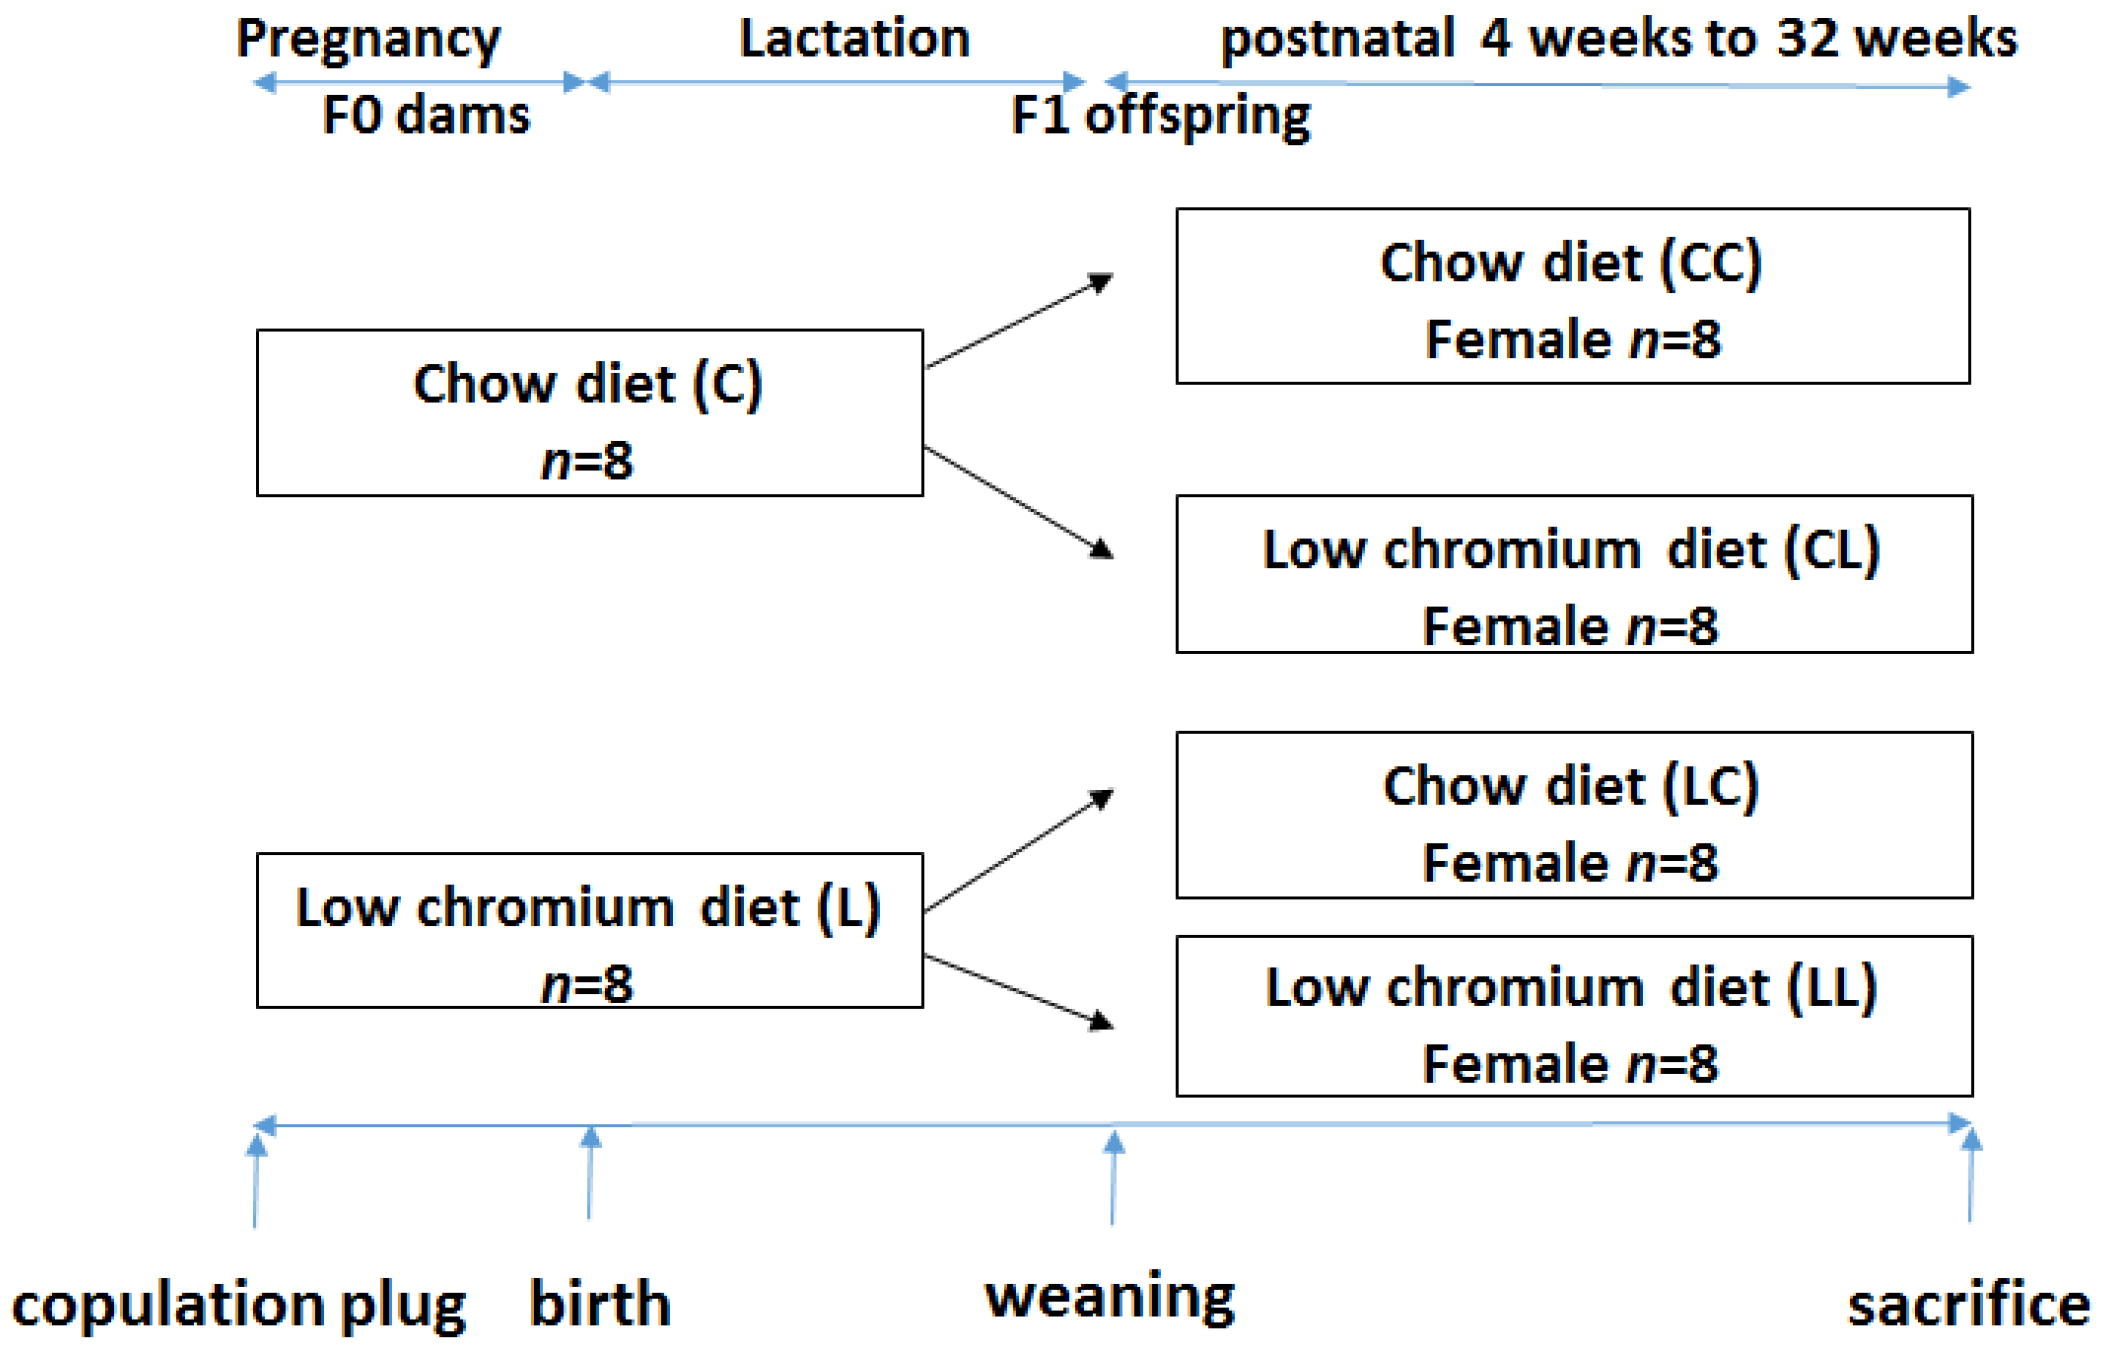
This study was performed in strict accordance with the recommendations given by the Guide for the Care and Use of Laboratory Animals from the National Institute of Health. The protocol was approved by the Committee on the Ethics of Animal Experiments of Peking Union Medical Hospital (Permit Number: MC-07-6004). All efforts were made to minimize suffering. Seven-week-old C57BL/6J mice (18.5 ± 1.6 g) were acquired from the Institute of Laboratory Animal Science, Chinese Academy of Medical Sciences and Peking Union Medical College (Beijing, China, SCXK-2014-0108). After 1 week of adaptation, virgin female C57BL mice were caged with males (2 females to 1 male) overnight. Copulation was confirmed the next morning by establishing the formation of a vaginal plug. Midnight was considered as day 0 of gestation. Pregnant mothers (
n = 16) were fed either the control diet (C,
n = 8) or low chromium diet (L,
n = 8). The control diet was a casein-based diet formulated on the basis of the American Institute of Nutrition AIN-93G diet and contained 1.19 mg/kg chromium. The low chromium diet (reduced only in chromium) contained 0.14 mg/kg chromium (88.23% of chromium restriction compared to control diet). The concentration of dietary chromium was analyzed using an atomic absorption spectrometer (TAS986, Beijing Persee General Corporation, Beijing, China). All diets were produced by Research Diets (New Brunswick, NJ, USA). On day 1 after birth, the litter sizes of both groups were homogenized to six pups (3 male and 3 female mice), to ensure no nutritional bias between litters. The diets were administered throughout gestation and lactation. All offspring was weaned at 3 weeks of age. Following weaning, the offspring were divided into the following sub-groups: CC (control diet-control diet), CL (control diet-low chromium diet), LC (low chromium diet-control diet), and LL (low chromium diet-low chromium diet,
n = 8/group, one female pup from each litter was randomly assigned to the experimental groups). The mice were maintained in a light-dark cycle (12 h light and 12 h dark) and were given free access to food and water. Unbalanced maternal nutrition differentially impacted lipid metabolism and phenotypic expression in male and female offspring [
17,
18]. For this reason, the current study only focused on female offspring. The specific study design is shown in
Figure 1. At the end of the experimental period (32 weeks of age), female mice (
n = 8/group) were sacrificed. After 10 h of fasting, the mice were anesthetized (ketamine 100 mg/kg i.p., Pharmacia and Upjohn Ltd., Crawley, UK), and blood samples were collected from the intraorbital retrobulbar plexus Adipose tissue of the offspring was quickly collected and stored at −80 °C for further analysis.
2.2. Serum Chromium Levels
Serum chromium levels in mothers (at weaning) and in the offspring at 32 weeks were determined using an atomic absorption spectrometer (Atomic Absorption Spectrophotometer, Hitachi, Japan).
2.3. Measurement of Body Weight and Food Intake
The body weight of the offspring was recorded at birth, 3 weeks, and 32 weeks of age. Food consumption of the offspring was recorded at 32 weeks. Food consumption was quantified by subtracting the amount of food remaining at the end of the week from the total amount of food given at the beginning of the week. The average amount of food consumed per mouse was determined by dividing the total amount consumed by the number of mice.
2.4. Measurement of Serum Leptin, Adiponectin and Inflammatory Factors
Serum concentrations of leptin, adiponectin, tumor necrosis factor-α (TNF-α), interleukin-6 (IL-6), monocyte chemotactic protein 1 (MCP-1), and interleukin-1β (IL-1β) were measured using enzyme-linked immunosorbent assay (ELISA, Abcam, Cambridge, MA, USA).
2.5. Measurement of Serum Oxidative Stress and Antioxidant Markers
Malondialdehyde (MDA) concentration and reduced/oxidized glutathione (GSH/GSSG) were measured using thiobarbituric acid (TBA) and Thiol Green Indicator fluorometric method (Abcam, Cambridge, MA, USA) as oxidative stress and antioxidant markers, respectively.
2.6. Measurement of Serum Total Cholesterol (TC), Triglyceride (TG), High-Density Lipoproterin Cholesterol (HDL), and Low-Density Lipoprotein Cholesterol (LDL)
Serum TC, TG, HDL, and LDL concentrations were determined using an enzyme end-point method via a commercial kit (Roche Diagnostics, GmbH, Mannheim, Germany).
2.7. Measurement of Adipose Tissue Weight
At 32 weeks, mice were sacrificed and retroperitoneal, mesenteric, and ovarian fat were carefully removed and weighed. The adiposity index (AI) was computed as followings [
19],
2.8. Methyl-DNA Immunoprecipitation and Microarray Hybridization
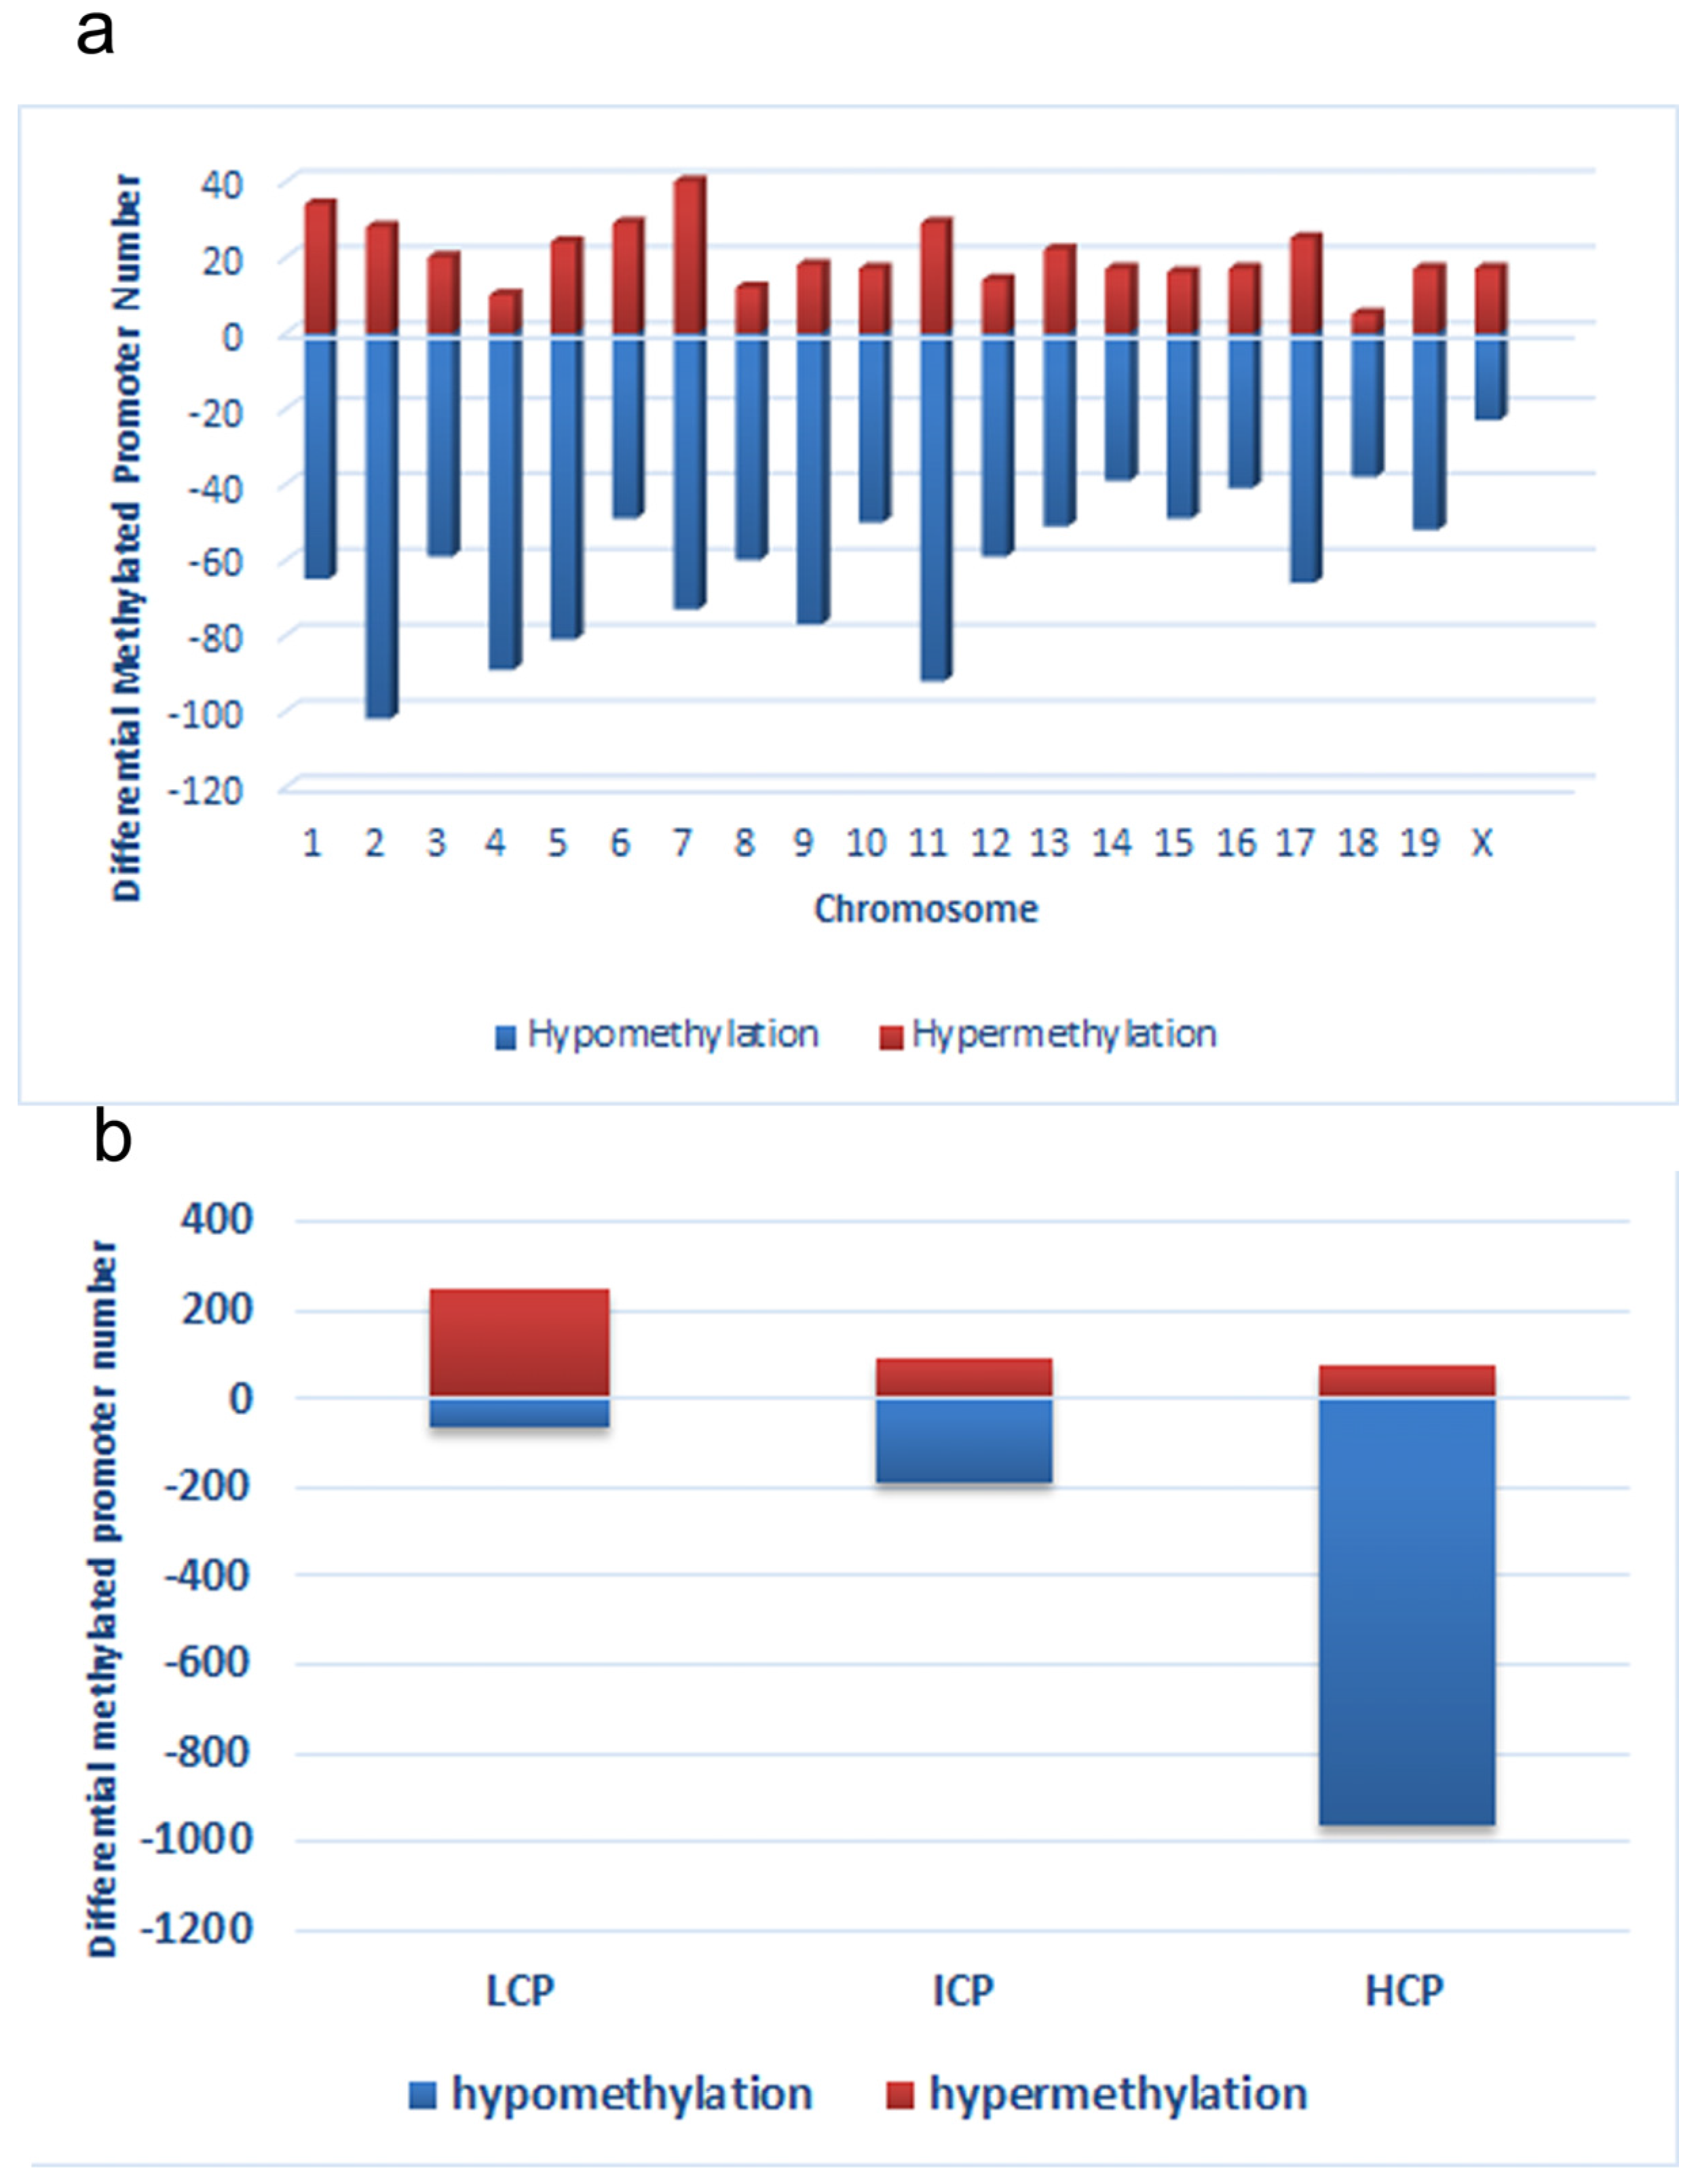
Fat collected from three CC mice and LC mice was used for methyl-DNA immunoprecipitation (MeDIP) experiment. Genomic DNA (gDNA) was extracted from fat samples using a DNeasy Blood & Tissue Kit (Qiangen, Fremont, CA, USA). The purified gDNA was then quantified and quality was assessed using Nanodrop ND-1000 (NanoDrop Technologies, Wilmington, DE, USA). To perform the MeDIP experiment, first, gDNA was sonicated into random 200–1000 bp pieces. Next, 1 µg of fragmented DNA was used for immunoprecipitation with mouse monoclonal anti-5-methylcytidine (Diagenode, Liege, Belgium) at 4 °C overnight. To recover the immunoprecipitated DNA fragments, anti-mouse IgG magnetic beads (ThermoFisher Scientific, Carlsbad, CA, USA) were added and incubated for an additional 2 h at 4 °C with agitation. Then, immunoprecipitated methylated DNA and input gDNA was labeled with Cy5 and Cy3 fluorophores, respectively. Labelled DNA was hybridized to the Arraystar Mouse ReqSeq Promoter Array (Agilent, Waldbronn, Germany). This array contained all well-characterized RefSeq gene (approximately 22,327 genes) promoter regions (from −1300 bp to 500 bp transcription start sites (TSSs)). Finally, arrays were washed and scanned with an Agilent Scanner G2505C (Agilent Technologies, Waldbronn, Germany). After normalization, methylation peaks in the raw data were analyzed using SignalMap software (Roche Diagnostics, GmbH, Mannheim, Germany). We computed the modified Kolmogorov–Smirnov test on the adjacent probes using sliding windows to predict enriched regions across the array. To separate strong CpG islands from weak CpG islands, promoters were categorized into three levels: high CpG promoters/regions (HCP), intermediate CpG promoters/regions (ICP) and low CpG promoters/regions (LCP) [
20].
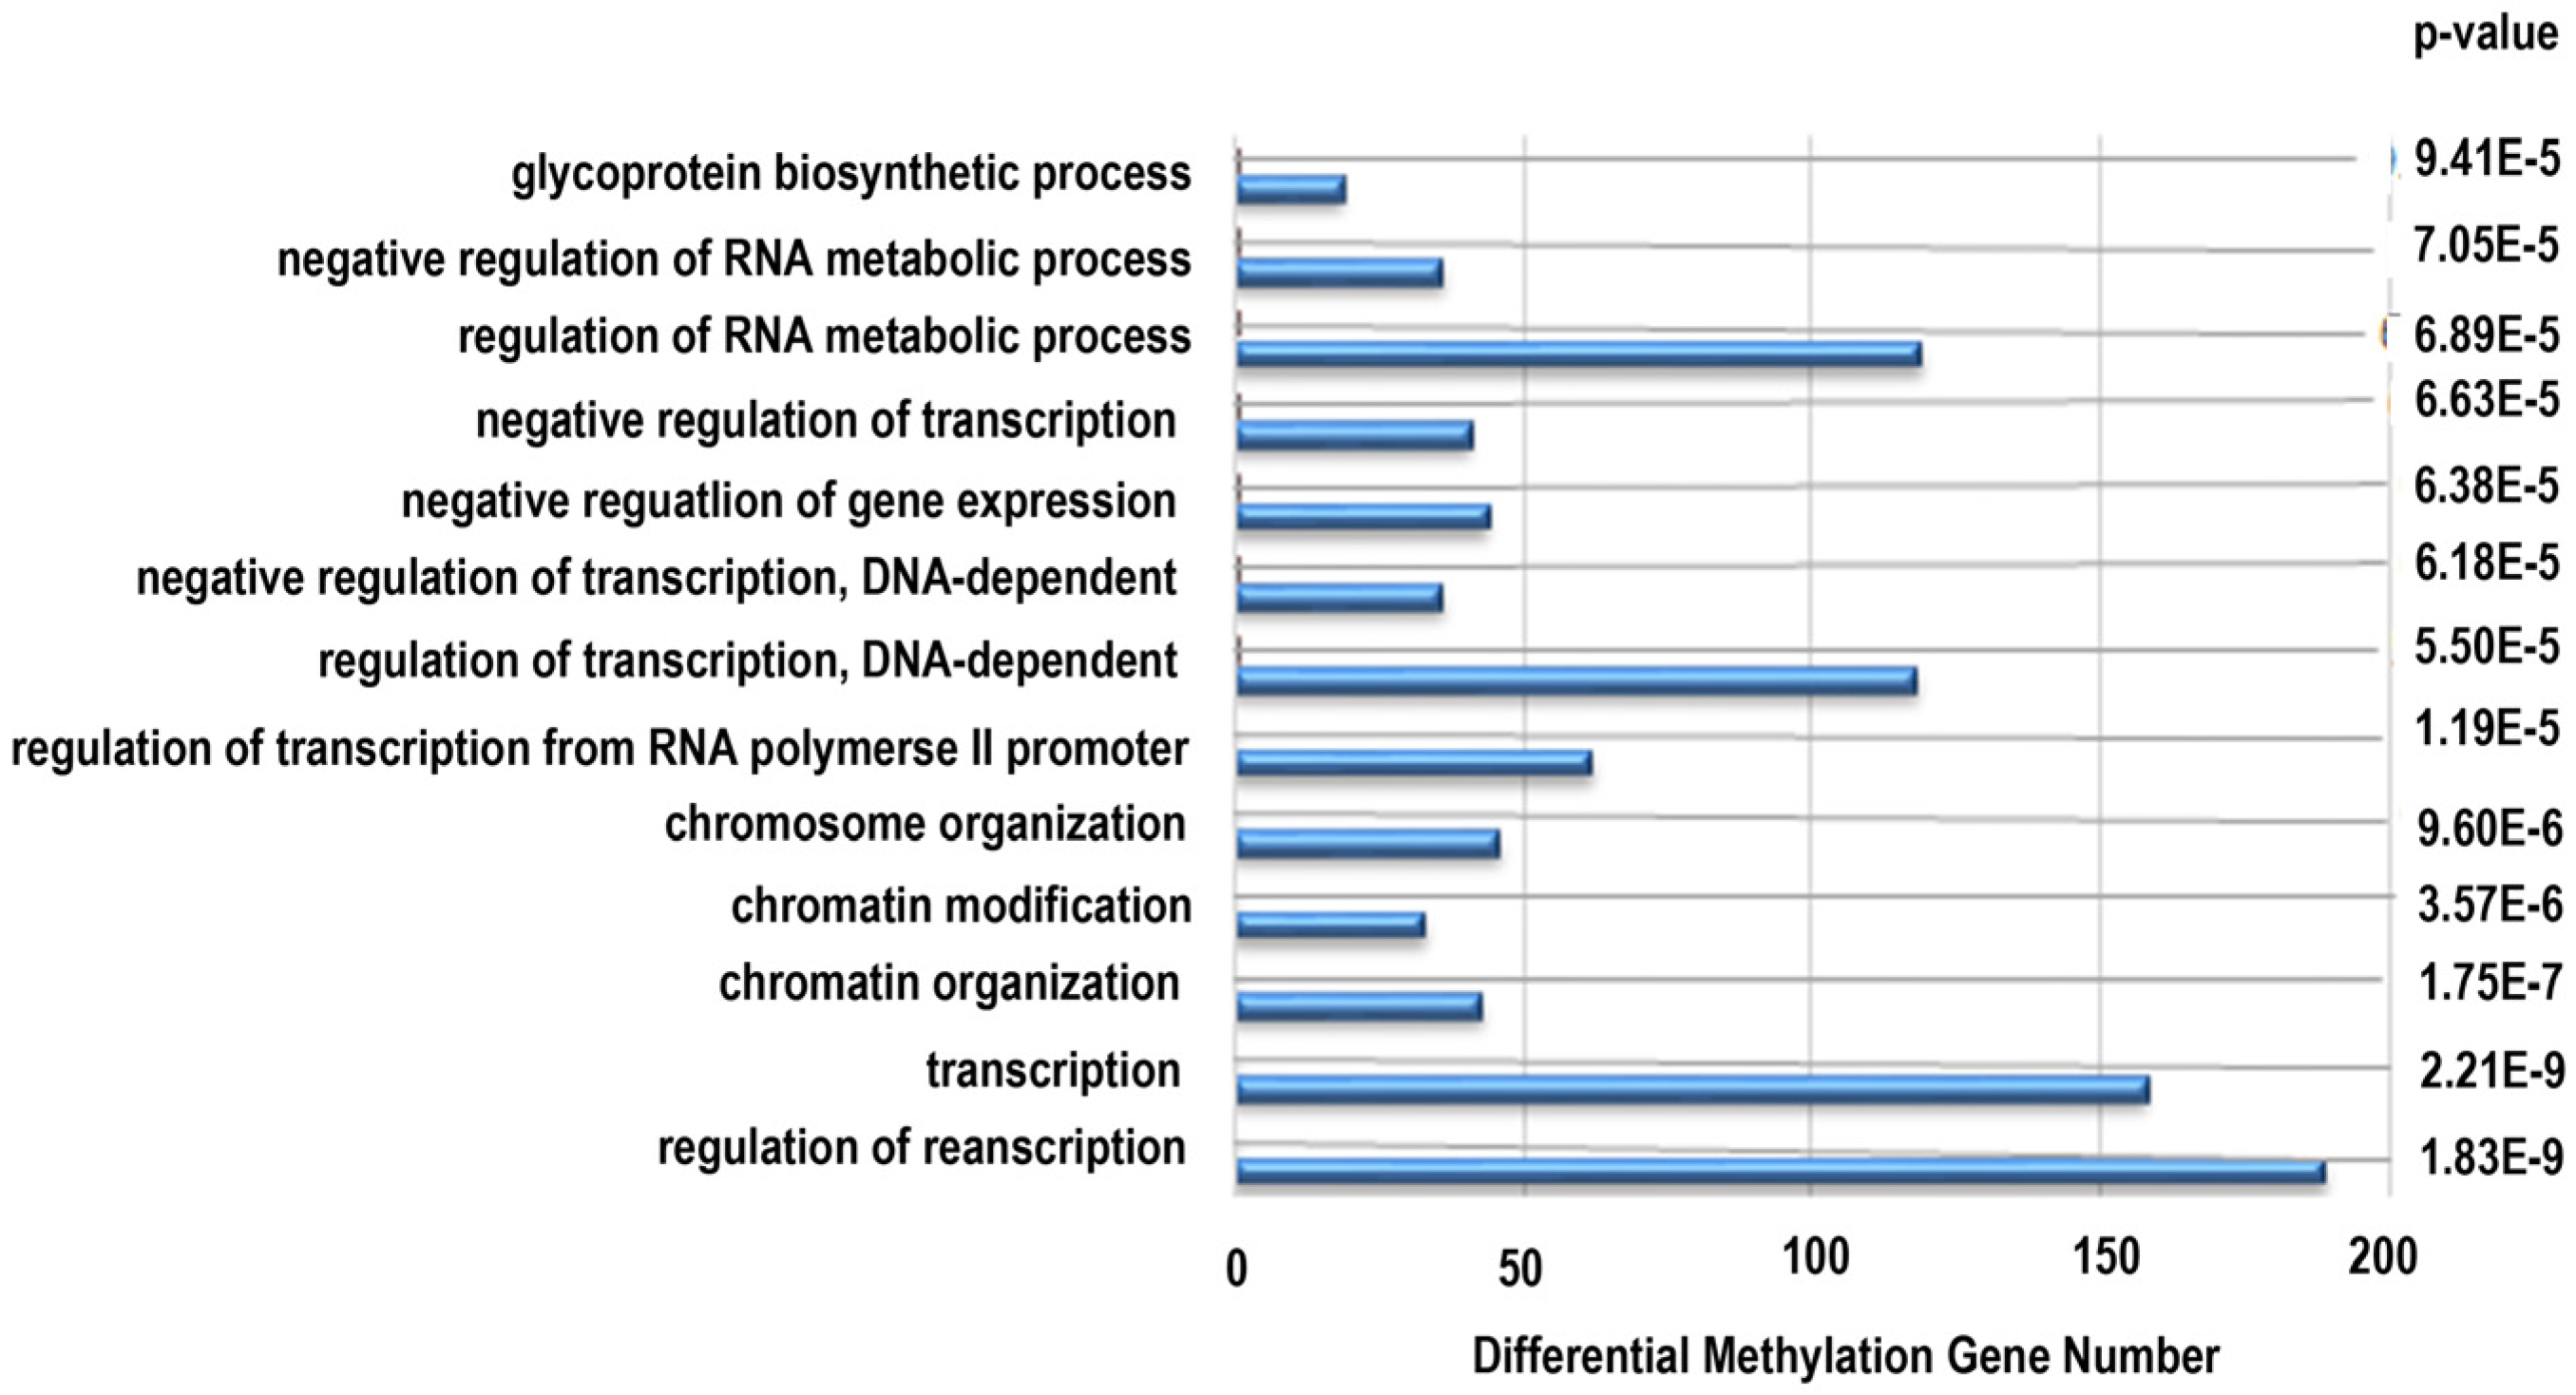
2.9. Differential Methylated Genes Pathway Analysis
To determine the biological meaning to the differentially methylated genes, the subset of methylated genes was analyzed by applying the Gene Ontology (GO) classification system and Kyoto Encyclopedia of Genes and Genomes (KEGG) pathways database using DAVID (Database for Annotation, Visualization and Integrated Discovery) software [
21].
2.10. Bisulfite Sequencing (BSP)
Bisulfite modification was performed with the EZ DNA Methylation Kit (Zymo Research, Hiss Diagnostics, Germany). The converted DNA was then amplified by PCR with primers detailed in
Table 1. Primers were designed using Methyl Primer Express Software version 1.0 (Applied Biosystems, Foster City, CA, USA). PCR products were purified using agarose gels (Invitrogen, Carlsbad, CA, USA) and ligated to the pMD18-T Vector (Takara, Shiga, Japan). The plasmids were then purified using the PureLink Miniprep kit (Invitrogen, Thermo Scientific Inc., Waltham, MA, USA). Positive clones were confirmed by PCR, and a minimum of 10 clones from each mouse (
n = 8 mice/group) were sequenced using ABI PRISM 7700 Sequence Detection (Applied Biosystems, Foster City, CA, USA). Sequence analysis was performed using QUMA [
22].
2.11. Quantitative Real Time RT-PCR
The data (
n = 8/group) were further analyzed for the expression of BSP-validated genes and downstream genes. The total RNA was prepared from fat stored at −80 °C using the Qiagen RNeasy Mini Kit (Qiagen, Germantown, MD, USA). cDNA was synthesized from the reverse transcription of the total RNA using an oligodesoxythymidine primer and the TakaRa RT kit (Takara, Shiga, Japan). The experimental real-time PCR signals were normalized to that of
Gadph gene. Real-time amplification was performed using the ABI 7900 thermocycler (Applied Biosystems, Foster City, CA, USA). The fold change was calculated using the comparative Ct method. The primer sequences for quantitative real-time PCR are shown in
Table 2.
2.12. Statistical Analysis
Results are shown as means ± SD; n represents the number of mice analyzed. Unpaired Student’s t test was used to compare the two groups, and one-way ANOVA followed by Tukey’s post hoc test was used when more than two groups were analyzed. For GO and KEGG pathway analysis, Fisher’s exact test was used. A p value < 0.05 was considered significant. Prism version 5.0 (GraphPad Software Inc., San Diego, CA, USA) was used for statistical analysis.
4. Discussion
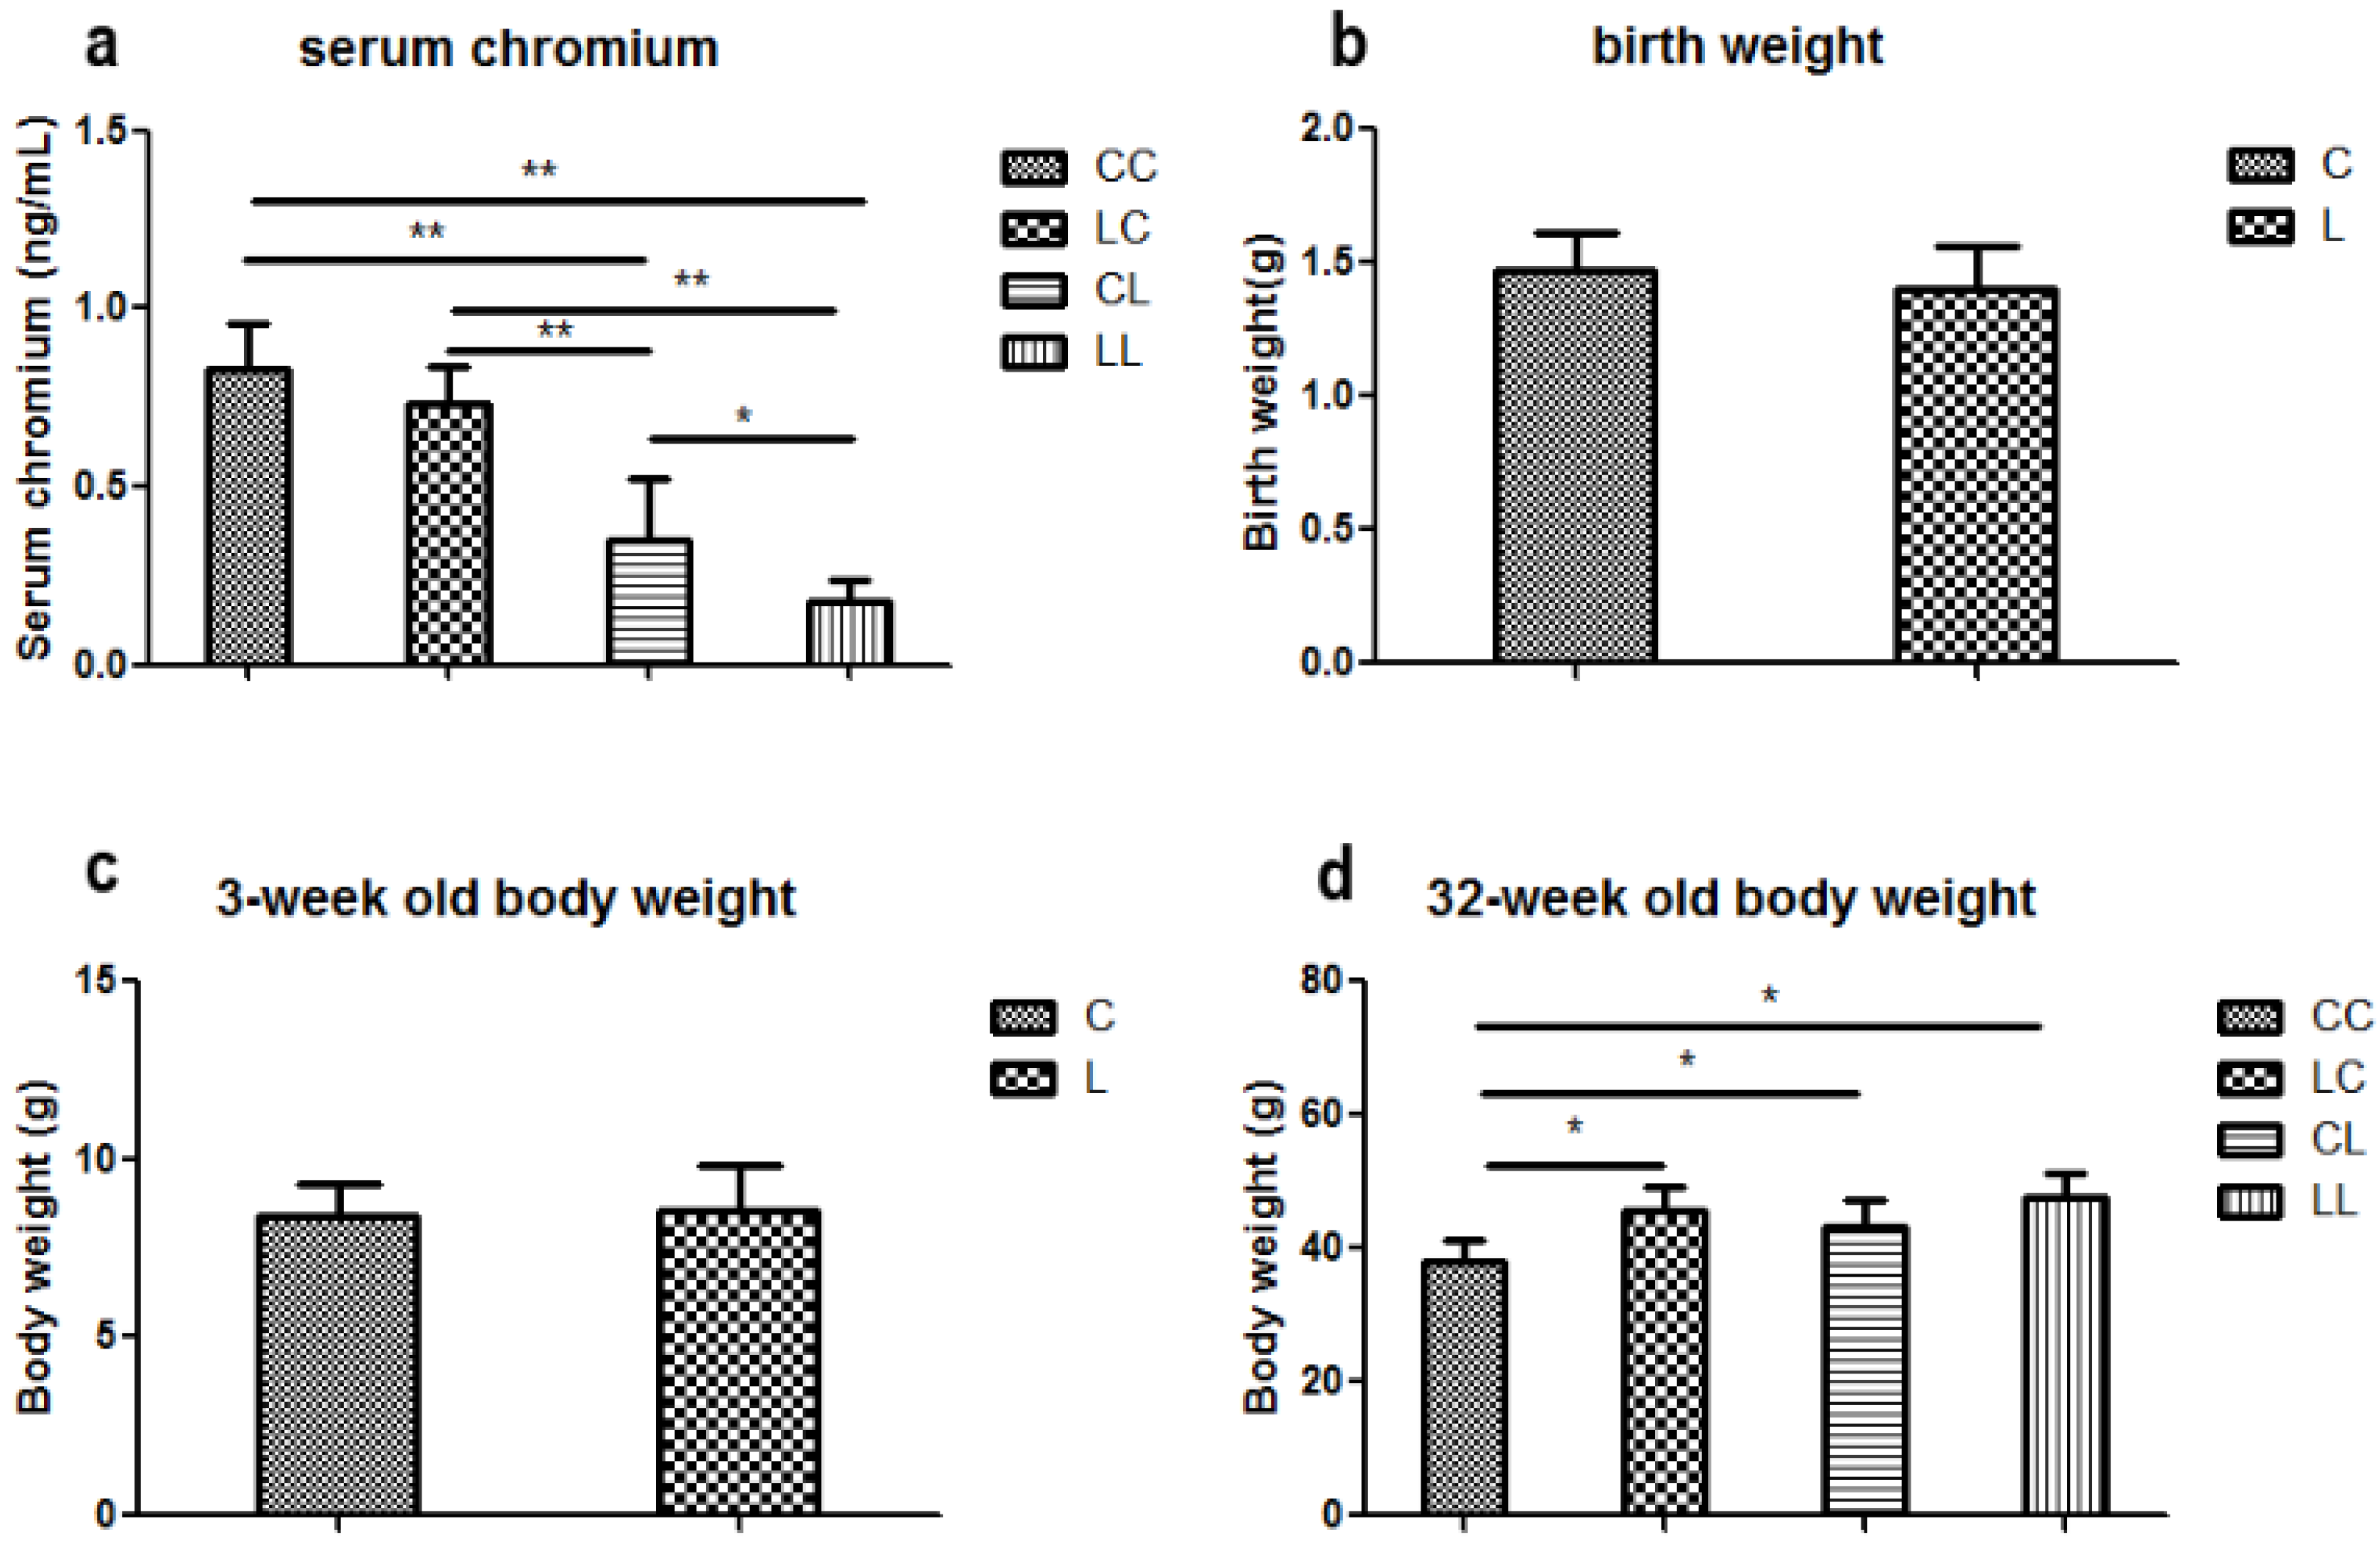
Most importantly, in this study we found that body weight was comparable among the different groups at birth and at 3 weeks of age. However, at 32 weeks, pups from low chromium diet dams were heavier than those of the control group. Switching to the control diet did not correct the body weight increase. Other studies have reported that maternal chromium restriction significantly increased body weight from 12 months of age. Rehabilitation regimes did not correct the change [
16]. It has also been reported that dietary vitamin B
12 restriction increased body weight from weaning [
23].
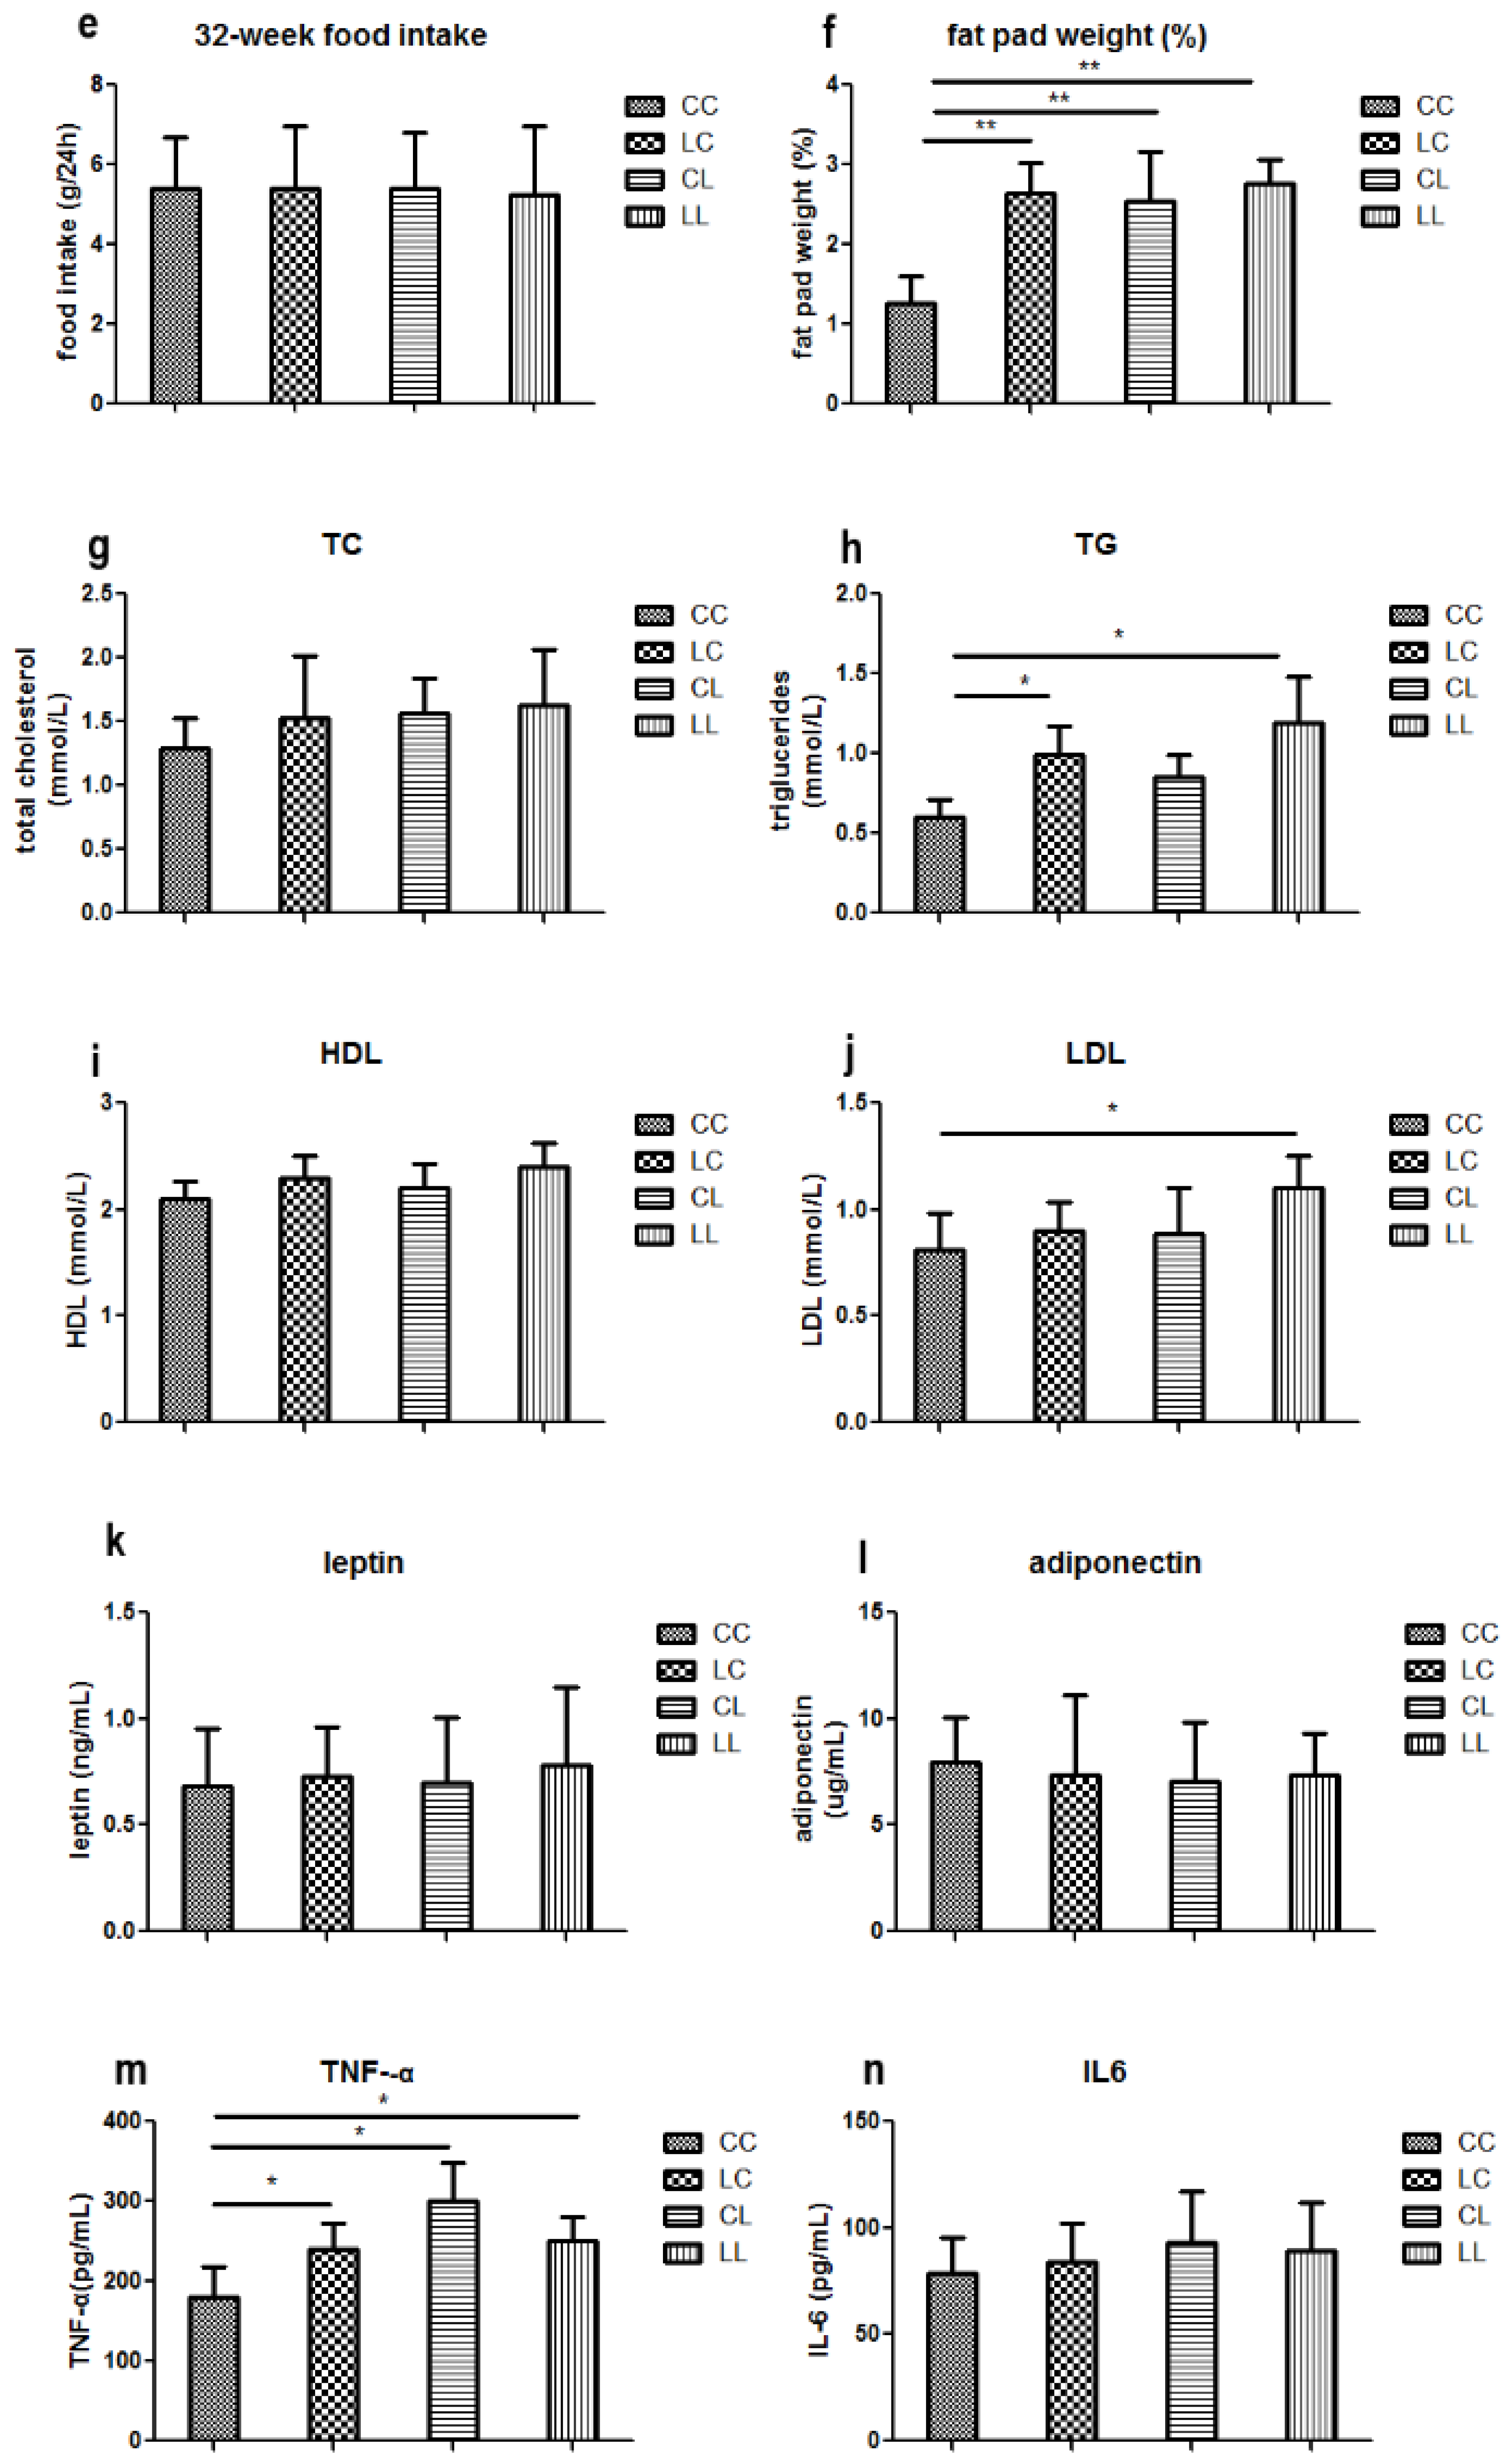
In our study, food intake was comparable among all groups at 32 weeks. However, maternal chromium restriction increased fat pad weight in offspring at 32 weeks of age. Reversing the diet did not correct this change. Venu et al. found that offspring from vitamin-restricted dams had a significantly higher percentage of body adipose from day 100 [
24].
In addition, maternal chromium restriction may increase serum TG and LDL in offspring at 32 weeks of age; reversing the diet corrected LDL levels only. Other groups have found that maternal vitamin or chromium restriction may also significantly increase circulating triglyceride levels [
16,
24].
Moreover, maternal chromium restriction may increase serum TNF-α levels. TNF-α modulates lipid metabolism and is associated with obesity. The long-term effect of maternal magnesium restriction increases plasma TNF-α in offspring at 18 months [
25]. Several groups found that maternal protein restriction upregulated TNF-α expression in the liver and spleen, and increased serum TNF-α from fetal age to adulthood [
26,
27,
28].
Early nutritional exposures can affect later disease risk through the epigenomic changes (DNA methylation, histone modifications, and so on). Although these epigenomic changes do not directly affect the DNA nucleotide sequence, it can be passed on to subsequent generations [
8]. DNA methylation, which usually occurs at cytosines within CpG islands, is a key regulator in gene transcription. CpG islands are usually located in or near the promoters of the genes [
29,
30]. The DNA methylation changes in promoter regions are negatively related to gene expression [
31].
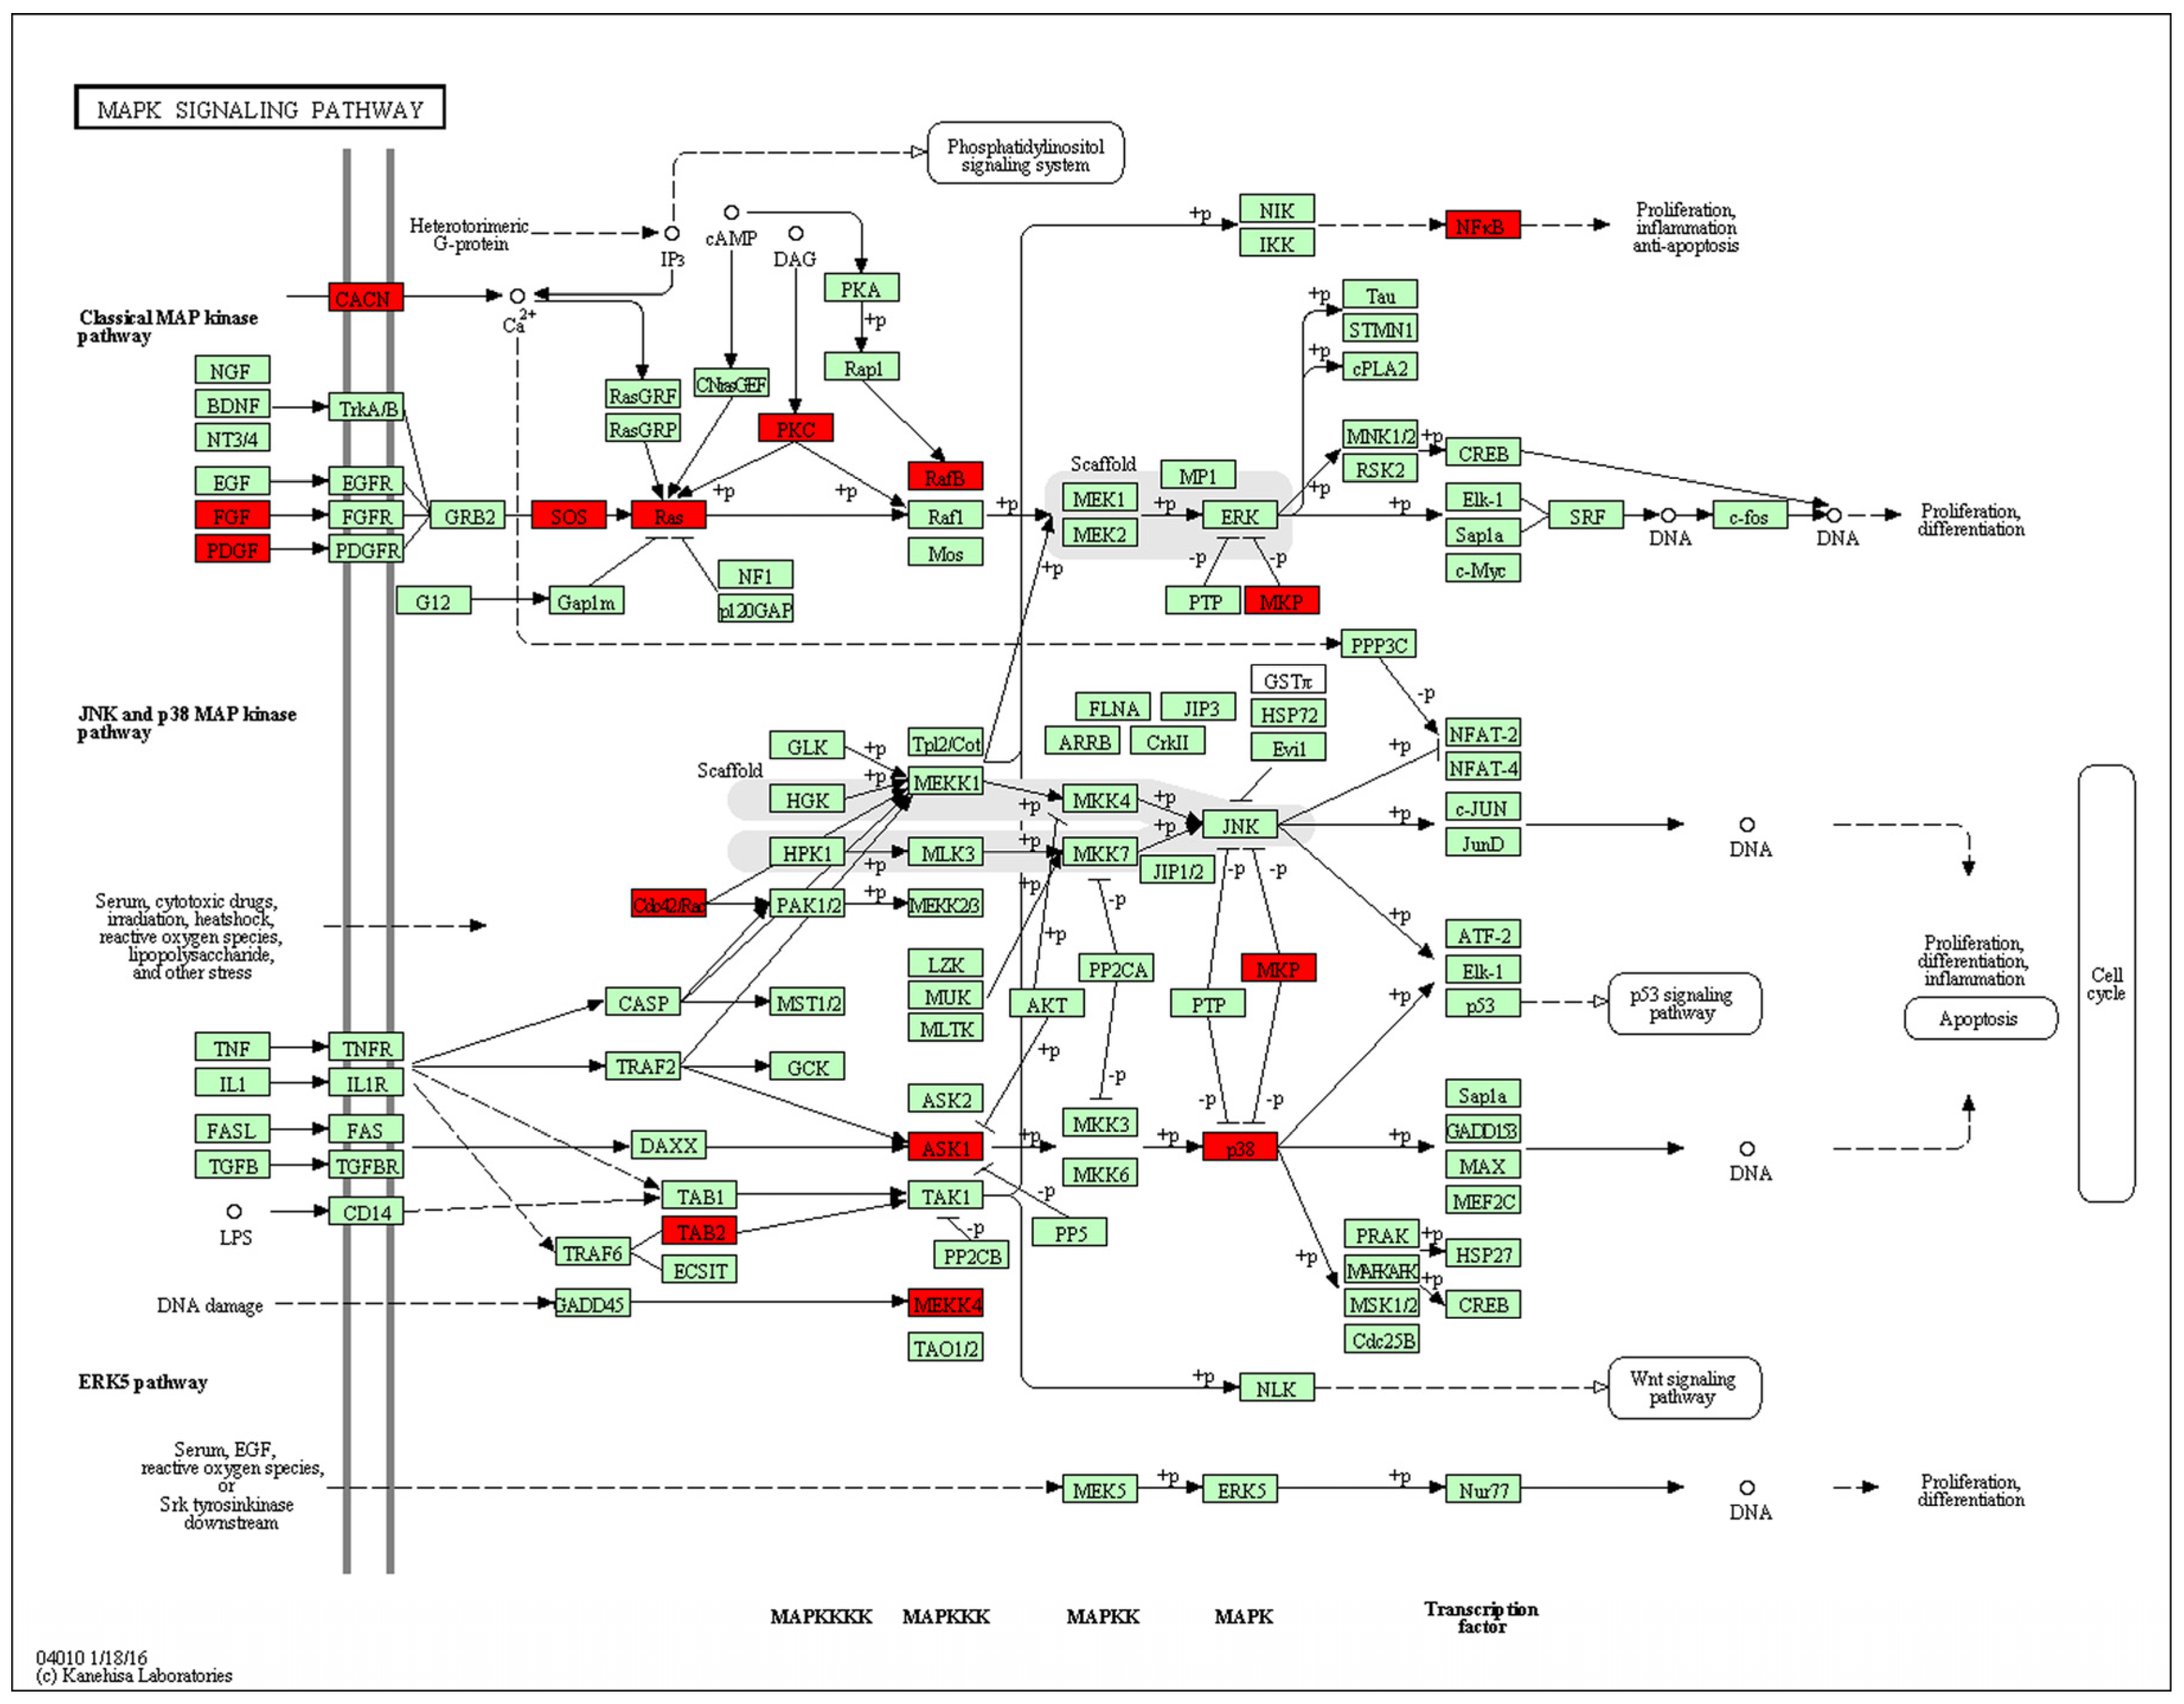
After genome-wide screening for differentially methylated promoters, we found that MAPK signaling was located at the center of many different methylated genes (
Figure 7), such as
Map3k4,
Mapk14,
Map3k5,
Tab2. MAPKs can regulate many cellular processes, such as normal cell proliferation, differentiation, and apoptosis [
32]. More and more evidence shows that MAPK-dependent signal transduction is related to adipogenesis [
33,
34]. The MAPK family consists of three main members: extracellular signal-regulated protein kinases (ERKs), c-Jun N-terminal kinases (JNKs), and p38 kinases. Inflammatory cytokines and many other cellular stresses may activate the p38 MAPK pathway. The p38 MAPK takes part in apoptosis and cell cycle regulation [
35]. Transforming growth factor-β-activated kinase 1 (TAK1) belongs to the MAPK family [
36]. TAK1 activity is regulated by TAB1, TAB2, TAB3, and TAB4 [
37,
38]. The activated TAK1 induces the activation of p38 MAPK. Liu et al. found TNF-α markedly promotes the interaction between TAB2 and TAK1, leading to the phosphorylation of p38 MAPK. Pre-treatment with docosahexaenoic acid (DHA) can block the interaction between TAB2 and TAK1 and can attenuate the TNF-α-induced phosphorylation of ERK [
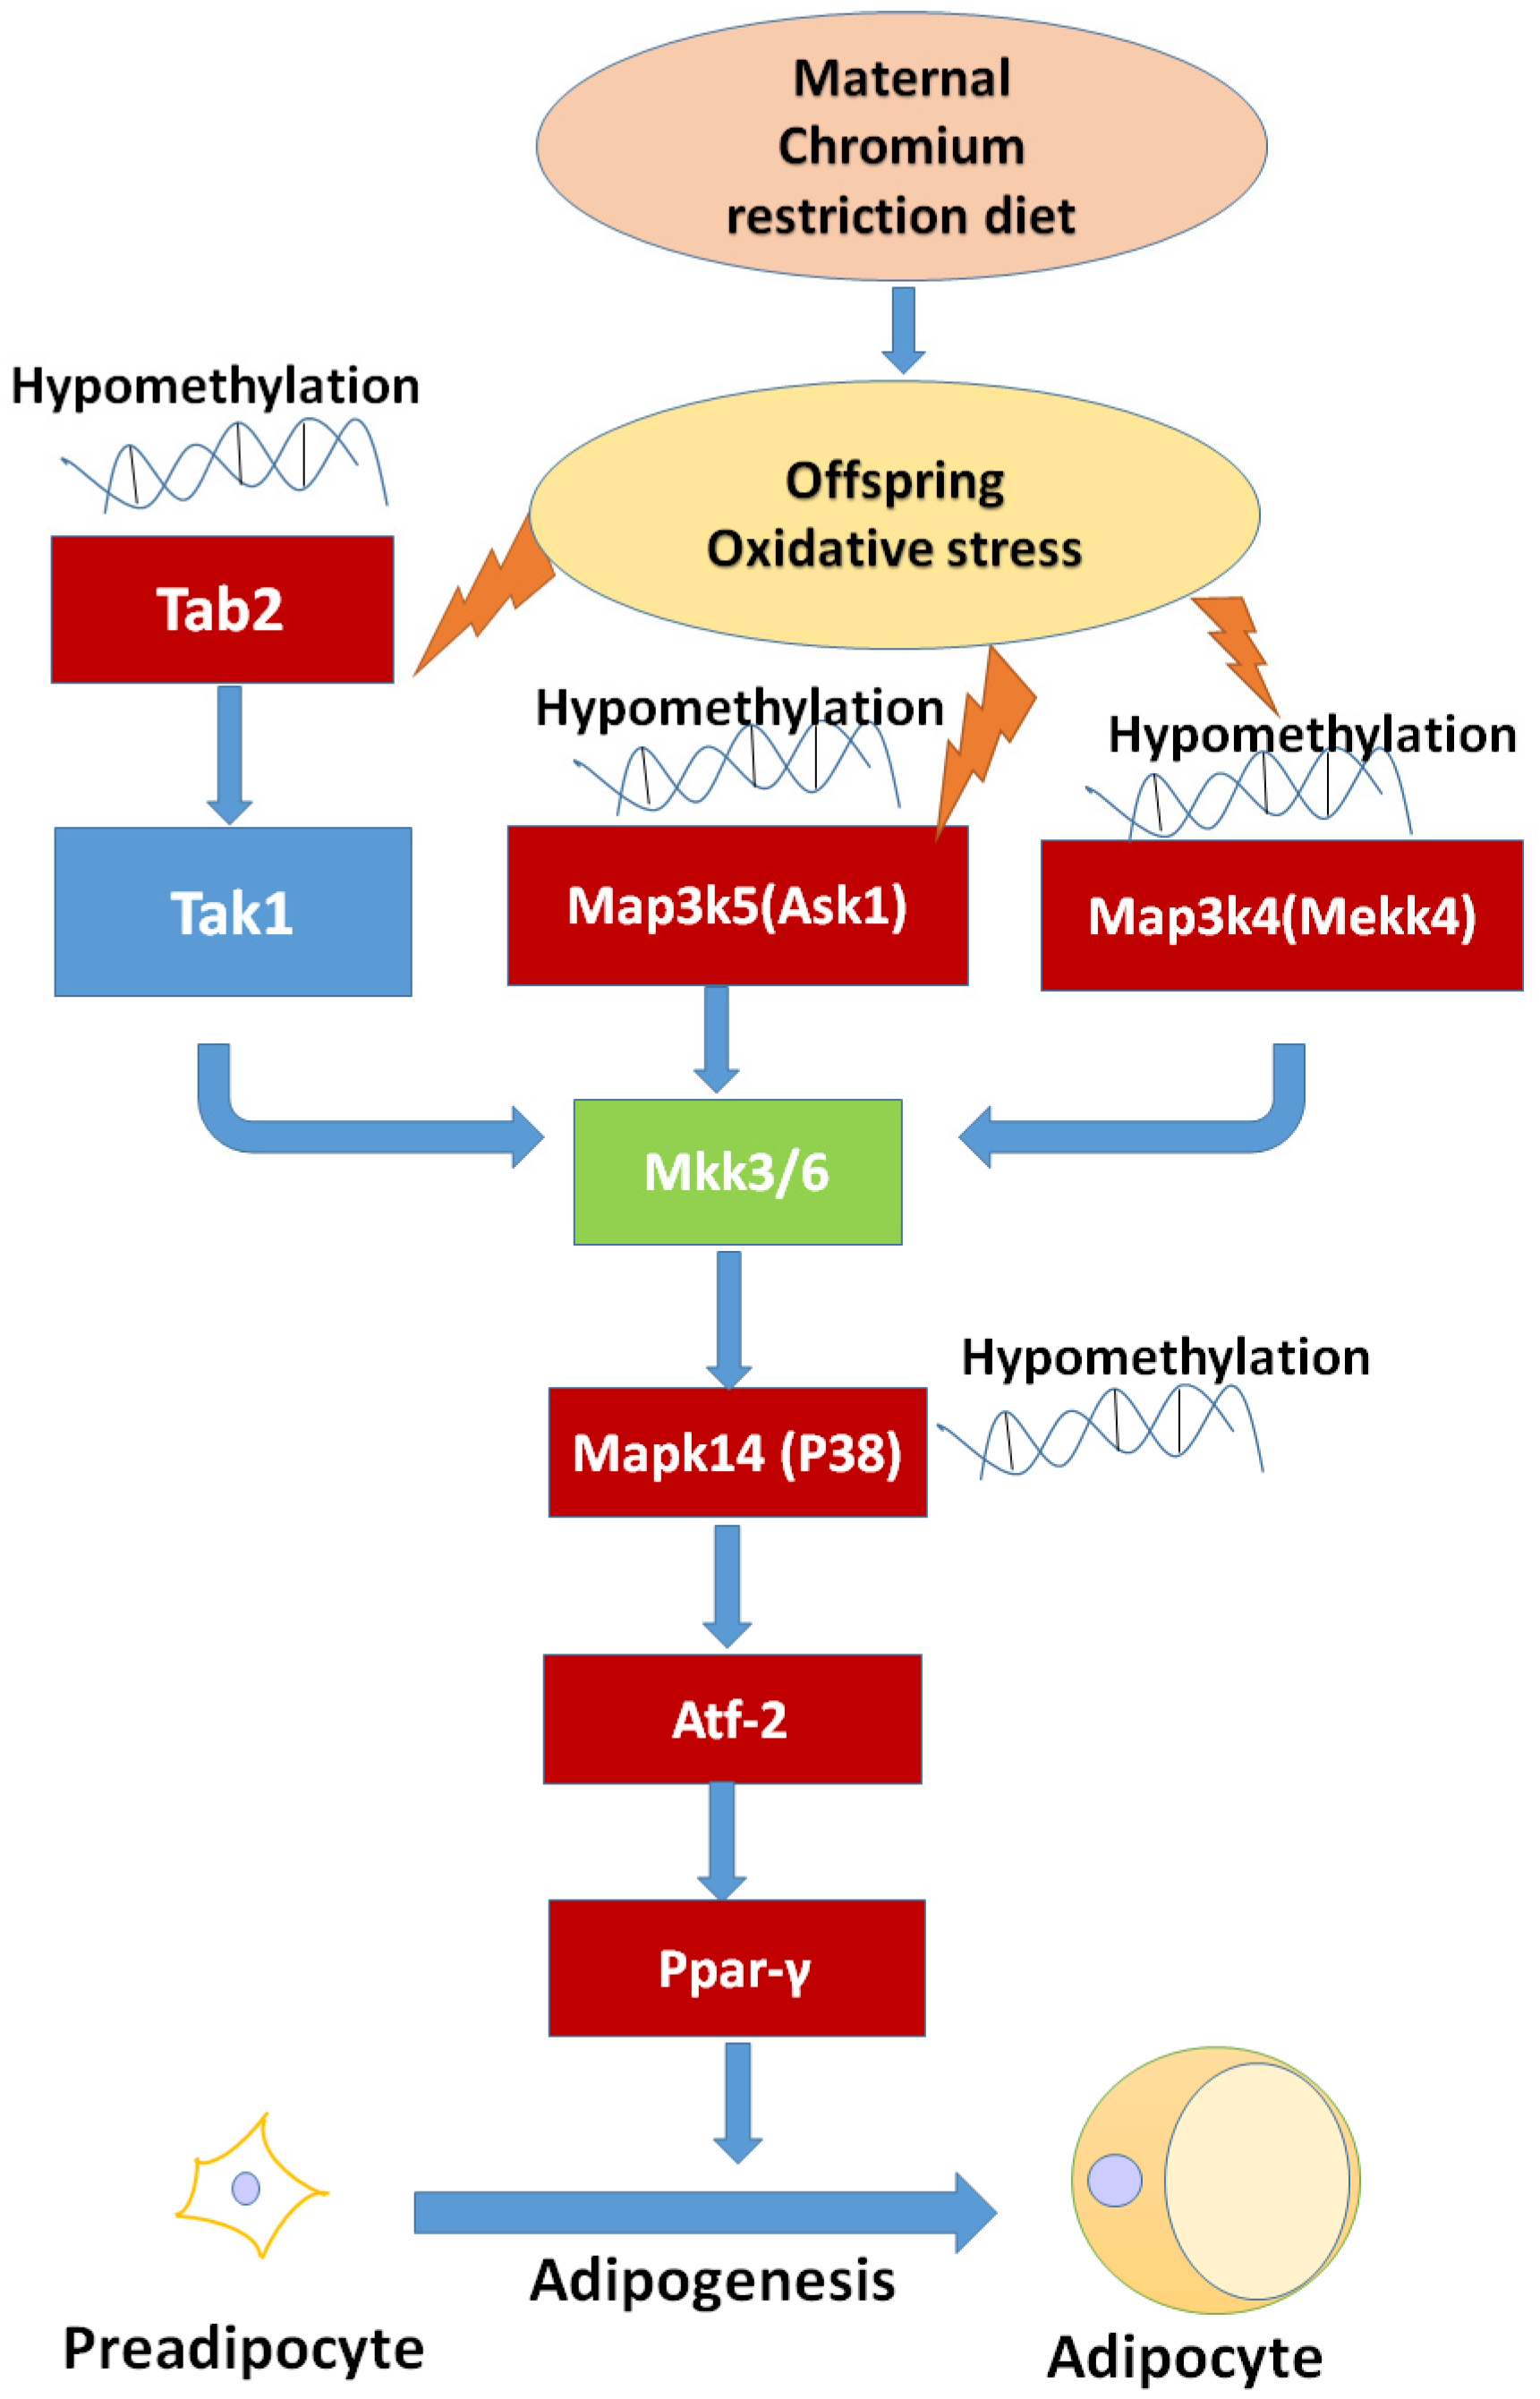
39]. We found that maternal low chromium diet could lead to the demethylation of TAB2 and p38, and activation of
Tab2 and p38 expression. Finer et al. found that maternal gestational diabetes leads to genome-wide DNA methylation difference in the placenta and cord blood of exposed offspring. Pathways involved in MAPK signaling are enhanced in methylation genes [
40].
Nyggf4, which is a newly discovered obesity candidate gene, may regulate the methylation levels of various isoforms of the MAPK subfamily [
41].
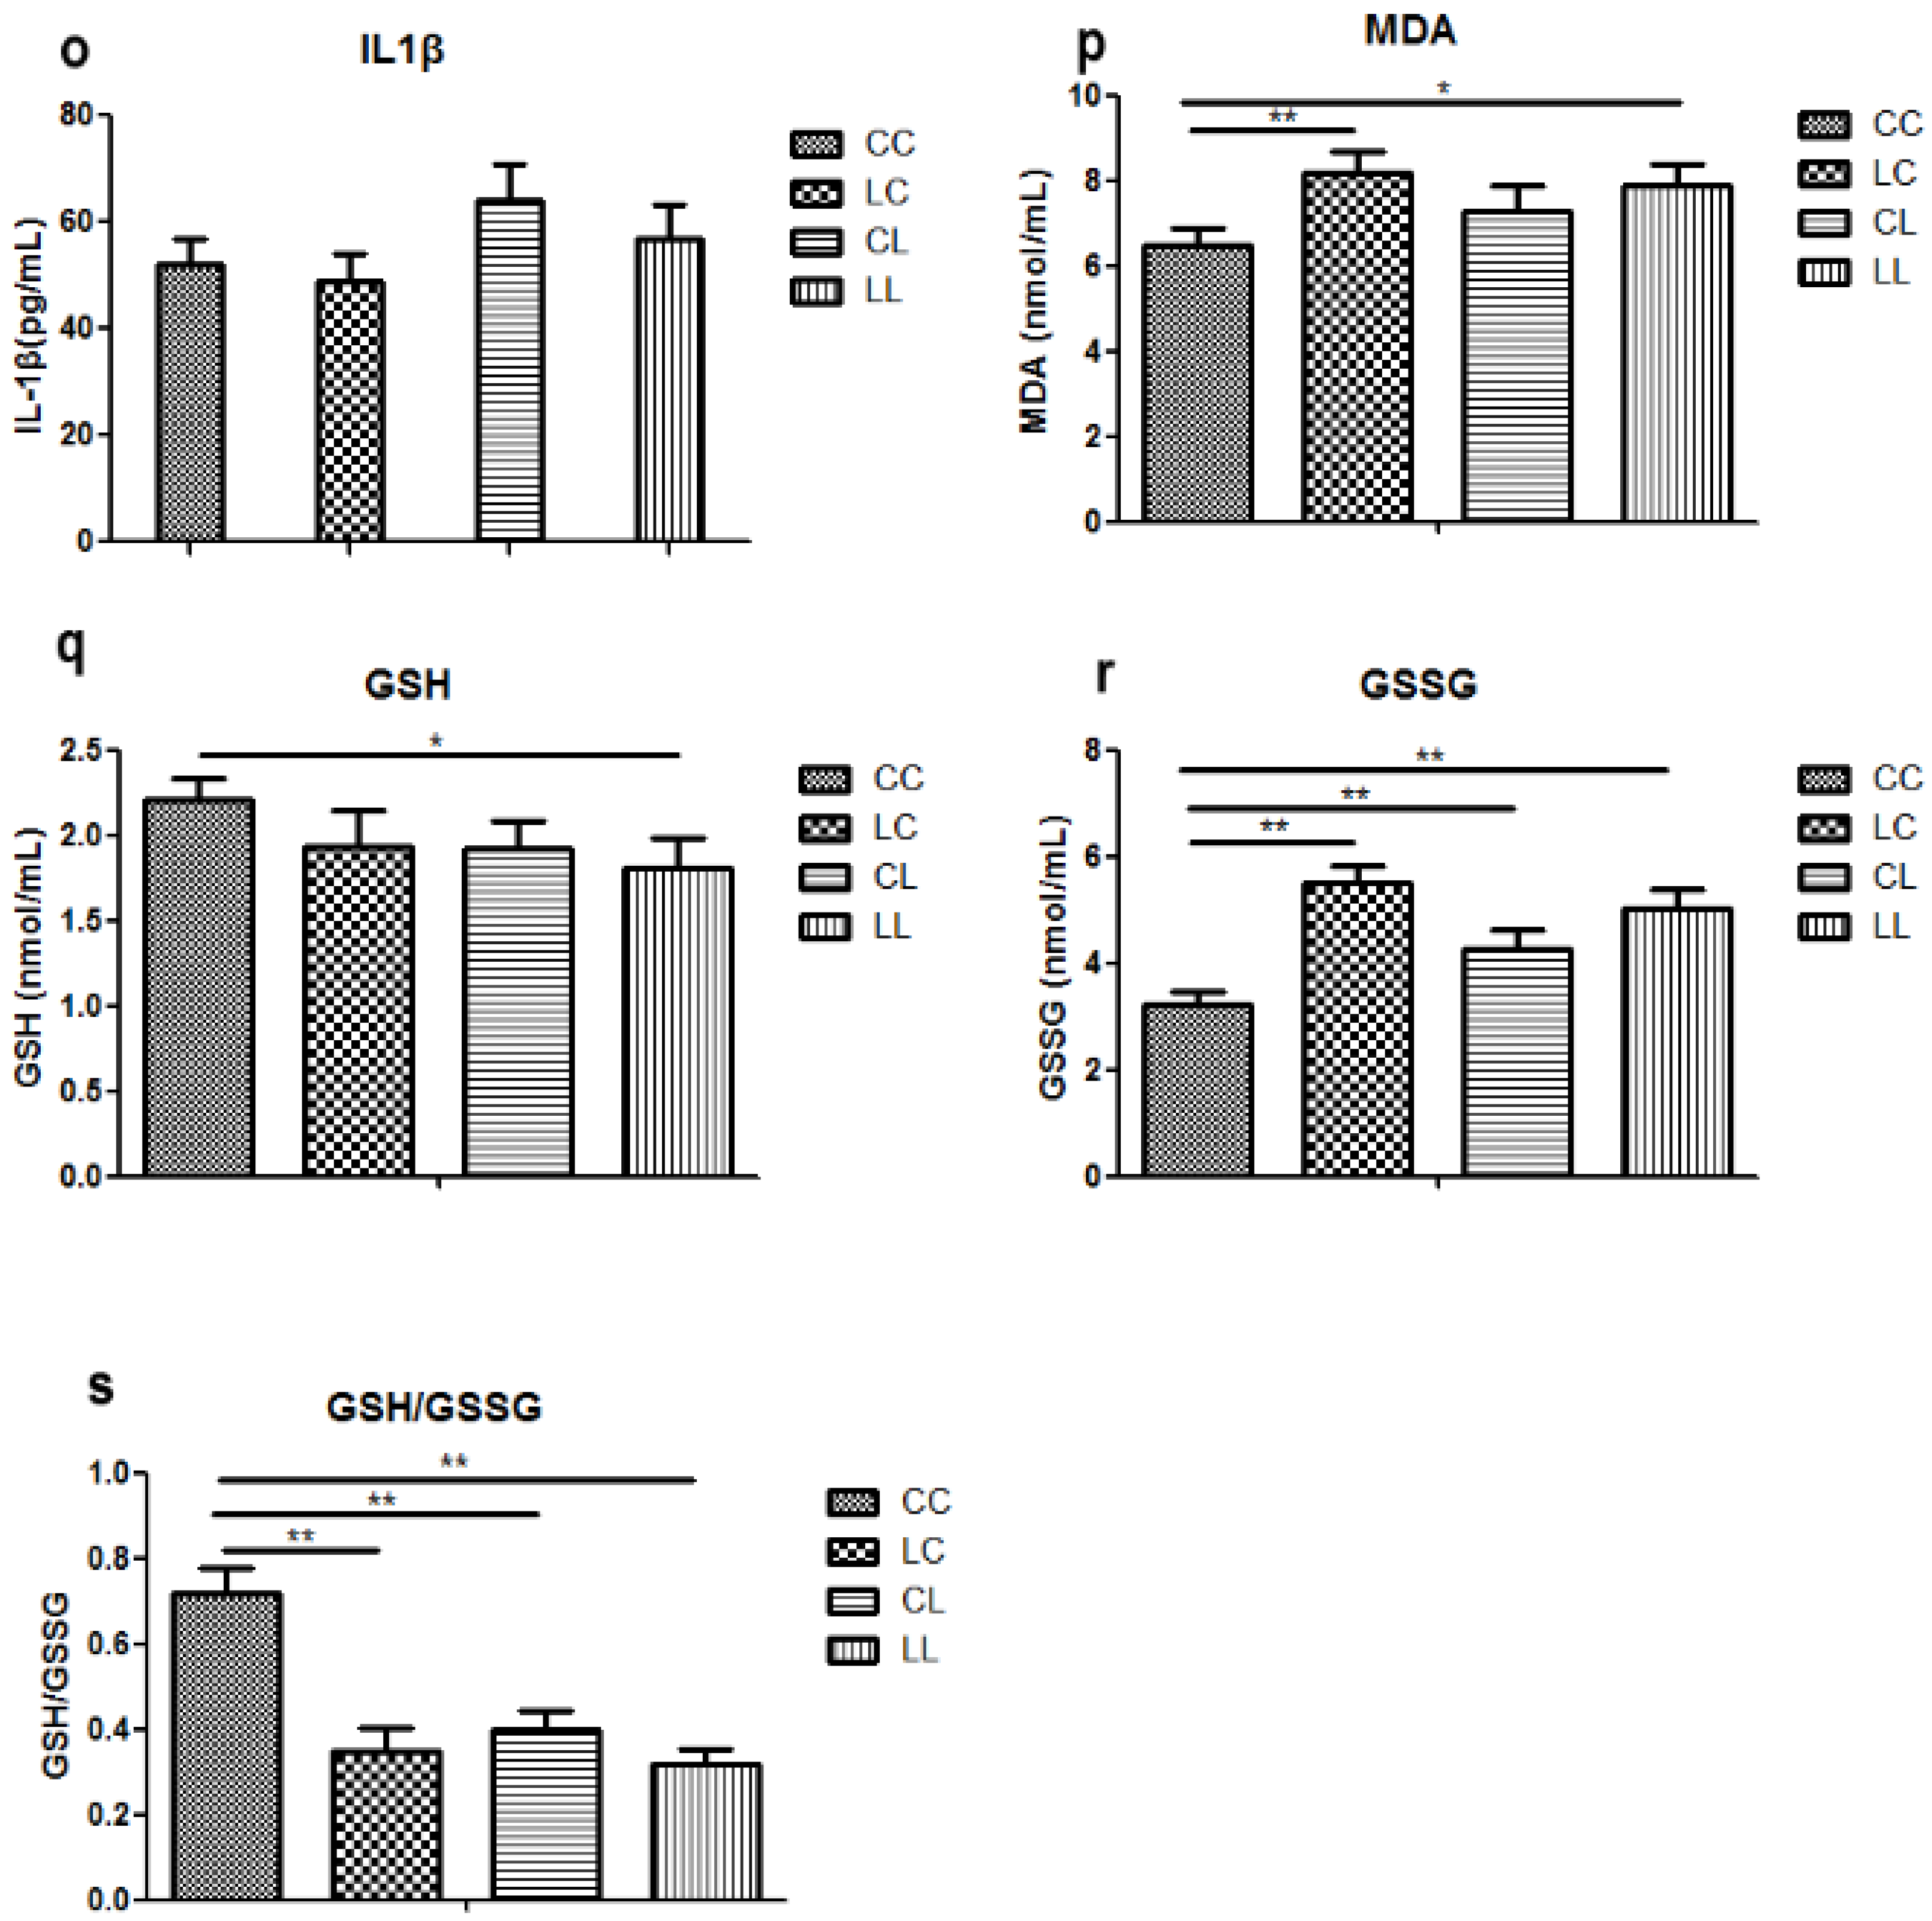
MAPK family is sensible to imbalance of antioxidant system [
42]. Our research found that maternal chromium restriction increased serum MDA level and reduced GSH/GSSG ratio in offspring. Indeed, the measurement of oxidative stress and antioxidant markers is often disturbed by interference from the assay or overestimation derived form stressing analysis conditions. However, MDA is an end-product of lipid hydroperoxide and a widely used marker of the status of oxidative stress [
43]. And GSH is a critical antioxidants in vivo. It can neutralize reactive oxygen species through converting to GSSG. Reduction of the GSH/GSSH ratio is an important biomarker of oxidative stress [
44]. Saben et al. identified pathways affected by oxidative stress significantly increased in placenta from obese women [
45]. Maternal low protein diet increases oxidative stress and reduces anti-oxidant enzyme activity in placenta and fetal livers of rats [
46]. Oxidative stress is one mechanism programming offspring metabolic outcomes.
P38 MAPK can activate PPARγ through activating transcription factor-2 (ATF-2) [
47,
48]. PPARγ is a key transcription factor medicating adipocyte differentiation [
49]. Our result also showed that maternal chromium restriction activate the expression of
Atp2 and
Pparg in adipose of mice offspring. Activated
Pparg induces the expression of lipolytic (lipoprotein lipase) and lipogenic (fatty acid synthase) enzymes, which modulate fatty acid uptake and synthesis [
50,
51]. Increased PPARγ levels are observed in the adipose tissue of obese animals and humans [
52,
53,
54]. Ahmad et al. found a significant upregulation of hepatic PPARγ expression in 12 months old rat pups born to vitamin B12-deficient mothers [
55].


