A Diet Score Assessing Norwegian Adolescents’ Adherence to Dietary Recommendations—Development and Test-Retest Reproducibility of the Score

 ,
,
Abstract
:
1. Introduction
2. Materials and Methods
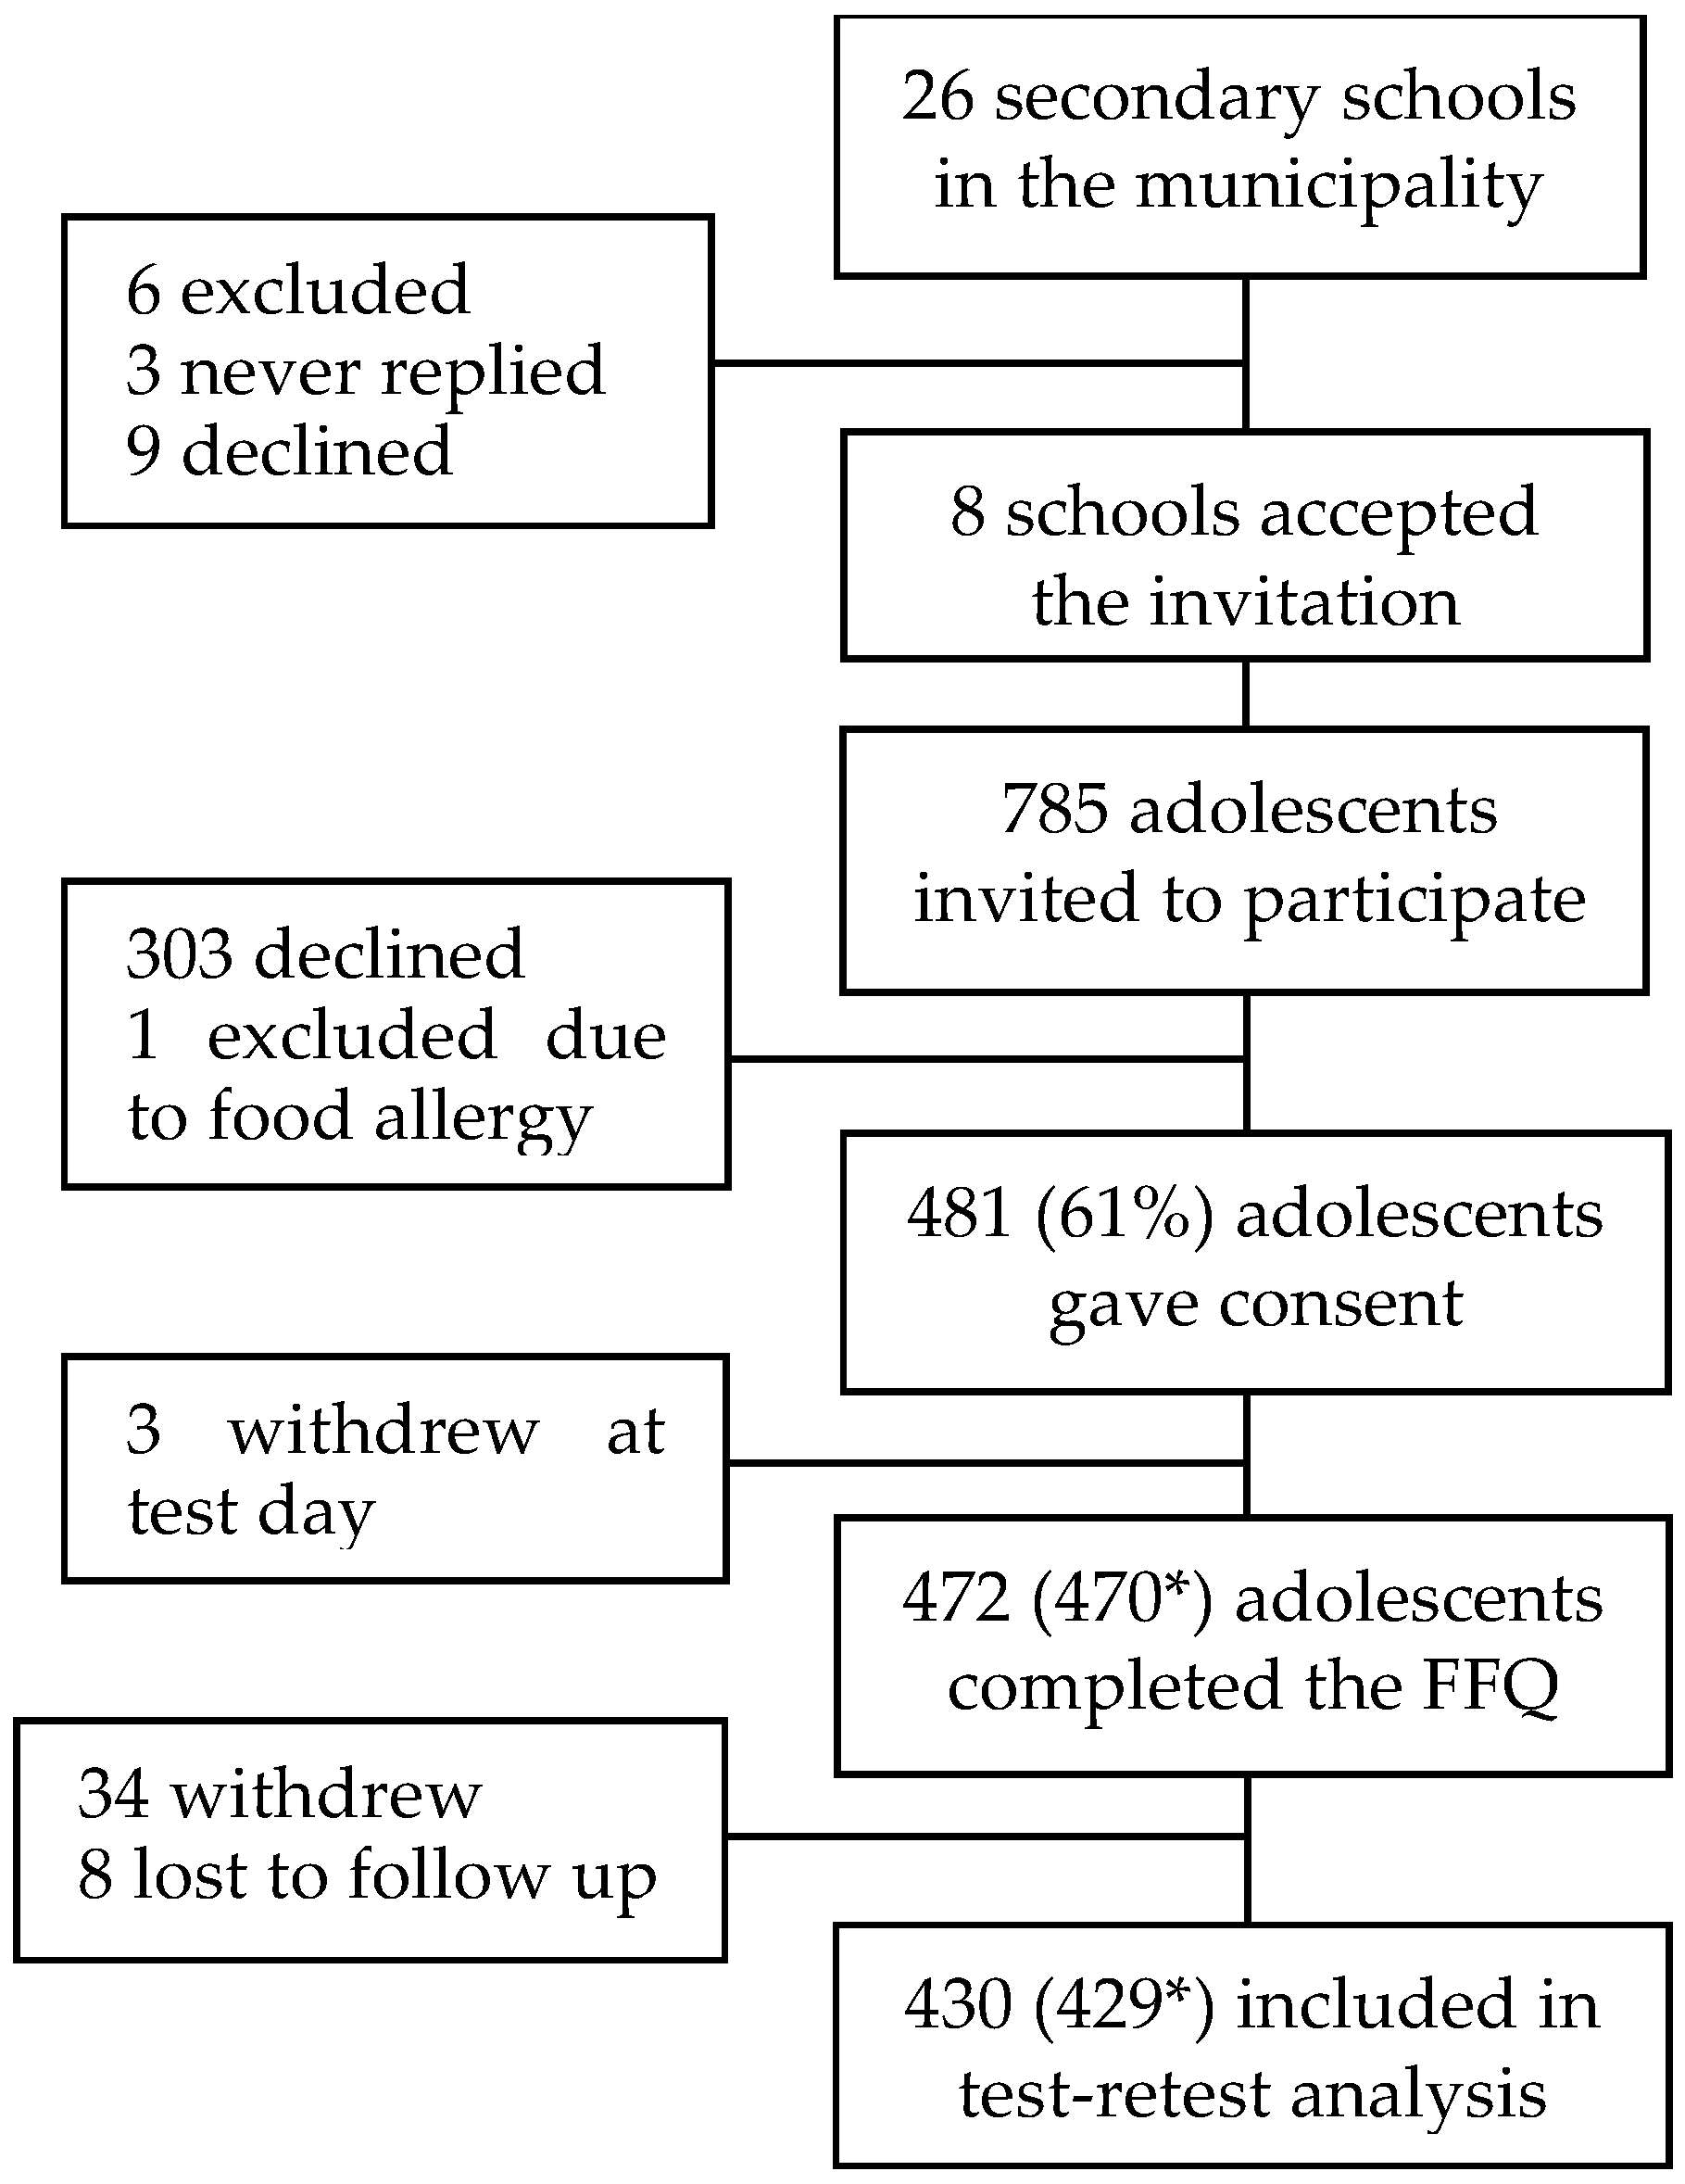
2.1. Study Design and Population
2.2. Online FFQ
2.3. Development of the Diet Score
2.4. Caregivers’ Questionnaire
2.5. Test-Retest
2.6. Statistical Analyses
3. Results
3.1. Participant Characteristics
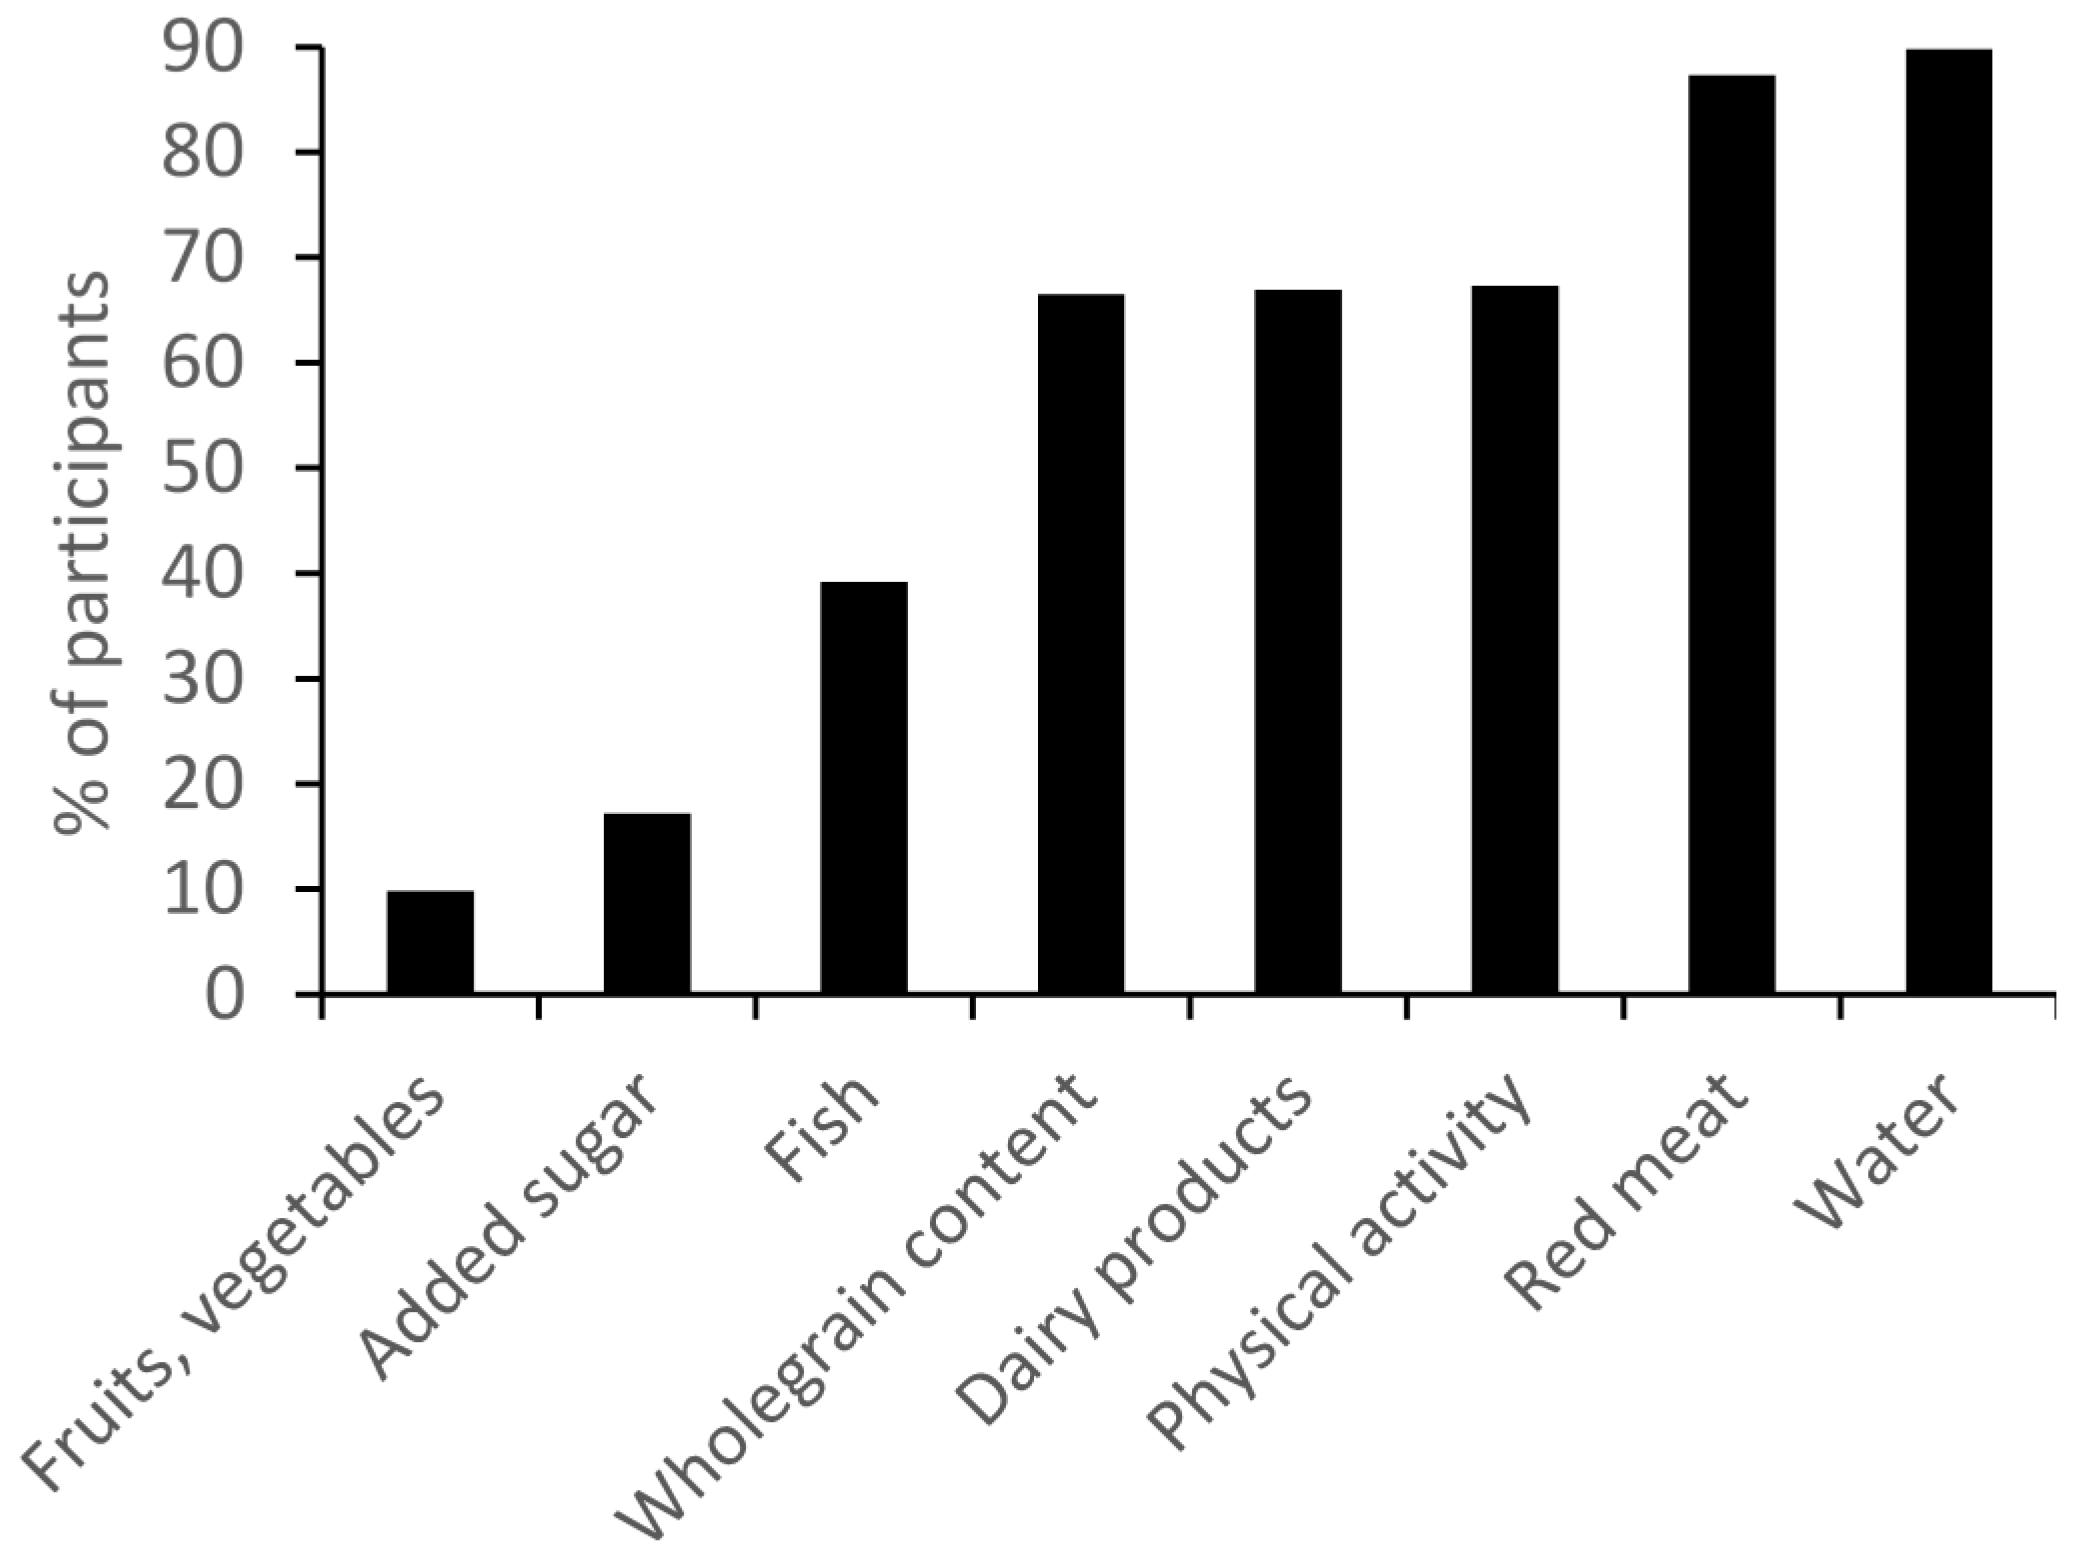
3.2. Adherence to Dietary Recommendations
4. Discussion
5. Conclusions
Supplementary Materials
Acknowledgments
Author Contributions
Conflicts of Interest
References
- Moreno, L.; Gottrand, F.; Huybrechts, I.; Ruiz, J.; Gonzàlez-Gross, M.; DeHenauw, S. Nutrition and lifestyle in European adolescents: The HELENA (healthy lifestyle in europe by nutrition in adolescence) study. Adv. Nutr. 2014, 5, 615S–623S. [Google Scholar] [CrossRef] [PubMed]
- Moreno, L.; Pigeot, I.; Ahrens, W. Epidemiology of Obesity in Children and Adolescents, Prevalence and Etiology, 1st ed.; Springer: New York, NY, USA, 2011; pp. 43–44. [Google Scholar]
- Spear, B. Adolescent growth and development. J. Am. Diet. Assoc. 2002, 102, S23–S29. [Google Scholar] [CrossRef]
- Jasik, C.; Lustig, R. Adolescent obesity and puberty: The “perfect storm”. Ann. N. Y. Acad. Sci. 2008, 1135, 265–279. [Google Scholar] [CrossRef] [PubMed]
- Spear, H.; Kulbok, P. Autonomy and adolescence: A concept analysis. Public Health Nurs. 2004, 21, 144–152. [Google Scholar] [CrossRef] [PubMed]
- Mikkila, V.; Rasanen, L.; Raitakari, O.; Pietinen, P.; Viikari, J. Consistent dietary patterns identified from childhood to adulthood: The cardiovascular risk in young Finns study. Br. J. Nutr. 2005, 93, 923–931. [Google Scholar] [CrossRef] [PubMed]
- Singh, A.; Mulder, C.; Twisk, J.; van Mechelen, W.; Chinapaw, M. Tracking of childhood overweight into adulthood: A systematic review of the literature. Obes. Rev. 2008, 9, 474–488. [Google Scholar] [CrossRef] [PubMed]
- WHO. Who Calls for Stronger Focus on Adolescent Health. Geneva, 2014. Available online: http://www.who.int/mediacentre/news/releases/2014/focus-adolescent-health/en/ (accessed on 8 March 2016).
- Savige, G.; MacFarlane, A.; Ball, K.; Worsley, A.; Crawford, D. Snacking behaviours of adolescents and their association with skipping meals. Int. J. Behav. Nutr. Phys. Act. 2007, 4, 1–9. [Google Scholar] [CrossRef] [PubMed]
- Gibson, R. Principles of Nutritional Assessment, 1st ed.; Oxford University Press, Inc.: New York, NY, USA, 1990; p. 44. [Google Scholar]
- Livingstone, M.; Robson, P.; Wallace, J. Issues in dietary intake assessment of children and adolescents. Br. J. Nutr. 2004, 92, S213–S222. [Google Scholar] [CrossRef] [PubMed]
- Bach, A.; ML, S.; Carrasco, J.; Roman, B.; Ngo, J.; Bertomeu, I.; Obrador, B. The use of indexes evaluating the adherence to the mediterranean diet in epidemiological studies: A review. Public Health Nutr. 2006, 9, 132–146. [Google Scholar] [CrossRef] [PubMed]
- Olsen, A.; Egeberg, R.; Halkjaer, J.; Christensen, J.; Overvad, K.; Tjonneland, A. Healthy aspects of the nordic diet are related to lower total mortality. J. Nutr. 2011, 141, 639–644. [Google Scholar] [CrossRef] [PubMed]
- Hillesund, E.; Bere, E.; Haugen, M.; Øverby, N. Development of a new nordic diet score and its association with gestational weight gain and fetal growth—A study performed in the Norwegian mother and child cohort study (MoBa). Public Health Nutr. 2014, 17, 1909–1918. [Google Scholar] [CrossRef] [PubMed]
- Øverby, N.; Hillesund, E.; Sagedal, L.; Vistad, I.; Bere, E. The fit for delivery study: Rationale for the recommendations and test-retest reliability of a dietary score measuring adherence to 10 specific recommendations for prevention of excessive weight gain during pregnancy. Matern. Child Nutr. 2015, 11, 20–32. [Google Scholar] [CrossRef] [PubMed]
- Guenther, P.; Casavale, K.; Reedy, J.; Kirkpatrick, S.; Hiza, H.; Kuczynski, K.; Kahle, L.; Krebs-Smith, S. Update of the healthy eating index: Hei-2010. J. Acad. Nutr. Diet. 2013, 113, 569–580. [Google Scholar] [CrossRef] [PubMed]
- Van Lee, L.; Geelen, A.; van Huysduynen, E.; de Vries, J.H.; van’t Veer, P.; Feskens, E. The Dutch healthy diet index (DHD-index): An instrument to measure adherence to the Dutch guidelines for a healthy diet. Nutr. J. 2012. [Google Scholar] [CrossRef] [PubMed]
- Roy, R.; Hebden, L.; Rangan, A.; Allman-Farinelli, M. The development, application, and validation of a healthy eating index for Australian adults (HEIFA-2013). Nutrition 2015, 32, 432–440. [Google Scholar] [CrossRef] [PubMed]
- Cole, T.; Flegal, K.; Nicholls, D.; Jackson, A. Body mass index cut offs to define thinness in children and adolescents: International survey. BMJ 2007. [Google Scholar] [CrossRef] [PubMed]
- Cole, T.; Bellizzi, M.; Flegal, K.; Dietz, W. Establishing a standard definition for child overweight and obesity worldwide: International survey. BMJ 2000. [Google Scholar] [CrossRef]
- Helsedirektoratet. Kostråd for å Fremme Folkehelsen og Forebygge Kroniske Sykdommer (Nutrition Recommendations to Promote Public Health and Prevent Chronic Diseases; Helsedirektoratet (Norwegian Directorate of Health): Oslo, Norway, 2011. [Google Scholar]
- Cohen, J. Weighted kappa: Nominal scale agreement with provision for scaled disagreement or partial credit. Psychol. Bull. 1968, 70, 213–220. [Google Scholar] [CrossRef] [PubMed]
- Masson, L.; McNeill, G.; Tomany, J.; Simpson, J.; Peace, H.; Wei, L.; Grubb, D.; Bolton-Smith, C. Statistical approaches for assessing the relative validity of a food-frequency questionnaire: Use of correlation coefficients and the kappa statistic. Public Health Nutr. 2003, 6, 313–321. [Google Scholar] [CrossRef] [PubMed]
- Hu, F. Dietary pattern analysis: A new direction in nutritional epidemiology. Curr. Opin. Lipidol. 2002, 13, 3–9. [Google Scholar] [CrossRef] [PubMed]
- Cade, J.; Thompson, R.; Burley, V.; Warm, D. Development, validation and utilisation of food-frequency questionnaires—A review. Public Health Nutr. 2002, 5, 567–587. [Google Scholar] [CrossRef] [PubMed]
- Banerjee, A.; Chaudhury, S. Statistics without tears: Populations and samples. Ind. Psychiatry J. 2010, 19, 60–65. [Google Scholar] [CrossRef] [PubMed]
- Flood, V.; Smith, W.; Webb, K.; Mitchell, P. Issues in assessing the validity of nutrient data obtained from a food-frequency questionnaire: Folate and vitamin b12 examples. Public Health Nutr. 2004, 7, 751–756. [Google Scholar] [CrossRef] [PubMed]
- Kobe, H.; Krzisnik, C.; Mis, N. Under- and over-reporting of energy intake in Slovenian adolescents. J. Nutr. Educ. Behav. 2012, 44, 574–583. [Google Scholar] [CrossRef] [PubMed]
- Freedman, L.; Commins, J.; Moler, J.; Willett, W.; Tinker, L.; Subar, A.; Spiegelman, D.; Rhodes, D.; Potischman, N.; Neuhouser, M.; et al. Pooled results from 5 validation studies of dietary self-report instruments using recovery biomarkers for potassium and sodium intake. Am. J. Epidemiol. 2015, 181, 473–487. [Google Scholar] [CrossRef] [PubMed]
- Golley, R.; Hendrie, G.; McNaughton, S. Scores on the dietary guideline index for children and adolescents are associated with nutrient intake and socio-economic position but not adiposity. J. Nutr. 2011, 141, 1340–1347. [Google Scholar] [CrossRef] [PubMed]
- Diethelm, K.; Jankovic, N.; Moreno, L.; Huybrechts, I.; de Henauw, S.; de Vriendt, T.; Gonzalez-Gross, M.; Leclercq, C.; Gottrand, F.; Gilbert, C.; et al. Food intake of european adolescents in the light of different food-based dietary guidelines: Results of the HELENA (healthy lifestyle in europe by nutrition in adolescence) study. Public Health Nutr. 2012, 15, 386–398. [Google Scholar] [CrossRef] [PubMed]
- Wang, X.; Ouyang, Y.; Liu, J.; Zhu, M.; Zhao, G.; Bao, W.; Hu, F. Fruit and vegetable consumption and mortality from all causes, cardiovascular disease, and cancer: Systematic review and dose-response meta-analysis of prospective cohort studies. BMJ 2014, 349, g4490. [Google Scholar] [CrossRef] [PubMed]
- Currie, C.; Zanotti, C.; Morgan, A.; Currie, D.; de Looze, M.; Roberts, C.; Samdal, O.; Smith, O.; Barnekow, V. Social Determinants of Health and Well-Being among Young People. Health Behaviour in School-Aged Children (hbsc) Study: International Report from the 2009/2010 Survey. Copenhagen, WHO Regional Office for Europe, 2012 (Health Policy for Children and Adolescents, No. 6). Available online: http://www.euro.who.int/__data/assets/pdf_file/0003/163857/Social-determinants-of-health-and-well-being-among-young-people.pdf (accessed on 6 April 2016).
- WHO; Lobstein, T. Reducing Consumption of Sugar-Sweetened Beverages to Reduce the Risk of Childhood Overweight and Obesity. WHO, 2014. Available online: http://www.who.int/elena/titles/commentary/ssbs_childhood_obesity/en/ (accessed on 4 April 2016).
- Vartanian, L.; Schwartz, M.; Brownell, K. Effects of soft drink consumption on nutrition and health: A systematic review and meta-analysis. Am. J. Public Health 2007, 97, 667–675. [Google Scholar] [CrossRef] [PubMed]
- Darmon, N.; Drewnowski, A. Does social class predict diet quality? Am. J. Clin. Nutr. 2008, 87, 1107–1117. [Google Scholar] [PubMed]
- Skårdal, M.; Western, I.; Ask, A.; Øverby, N. Socioeconomic differences in selected dietary habits among Norwegian 13–14 year-olds: A cross-sectional study. Food Nutr. Res. 2014. [Google Scholar] [CrossRef] [PubMed] [Green Version]
- Overby, N.; Johannesen, E.; Jensen, G.; Skjaevesland, A.; Haugen, M. Test-retest reliability and validity of a web-based food-frequency questionnaire for adolescents aged 13–14 to be used in the Norwegian mother and child cohort study (MoBa). Food Nutr. Res. 2014. [Google Scholar] [CrossRef] [Green Version]
- Bjerregaard, A.; Tetens, I.; Olsen, S.; Halldorsson, T. Reproducibility of a web-based FFQ for 13- to 15-year-old Danish adolescents. J. Nutr. Sci. 2016, 5, e5. [Google Scholar] [CrossRef] [PubMed] [Green Version]
- Xia, W.; Sun, C.; Zhang, L.; Zhang, X.; Wang, J.; Wang, H.; Wu, L.; Song, Y. Reproducibility and relative validity of a food frequency questionnaire developed for female adolescents in Suihua, North China (FFQ for female adolescents). PLoS ONE 2011, 6, e19656. [Google Scholar] [CrossRef] [PubMed]
- Bland, J.M.; Altman, D. Statistical methods for assessing agreement between two methods of clinical measurement. Lancet 1986, 1, 307–310. [Google Scholar] [CrossRef]
- Waijers, P.M.; Feskens, E.; Ock, M. A critical review of predefined diet quality scores. Br. J. Nutr. 2007, 97, 219–231. [Google Scholar] [CrossRef] [PubMed]
- Lacoppidan, S.; Kyro, C.; Loft, S.; Helnaes, A.; Christensen, J.; Hansen, C.; Dahm, C.; Overvad, K.; Tjonneland, A.; Olsen, A. Adherence to a healthy nordic food index is associated with a lower risk of type-2 diabetes—The Danish diet, cancer and health cohort study. Nutrients 2015, 7, 8633–8644. [Google Scholar] [CrossRef] [PubMed]
- Harmon, B.; Boushey, C.; Shvetsov, Y.; Ettienne, R.; Reedy, J.; Wilkens, L.; le Marchand, L.; Henderson, B.; Kolonel, L. Associations of key diet-quality indexes with mortality in the multiethnic cohort: The dietary patterns methods project. Am. J. Clin. Nutr. 2015, 101, 587–597. [Google Scholar] [CrossRef] [PubMed]
- Oddy, W.; Robinson, M.; Ambrosini, G.; O′Sullivan, T.; de Klerk, N.; Beilin, L.; Silburn, S.; Zubrick, S.; Stanley, F. The association between dietary patterns and mental health in early adolescence. Prev. Med. 2009, 49, 39–44. [Google Scholar] [CrossRef] [PubMed]
- Kant, A. Indexes of overall diet quality: A review. J. Am. Diet. Assoc. 1996, 96, 785–791. [Google Scholar] [CrossRef]


| Dietary Recommendation | Indicator | Cut-Off | Points | |
|---|---|---|---|---|
| 1 | Eat at least five portions of fruits and vegetables every day (maximum one glass of juice can be included as one portion) | Fruits, vegetables, juice and smoothies (total index) a | <5.0 | 0 |
| ≥5.0 | 1 | |||
| 2 | Eat at least four whole grain products every day | Wholegrain content in bread, cereals, crisp breads | <50% | 0 |
| ≥50% | 1 | |||
| 3 | Eat fish corresponding to 2–3 dinner servings a week | Fish (dinner servings) | ≤1/week | 0 |
| ≥2/week | 1 | |||
| 4 | Choose lean meat and meat products and limit your intake of red- and processed meat | Red meat (dinner servings) | ≤3/week | 1 |
| ≥4/week | 0 | |||
| 5 | Low-fat dairy products should be a part of the daily diet | Dairy products (portions) | ≤6/week | 0 |
| ≥1/day | 1 | |||
| 6 | Limit your intake of added sugars | Sweets and sugary soda (total index) b | >0.2 | 0 |
| ≤0.2 | 1 | |||
| 7 | Water is the recommended beverage | Water (frequency) | ≥1/day | 1 |
| <1/day | 0 | |||
| 8 | Do some form of physical activity for at least 30 min a day | Physical activity (hours) | ≥4/week | 1 |
| <4/week | 0 | |||
| Maximum reachable score: | 8 | |||
| Indices for Fruit and Vegetable Intake | |||||||
|---|---|---|---|---|---|---|---|
| Never/Seldom | 1–3 Portions/Week | 4–6 Portions/Week | 1 Portion/Day | 2 Portions/Day | 3 Portions/Day | ≥4 Portions/Day | |
| Fruits | 0 | 0.3 | 0.7 | 1 | 2 | 3 | 4 |
| Vegetables | 0 | 0.3 | 0.7 | 1 | 2 | 3 | 4 |
| Juice a | 0 | 0.1 | 0.3 | 0.5 | 0.5 | 0.5 | 0.5 |
| Smoothies a | 0 | 0.1 | 0.3 | 0.5 | 0.5 | 0.5 | 0.5 |
| Index | |
|---|---|
| Sweets at school | |
| Never/seldom | 0 |
| 1–2 times/week | 0.2 |
| 3–4 times/week | 0.5 |
| Every day | 1 |
| Sweets at home | |
| Never/seldom | 0 |
| 1–2 times/week | 0.2 |
| 3–4 times/week | 0.5 |
| 5–6 times/week | 0.8 |
| Every day | 1 |
| Sugary soft drinks | |
| Never/seldom | 0 |
| 1–3 times/week | 0.3 |
| 4–6 times/week | 0.7 |
| Every day | 1 |
| 2 times/day | 2 |
| 3–4 times/day | 3.5 |
| >5 times/day | 5 |
| n | All (n = 472) | Diet Score | p-Value a | |||
|---|---|---|---|---|---|---|
| Low (n = 127) | Moderate (n = 226) | High (n = 117) | ||||
| Age, years (Mean SD) | 472 | 14.6 (0.3) | 14.5 (0.4) | 14.6 (0.3) | 14.6 (0.3) | 0.143 |
| Height, cm (Mean SD) | 447 | 169 (0.09) | 168 (0.1) | 170 (0.1) | 169 (0.1) | 0.239 |
| Weight, kg (Mean SD) | 459 | 57 (10.6) | 56 (10.8) | 57 (11.0) | 58 (10.1) | 0.620 |
| Gender | 472 | 0.053 | ||||
| Girls | 248 (52.5) | 77 (60.6) | 107 (47.3) | 63 (53.8) | ||
| Boys | 224 (47.5) | 50 (39.4) | 119 (52.7) | 54 (46.2) | ||
| BMI category b | 435 | 0.835 | ||||
| Underweight | 56 (12.9) | 17 (14.4) | 28 (13.7) | 11 (9.9) | ||
| Normal weight | 345 (79.3) | 91 (77.1) | 161 (78.5) | 92 (82.9) | ||
| Overweightor obese | 34 (7.8) | 10 (8.5) | 16 (7.8) | 8 (7.2) | ||
| Parental education c | ||||||
| Mother: | 369 | 0.001 | ||||
| Lower | 107 (28.9) | 39 (42.9) | 51 (27.3) | 17 (18.7) | ||
| Higher | 263 (71.1) | 52 (57.1) | 136 (72.7) | 74 (81.3) | ||
| Father: | 370 | 0.018 | ||||
| Lower | 151 (40.8) | 49 (53.3) | 71 (38.0) | 31 (34.4) | ||
| Higher | 219 (59.2) | 43 (46.7) | 116 (62.0) | 59 (65.6) | ||
| Family income in NOK d | 368 | 0.002 | ||||
| <200,000–749,999 | 76 (20.7) | 25 (27.5) | 39 (21.0) | 12 (13.3) | ||
| 750,000–1,249,999 | 190 (51.6) | 55 (60.4) | 88 (47.3) | 46 (51.1) | ||
| 1,250,000–>2,000,000 | 102 (27.7) | 11 (12.1) | 59 (31.7) | 32 (35.6) | ||
| Diet Score and Indicators | n | κ Measure of Agreement | p-Value | Expected Agreement (%) | Agreement (%) |
|---|---|---|---|---|---|
| Diet Score | 429 | 0.465 * | <0.001 | 76.8 | 87.6 |
| Fruits, vegetables | 429 | 0.493 * | <0.001 | 83.4 | 91.6 |
| Wholegrain | 430 | 0.532 * | <0.001 | 55.3 | 79.1 |
| Seafood dinner | 430 | 0.454 * | <0.001 | 52.3 | 74.0 |
| Red meat | 430 | 0.249 | <0.001 | 77.7 | 83.3 |
| Dairy products | 430 | 0.469 * | <0.001 | 57.0 | 77.2 |
| Added sugar | 430 | 0.573 * | <0.001 | 70.6 | 87.4 |
| Water | 430 | 0.443 * | <0.001 | 81.6 | 89.8 |
| Physical activity | 430 | 0.552 * | <0.001 | 57.0 | 80.7 |
© 2016 by the authors; licensee MDPI, Basel, Switzerland. This article is an open access article distributed under the terms and conditions of the Creative Commons Attribution (CC-BY) license (http://creativecommons.org/licenses/by/4.0/).
Share and Cite
Handeland, K.; Kjellevold, M.; Wik Markhus, M.; Eide Graff, I.; Frøyland, L.; Lie, Ø.; Skotheim, S.; Stormark, K.M.; Dahl, L.; Øyen, J. A Diet Score Assessing Norwegian Adolescents’ Adherence to Dietary Recommendations—Development and Test-Retest Reproducibility of the Score. Nutrients 2016, 8, 467. https://doi.org/10.3390/nu8080467
Handeland K, Kjellevold M, Wik Markhus M, Eide Graff I, Frøyland L, Lie Ø, Skotheim S, Stormark KM, Dahl L, Øyen J. A Diet Score Assessing Norwegian Adolescents’ Adherence to Dietary Recommendations—Development and Test-Retest Reproducibility of the Score. Nutrients. 2016; 8(8):467. https://doi.org/10.3390/nu8080467
Chicago/Turabian StyleHandeland, Katina, Marian Kjellevold, Maria Wik Markhus, Ingvild Eide Graff, Livar Frøyland, Øyvind Lie, Siv Skotheim, Kjell Morten Stormark, Lisbeth Dahl, and Jannike Øyen. 2016. "A Diet Score Assessing Norwegian Adolescents’ Adherence to Dietary Recommendations—Development and Test-Retest Reproducibility of the Score" Nutrients 8, no. 8: 467. https://doi.org/10.3390/nu8080467
APA StyleHandeland, K., Kjellevold, M., Wik Markhus, M., Eide Graff, I., Frøyland, L., Lie, Ø., Skotheim, S., Stormark, K. M., Dahl, L., & Øyen, J. (2016). A Diet Score Assessing Norwegian Adolescents’ Adherence to Dietary Recommendations—Development and Test-Retest Reproducibility of the Score. Nutrients, 8(8), 467. https://doi.org/10.3390/nu8080467