Sun Exposure Guidelines and Serum Vitamin D Status in Denmark: The StatusD Study

 ,
,
Abstract
:1. Introduction
2. Methods
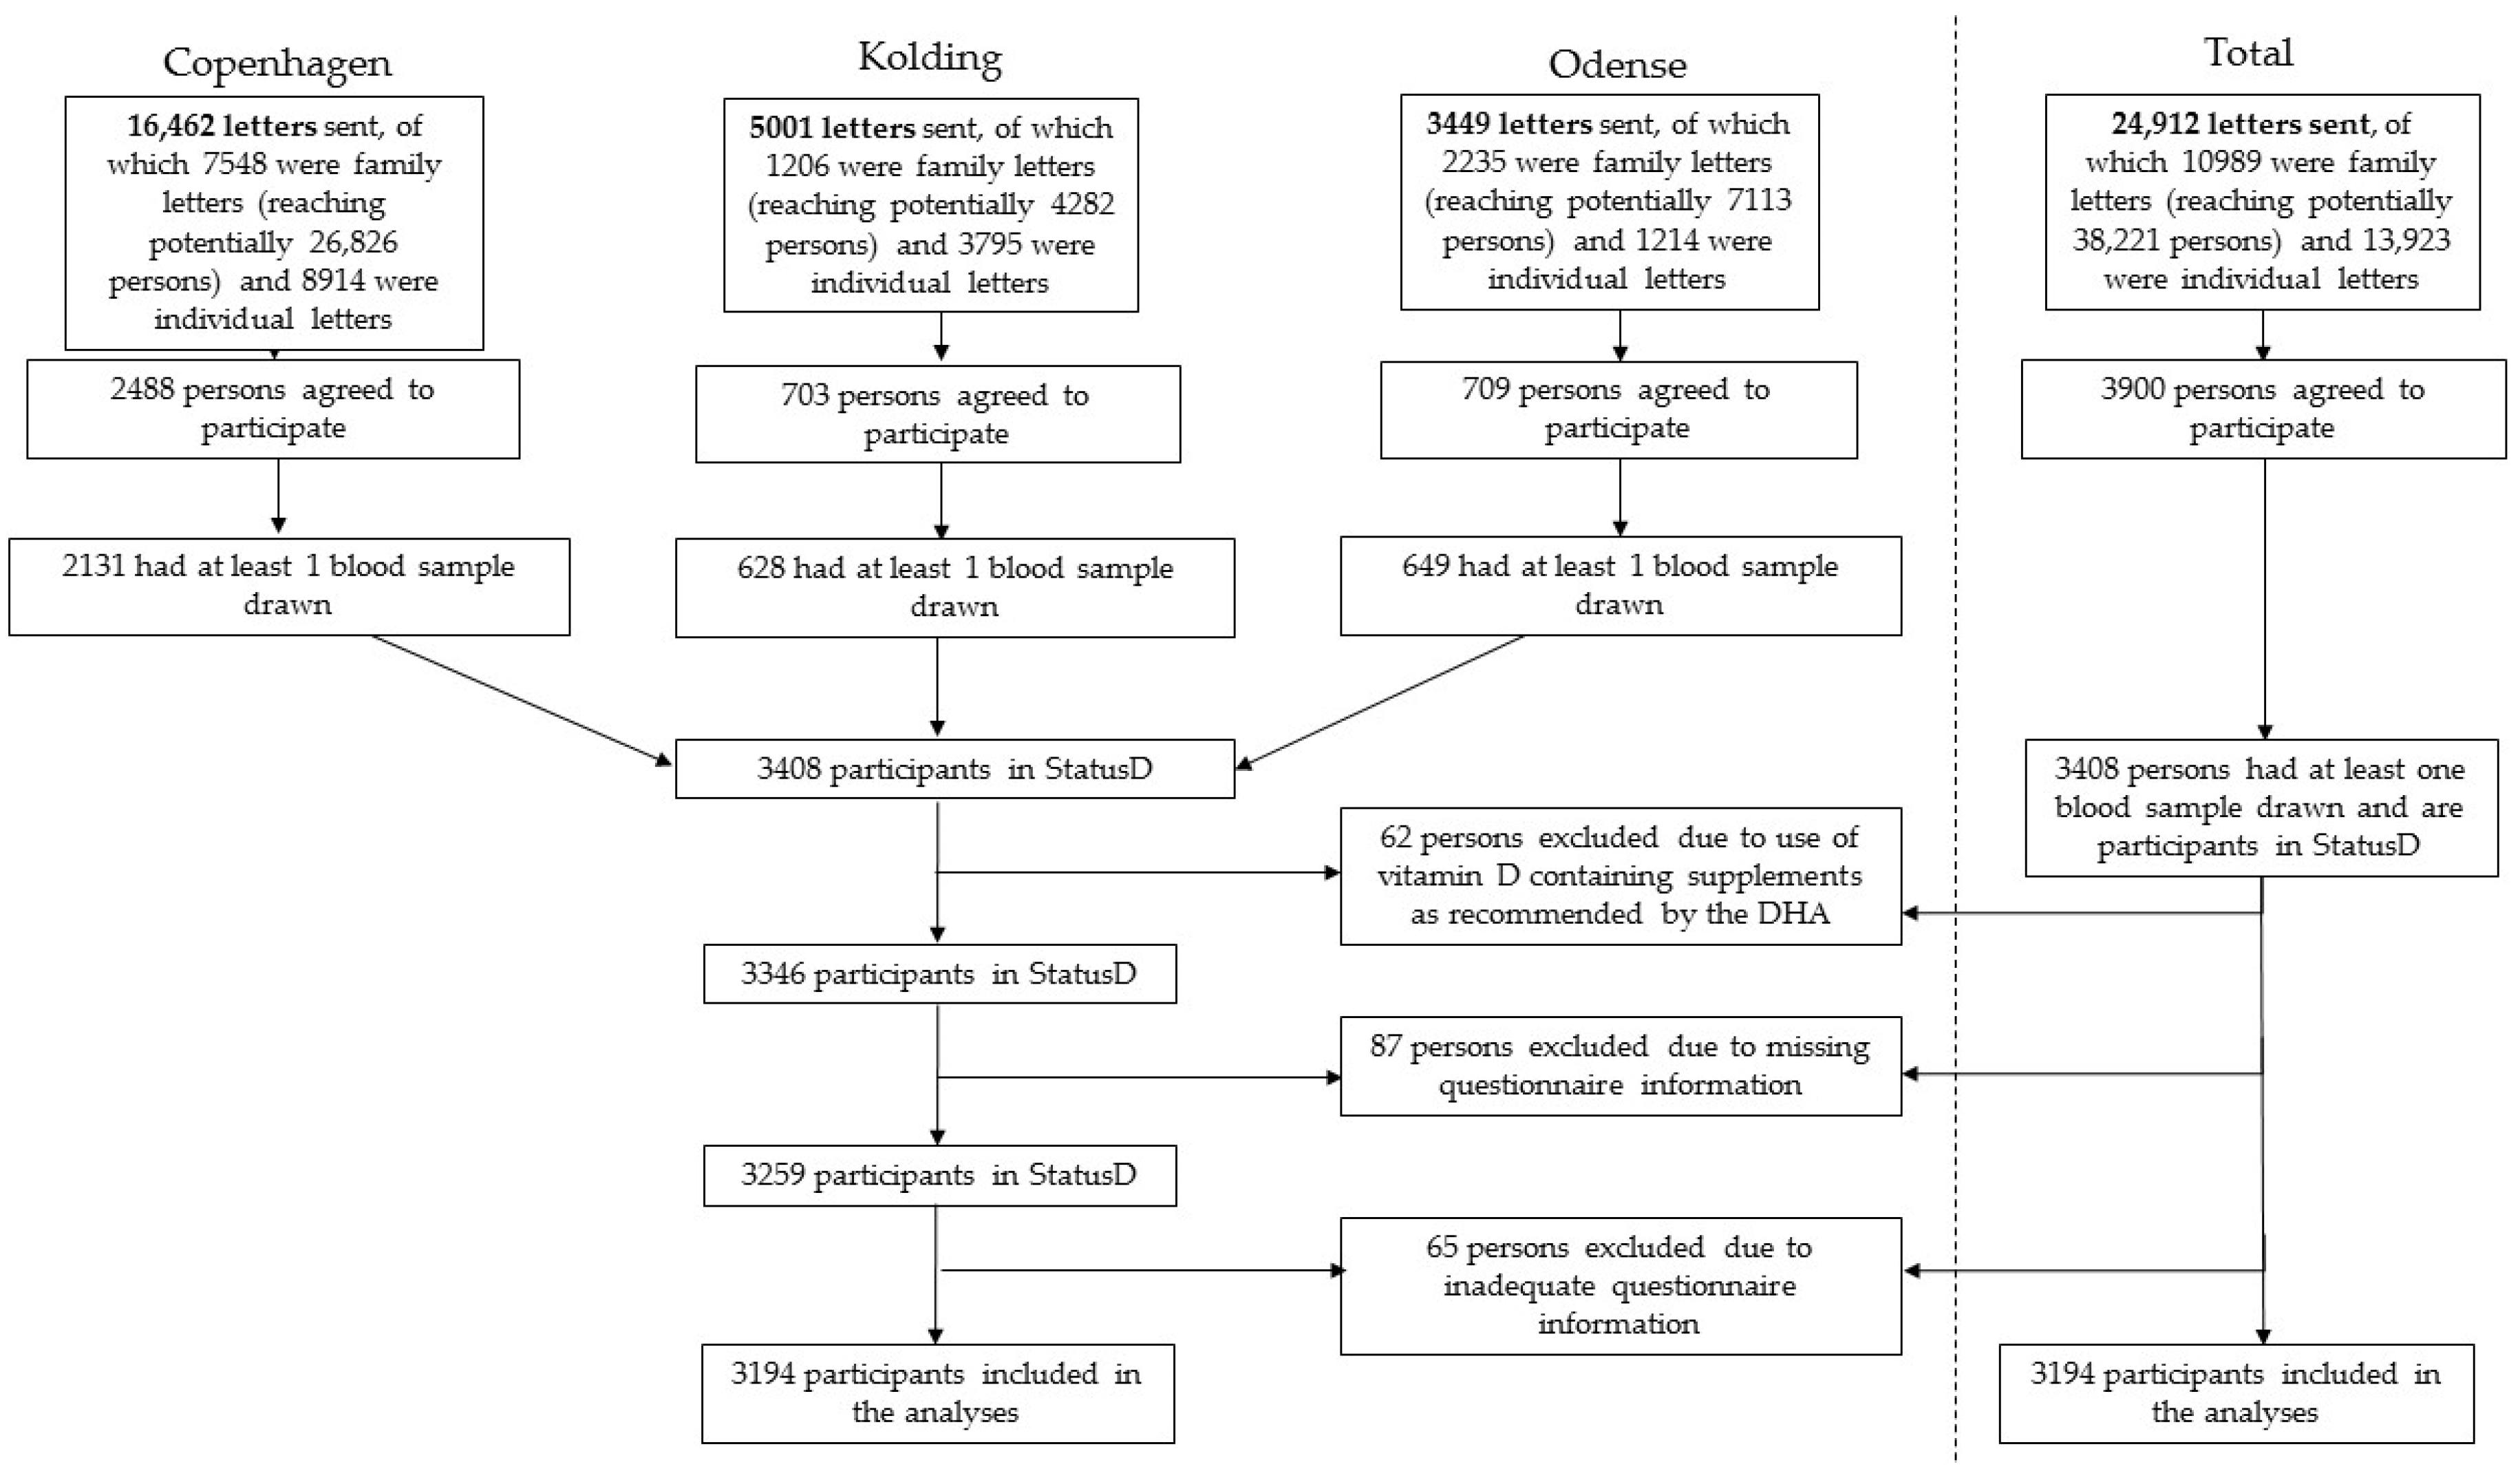
2.1. Study Description
2.2. Measurement of Vitamin D Status
2.3. Questionnaire Information and Exposure Definition
2.4. Statistical Analyses
3. Results
4. Discussion
5. Conclusions
Supplementary Materials
Acknowledgments
Author Contributions
Conflicts of Interest
References
- Holick, M.F. Vitamin D deficiency. N. Engl. J. Med. 2007, 357, 266–281. [Google Scholar] [CrossRef] [PubMed]
- Oliveria, S.A.; Saraiya, M.; Geller, A.C.; Heneghan, M.K.; Jorgensen, C. Sun exposure and risk of melanoma. Arch. Dis. Child. 2006, 91, 131–138. [Google Scholar] [CrossRef] [PubMed]
- Engholm, G.; Ferlay, J.; Christensen, N.; Kejs, A.M.T.; Johannesen, T.B.; Khan, S.; Leinonen, M.K.; Milter, M.C.; Ólafsdóttir, E.; Petersen, T.; et al. Nordcan: Cancer Incidence, Mortality, Prevalence and Survival in the Nordic Countries, Version 7.2 (16.12.2015), Association of the Nordic Cancer Registries, Danish Cancer Society. Available online: http://www.ancr.nu (accessed on 7 February 2016).
- Køster, B.; Thorgaard, C.; Philip, A.; Clemmensen, I.H. Prevalence of sunburn and sun-related behaviour in the Danish population: A cross-sectional study. Scand. J. Public Health 2010, 38, 548–552. [Google Scholar] [CrossRef] [PubMed]
- Danish Sun Safety Campaign. Available online: https://www.cancer.dk/forebyg/skru-ned-for-solen/english/ (accessed on 7 February 2016).
- Cancer Research UK. Ways to Enjoy the Sun Safely. Available online: http://www.cancerresearchuk.org/about-cancer/causes-of-cancer/sun-uv-and-cancer/ways-to-enjoy-the-sun-safely (accessed on 11 March 2016).
- Cancer Council Australia. Preventing Skin Cancer. Available online: http://www.cancer.org.au/preventing-cancer/sun-protection/preventing-skin-cancer/ (accessed on 11 March 2016).
- American Academy of Dermatology. Prevent Skin Cancer. Available online: https://www.aad.org/public/spot-skin-cancer/learn-about-skin-cancer/prevent (accessed on 11 March 2016).
- World Health Organization. Sun Protection. Available online: http://www.who.int/uv/sun_protection/en/ (accessed on 11 March 2016).
- Lips, P.; van Schoor, N.M. The effect of vitamin D on bone and osteoporosis. Best Pract. Res. Clin. Endocrinol. Metab. 2011, 25, 585–591. [Google Scholar] [CrossRef] [PubMed]
- Jacobs, E.T.; Kohler, L.N.; Kunihiro, A.G.; Jurutka, P.W. Vitamin D and Colorectal, Breast, and Prostate Cancers: A Review of the Epidemiological Evidence. J. Cancer 2016, 7, 232–240. [Google Scholar] [CrossRef] [PubMed]
- Mpandzou, G.; Ait Ben Haddou, E.; Regragui, W.; Benomar, A.; Yahyaoui, M. Vitamin D deficiency and its role in neurological conditions: A review. Rev. Neurol. 2016, 172, 109–122. [Google Scholar] [CrossRef] [PubMed]
- Papandreou, D.; Hamid, Z.T. The Role of Vitamin D in Diabetes and Cardiovascular Disease: An Updated Review of the Literature. Dis. Markers 2015, 2015, 1–15. [Google Scholar] [CrossRef] [PubMed]
- Durup, D.; Jorgensen, H.L.; Christensen, J.; Schwarz, P.; Heegaard, A.M.; Lind, B. A reverse J-shaped association of all-cause mortality with serum 25-hydroxyvitamin D in general practice: The CopD study. J. Clin. Endocrinol. Metab. 2012, 97, 2644–2652. [Google Scholar] [CrossRef] [PubMed]
- Durup, D.; Jorgensen, H.L.; Christensen, J.; Tjønneland, A.; Olsen, A.; Halkjær, J.; Lind, B.; Heegaard, A.M.; Schwarz, P. A Reverse J-Shaped Association between Serum 25-Hydroxyvitamin D and Cardiovascular Disease Mortality: The CopD Study. J. Clin. Endocrinol. Metab. 2015, 100, 2339–2346. [Google Scholar] [CrossRef] [PubMed]
- Tuohimaa, P.; Tenkanen, L.; Ahonen, M.; Lumme, S.; Jellum, E.; Hallmans, G.; Stattin, P.; Harvei, S.; Hakulinen, T.; Luostarinen, T.; et al. Both high and low levels of blood vitamin D are associated with a higher prostate cancer risk: A longitudinal, nested case-control study in the Nordic countries. Int. J. Cancer 2004, 108, 104–108. [Google Scholar] [CrossRef] [PubMed]
- Cashman, K.D. Vitamin D in childhood and adolescence. Postgrad. Med. J. 2007, 83, 230–235. [Google Scholar] [CrossRef] [PubMed]
- Webb, A.R.; Engelsen, O. Calculated ultraviolet exposure levels for a healthy vitamin D status. Photochem. Photobiol. 2006, 82, 1697–1703. [Google Scholar] [CrossRef] [PubMed]
- Pedersen, C.B. The Danish Civil Registration System. Scand. J. Public Health 2011, 39, 22–25. [Google Scholar] [CrossRef] [PubMed]
- Danish Health Authority. Available online: https://sundhedsstyrelsen.dk/da/sundhed-og-livsstil/ernaering/d-vitamin/forebyggende-d-vitamintilskud (accessed on 7 February 2016).
- Bjorn Jensen, C.; Thorne-Lyman, A.L.; Vadgaard Hansen, L.; Strom, M.; Odgaard Nielsen, N.; Cohen, A.; Olsen, S.F. Development and validation of a vitamin D status prediction model in Danish pregnant women: A study of the Danish National Birth Cohort. PLoS ONE 2013, 8, e53059. [Google Scholar]
- Tjonneland, A.; Olsen, A.; Boll, K.; Stripp, C.; Christensen, J.; Engholm, G.; Overvad, K. Study design, exposure variables, and socioeconomic determinants of participation in Diet, Cancer and Health: A population-based prospective cohort study of 57,053 men and women in Denmark. Scand. J. Public Health 2007, 35, 432–441. [Google Scholar] [CrossRef] [PubMed]
- Danish Sun Safety Campaign. A Survey of the Sun Habits of the Danish Population in Denmark during the Summer of 2010. Available online: https://www.cancer.dk/forebyg/skru-ned-for-solen/forskning-og-evaluering/rapporter/ (accessed on 11 March 2016).
- Madsen, K.H.; Rasmussen, L.B.; Andersen, R.; Mølgaard, C.; Jakobsen, J.; Bjerrum, P.J.; Andersen, E.W.; Mejborn, H.; Tetens, I. Randomized controlled trial of the effects of vitamin D-fortified milk and bread on serum 25-hydroxyvitamin D concentrations in families in Denmark during winter: The VitmaD study. Am. J. Clin. Nutr. 2013, 98, 374–382. [Google Scholar] [CrossRef] [PubMed]
- Centers for Disease Control and Prevention. National Center for Health Statistics. Z-score Data Files. Available online: http://www.cdc.gov/growthcharts/zscore.htm (accessed on 7 April 2016).
- World Health Organization. BMI-for-Age (5–19 Years). Available online: http://www.who.int/growthref/who2007_bmi_for_age/en/ (accessed on 7 April 2016).
- Ross, A.C.; Taylor, C.L.; Yaktine, A.L.; Del Valle, H.B. Dietary Reference Intakes for Calcium and Vitamin D; National Academies Press: Washington, DC, USA, 2011. [Google Scholar]
- Wulf, H.C.; Eriksen, P. UV index and its implications. Ugeskr. Laeger 2010, 172, 1277–1279. (in Danish). [Google Scholar] [PubMed]
- Linos, E.; Keiser, E.; Kanzler, M.; Sainani, K.L.; Lee, W.; Vittinghoff, E.; Chren, M.M.; Tang, J.Y. Sun protective behaviors and vitamin D levels in the US population: NHANES 2003–2006. Cancer Causes Control 2012, 23, 133–140. [Google Scholar] [CrossRef] [PubMed]
- Matsuoka, L.Y.; Ide, L.; Wortsman, J.; MacLaughlin, J.A.; Holick, M.F. Sunscreens suppress cutaneous vitamin D3 synthesis. J. Clin. Endocrinol. Metab. 1987, 64, 1165–1168. [Google Scholar] [CrossRef] [PubMed]
- Autier, P.; Boniol, M.; Dore, J.F. Sunscreen use and increased duration of intentional sun exposure: Still a burning issue. Int. J. Cancer 2007, 121, 1–5. [Google Scholar] [CrossRef] [PubMed]
- Zerwekh, J.E. Blood biomarkers of vitamin D status. Am. J. Clin. Nutr. 2008, 87, 1087S–1091S. [Google Scholar] [PubMed]
- Cashman, K.D.; Dowling, K.G.; Skrabakova, Z.; Kiely, M.; Lamberg-Allardt, C.; Durazo-Arvizu, R.A.; Sempos, C.T.; Koskinen, S.; Lundqvist, A.; Sundvall, J.; et al. Standardizing serum 25-hydroxyvitamin D data from four Nordic population samples using the vitamin D Standardization Program Protocols: Shedding new light on vitamin D status in Nordic individuals. Scand. J. Clin. Lab. Investig. 2015, 75, 549–561. [Google Scholar] [CrossRef] [PubMed]
- Glanz, K.; Gies, P.; O’Riordan, D.L.; Elliott, T.; Nehl, E.; McCarty, F.; Davis, E. Validity of self-reported solar UVR exposure compared with objectively measured UVR exposure. Cancer Epidemiol. Biomark. Prev. 2010, 19, 3005–3012. [Google Scholar] [CrossRef] [PubMed]
- Thieden, E. Sun exposure behaviour among subgroups of the Danish population. Based on personal electronic UVR dosimetry and corresponding exposure diaries. Dan. Med. Bull. 2008, 55, 47–68. [Google Scholar] [PubMed]
- Williams, S.; Malatesta, K.; Norris, K. Vitamin D and chronic kidney disease. Ethn. Dis. 2009, 19, 8–11. [Google Scholar]


| Children (n = 569) | Adults (n = 2625) | |
|---|---|---|
| Age | ||
| ≥2–<6 | 91 (16%) | - |
| ≥6–<15 | 360 (63%) | - |
| ≥15–<18 | 118 (21%) | - |
| ≥18–<29 | - | 367 (14%) |
| ≥30–<39 | - | 508 (19%) |
| ≥40–<49 | - | 681 (26%) |
| ≥50–<59 | - | 595 (21%) |
| ≥60 | - | 514 (20%) |
| Sex | ||
| Men | 281 (49%) | 1063 (41%) |
| Women | 288 (51%) | 1562 (59%) |
| Smoking | ||
| Never | - | 1528 (58%) |
| Former/occasional | - | 712 (27%) |
| Current | - | 385 (15%) |
| Physical activity | ||
| Yes | 493 (87%) | 1978 (75%) |
| No | 76 (13%) | 647 (25%) |
| Use of supplements containing vitamin D | ||
| Yes | 213 (37%) | 1092 (42%) |
| No | 356 (63%) | 1533 (58%) |
| BMI | ||
| <18.5 | - | 32 (1%) |
| ≥18.5–≤25 | - | 1220 (46%) |
| >25–≤30 | - | 986 (38%) |
| >30 | - | 387 (15%) |
| Adherence to sun exposure guideline on shade | ||
| Always | 15 (3%) | 217 (8%) |
| Often | 117 (21%) | 832 (32%) |
| Occasionally | 327 (57%) | 1172 (45%) |
| No | 110 (19%) | 404 (15%) |
| Adherence to sun exposure guideline on sunhat | ||
| Always | 16 (3%) | 126 (5%) |
| Often | 50 (9%) | 243 (9%) |
| Occasionally | 110 (19%) | 425 (16%) |
| No | 393 (69%) | 1831 (70%) |
| Adherence to sun exposure guideline on protective clothing | ||
| Always | 49 (9%) | 164 (6%) |
| Often | 143 (25%) | 568 (22%) |
| Occasionally | 216 (38%) | 898 (34%) |
| No | 161 (28%) | 995 (38%) |
| Adherence to sun exposure guideline on sunscreen | ||
| Always | 168 (30%) | 478 (18%) |
| Often | 207 (36%) | 790 (30%) |
| Occasionally | 142 (25%) | 813 (31%) |
| No | 52 (9%) | 544 (21%) |
| Adherence to combined sun exposure guideline index | ||
| 0 guideline | 122 (21%) | 703 (27%) |
| 1 guideline | 236 (42%) | 924 (35%) |
| 2 guidelines | 122 (21%) | 604 (23%) |
| 3 guidelines | 71 (13%) | 290 (11%) |
| 4 guidelines | 18 (3%) | 104 (4%) |
| Vitamin D groupings based on status b | ||
| Level 1: <25 nmol/L either spring or autumn | 75 (13%) | 294 (11%) |
| Level 2: <50 nmol/L both spring and autumn | 81 (14%) | 350 (13%) |
| Level 3: ≥50 nmol/L either spring or autumn | 488 (86%) | 2275 (87%) |
| Level 4: ≥50 nmol/L both spring and autumn | 204 (36%) | 1235 (47%) |
| Children | Adults | |||
|---|---|---|---|---|
| Spring (β (95% CI)) | Autumn (β (95% CI)) | Spring (β (95% CI)) | Autumn (β (95% CI)) | |
| Shade | ||||
| Always | −9.7 (−20.6–1.3) | −13.5 (−23.3–3.6) | −7.2 (−11.0–−3.6) | −9.9 (−12.5–−6.2) |
| Often | −0.3 (−5.1–4.4) | −3.2 (−7.8–1.5) | −7.2 (−9.9–−4.6) | −7.6 (−10.3–−5.0) |
| Occasionally | 0.6 (−3.3–4.5) | 1.6 (−2.3–5.4) | −3.7 (−6.2–−1.3) | −2.3 (−4.8–0.2) |
| No | 0 | 0 | 0 | 0 |
| Sunhat | ||||
| Always | 3.5 (−6.4–13.4) | 3.9 (−5.5–13.3) | −2.9 (−6.9–1.2) | −2.6 (−6.7–1.5) |
| Often | −1.3 (−7.1–4.4) | −1.9 (−7.6–3.8) | −1.3 (−4.3–1.8) | −1.0 (−4.0–2.1) |
| Occasionally | 2.5 (−1.8–4.5) | −0.7 (−5.0–3.5) | 0.3 (−2.1–2.7) | 0.7 (−1.7–3.1) |
| No | 0 | 0 | 0 | 0 |
| Clothing | ||||
| Always | −4.8 (−10.8–1.1) | −4.4 (−10.3–1.5) | −9.1 (−12.7–−5.4) | −9.9 (−13.6–−6.2) |
| Often | −3.7 (−8.1–0.7) | −3.3 (−7.6–3.8) | −6.8 (−9.1–−4.5) | −8.1 (−10.4–−5.8) |
| Occasionally | −1.0 (−4.7–2.8) | −0.7 (−5.0–3.5) | −4.5 (−6.5–−2.5) | −4.7 (−6.7–−2.7) |
| No | 0 | 0 | 0 | 0 |
| Sunscreen | ||||
| Always | −2.0 (−4.0–8.1) | 1.9 (−4.1–7.9) | 2.6 (−0.3–5.5) | 1.1 (−1.8–4.0) |
| Often | −1.1 (−6.8–4.5) | −0.3 (−5.9–5.3) | 0.8 (−1.7–3.4) | −1.2 (−3.7–1.4) |
| Occasionally | −2.7 (−8.5–3.0) | −2.2 (−8.0–3.6) | 1.8 (−0.7–4.2) | 0.1 (−2.4–2.5) |
| No | 0 | 0 | 0 | 0 |
| Index b | ||||
| 0 | 0 | 0 | 0 | 0 |
| 1 | −0.2 (−4.2–3.9) | −0.7 (−4.7–3.3) | −2.7 (−4.8–−0.5) | −2.9 (−5.1–−0.7) |
| 2 | −1.4 (−6.2–3.4) | −3.7 (−8.4–1.0) | −4.9 (−7.3–−2.5) | −6.8 (−9.2–−4.4) |
| 3 | −2.2 (−7.9–3.5) | −4.4 (−10.0–1.2) | −5.0 (−8.0–−2.0) | −6.3 (−9.4–−3.3) |
| 4 | −2.4 (−12.1–7.2) | −0.2 (−9.4–9.0) | −7.1 (−11.7–−2.5) | −9.7 (−14.3–−5.1) |
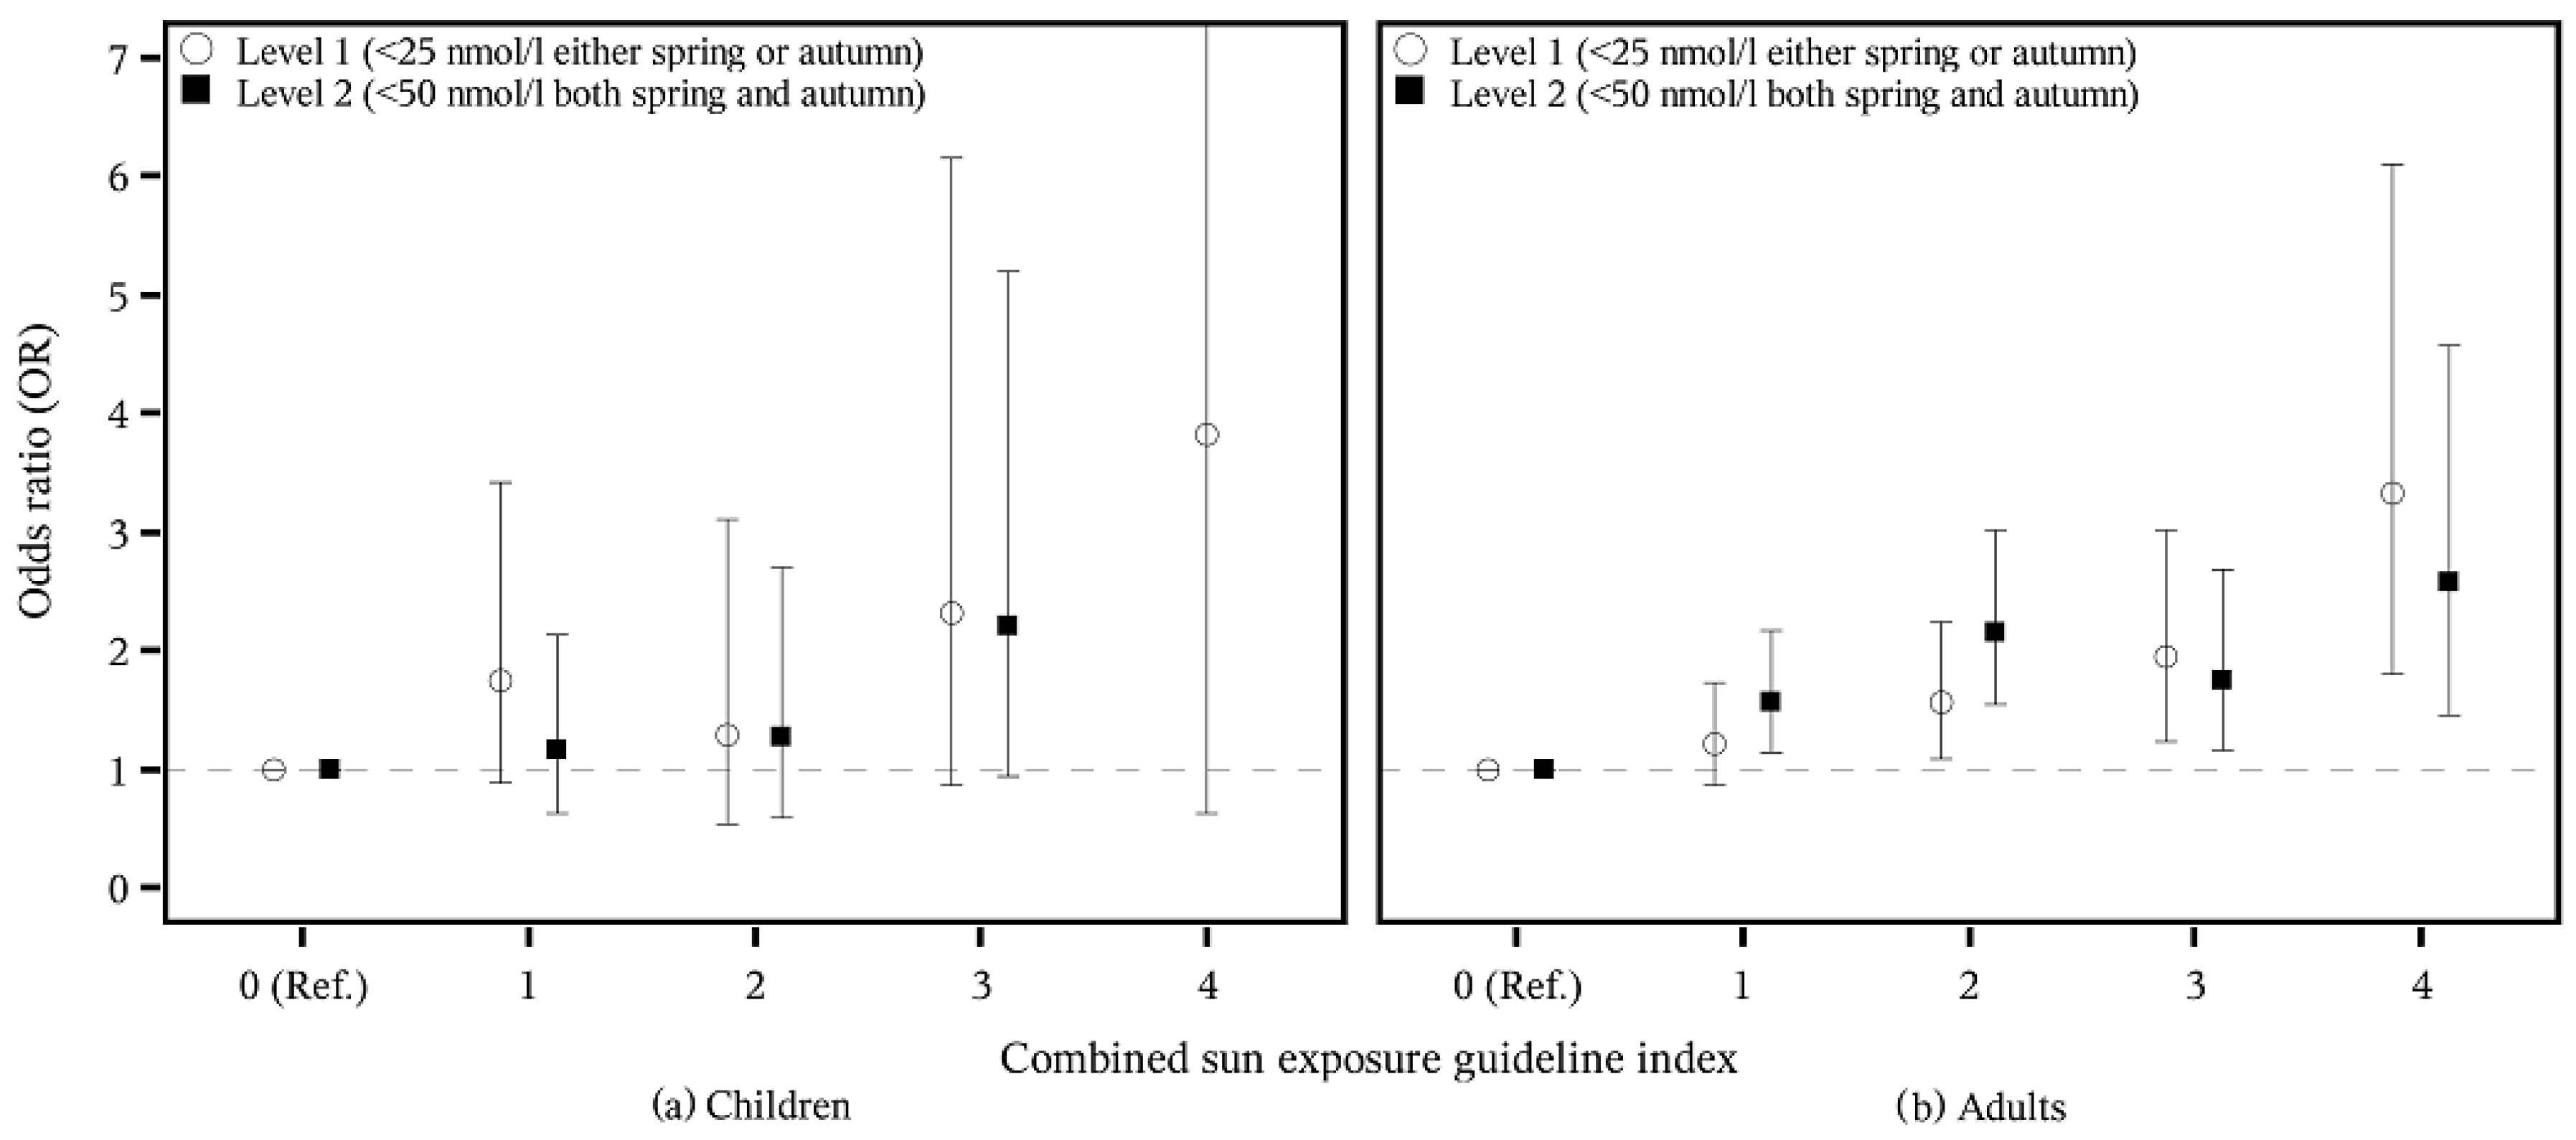
| Children (n = 569) | Adults (n = 2625) | |||
|---|---|---|---|---|
| Level 1 b (OR (95% CI)) | Level 2 c (OR (95% CI)) | Level 1 b (OR (95% CI)) | Level 2 c (OR (95% CI)) | |
| Shade | ||||
| Always | 3.73 (1.02–13.60) | 4.91 (1.47–16.43) | 2.10 (1.20–3.69) | 1.61 (0.95–2.71) |
| Often | 1.62 (0.72–3.62) | 1.14 (0.55–2.37) | 2.09 (1.38–3.15) | 2.17 (1.50–3.15) |
| Occasionally | 0.88 (0.45–1.72) | 0.70 (0.38–1.30) | 1.31 (0.88–1.96) | 1.16 (0.80–1.69) |
| No | 1 | 1 | 1 | 1 |
| Sunhat | ||||
| Always | 7.26 (1.39–37.81) | - | 1.48 (0.82–2.66) | 1.22 (0.72–2.06) |
| Often | 1.04 (0.27–3.91) | 1.16 (0.37–3.64) | 1.22 (0.79–1.87) | 0.93 (0.62–1.40) |
| Occasionally | 1.37 (0.58–3.24) | 1.85 (0.91–3.75) | 0.70 (0.47–1.05) | 0.76 (0.53–1.07) |
| No | 1 | 1 | 1 | 1 |
| Clothing | ||||
| Always | 3.59 (1.47–8.74) | 2.16 (0.94–4.96) | 3.19 (1.98–5.16) | 3.09 (2.01–4.74) |
| Often | 1.40 (0.65–3.00) | 0.87 (0.43–1.78) | 2.31 (1.64–3.25) | 1.90 (1.39–2.61) |
| Occasionally | 1.13 (0.58–2.18) | 0.73 (0.40–1.33) | 1.37 (0.99–1.89) | 1.47 (1.10–1.96) |
| No | 1 | 1 | 1 | 1 |
| Sunscreen | ||||
| Always | 1.29 (0.46–3.64) | 1.20 (0.45–3.23) | 0.70 (0.45–1.07) | 0.81 (0.55–1.21) |
| Often | 1.32 (0.53–3.26) | 1.41 (0.58–3.41) | 0.80 (0.56–1.14) | 0.97 (0.70–1.35) |
| Occasionally | 2.36 (0.98–5.70) | 1.80 (0.75–4.34) | 0.70 (0.49–0.99) | 0.86 (0.63–1.19) |
| No | 1 | 1 | 1 | 1 |
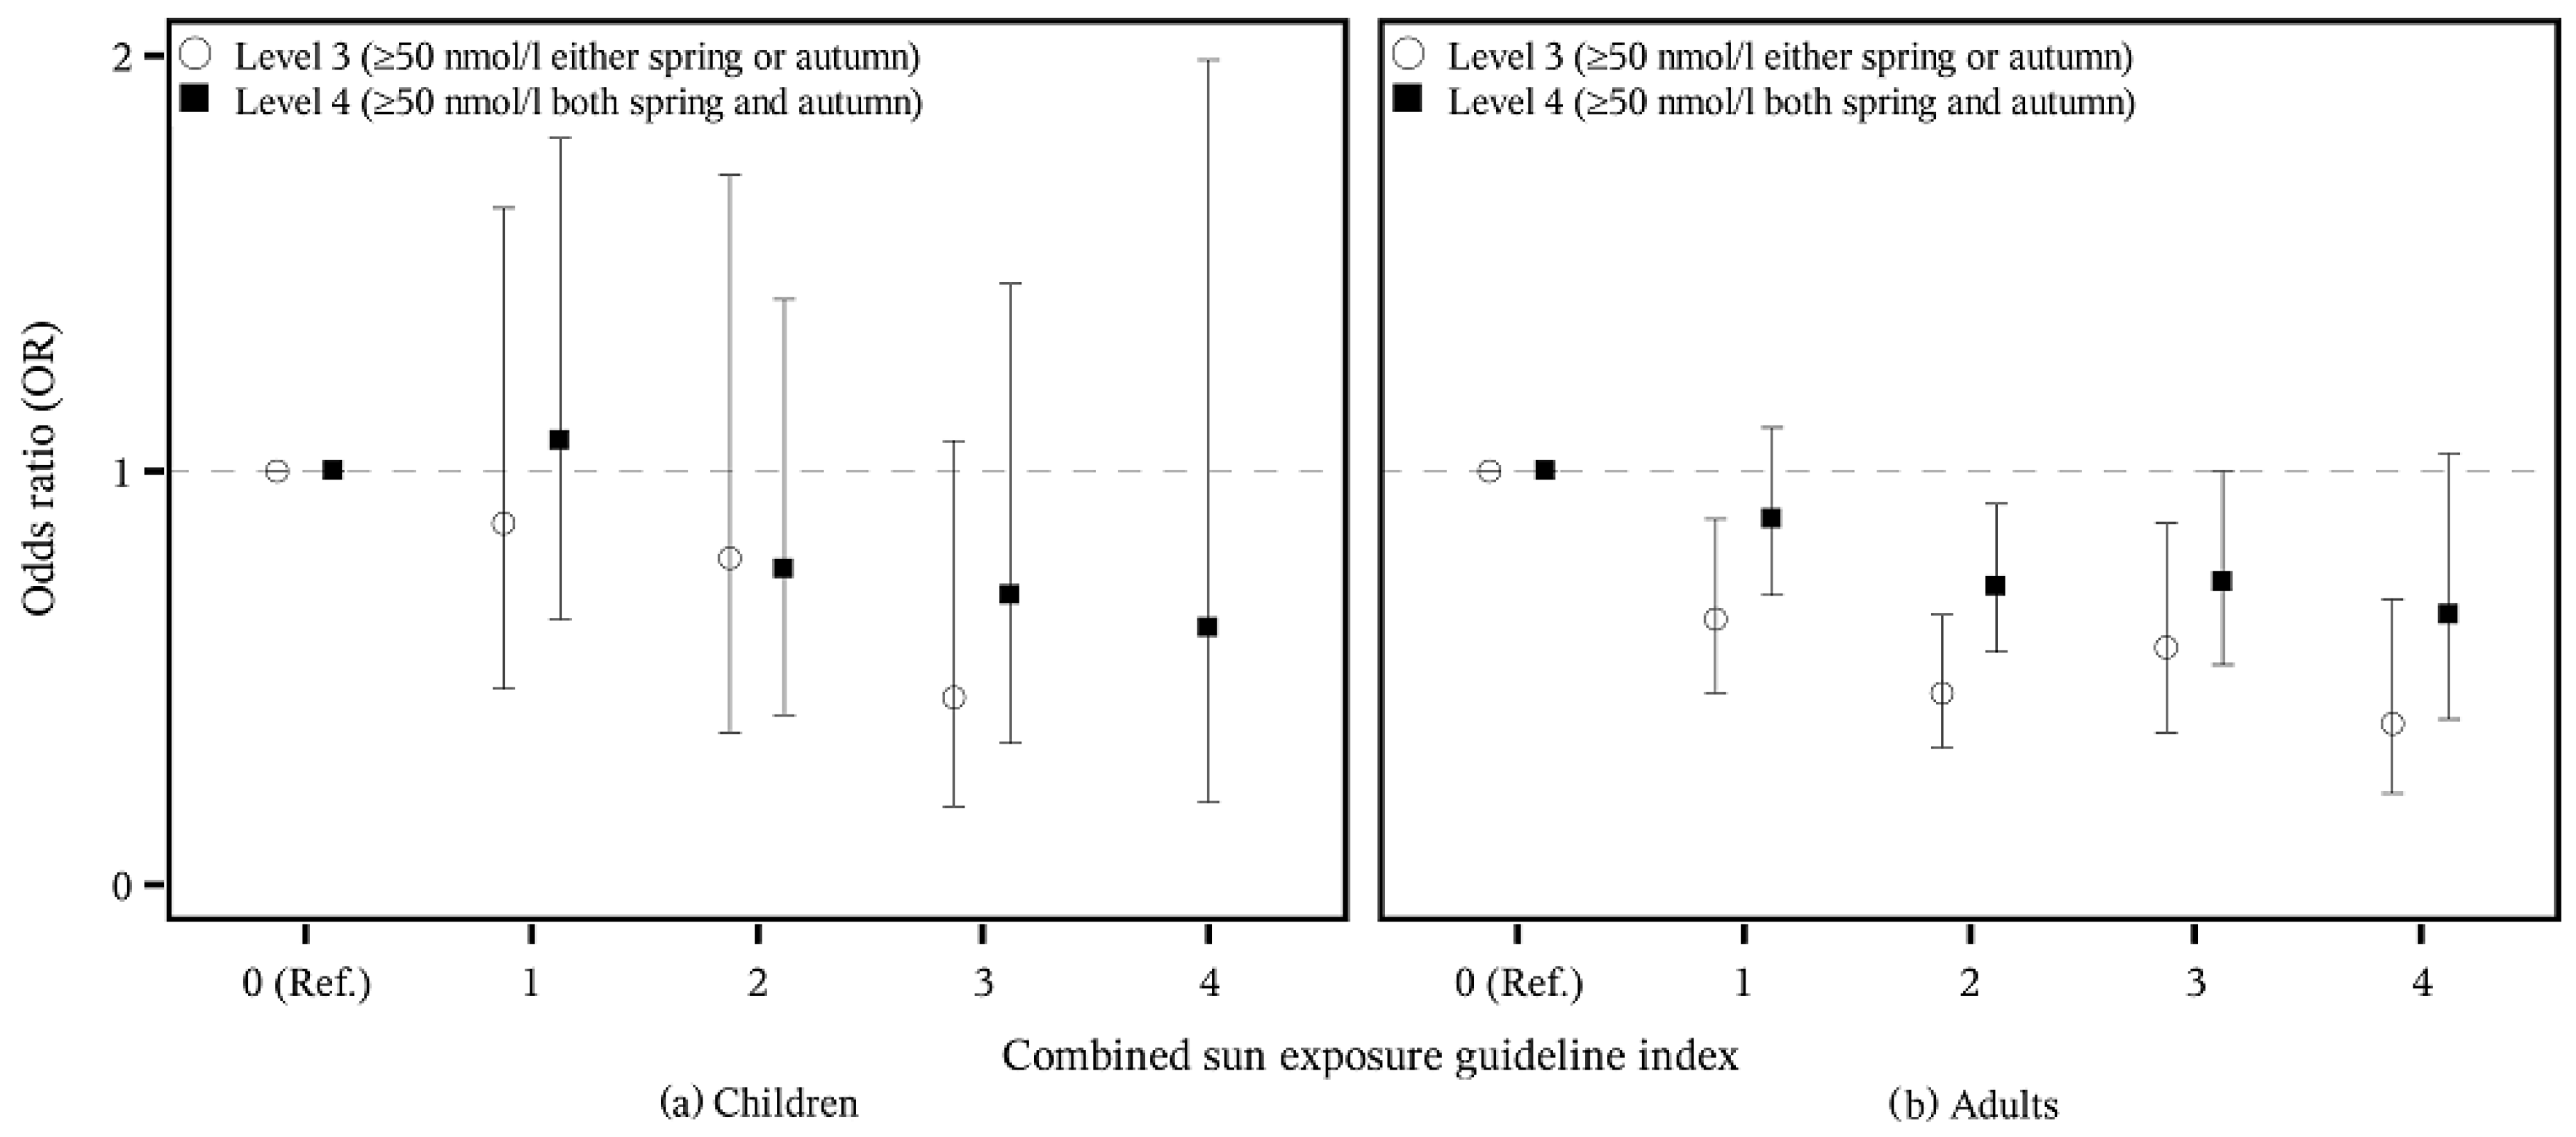
| Children (n = 569) | Adults (n = 2625) | |||
|---|---|---|---|---|
| Level 3 b (OR (95% CI)) | Level 4 c (OR (95% CI)) | Level 3 b (OR (95% CI)) | Level 4 c (OR (95% CI)) | |
| Shade | ||||
| Always | 0.20 (0.06–0.68) | 0.17 (0.02–1.46) | 0.62 (0.37–1.05) | 0.64 (0.43–0.93) |
| Often | 0.88 (0.42–1.83) | 0.99 (0.54–1.81) | 0.46 (0.32–0.67) | 0.55 (0.42–0.72) |
| Occasionally | 1.43 (0.77–2.66) | 1.07 (0.65–1.78) | 0.86 (0.59–1.24) | 0.78 (0.60–1.01) |
| No | 1 | 1 | 1 | 1 |
| Sunhat | ||||
| Always | - | 0.75 (0.23–2.40) | 0.82 (0.48–1.38) | 0.70 (0.46–1.05) |
| Often | 0.86 (0.27–2.68) | 0.67 (0.32–1.39) | 1.08 (0.71–1.62) | 1.07 (0.79–1.46) |
| Occasionally | 0.54 (0.27–1.09) | 1.16 (0.69–1.95) | 1.32 (0.94–1.87) | 1.19 (0.93–1.51) |
| No | 1 | 1 | 1 | 1 |
| Clothing | ||||
| Always | 0.46 (0.20–1.07) | 0.81 (0.37–1.76) | 0.32 (0.21–0.50) | 0.49 (0.33–0.72) |
| Often | 1.14 (0.56–2.34) | 0.58 (0.33–1.02) | 0.53 (0.38–0.72) | 0.53 (0.42–0.68) |
| Occasionally | 1.37 (0.75–2.50) | 1.11 (0.69–1.80) | 0.68 (0.51–0.91) | 0.71 (0.58–0.88) |
| No | 1 | 1 | 1 | 1 |
| Sunscreen | ||||
| Always | 0.83 (0.31–2.24) | 1.74 (0.77–3.94) | 1.23 (0.83–1.82) | 1.68 (1.25–2.25) |
| Often | 0.71 (0.29–1.72) | 1.24 (0.57–2.71) | 1.03 (0.74–1.43) | 1.38 (1.06–1.79) |
| Occasionally | 0.55 (0.23–1.33) | 1.16 (0.52–2.60) | 1.16 (0.84–1.60) | 1.27 (0.99–1.63) |
| No | 1 | 1 | 1 | 1 |
| Spring (Slope (95% CI)) | Autumn (Slope (95% CI)) | |
|---|---|---|
| Yes | −0.18 (−5.69–5.32) | −1.89 (−7.15–3.36) |
| Unsure | −0.090 (−5.32–5.14) | −3.05 (−8.01–1.90) |
| No | 0 | 0 |
© 2016 by the authors; licensee MDPI, Basel, Switzerland. This article is an open access article distributed under the terms and conditions of the Creative Commons Attribution (CC-BY) license (http://creativecommons.org/licenses/by/4.0/).
Share and Cite
Hansen, L.; Tjønneland, A.; Køster, B.; Brot, C.; Andersen, R.; Lundqvist, M.; Christensen, J.; Olsen, A. Sun Exposure Guidelines and Serum Vitamin D Status in Denmark: The StatusD Study. Nutrients 2016, 8, 266. https://doi.org/10.3390/nu8050266
Hansen L, Tjønneland A, Køster B, Brot C, Andersen R, Lundqvist M, Christensen J, Olsen A. Sun Exposure Guidelines and Serum Vitamin D Status in Denmark: The StatusD Study. Nutrients. 2016; 8(5):266. https://doi.org/10.3390/nu8050266
Chicago/Turabian StyleHansen, Louise, Anne Tjønneland, Brian Køster, Christine Brot, Rikke Andersen, Marika Lundqvist, Jane Christensen, and Anja Olsen. 2016. "Sun Exposure Guidelines and Serum Vitamin D Status in Denmark: The StatusD Study" Nutrients 8, no. 5: 266. https://doi.org/10.3390/nu8050266
APA StyleHansen, L., Tjønneland, A., Køster, B., Brot, C., Andersen, R., Lundqvist, M., Christensen, J., & Olsen, A. (2016). Sun Exposure Guidelines and Serum Vitamin D Status in Denmark: The StatusD Study. Nutrients, 8(5), 266. https://doi.org/10.3390/nu8050266