A Pilot Study: Dietary Energy Density is Similar between Active Women with and without Exercise-Associated Menstrual Dysfunction

Abstract
:1. Introduction
2. Materials and Methods
2.1. Anthropometrics and Aerobic Capacity
2.2. Diet and Physical Activity Assessment
2.3. Energy Density Calculation
2.4. Sport Food Intake
2.5. Menstrual Status
2.6. Statistical Analysis
3. Results
3.1. Energy and Nutrient Intake
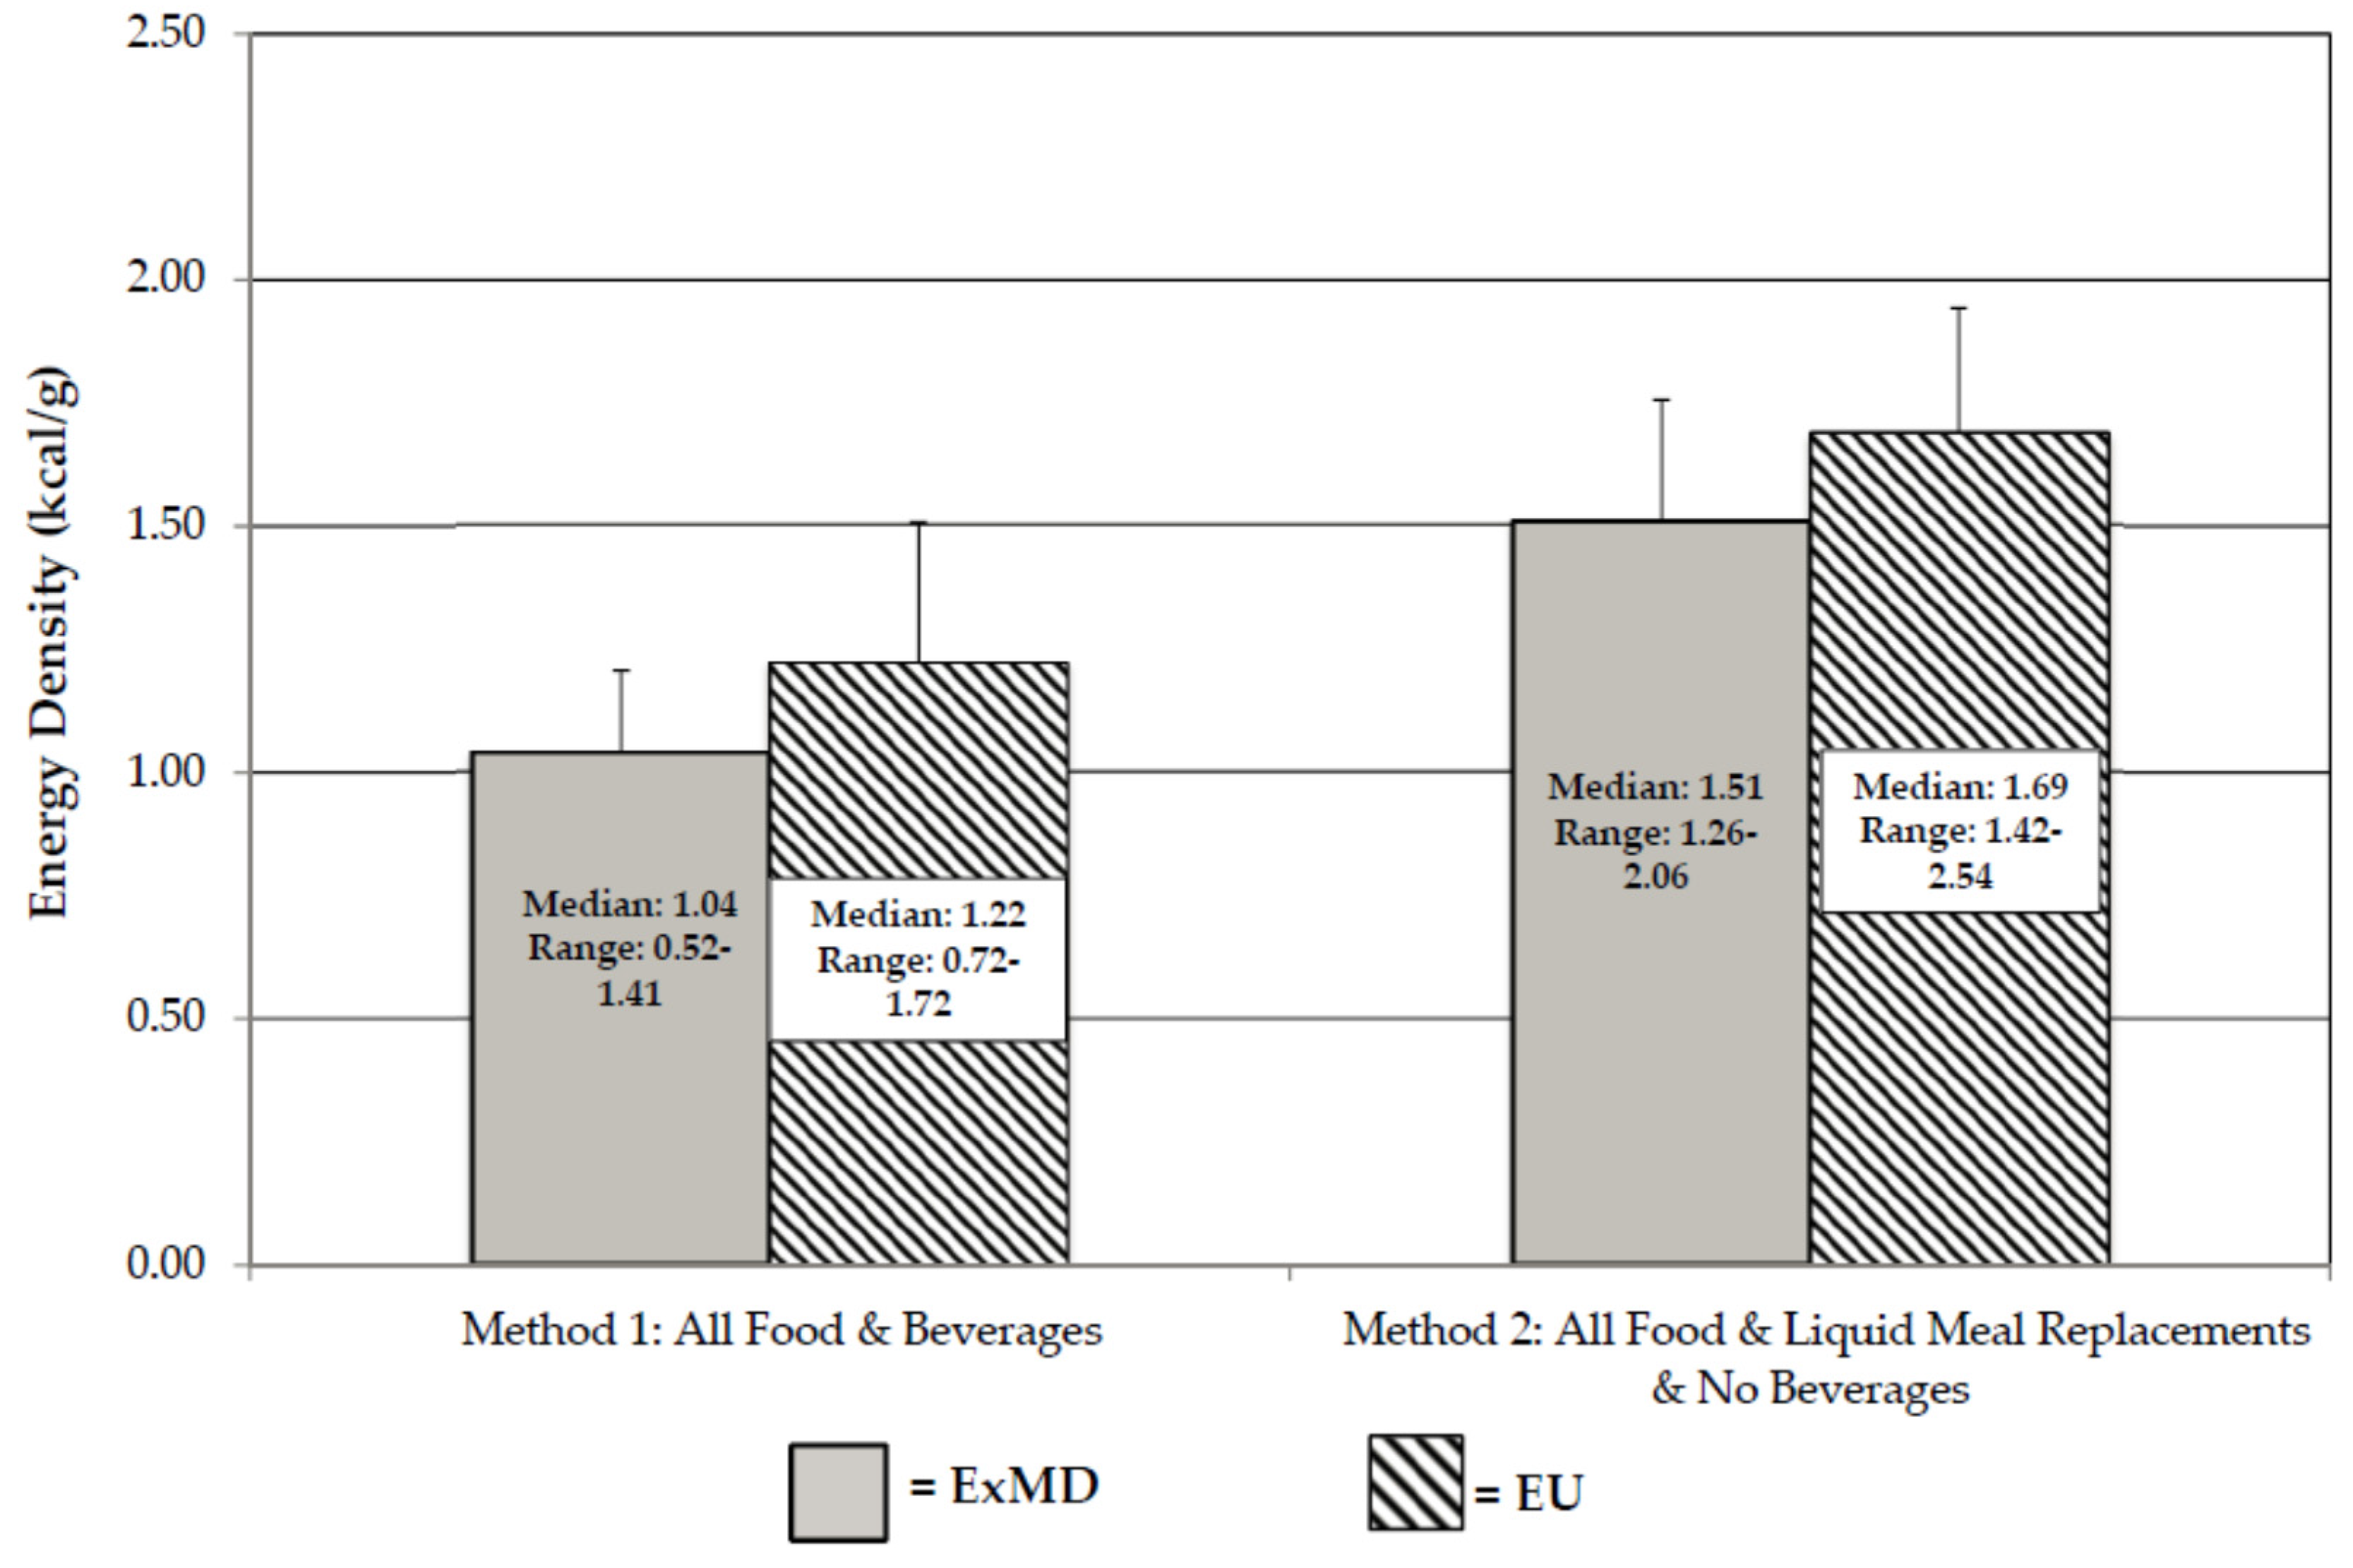
3.2. Energy Density
3.3 Sport Food Intake
4. Discussion
4.1. Strengths and Limitations
4.2. Application
5. Conclusions
Acknowledgments
Author Contributions
Conflicts of Interest
References
- Beals, K.A.; Manore, M.M. Disorders of the female athlete triad among collegiate athletes. Int. J. Sport Nutr. Exerc. Metab. 2002, 12, 281–293. [Google Scholar] [PubMed]
- Gibbs, J.C.; Williams, N.I.; De Souza, M.J. Prevalence of individual and combined components of the female athlete triad. Med. Sci. Sports Exerc. 2013, 45, 985–996. [Google Scholar] [CrossRef] [PubMed]
- Nattiv, A.; Loucks, A.B.; Manore, M.M.; Sanborn, C.F.; Sundgot-Borgen, J.; Warren, M.P. American college of sports medicine position stand. The female athlete triad. Med. Sci. Sports Exerc. 2007, 39, 1867–1882. [Google Scholar] [PubMed]
- Mountjoy, M.; Sundgot-Borgen, J.; Burke, L.; Carter, S.; Constantini, N.; Lebrun, C.; Meyer, N.; Sherman, R.; Steffen, K.; Budgett, R.; et al. International olympic committee consensus statement: Beyond the female athlete triad-relative energy deficiency in sport (RED-S). Br. J. Sports Med. 2014, 48, 491–497. [Google Scholar] [CrossRef] [PubMed]
- Sweat, W.; Manore, M.M. Too good to be true? Eating more and losing weight with a low energy dense diet. ACSM’s Health Fit. J. 2012, 16, 22–28. [Google Scholar]
- Ello-Martin, J.A.; Roe, L.S.; Ledikwe, J.H.; Beach, A.M.; Rolls, B.J. Dietary energy density in the treatment of obesity: A year-long trial comparing 2 weight-loss diets. Am. J. Clin. Nutr. 2007, 85, 1465–1477. [Google Scholar] [PubMed]
- Rolls, B.J. The relationship between dietary energy density and energy intake. Physiol. Behav. 2009, 97, 609–615. [Google Scholar] [CrossRef] [PubMed]
- Rolls, B.J.; Roe, L.S.; Meengs, J.S. Reductions in portion size and energy density of foods are additive and lead to sustained decreases in energy intake. Am. J. Clin. Nutr. 2006, 83, 11–17. [Google Scholar] [PubMed]
- McGuire, S. Dietary Guidelines for Americans. In Advances in Nutrition: An International Review Journal; US Department of Agriculture; US Department of Health and Human Services, Dietary Guidelines for Americans 2010; US Government Printing Office: Washington, DC, USA, January 2011; Volume 2, pp. 293–294. [Google Scholar]
- Melin, A.; Tornberg, Å.B.; Skouby, S.; Møller, S.S.; Faber, J.; Sundgot-Borgen, J.; Sjödin, A. Low-energy density and high fiber intake are dietary concerns in female endurance athletes. Scand. J. Med. Sci. Sports 2015, 25, 610–622. [Google Scholar] [CrossRef] [PubMed]
- Reed, J.L.; Bowell, J.L.; Hill, B.R.; Williams, B.A.; De Souza, M.J.; Williams, N.I. Exercising women with menstrual disturbances consume low energy dense foods and beverages. Appl. Physiol. Nutr. Metab. 2011, 36, 382–394. [Google Scholar] [CrossRef] [PubMed]
- Jackson, A.S.; Pollock, M.L.; Ward, A. Generalized equations for predicting body density of women. Med. Sci. Sports Exerc. 1980, 12, 175–181. [Google Scholar] [CrossRef] [PubMed]
- Goldberg, G.R.; Black, A.E.; Jebb, S.A.; Cole, T.J.; Murgatroyd, P.R.; Coward, W.A.; Prentice, A.M. Critical evaluation of energy intake data using fundamental principles of energy physiology: 1. Derivation of cut-off limits to identify under-recording. Eur. J. Clin. Nutr. 1991, 45, 569–581. [Google Scholar] [PubMed]
- Guebels, C.P.; Kam, L.C.; Maddalozzo, G.F.; Manore, M.M. Active women before/after an intervention designed to restore menstrual function: Resting metabolic rate and comparison of four methods to quantify energy expenditure and energy availability. Int. J. Sport Nutr. Exerc. Metab. 2014, 24, 37–46. [Google Scholar] [CrossRef] [PubMed]
- Harris, J.A.; Benedict, F.G. A biometric study of human basal metabolism. Proc. Natl. Acad. Sci. USA 1918, 4, 253. [Google Scholar] [CrossRef]
- Thompson, J.; Manore, M.M. Predicted and measured resting metabolic rate of male and female endurance athletes. J. Am. Dietet. Assoc. 1996, 96, 30–34. [Google Scholar] [CrossRef]
- Ledikwe, J.H.; Blanck, H.M.; Khan, L.K.; Serdula, M.K.; Seymour, J.D.; Tohill, B.C.; Rolls, B.J. Dietary energy density determined by eight calculation methods in a nationally representative united states population. J. Nutr. 2005, 135, 273–278. [Google Scholar] [PubMed]
- Vernarelli, J.A.; Mitchell, D.C.; Rolls, B.J.; Hartman, T.J. Methods for calculating dietary energy density in a nationally representative sample. Process. Food Sci. 2013, 2, 68–74. [Google Scholar] [CrossRef] [PubMed]
- Institute of Medicine (IOM); Food and Nutrition Board. Dietary Reference Intakes for Energy, Carbohydrate, Fiber, Fat, Fatty Acids, Cholesterol, Protein, and Amino acids; The National Academies Press: Washington, DC, USA, 2005. [Google Scholar]
- Tomten, S.E.; Hostmark, A.T. Energy balance in weight stable athletes with and without menstrual disorders. Scand. J. Med. Sci. Sports 2006, 16, 127–133. [Google Scholar] [CrossRef] [PubMed]
- Thong, F.S.; McLean, C.; Graham, T.E. Plasma leptin in female athletes: Relationship with body fat, reproductive, nutritional, and endocrine factors. J. Appl. Physiol. 2000, 88, 2037–2044. [Google Scholar] [PubMed]
- Woodruff, S.J.; Meloche, R.D. Energy availability of female varsity volleyball players. Int. J. Sport Nutr. Exerc. Metab. 2013, 23, 24–30. [Google Scholar] [PubMed]
- Reed, J.L.; De Souza, M.J.; Kindler, J.M.; Williams, N.I. Nutritional practices associated with low energy availability in division I female soccer players. J. Sports Sci. 2014, 32, 1499–1509. [Google Scholar] [CrossRef] [PubMed]
- Rodriguez, N.R.; DiMarco, N.M.; Langley, S. Position of the american dietetic association, dietitians of canada, and the american college of sports medicine: Nutrition and athletic performance. J. Am. Dietit. Assoc. 2009, 109, 509–527. [Google Scholar]
- Thomas, D.T.; Erdman, K.A.; Burke, L.M. Position of the academy of nutrition and dietetics, dietitians of canada, and the american college of sports medicine: Nutrition and athletic performance. J. Acad. Nutr. Dietet. 2016, 116, 501–528. [Google Scholar] [CrossRef] [PubMed]
- Williams, R.A.; Roe, L.S.; Rolls, B.J. Comparison of three methods to reduce energy density. Effects on daily energy intake. Appetite 2013, 66, 75–83. [Google Scholar] [CrossRef] [PubMed]
- Houchins, J.A.; Tan, S.Y.; Campbell, W.W.; Mattes, R.D. Effects of fruit and vegetable, consumed in solid vs. beverage forms, on acute and chronic appetitive responses in lean and obese adults. Int. J. Obes. 2013, 37, 1109–1115. [Google Scholar] [CrossRef] [PubMed]
- St-Onge, M.P.; Rubiano, F.; DeNino, W.F.; Jones, A., Jr.; Greenfield, D.; Ferguson, P.W.; Akrabawi, S.; Heymsfield, S.B. Added thermogenic and satiety effects of a mixed nutrient vs. a sugar-only beverage. Int. J. Obes. Relat. Metab. Disord. 2004, 28, 248–253. [Google Scholar] [CrossRef] [PubMed]
- DellaValle, D.M.; Roe, L.S.; Rolls, B.J. Does the consumption of caloric and non-caloric beverages with a meal affect energy intake? Appetite 2005, 44, 187–193. [Google Scholar] [CrossRef] [PubMed]
- De Souza, M.J. Menstrual disturbances in athletes: A focus on luteal phase defects. Med. Sci. Sports Exerc. 2003, 35, 1553–1563. [Google Scholar] [CrossRef] [PubMed]
- De Souza, M.J.; Lee, D.K.; VanHeest, J.L.; Scheid, J.L.; West, S.L.; Williams, N.I. Severity of energy-related menstrual disturbances increases in proportion to indices of energy conservation in exercising women. Fertil. Steril. 2007, 88, 971–975. [Google Scholar] [CrossRef] [PubMed]
- Howe, S.M.; Hand, T.M.; Manore, M.M. Exercise-trained men and women: Role of exercise and diet on appetite and energy intake. Nutrients 2014, 6, 4935–4960. [Google Scholar] [CrossRef] [PubMed]
- Stensel, D. Exercise, appetite and appetite-regulating hormones: Implications for food intake and weight control. Ann. Nutr. Metab. 2010, 57, 36–42. [Google Scholar] [CrossRef] [PubMed]
- King, J.A.; Miyashita, M.; Wasse, L.K.; Stensel, D.J. Influence of prolonged treadmill running on appetite, energy intake and circulating concentrations of acylated ghrelin. Appetite 2010, 54, 492–498. [Google Scholar] [CrossRef] [PubMed]
- Martins, C.; Kulseng, B.; King, N.; Holst, J.; Blundell, J. The effects of exercise-induced weight loss on appetite-related peptides and motivation to eat. J. Clin. Endocrinol. Metab. 2010, 95, 1609–1616. [Google Scholar] [CrossRef] [PubMed]


| Description | ExMD (n = 9) | EU (n = 18) | p |
|---|---|---|---|
| Age (year) | 24.3 ± 6.0 | 27.6 ± 6.0 | 0.191 |
| Age at Menarche (year) | 13.4 ± 1.9 | 13.1 ± 1.2 | -- |
| Gynecological Age (year) 2 | 10.9 ± 6.8 | 14.5 ± 5.6 | -- |
| Height (cm) | 165.6 ± 6.6 | 168.4 ± 5.5 | 0.246 |
| Weight (kg) | 60.1 ± 10.1 | 63.5 ± 8.6 | 0.366 |
| Body Mass Index (BMI) (kg/m2) | 21.8 ± 2.8 | 22.3 ± 2.5 | -- |
| Fat Free Mass (FFM) (kg) | 47.3 ± 5.7 | 51.1 ± 4.5 | 0.066 |
| Body Fat (BF) (%) | 20.7 ± 6.0 | 19.0 ± 5.7 | 0.479 |
| VO2MAX (mL/kg/min) | 49.3 ± 5.5 | 53.0 ± 5.2 | 0.104 |
| Exercise > 4.0 METs (min/day) 3 | 82 ± 36 | 72 ± 48 | -- |
| Description | Units | ExMD (n = 9) | EU (n = 18) | p |
|---|---|---|---|---|
| Total Energy | kcals/day | 2237 ± 378 | 2456 ± 470 | 0.316 |
| kcal/kg | 37.8 ± 6.7 | 39.1 ± 7.9 | -- | |
| Protein | g/kg | 1.4 ± 0.2 | 1.6 ± 0.4 | 0.269 |
| % energy | 15.1 ± 3.2 | 16.5 ± 3.3 | -- | |
| g/day | 83.7 ± 18.9 | 99.8 ± 24.4 | -- | |
| Carbohydrate | g/kg | 5.0 ± 1.2 | 4.9 ± 1.3 | 0.758 |
| % energy | 52.8 ± 5.9 | 49.9 ± 6.6 | -- | |
| g/day | 296 ± 64 | 309 ± 79 | -- | |
| Fat | g/kg | 1.3 ± 0.3 | 1.4 ± 0.3 | 0.269 |
| % energy | 30.1 ± 3.7 | 33.3 ± 5.3 | -- | |
| g/day | 74.8 ± 15.6 | 89.8 ± 21.1 | -- | |
| Alcohol | g/kg | 0.2 ± 0.2 | 0.1 ± 0.2 | -- |
| % energy | 3.8 ± 3.6 | 2.0 ± 3.1 | -- | |
| g/day | 11.4 ± 12.9 | 7.6 ± 10.4 | -- | |
| Fiber | g/1000 kcal/day | 11.6 ± 3.1 | 12.9 ± 3.3 | 0.220 2 |
| g/day | 28.5 ± 8.7 | 32.2 ± 11.3 | -- | |
| Caffeine | mg/day | 154 ± 113 | 106 ± 106 | -- |
| Calcium | mg/day | 1268 ± 556 | 1201 ± 407 | -- |
| Magnesium | mg/day | 289 ± 107 | 355 ± 176 | -- |
| Iron | mg/day | 27.2 ± 15.3 | 21.8 ± 8.2 | -- |
| Folate | mcg/day | 516 ± 441 | 495 ± 288 | -- |
| Vitamin B6 | mg/day | 3.8 ± 2.7 | 3.0 ± 2.0 | -- |
| Vitamin B12 | mcg/day | 12.3 ± 23.7 | 6.8 ± 4.4 | -- |
| Vitamin D | IU/day | 360 ± 306 | 246 ± 267 | -- |
© 2016 by the authors; licensee MDPI, Basel, Switzerland. This article is an open access article distributed under the terms and conditions of the Creative Commons Attribution (CC-BY) license (http://creativecommons.org/licenses/by/4.0/).
Share and Cite
Hand, T.M.; Howe, S.; Cialdella-Kam, L.; Hoffman, C.P.G.; Manore, M. A Pilot Study: Dietary Energy Density is Similar between Active Women with and without Exercise-Associated Menstrual Dysfunction. Nutrients 2016, 8, 230. https://doi.org/10.3390/nu8040230
Hand TM, Howe S, Cialdella-Kam L, Hoffman CPG, Manore M. A Pilot Study: Dietary Energy Density is Similar between Active Women with and without Exercise-Associated Menstrual Dysfunction. Nutrients. 2016; 8(4):230. https://doi.org/10.3390/nu8040230
Chicago/Turabian StyleHand, Taryn M., Stephanie Howe, Lynn Cialdella-Kam, Charlotte P. Guebels Hoffman, and Melinda Manore. 2016. "A Pilot Study: Dietary Energy Density is Similar between Active Women with and without Exercise-Associated Menstrual Dysfunction" Nutrients 8, no. 4: 230. https://doi.org/10.3390/nu8040230
APA StyleHand, T. M., Howe, S., Cialdella-Kam, L., Hoffman, C. P. G., & Manore, M. (2016). A Pilot Study: Dietary Energy Density is Similar between Active Women with and without Exercise-Associated Menstrual Dysfunction. Nutrients, 8(4), 230. https://doi.org/10.3390/nu8040230