Dairy Product Consumption and Risk of Non-Hodgkin Lymphoma: A Meta-Analysis

Abstract
:1. Introduction
2. Materials and Methods
2.1. Literature Search Strategy
2.2. Inclusion Criteria
2.3. Data Extraction
2.4. Statistical Analysis
3. Results
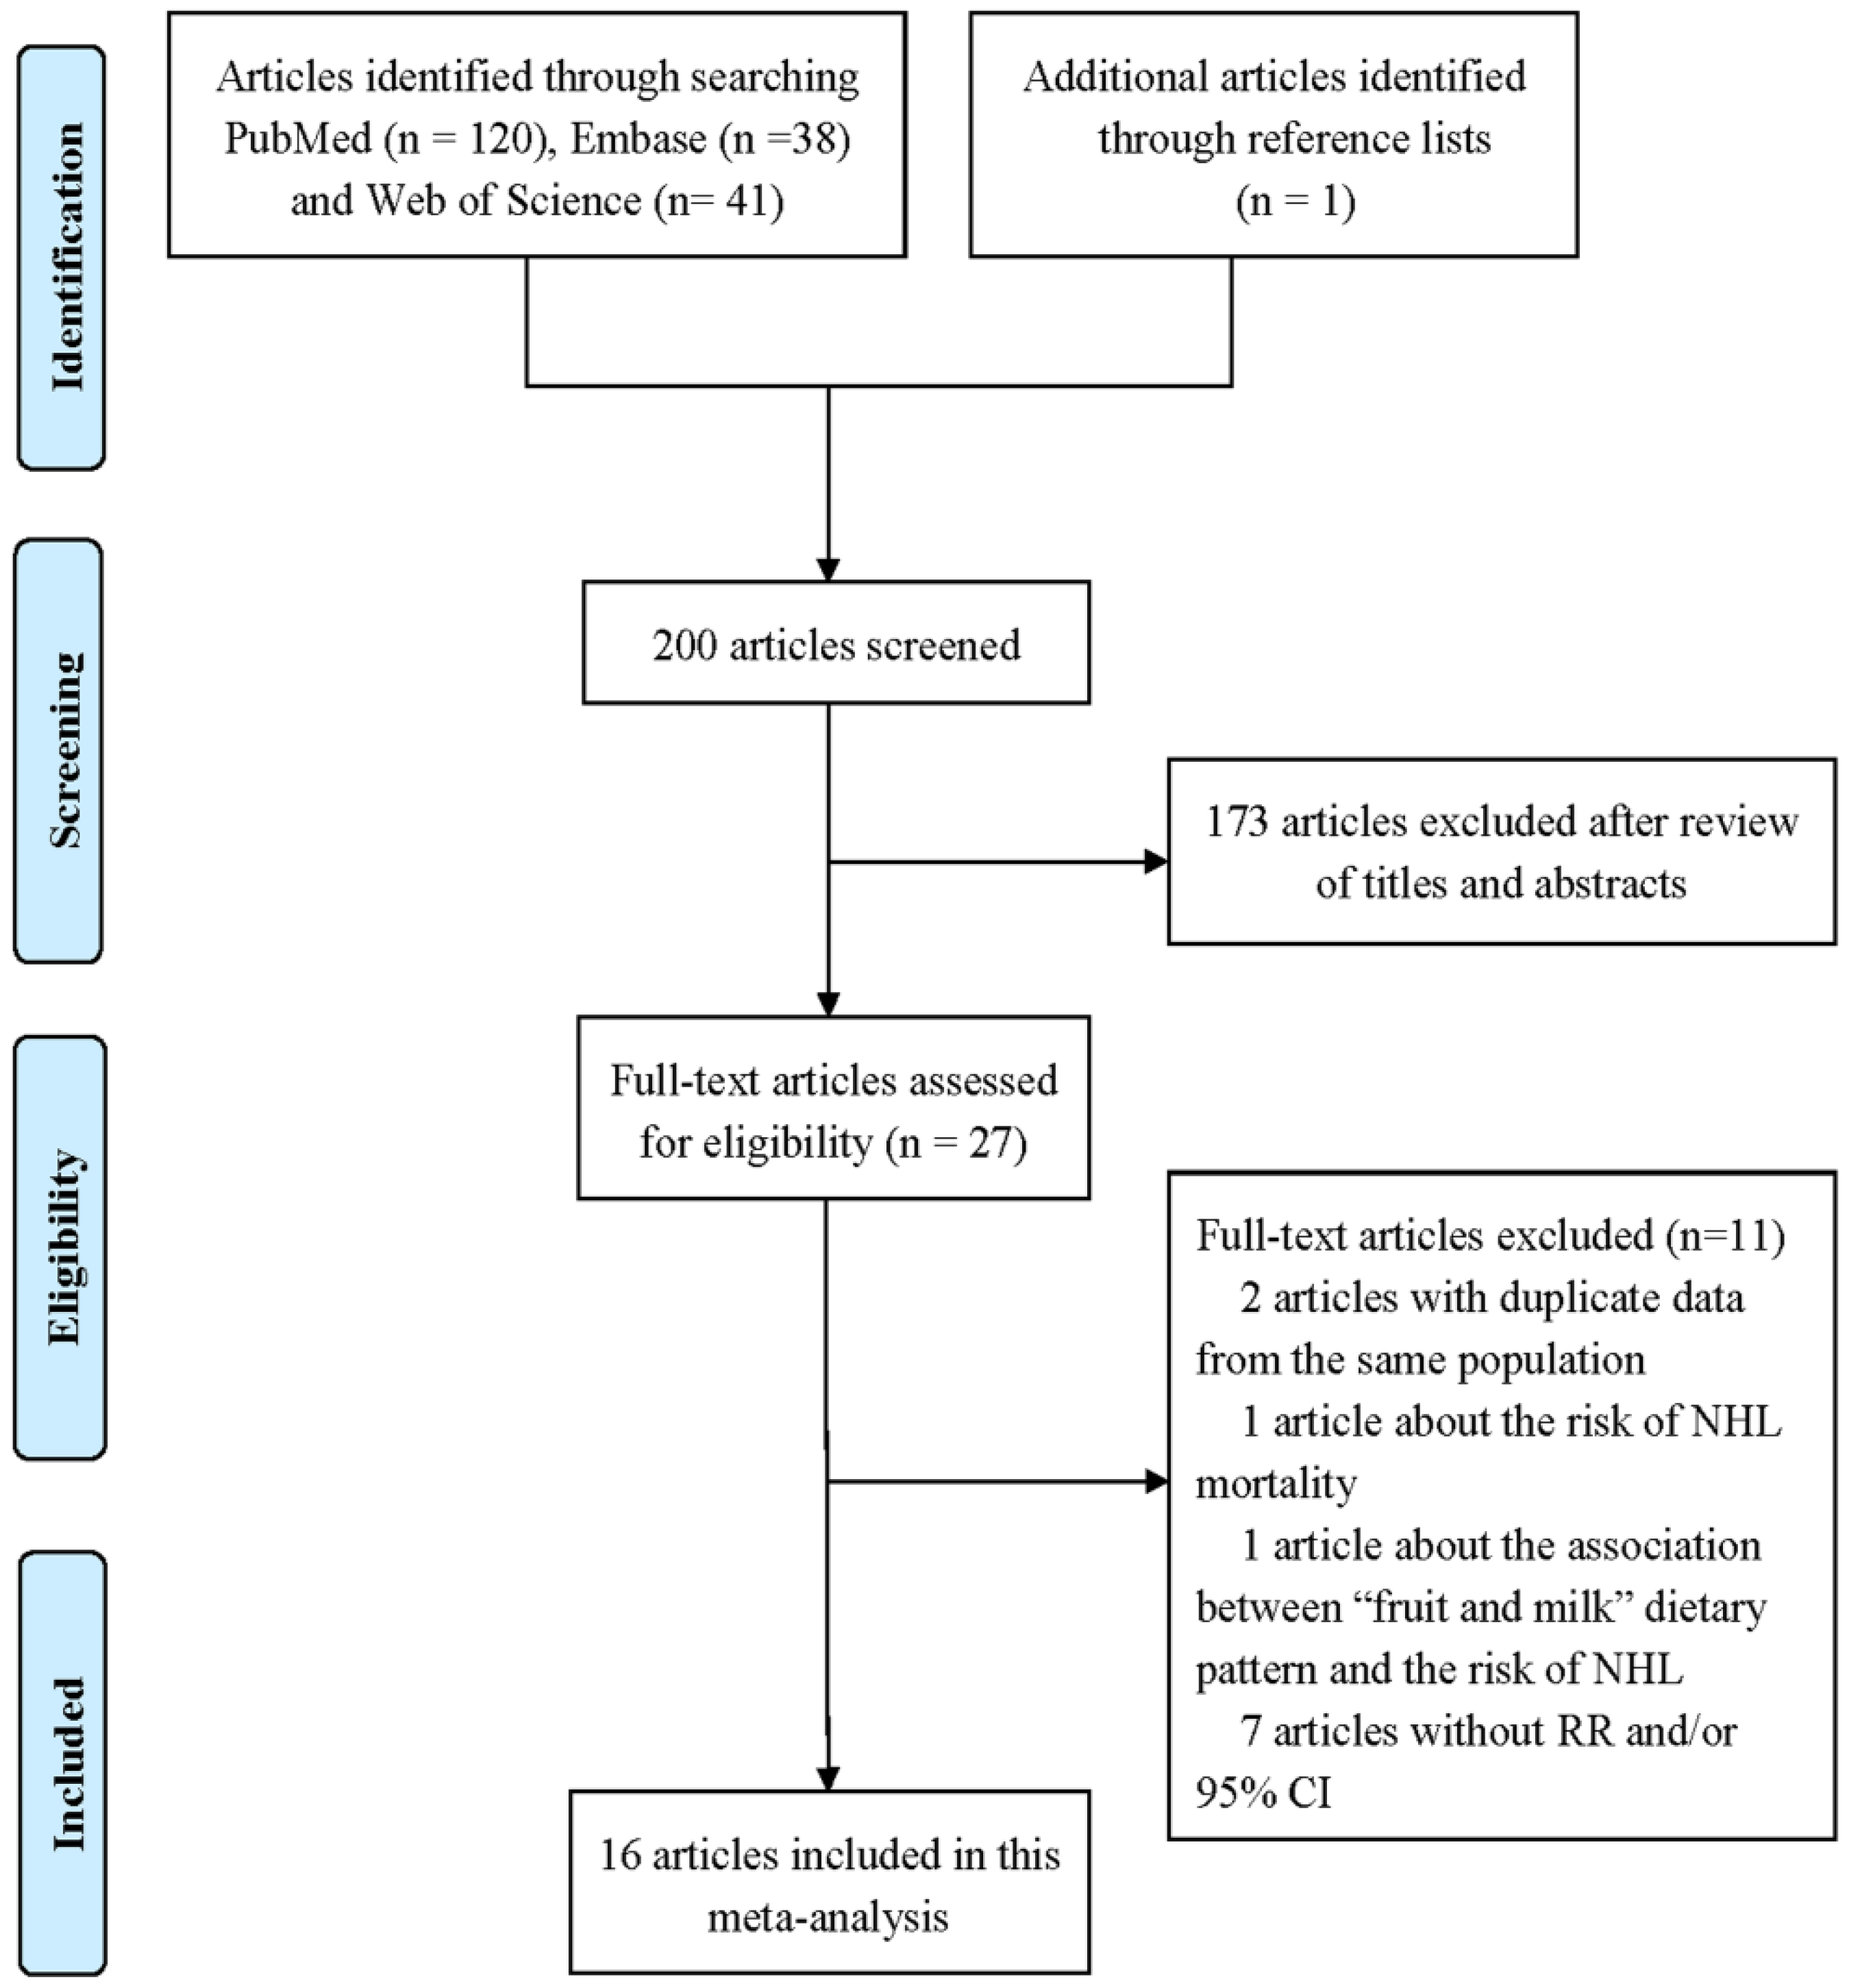
3.1. Literature Search and Study Characteristics
3.2. Quantitative Synthesis
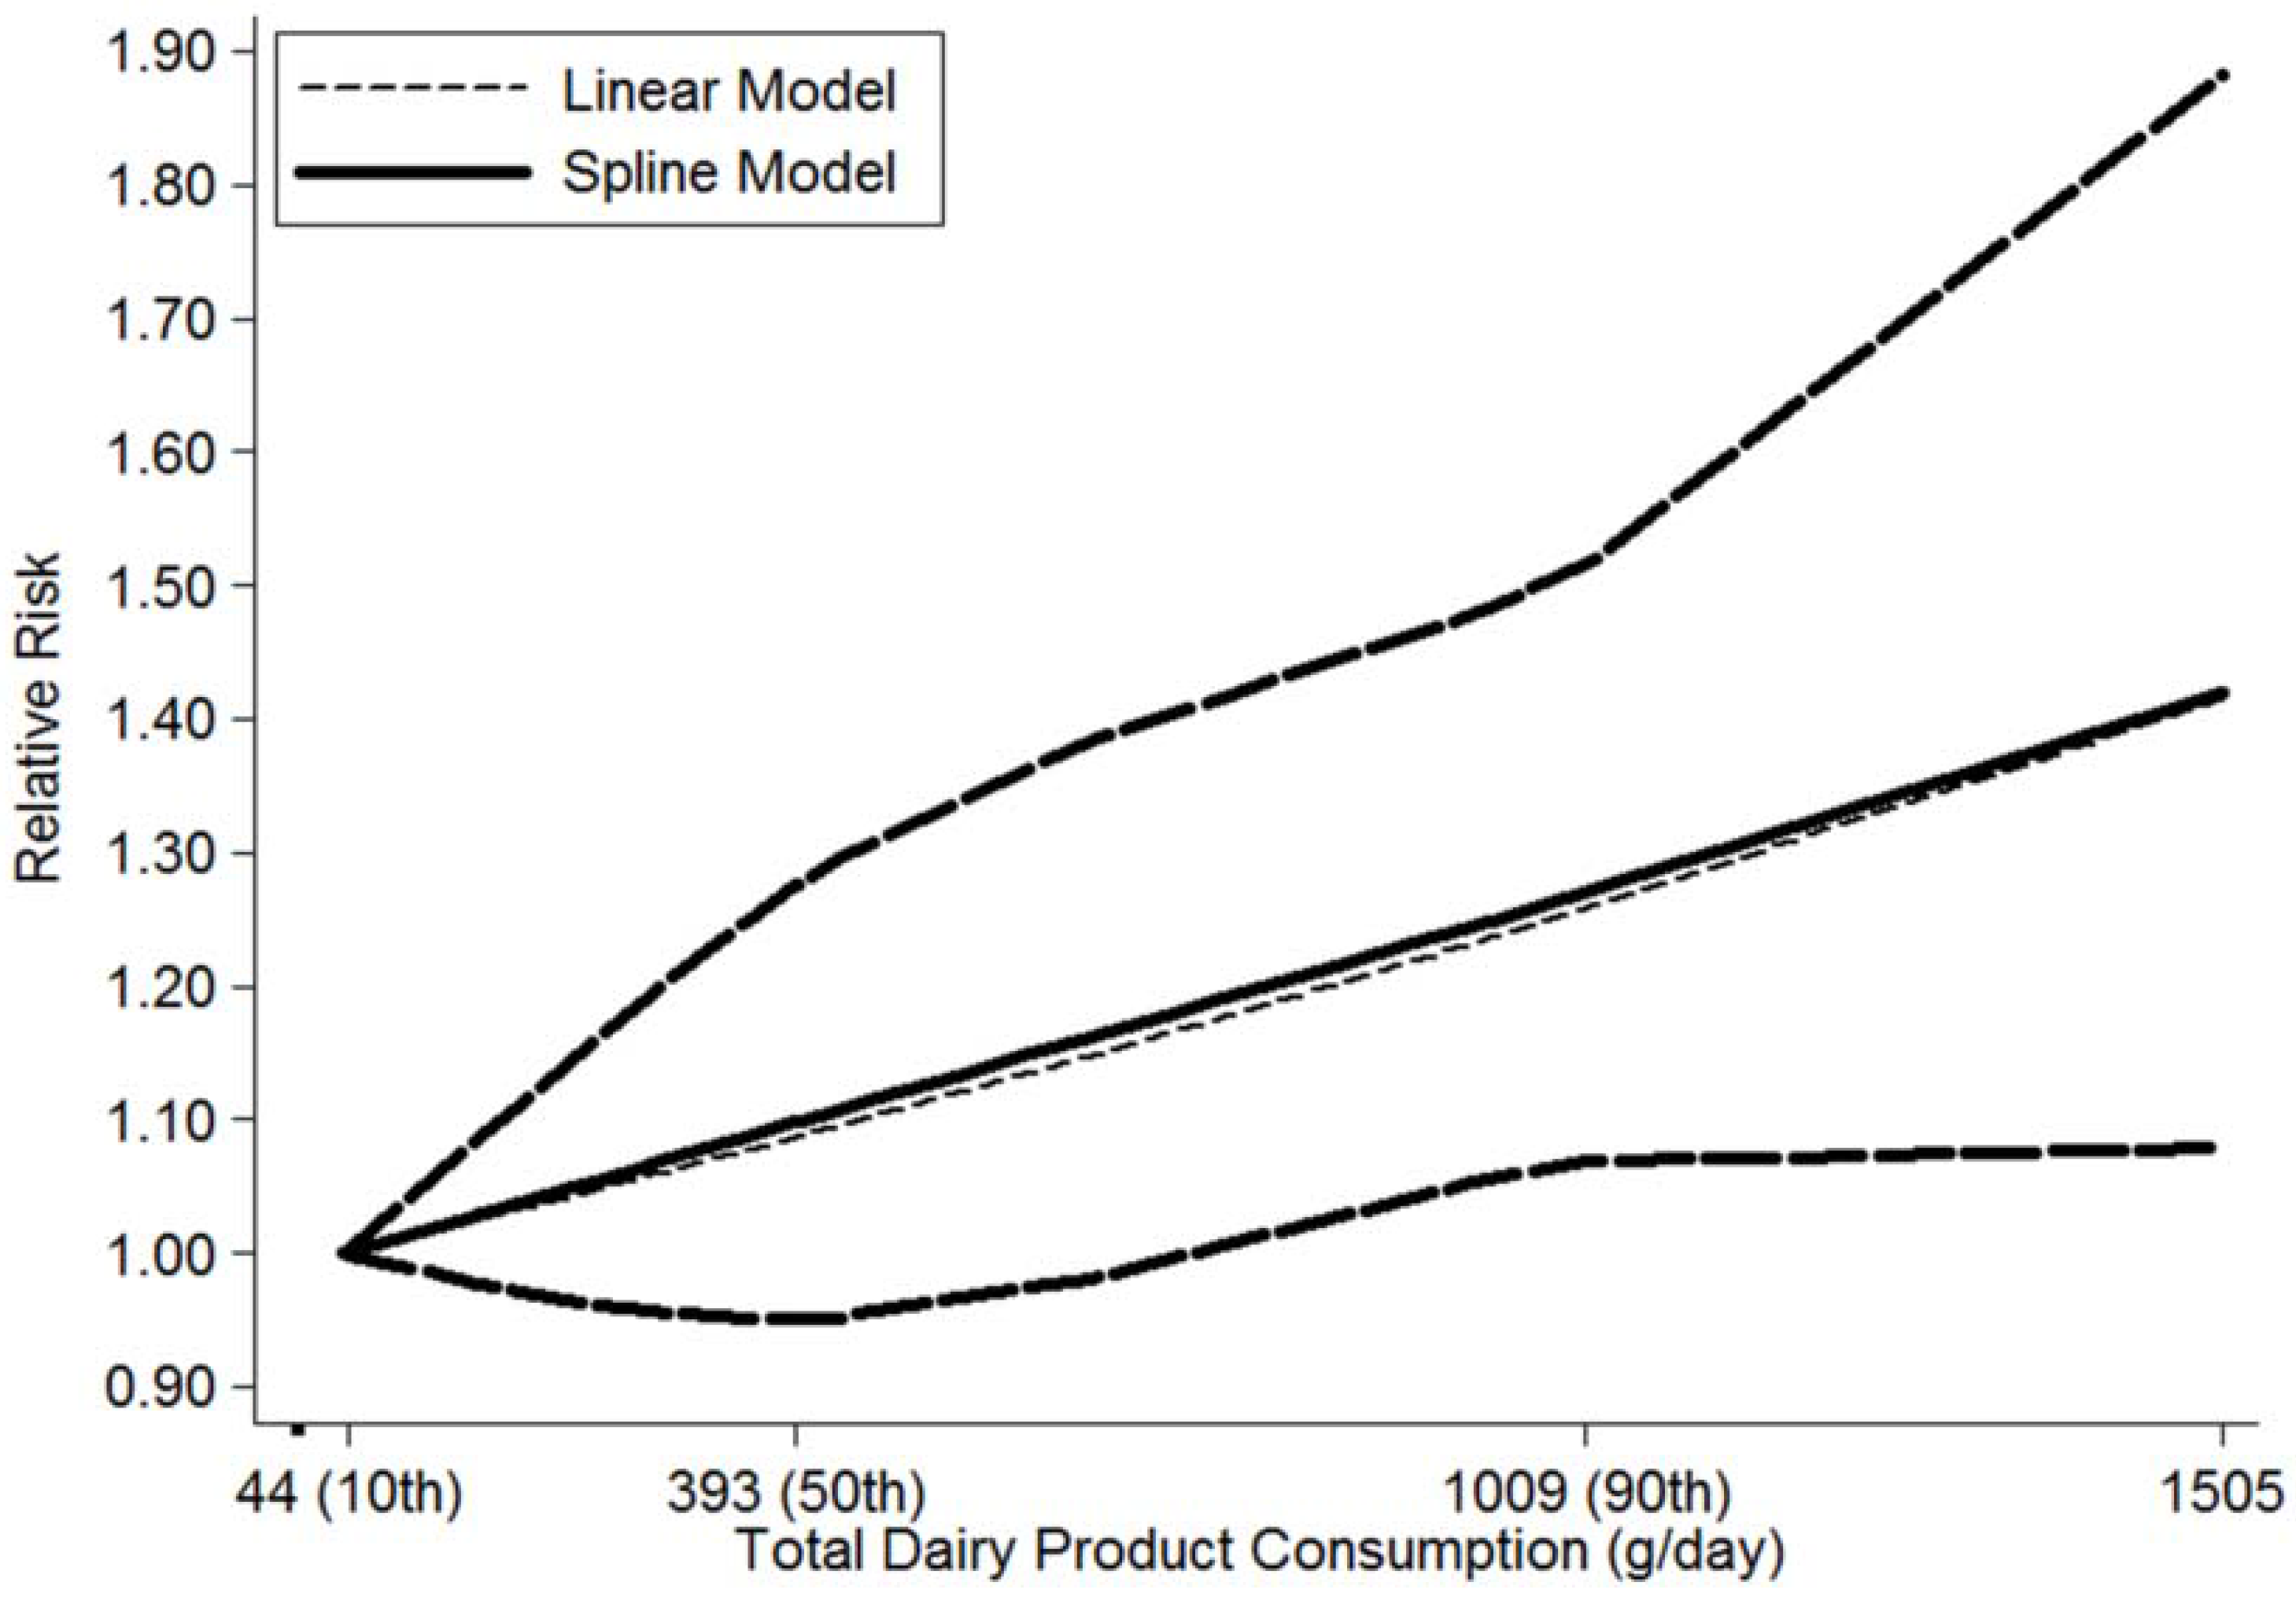
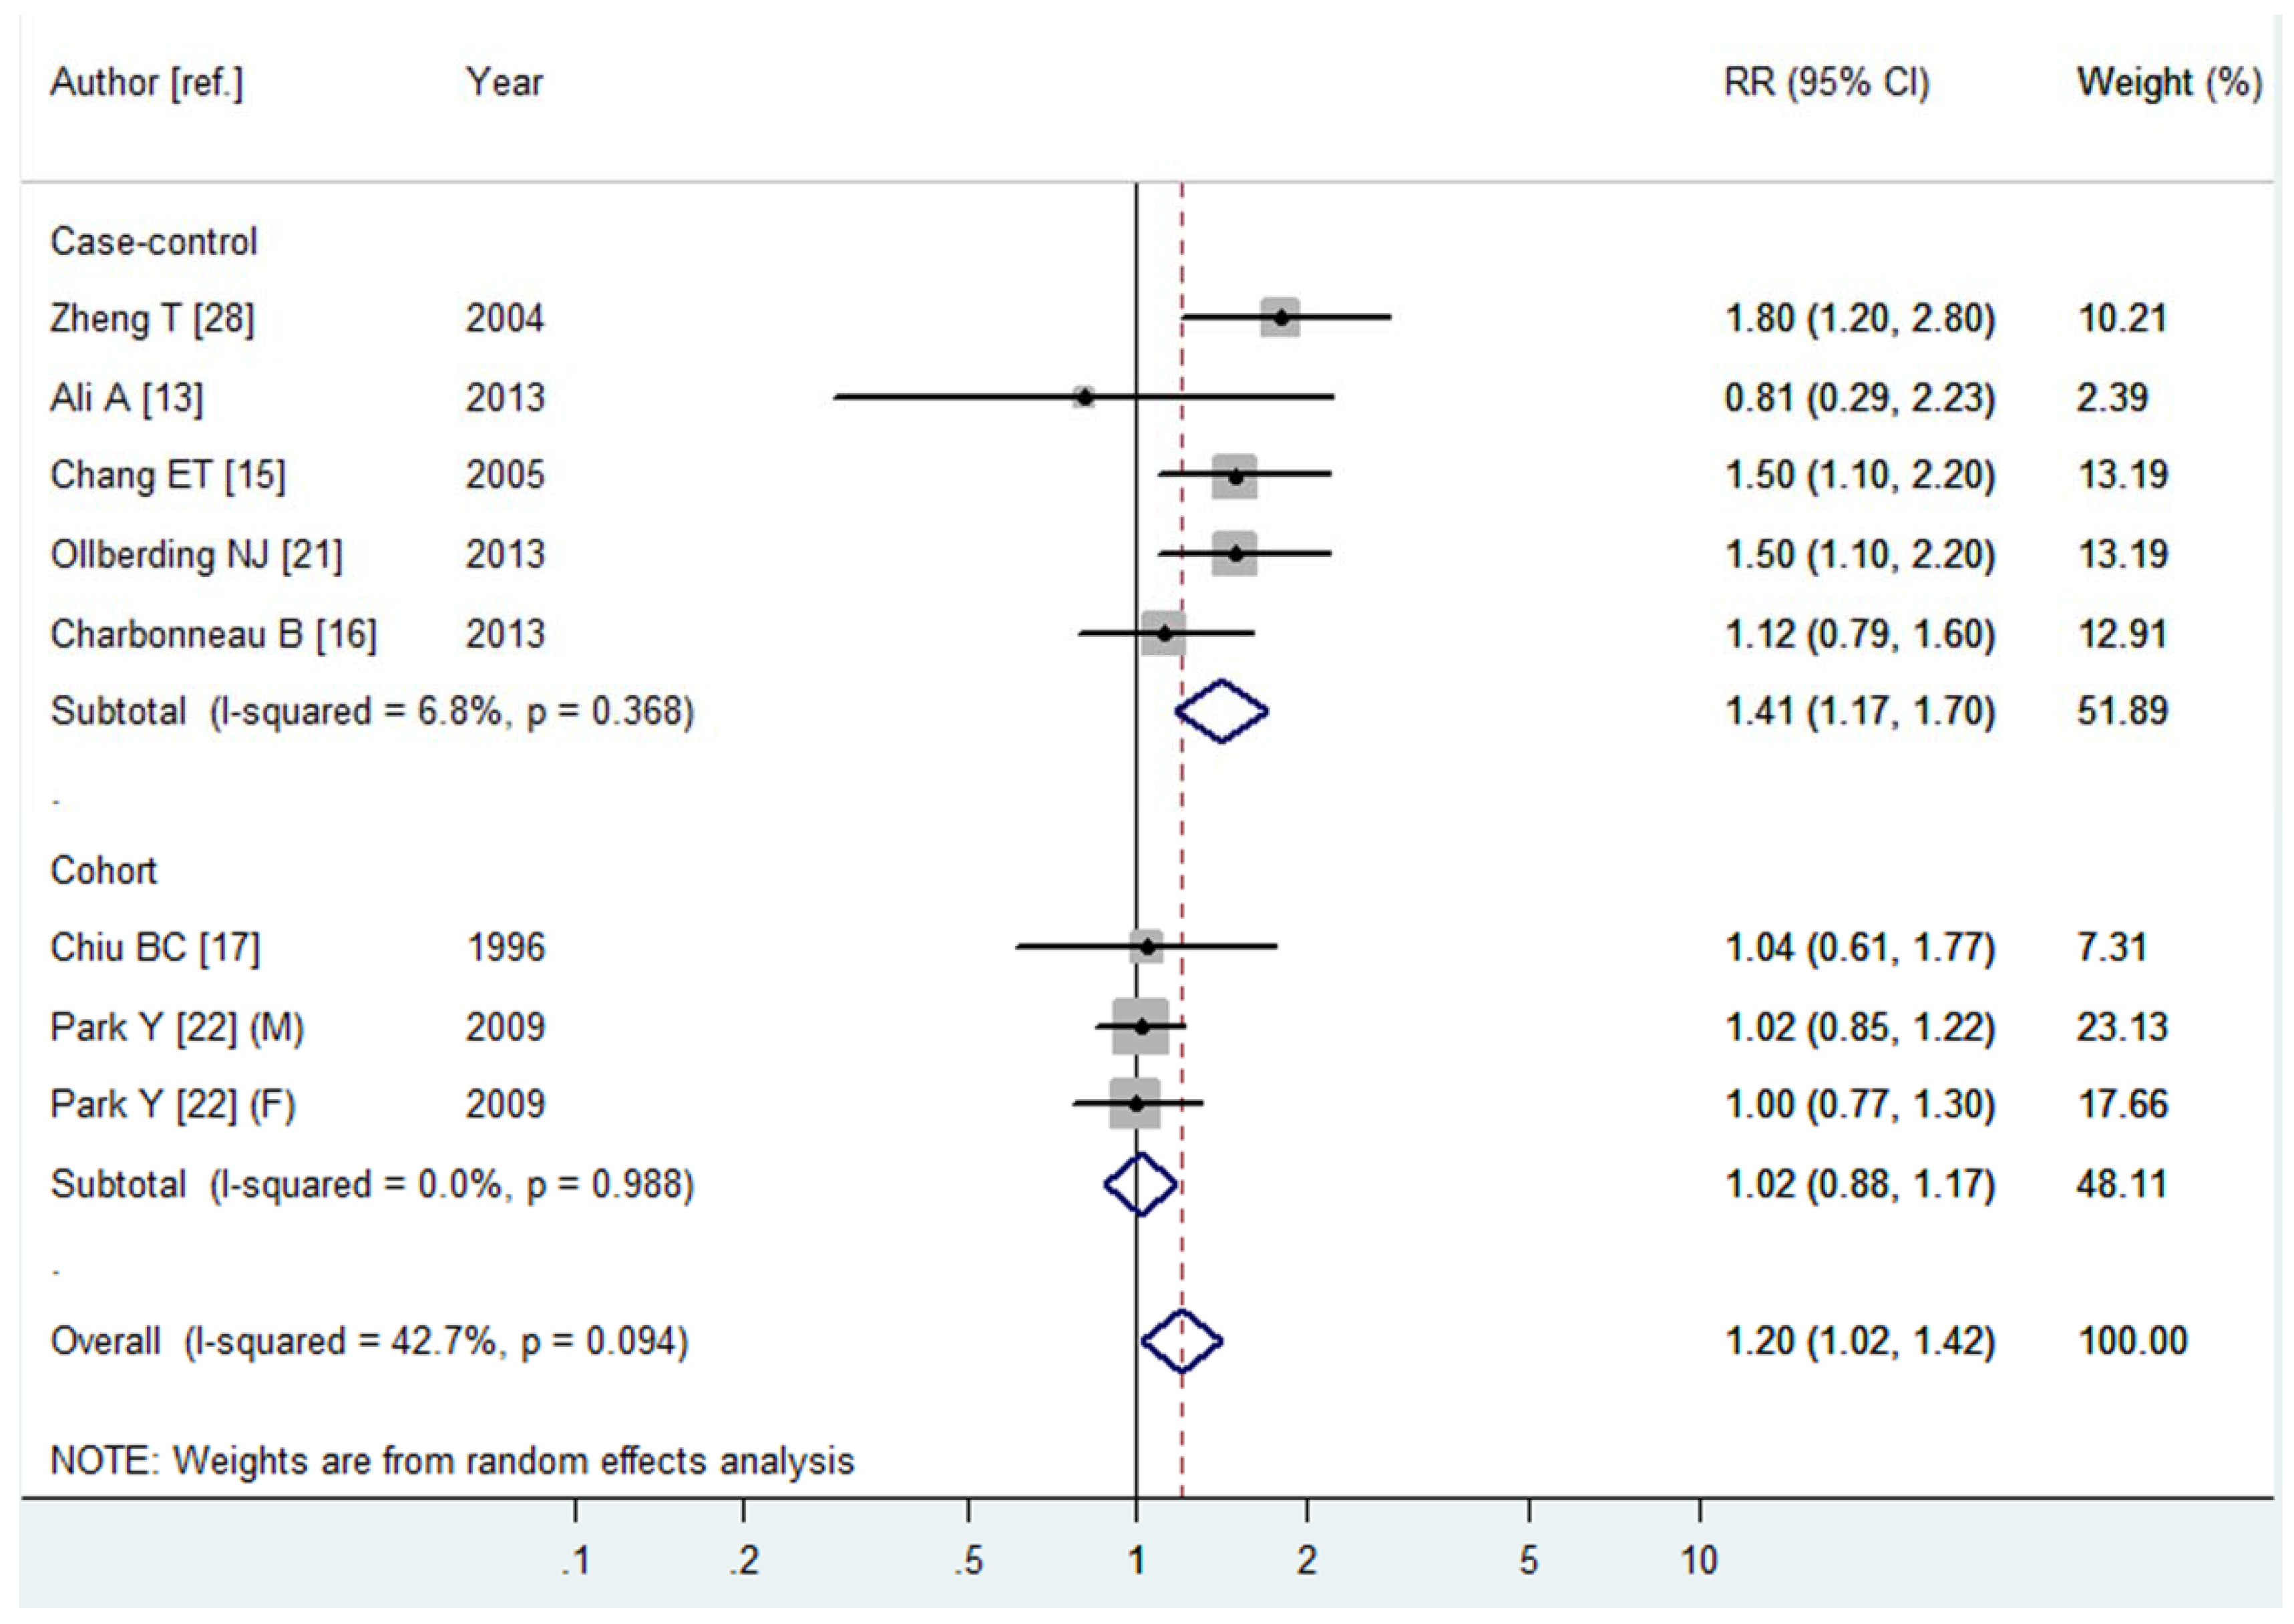
3.2.1. Total Dairy Product Consumption and the Risk of NHL
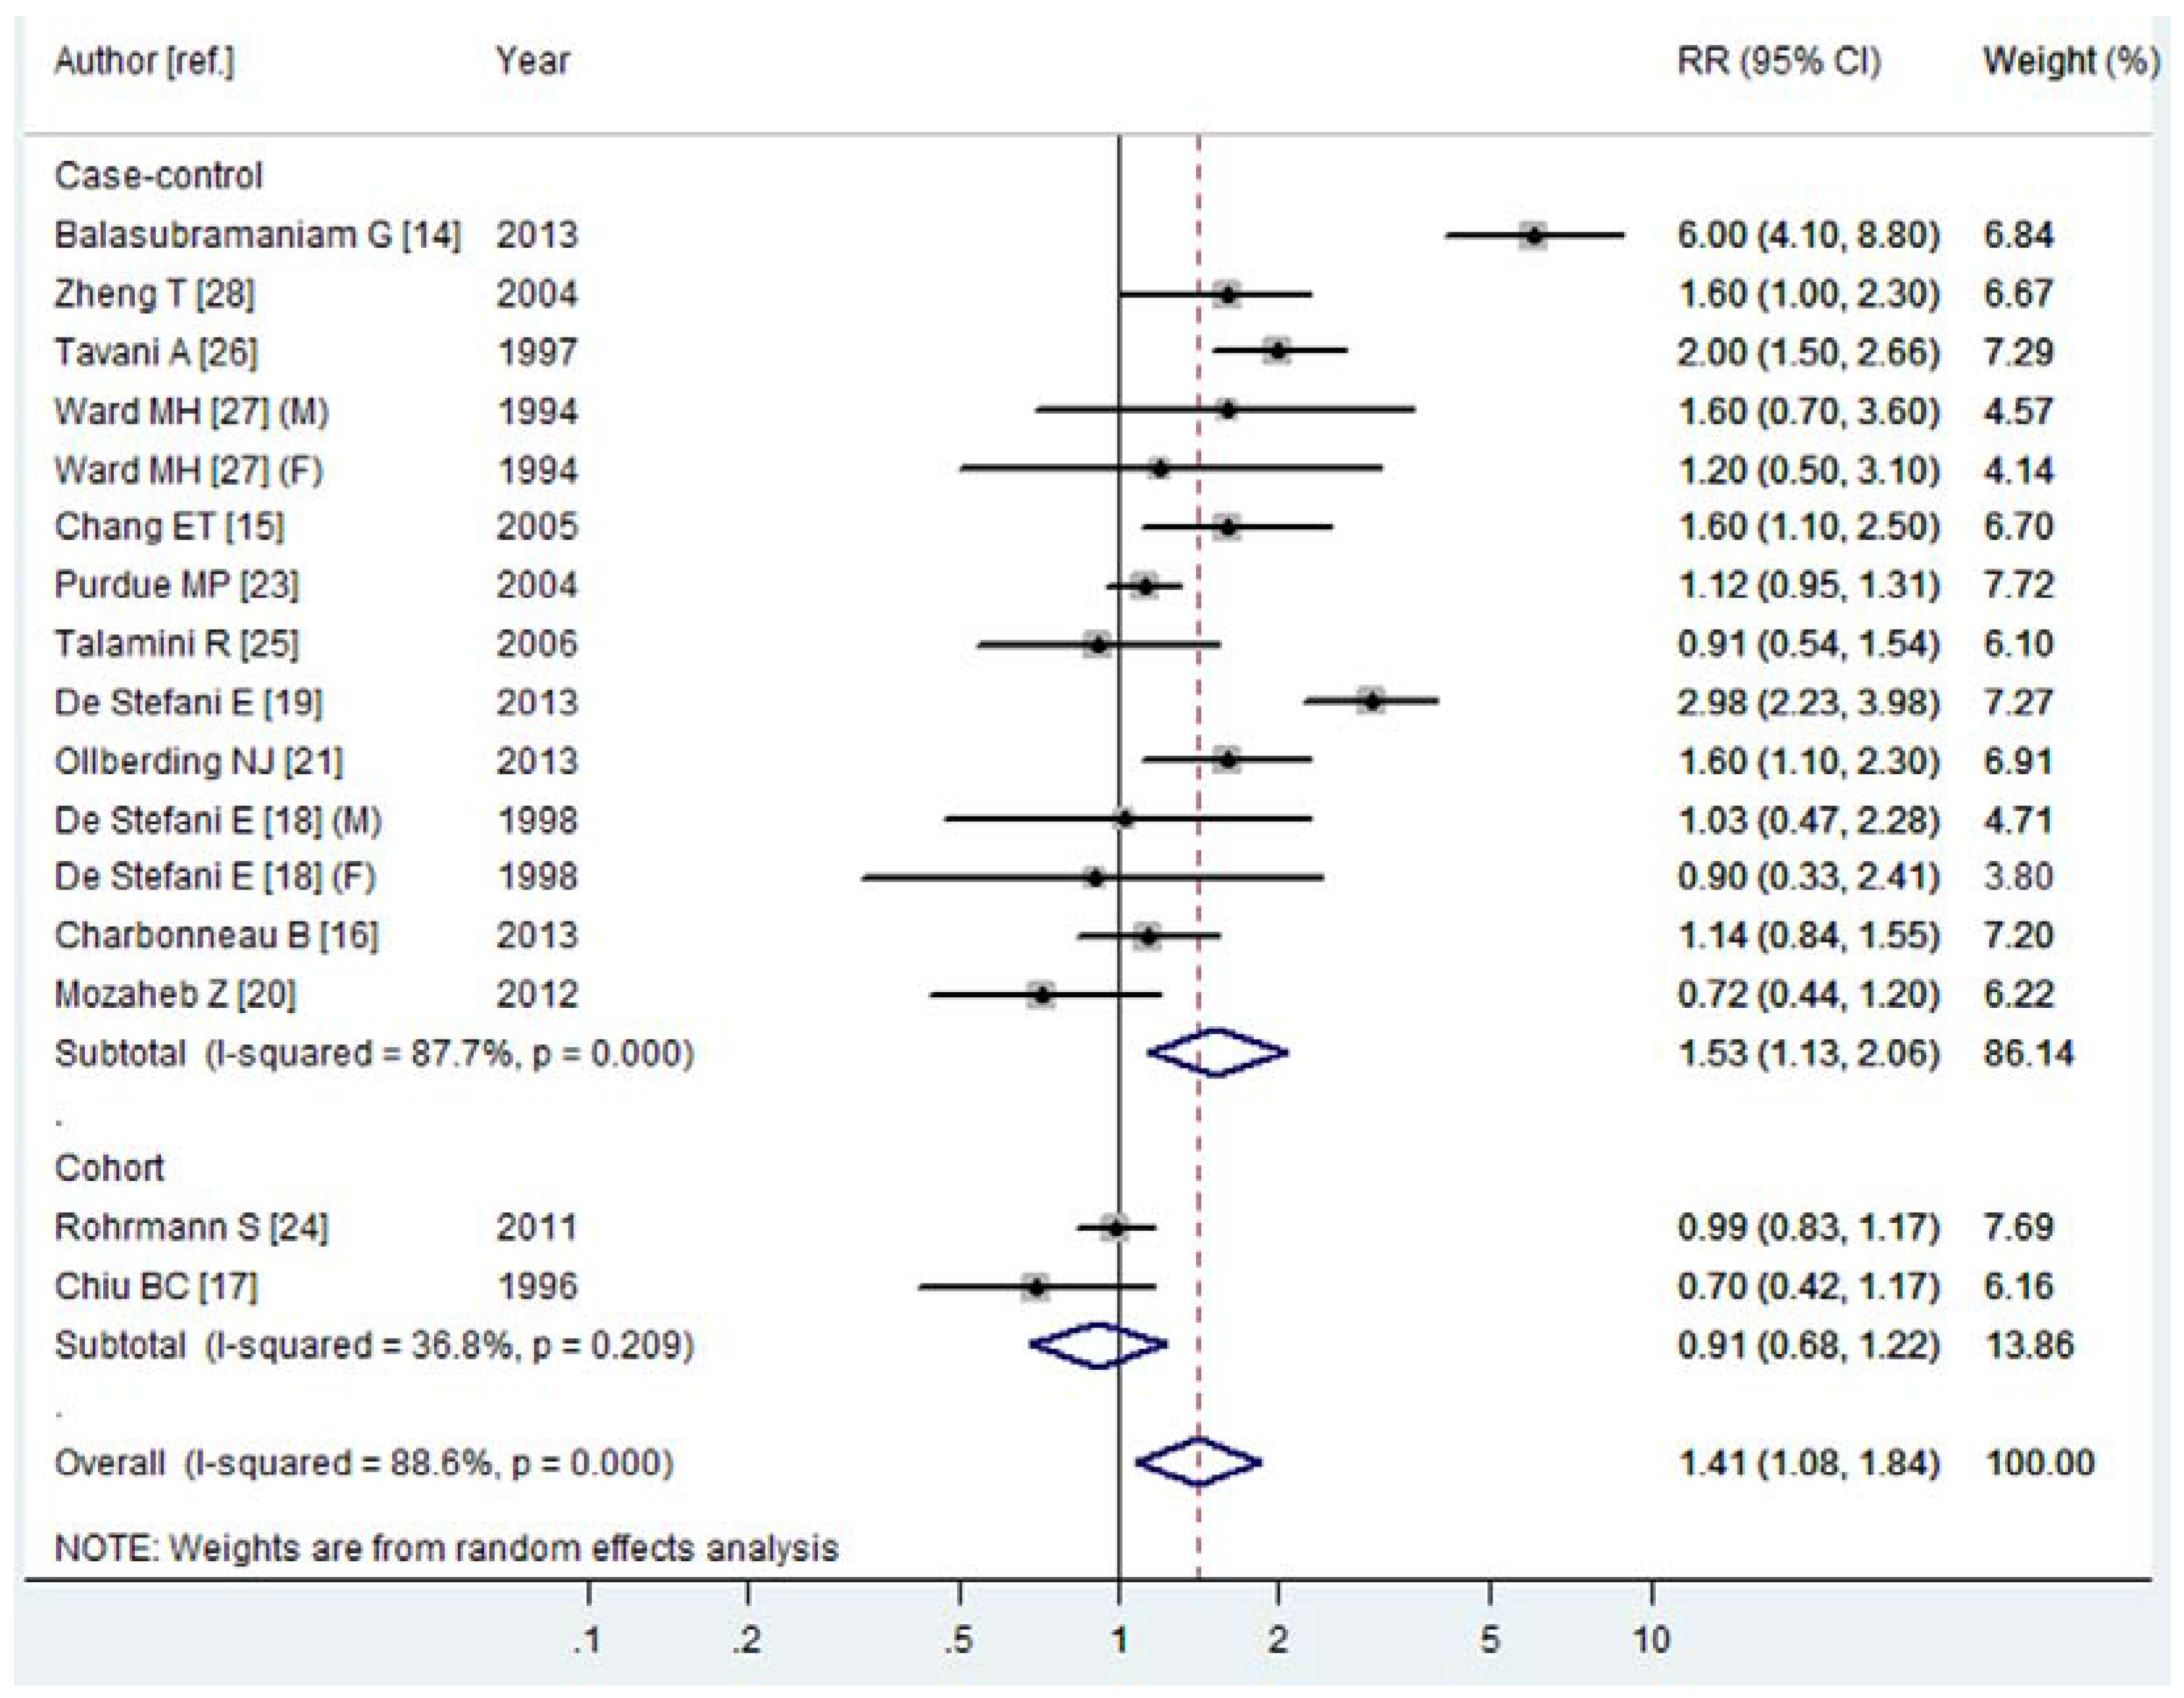
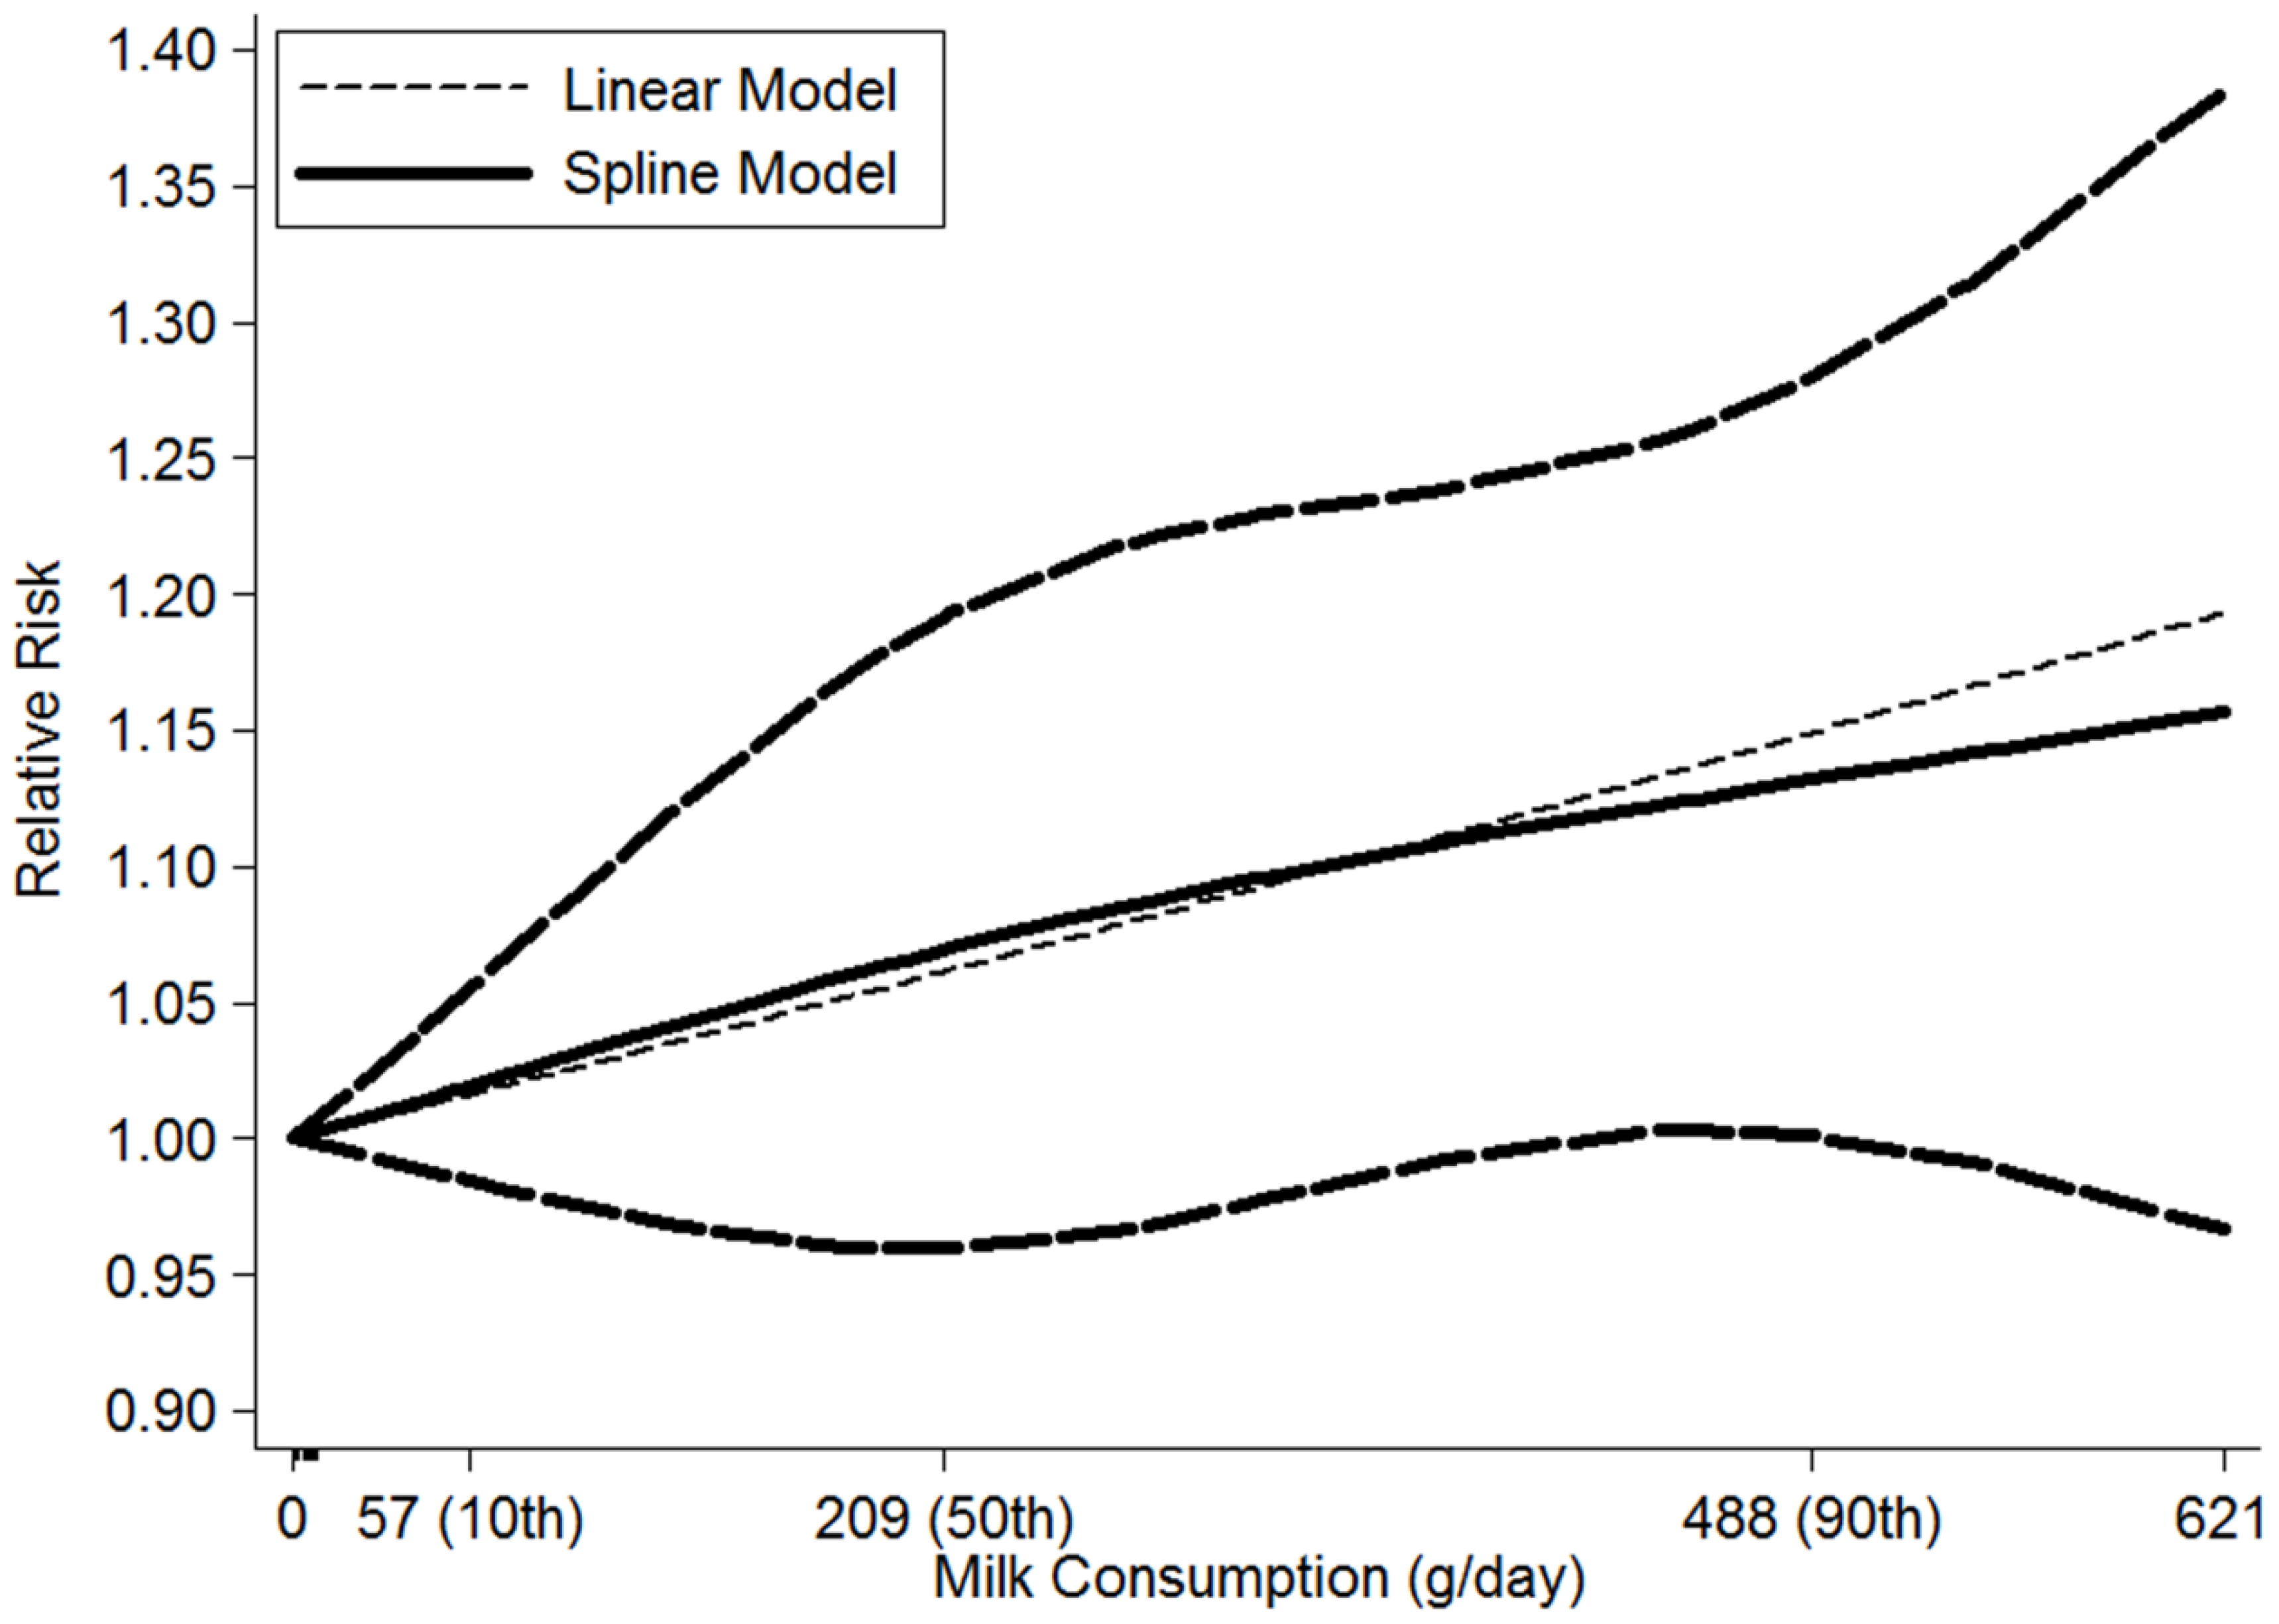
3.2.2. Milk Consumption and the Risk of NHL
3.2.3. Cheese Consumption and the Risk of NHL
3.2.4. Other Dairy Product Consumption and the Risk of NHL
3.3. Meta-Regression and Influence Analysis
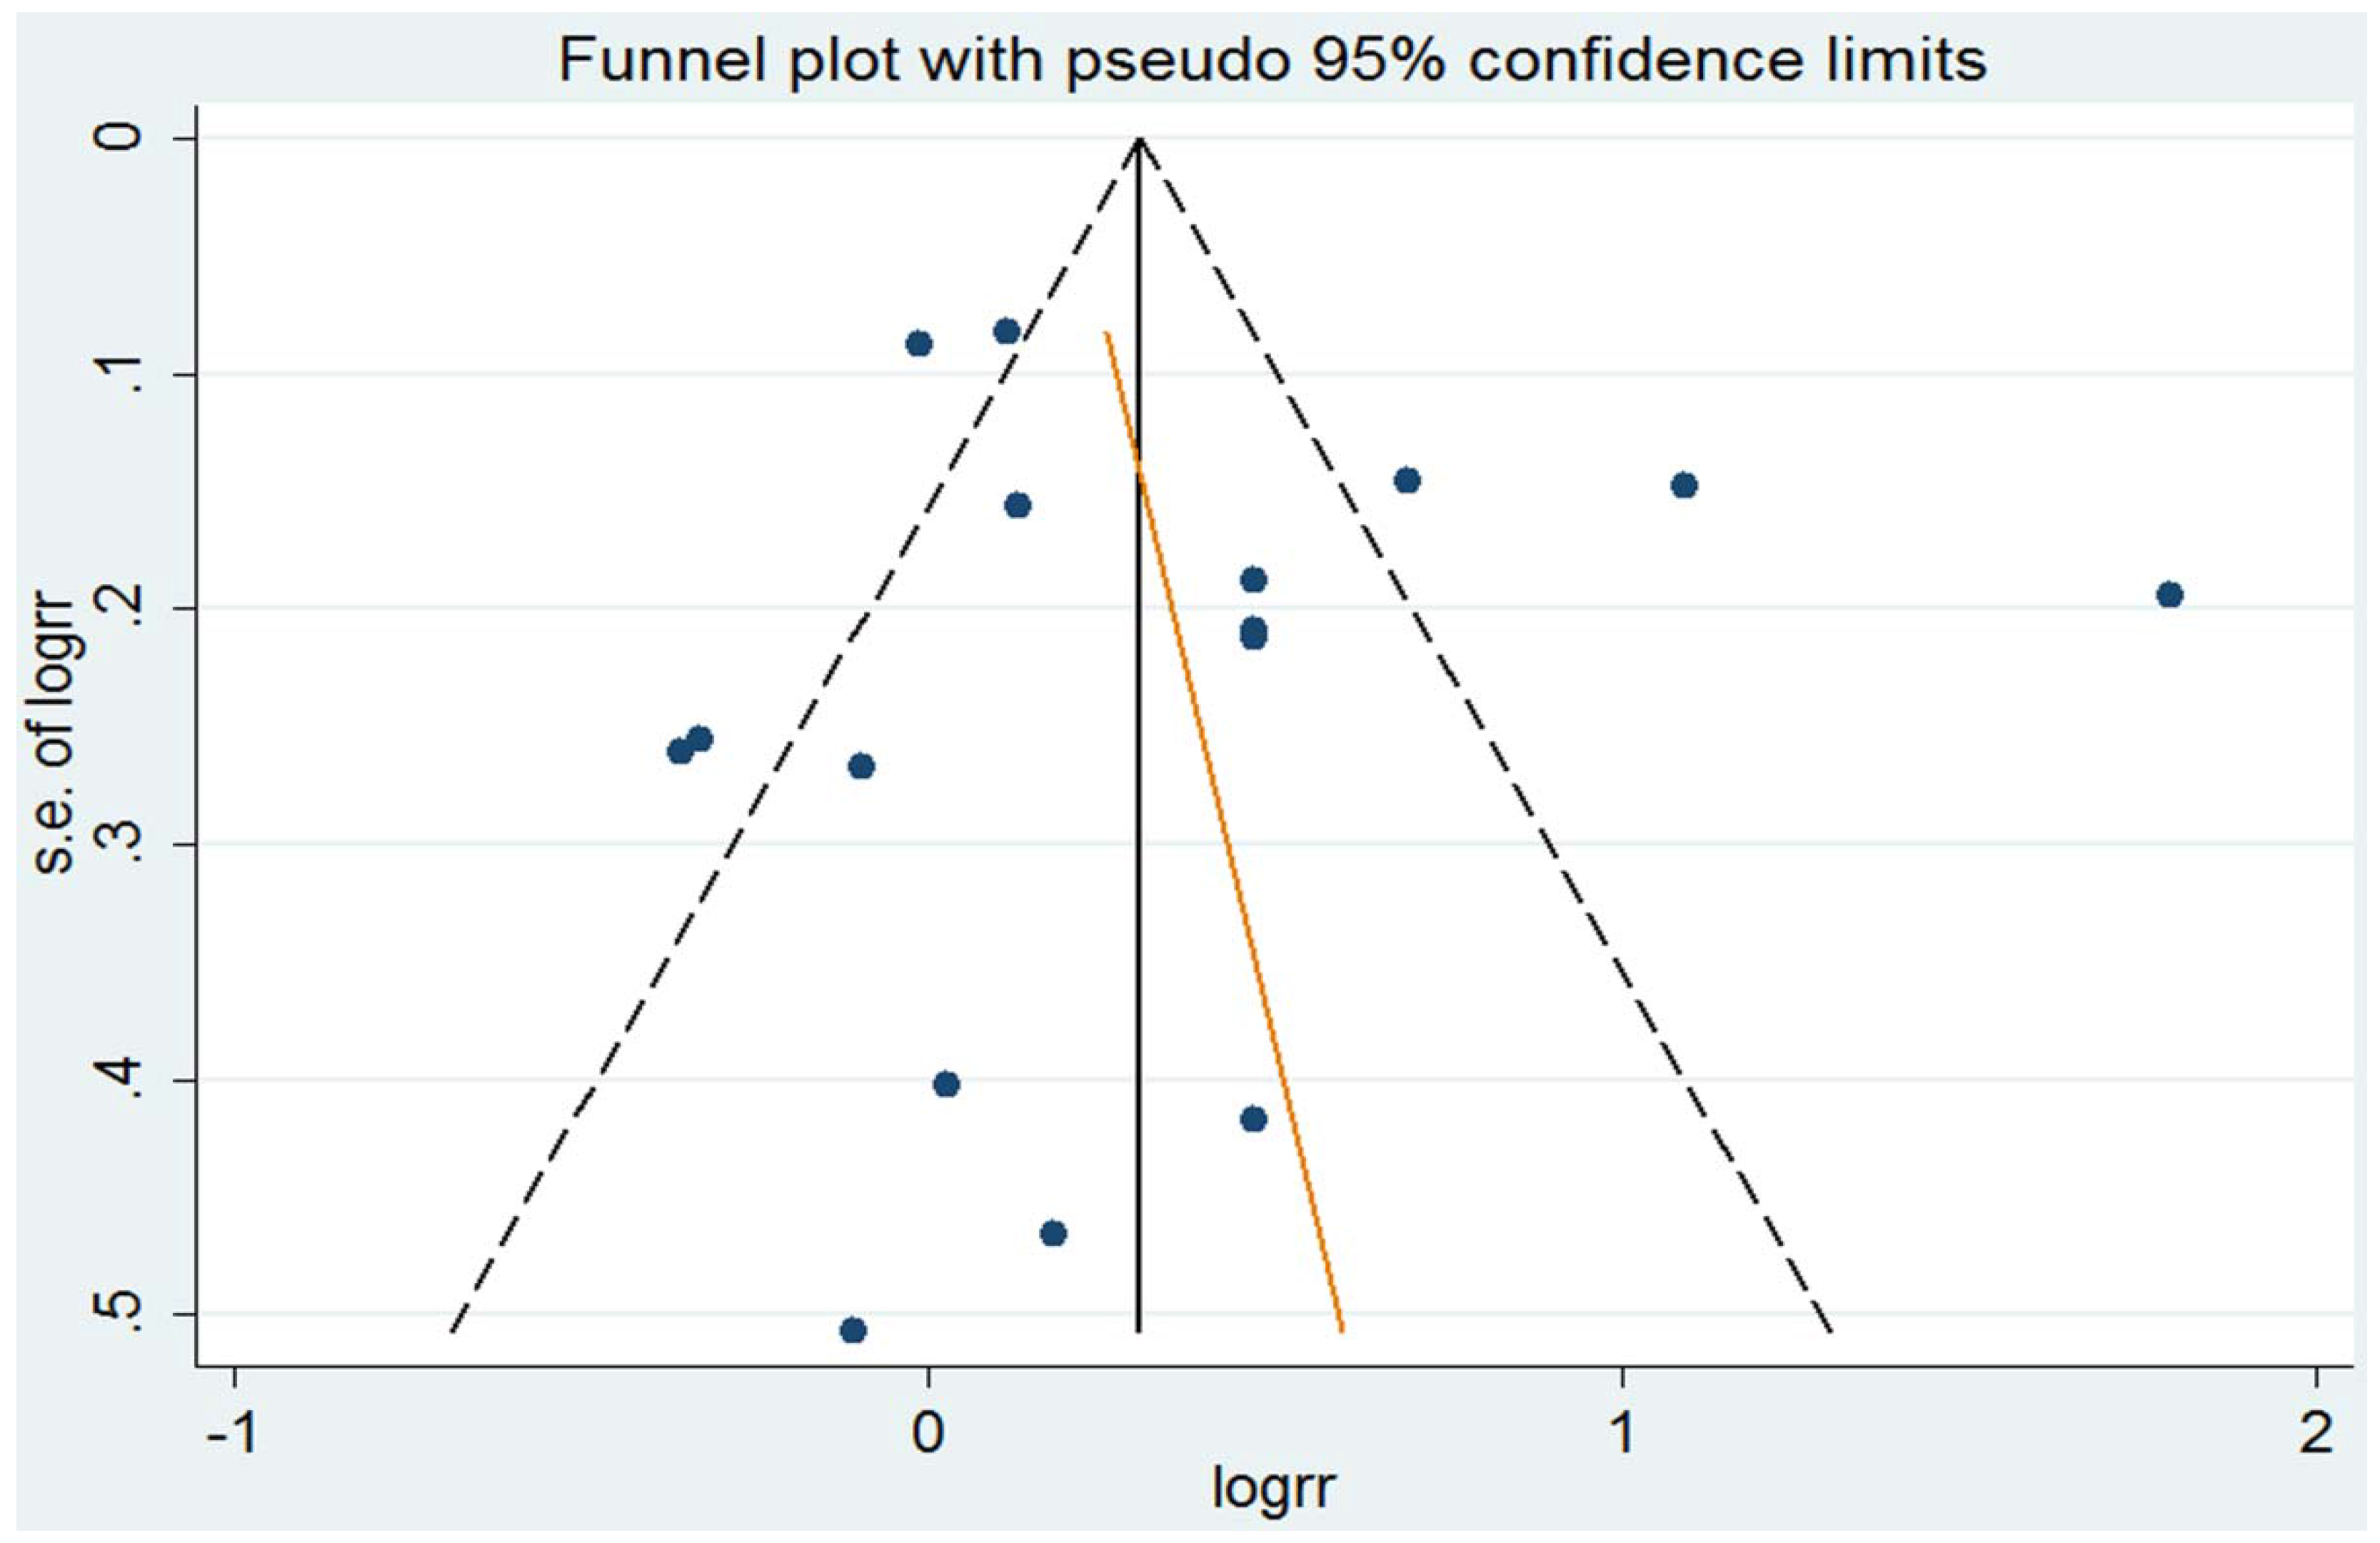
3.4. Small-Study Effect Evaluation
4. Discussion
5. Conclusions
Acknowledgments
Author Contributions
Conflicts of Interest
References
- Huncharek, M.; Muscat, J.; Kupelnick, B. Impact of dairy products and dietary calcium on bone-mineral content in children: Results of a meta-analysis. Bone 2008, 43, 312–321. [Google Scholar] [CrossRef] [PubMed]
- Qin, L.Q.; Xu, J.Y.; Han, S.F.; Zhang, Z.L.; Zhao, Y.Y.; Szeto, I.M. Dairy consumption and risk of cardiovascular disease: An updated meta-analysis of prospective cohort studies. Asia Pac. J. Clin. Nutr. 2015, 24, 90–100. [Google Scholar] [PubMed]
- Chen, M.; Sun, Q.; Giovannucci, E.; Mozaffarian, D.; Manson, J.E.; Willett, W.C.; Hu, F.B. Dairy consumption and risk of type 2 diabetes: 3 cohorts of US adults and an updated meta-analysis. BMC Med. 2014, 12, 215. [Google Scholar] [CrossRef] [PubMed]
- Cho, E.; Smith-Warner, S.A.; Spiegelman, D.; Beeson, W.L.; van den Brandt, P.A.; Colditz, G.A.; Folsom, A.R.; Fraser, G.E.; Freudenheim, J.L.; Giovannucci, E.; et al. Dairy foods, calcium, and colorectal cancer: A pooled analysis of 10 cohort studies. J. Natl. Cancer Inst. 2004, 96, 1015–1022. [Google Scholar] [CrossRef] [PubMed]
- Jiang, W.; Ju, C.; Jiang, H.; Zhang, D. Dairy foods intake and risk of Parkinson’s disease: A dose-response meta-analysis of prospective cohort studies. Eur. J. Epidemiol 2014, 29, 613–619. [Google Scholar] [CrossRef] [PubMed]
- Aune, D.; Navarro Rosenblatt, D.A.; Chan, D.S.; Vieira, A.R.; Vieira, R.; Greenwood, D.C.; Vatten, L.J.; Norat, T. Dairy products, calcium, and prostate cancer risk: A systematic review and meta-analysis of cohort studies. Am. J. Clin. Nutr. 2015, 101, 87–117. [Google Scholar] [CrossRef] [PubMed]
- Cartwright, R.; Brincker, H.; Carli, P.M.; Clayden, D.; Coebergh, J.W.; Jack, A.; McNally, R.; Morgan, G.; de Sanjose, S.; Tumino, R.; et al. The rise in incidence of lymphomas in Europe 1985–1992. Eur. J. Cancer 1999, 35, 627–633. [Google Scholar] [CrossRef]
- Devesa, S.S.; Fears, T. Non-Hodgkin’s lymphoma time trends: United States and international data. Cancer Res. 1992, 52, 5432s–5440s. [Google Scholar] [PubMed]
- Levi, F.; Lucchini, F.; Negri, E.; La Vecchia, C. Trends in mortality from non-Hodgkin’s lymphomas. Leuk. Res. 2002, 26, 903–908. [Google Scholar] [CrossRef]
- Siegel, R.L.; Miller, K.D.; Jemal, A. Cancer statistics, 2015. CA Cancer J. Clin. 2015, 65, 5–29. [Google Scholar] [CrossRef] [PubMed]
- Chen, G.C.; Lv, D.B.; Pang, Z.; Liu, Q.F. Fruits and vegetables consumption and risk of non-Hodgkin’s lymphoma: A meta-analysis of observational studies. Int. J. Cancer 2013, 133, 190–200. [Google Scholar] [CrossRef] [PubMed]
- Fallahzadeh, H.; Cheraghi, M.; Amoori, N.; Alaf, M. Red meat intake and risk of non-Hodgkin lymphoma: A meta-analysis. Asian Pac. J. Cancer Prev. 2014, 15, 10421–10425. [Google Scholar] [CrossRef] [PubMed]
- Ali, A.; Al-Belushi, B.S.; Waly, M.I.; Al-Moundhri, M.; Burney, I.A. Dietary and lifestyle factors and risk of non-Hodgkin’s lymphoma in Oman. Asian Pac. J. Cancer Prev. 2013, 14, 841–848. [Google Scholar] [CrossRef] [PubMed]
- Balasubramaniam, G.; Saoba, S.; Sarade, M.; Pinjare, S. Case-control study of risk factors for non-Hodgkin lymphoma in Mumbai, India. Asian Pac. J. Cancer Prev. 2013, 14, 775–780. [Google Scholar] [CrossRef] [PubMed]
- Chang, E.T.; Smedby, K.E.; Zhang, S.M.; Hjalgrim, H.; Melbye, M.; Ost, A.; Glimelius, B.; Wolk, A.; Adami, H.O. Dietary factors and risk of non-Hodgkin lymphoma in men and women. Cancer Epidemiol. Biomark. Prev. 2005, 14, 512–520. [Google Scholar] [CrossRef] [PubMed]
- Charbonneau, B.; O’Connor, H.M.; Wang, A.H.; Liebow, M.; Thompson, C.A.; Fredericksen, Z.S.; Macon, W.R.; Slager, S.L.; Call, T.G.; Habermann, T.M.; et al. Trans fatty acid intake is associated with increased risk and n3 fatty acid intake with reduced risk of non-Hodgkin lymphoma. J. Nutr. 2013, 143, 672–681. [Google Scholar] [CrossRef] [PubMed]
- Chiu, B.C.; Cerhan, J.R.; Folsom, A.R.; Sellers, T.A.; Kushi, L.H.; Wallace, R.B.; Zheng, W.; Potter, J.D. Diet and risk of non-Hodgkin lymphoma in older women. JAMA 1996, 275, 1315–1321. [Google Scholar] [CrossRef] [PubMed]
- De Stefani, E.; Fierro, L.; Barrios, E.; Ronco, A. Tobacco, alcohol, diet and risk of non-Hodgkin’s lymphoma: A case-control study in Uruguay. Leuk. Res. 1998, 22, 445–452. [Google Scholar] [CrossRef]
- De Stefani, E.; Ronco, A.L.; Deneo-Pellegrini, H.; Boffetta, P.; Correa, P.; Barrios, E.; Acosta, G.; Mendilaharsu, M. Meat, milk and risk of lymphoid malignancies: A case-control study in Uruguay. Nutr. Cancer 2013, 65, 375–383. [Google Scholar] [CrossRef] [PubMed]
- Mozaheb, Z.; Aledavood, A.; Farzad, F. Diet and non-Hodgkin’s lymphoma risk. Pan. Afr. Med. J. 2012, 12, 53. [Google Scholar] [PubMed]
- Ollberding, N.J.; Aschebrook-Kilfoy, B.; Caces, D.B.; Wright, M.E.; Weisenburger, D.D.; Smith, S.M.; Chiu, B.C. Phytanic acid and the risk of non-Hodgkin lymphoma. Carcinogenesis 2013, 34, 170–175. [Google Scholar] [CrossRef] [PubMed]
- Park, Y.; Leitzmann, M.F.; Subar, A.F.; Hollenbeck, A.; Schatzkin, A. Dairy food, calcium, and risk of cancer in the NIH-AARP Diet and Health Study. Arch. Intern. Med. 2009, 169, 391–401. [Google Scholar] [CrossRef] [PubMed]
- Purdue, M.P.; Bassani, D.G.; Klar, N.S.; Sloan, M.; Kreiger, N.; Canadian Cancer Registries Epidemiology Research, G. Dietary factors and risk of non-Hodgkin lymphoma by histologic subtype: A case-control analysis. Cancer Epidemiol. Biomark. Prev. 2004, 13, 1665–1676. [Google Scholar]
- Rohrmann, S.; Linseisen, J.; Jakobsen, M.U.; Overvad, K.; Raaschou-Nielsen, O.; Tjonneland, A.; Boutron-Ruault, M.C.; Kaaks, R.; Becker, N.; Bergmann, M.; et al. Consumption of meat and dairy and lymphoma risk in the European Prospective Investigation into Cancer and Nutrition. Int. J. Cancer 2011, 128, 623–634. [Google Scholar] [CrossRef] [PubMed]
- Talamini, R.; Polesel, J.; Montella, M.; Dal Maso, L.; Crovatto, M.; Crispo, A.; Spina, M.; Canzonieri, V.; La Vecchia, C.; Franceschi, S. Food groups and risk of non-Hodgkin lymphoma: A multicenter, case-control study in Italy. Int. J. Cancer 2006, 118, 2871–2876. [Google Scholar] [CrossRef] [PubMed]
- Tavani, A.; Pregnolato, A.; Negri, E.; Franceschi, S.; Serraino, D.; Carbone, A.; La Vecchia, C. Diet and risk of lymphoid neoplasms and soft tissue sarcomas. Nutr. Cancer 1997, 27, 256–260. [Google Scholar] [CrossRef] [PubMed]
- Ward, M.H.; Zahm, S.H.; Weisenburger, D.D.; Gridley, G.; Cantor, K.P.; Saal, R.C.; Blair, A. Dietary factors and non-Hodgkin’s lymphoma in Nebraska (United States). Cancer Causes Control 1994, 5, 422–432. [Google Scholar] [CrossRef] [PubMed]
- Zheng, T.; Holford, T.R.; Leaderer, B.; Zhang, Y.; Zahm, S.H.; Flynn, S.; Tallini, G.; Zhang, B.; Zhou, K.; Owens, P.H.; et al. Diet and nutrient intakes and risk of non-Hodgkin’s lymphoma in Connecticut women. Am. J. Epidemiol. 2004, 159, 454–466. [Google Scholar] [CrossRef] [PubMed]
- US Department of Agriculture, Agricultural Research Service. USDA National Nutrient Database for Standard Reference, Release 28. Available online: http://ndb.nal.usda.gov/ndb/search. (accessed on 10 November 2015).
- DerSimonian, R.; Laird, N. Meta-analysis in clinical trials. Control Clin. Trials 1986, 7, 177–188. [Google Scholar] [CrossRef]
- Higgins, J.P.; Thompson, S.G.; Deeks, J.J.; Altman, D.G. Measuring inconsistency in meta-analyses. BMJ 2003, 327, 557–560. [Google Scholar] [CrossRef] [PubMed]
- Higgins, J.P.; Thompson, S.G. Controlling the risk of spurious findings from meta-regression. Stat. Med. 2004, 23, 1663–1682. [Google Scholar] [CrossRef] [PubMed]
- Tobias, A. Assessing the influence of a single study in the meta-analysis estimate. Stata Tech. Bull. 1999, 47, 15–17. [Google Scholar]
- Egger, M.; Davey Smith, G.; Schneider, M.; Minder, C. Bias in meta-analysis detected by a simple, graphical test. BMJ 1997, 315, 629–634. [Google Scholar] [CrossRef] [PubMed]
- Orsini, N.; Li, R.; Wolk, A.; Khudyakov, P.; Spiegelman, D. Meta-analysis for linear and nonlinear dose-response relations: Examples, an evaluation of approximations, and software. Am. J. Epidemiol. 2012, 175, 66–73. [Google Scholar] [CrossRef] [PubMed]
- Harrell, F.E., Jr.; Lee, K.L.; Pollock, B.G. Regression models in clinical studies: Determining relationships between predictors and response. J. Natl. Cancer Inst. 1988, 80, 1198–1202. [Google Scholar] [CrossRef] [PubMed]
- Orsini, N.; Bellocco, R. Generalized least squares for trend estimation of summarized dose-response data. Stata J. 2006, 6, 40–57. [Google Scholar]
- Jackson, D.; White, I.R.; Thompson, S.G. Extending DerSimonian and Laird’s methodology to perform multivariate random effects meta-analyses. Stat. Med. 2010, 29, 1282–1297. [Google Scholar] [CrossRef] [PubMed]
- Cunningham, A.S. Lymphomas and animal-protein consumption. Lancet 1976, 2, 1184–1186. [Google Scholar] [CrossRef]
- Davis, S. Nutritional factors and the development of non-Hodgkin’s lymphoma: A review of the evidence. Cancer Res. 1992, 52, 5492s–5495s. [Google Scholar] [PubMed]
- Kinlen, L.J.; Sheil, A.G.; Peto, J.; Doll, R. Collaborative United Kingdom-Australasian study of cancer in patients treated with immunosuppressive drugs. Br. Med. J. 1979, 2, 1461–1466. [Google Scholar] [CrossRef] [PubMed]
- Ross, M.H.; Bras, G. Tumor incidence patterns and nutrition in the rat. J. Nutr. 1965, 87, 245–260. [Google Scholar] [PubMed]
- Engel, L.S.; Laden, F.; Andersen, A.; Strickland, P.T.; Blair, A.; Needham, L.L.; Barr, D.B.; Wolff, M.S.; Helzlsouer, K.; Hunter, D.J.; et al. Polychlorinated biphenyl levels in peripheral blood and non-Hodgkin’s lymphoma: A report from three cohorts. Cancer Res. 2007, 67, 5545–5552. [Google Scholar] [CrossRef] [PubMed]
- Spinelli, J.J.; Ng, C.H.; Weber, J.P.; Connors, J.M.; Gascoyne, R.D.; Lai, A.S.; Brooks-Wilson, A.R.; Le, N.D.; Berry, B.R.; Gallagher, R.P. Organochlorines and risk of non-Hodgkin lymphoma. Int. J. Cancer 2007, 121, 2767–2775. [Google Scholar] [CrossRef] [PubMed]
- Baars, A.J.; Bakker, M.I.; Baumann, R.A.; Boon, P.E.; Freijer, J.I.; Hoogenboom, L.A.; Hoogerbrugge, R.; van Klaveren, J.D.; Liem, A.K.; Traag, W.A.; et al. Dioxins, dioxin-like PCBs and non-dioxin-like PCBs in foodstuffs: Occurrence and dietary intake in the netherlands. Toxicol. Lett. 2004, 151, 51–61. [Google Scholar] [CrossRef] [PubMed]
- Bocio, A.; Domingo, J.L. Daily intake of polychlorinated dibenzo-p-dioxins/polychlorinated dibenzofurans (PCDD/PCDFs) in foodstuffs consumed in Tarragona, Spain: A review of recent studies (2001–2003) on human PCDD/PCDF exposure through the diet. Environ. Res. 2005, 97, 1–9. [Google Scholar] [CrossRef] [PubMed]
- Fattore, E.; Fanelli, R.; Turrini, A.; di Domenico, A. Current dietary exposure to polychlorodibenzo-p-dioxins, polychlorodibenzofurans, and dioxin-like polychlorobiphenyls in Italy. Mol. Nutr. Food Res. 2006, 50, 915–921. [Google Scholar] [CrossRef] [PubMed]
- Giovannucci, E. Dietary influences of 1,25(OH)2 vitamin D in relation to prostate cancer: A hypothesis. Cancer Causes Control 1998, 9, 567–582. [Google Scholar] [CrossRef] [PubMed]
- Giovannucci, E.; Liu, Y.; Stampfer, M.J.; Willett, W.C. A prospective study of calcium intake and incident and fatal prostate cancer. Cancer Epidemiol. Biomark. Prev. 2006, 15, 203–210. [Google Scholar] [CrossRef] [PubMed]
- Hickish, T.; Cunningham, D.; Colston, K.; Millar, B.C.; Sandle, J.; Mackay, A.G.; Soukop, M.; Sloane, J. The effect of 1,25-dihydroxyvitamin D3 on lymphoma cell lines and expression of vitamin D receptor in lymphoma. Br. J. Cancer 1993, 68, 668–672. [Google Scholar] [CrossRef] [PubMed]
- Lu, D.; Chen, J.; Jin, J. Vitamin D status and risk of non-Hodgkin lymphoma: A meta-analysis. Cancer Causes Control 2014, 25, 1553–1563. [Google Scholar] [CrossRef] [PubMed]
- Kim, J.E.; Kim, J.Y.; Lee, K.W.; Lee, H.J. Cancer chemopreventive effects of lactic acid bacteria. J. Microbiol. Biotechnol. 2007, 17, 1227–1235. [Google Scholar] [PubMed]
- Perdigon, G.; de Moreno de LeBlanc, A.; Valdez, J.; Rachid, M. Role of yoghurt in the prevention of colon cancer. Eur. J. Clin. Nutr. 2002, 56 (Suppl. 3), S65–S68. [Google Scholar] [CrossRef] [PubMed]
- Munafo, M.R.; Flint, J. Meta-analysis of genetic association studies. Trends Genet. 2004, 20, 439–444. [Google Scholar] [CrossRef] [PubMed]
- Ursin, G.; Bjelke, E.; Heuch, I.; Vollset, S.E. Milk consumption and cancer incidence: A Norwegian prospective study. Br. J. Cancer 1990, 61, 454–459. [Google Scholar] [CrossRef] [PubMed]
- Zhang, S.; Hunter, D.J.; Rosner, B.A.; Colditz, G.A.; Fuchs, C.S.; Speizer, F.E.; Willett, W.C. Dietary fat and protein in relation to risk of non-Hodgkin’s lymphoma among women. J. Natl. Cancer Inst. 1999, 91, 1751–1758. [Google Scholar] [CrossRef] [PubMed]


| Author | Country (Year) | Age | Dietary Assessment | Participants (Cases) | Gender | Exposure | Outcome | RR (95% CI) | Adjustment for Covarianes |
|---|---|---|---|---|---|---|---|---|---|
| Balasubram-aniam, G. [14] | India (2013) | Cases 46.1 Controls 46.4 (mean) | FFQ | 1726 (348) | M | Milk | NHL | 6.00 (4.10, 8.80) | Cigarette smoking, bidi smoking, tobacco lime chewing, the consumption of coffee, chicken, red-meat, eggs, fish, chilly and vegetable, and exposure to pesticides and cotton dust |
| Zheng, T. [28] | America (2004) | 21–84 | Validated FFQ | 1318 (601) | W | Total dairy | NHL | 1.80 (1.20, 2.80) | Age, BMI, family history of NHL in first-degree relatives, and total energy intake |
| 1305 (594) | Milk | NHL | 1.60 (1.00, 2.30) | ||||||
| 1205 (494) | Ice cream | NHL | 1.50 (1.10, 2.10) | ||||||
| Tavani, A. [26] | Italy (1997) | Cases 58 Controls 57 (median) | Validated FFQ | 1586 (429) | M&W | Milk | NHL | 2.00 (1.50, 2.66) | None |
| Cheese | NHL | 1.37 (1.03, 1.82) | |||||||
| Butter | NHL | 1.78 (1.21, 2.62) | |||||||
| Ali, A. [13] | Oman (2013) | NA | Validated FFQ | 86 (43) | M&W | Total dairy | NHL | 0.81 (0.29, 2.23) | Age and sex |
| Ward, M.H. [27] | America (1994) | ≥21 | FFQ | 714 (171) | M | Milk | NHL | 1.60 (0.70, 3.60) | Age |
| Cheese | NHL | 0.60 (0.40, 1.00) | |||||||
| 676 (144) | W | Milk | NHL | 1.20 (0.50, 3.10) | |||||
| Cheese | NHL | 0.70 (0.40, 1.30) | |||||||
| Chang, E.T. [15] | Sweden (2005) | Cases 62 Controls 59 (median) | Validated FFQ | 1064 (597) | M&W | Total dairy | NHL | 1.50 (1.10, 2.20) | Age and sex |
| 595 (128) | DLBCL | 2.00 (1.20, 3.50) | |||||||
| 572 (105) | FL | 1.20 (0.60, 2.20) | |||||||
| 614 (147) | SLL/CLL | 1.50 (0.90, 2.60) | |||||||
| 1064 (597) | Milk | NHL | 1.60 (1.10, 2.50) | ||||||
| 1064 (597) | Cheese | NHL | 1.40 (1.00, 2.00) | ||||||
| Purdue, M.P. [23] | Canada (2004) | 20–74 | Validated FFQ | 5616 (1631) | M&W | Milk | NHL | 1.12 (0.95, 1.31) | Age, sex, income adequacy, alcohol consumption, and total energy |
| 5554 (1616) | Cheese | NHL | 1.38 (1.06, 1.53) | ||||||
| Talamini, R. [25] | Italy (2006) | Cases 58 Controls 63 (median) | Validated FFQ | 674 (190) | M&W | Milk Cheese | NHL NHL | 0.91 (0.54, 1.54) 1.66 (0.98, 2.83) | Age, sex, center, education, place of birth, hepatitis C virus test, and total energy intake |
| De Stefani, E. [19] | Uruguay (2013) | NA | Validated FFQ | 3975 (369) | M&W | Milk | NHL | 2.98 (2.23, 3.98) | Age, sex, residence, urban/rural status, education, BMI, smoking intensity, total meat, alcohol drinking, mate consumption, total meat, and total energy |
| Ollberding, N.J. [21] | America (2013) | Cases 58.6 Controls 58 (mean) | Validated FFQ | 793 (333) | M&W | Total dairy | NHL | 1.50 (1.10, 2.20) | Age, sex, educational attainment and total energy |
| 548 (88) | DLBCL | 1.40 (0.80, 2.60) | |||||||
| 564 (104) | FL | 1.50 (0.90, 2.60) | |||||||
| 485 (25) | SLL/CLL | 3.00 (0.90, 9.50) | |||||||
| 793 (333) | Milk | NHL | 1.60 (1.10, 2.30) | ||||||
| 548 (88) | DLBCL | 1.80 (1.00, 3.10) | |||||||
| 564 (104) | FL | 1.90 (1.10, 3.20) | |||||||
| 485 (25) | SLL/CLL | 2.30 (0.90, 6.00) | |||||||
| 793 (333) | Cheese | NHL | 0.90 (0.70, 1.30) | ||||||
| 548 (88) | DLBCL | 0.90 (0.50, 1.60) | |||||||
| 564 (104) | FL | 1.00 (0.60, 1.70) | |||||||
| 485 (25) | SLL/CLL | 1.50 (0.50, 4.20) | |||||||
| 793 (333) | Ice cream | NHL | 1.40 (1.00, 2.00) | ||||||
| 793 (333) | Yogurt | NHL | 0.80 (0.50, 1.20) | ||||||
| 548 (88) | DLBCL | 0.60 (0.30, 1.20) | |||||||
| 564 (104) | FL | 0.60 (0.40, 1.20) | |||||||
| 485 (25) | SLL/CLL | 1.60 (0.50, 5.60) | |||||||
| 793 (333) | Butter | NHL | 1.00 (0.70, 1.40) | ||||||
| De Stefani, E. [18] | Uruguay (1998) | 20–84 | FFQ | 171 (85) | M | Milk | NHL | 1.03 (0.47, 2.28) | Age, residence, urban/rural status, type of tobacco, beer intake and “mate“/years Age, residence, urban/rural status, year of diagnosis and parity |
| 152 (75) | W | NHL | 0.90 (0.33, 2.41) | ||||||
| Charbonneau, B. [16] | America (2013) | Cases 60.9 Controls 60.1 (mean) | Validated FFQ | 1609 (602) | M&W | Total dairy | NHL | 1.12 (0.79, 1.60) | Age, sex, residence, and total energy |
| 1112 (105) | DLBCL | 1.83 (0.89, 3.75) | |||||||
| 1153 (146) | FL | 0.98 (0.55, 1.76) | |||||||
| 1225 (218) | SLL/CLL | 0.88 (0.52, 1.47) | |||||||
| 1609 (602) | Milk | NHL | 1.14 (0.84, 1.55) | ||||||
| 1112 (105) | DLBCL | 1.85 (1.01, 3.40) | |||||||
| 1153 (146) | FL | 0.99 (0.58, 1.70) | |||||||
| 1225 (218) | SLL/CLL | 0.84 (0.54, 1.32) | |||||||
| 1609 (602) | Cheese | NHL | 1.12 (0.81, 1.57) | ||||||
| 1112 (105) | DLBCL | 1.06 (0.52, 2.12) | |||||||
| 1153 (146) | FL | 0.94 (0.53, 1.69) | |||||||
| 1225 (218) | SLL/CLL | 1.18 (0.73, 1.91) | |||||||
| 1609 (602) | Ice cream | NHL | 2.45 (1.80, 3.34) | ||||||
| 1609 (602) | Yogurt | NHL | 1.01(0.77, 1.33) | ||||||
| 1112 (105) | DLBCL | 0.88 (0.49, 1.57) | |||||||
| 1153 (146) | FL | 1.12 (0.70, 1.81) | |||||||
| 1225 (218) | SLL/CLL | 0.99 (0.68, 1.45) | |||||||
| 1609 (602) | Butter | NHL | 1.29 (0.99, 1.69) | ||||||
| Mozaheb, Z. [20] | Iran (2012) | Cases 51 Controls 47 (mean) | Validated FFQ | 360 (170) | M&W | Milk | NHL | 0.72 (0.44, 1.20) | None |
| Cheese | NHL | 1.38 (0.79, 2.40) | |||||||
| Ice cream | NHL | 1.05 (0.65, 1.71) | |||||||
| Yogurt | NHL | 0.32 (0.18, 0.55) | |||||||
| Butter | NHL | 1.34 (0.76, 2.37) |
| Author | Country (Year) | Age | Dietary Assessment | Participants (Cases) | Gender | Exposure | Outcome | RR (95% CI) | Adjustment for Covarianes |
|---|---|---|---|---|---|---|---|---|---|
| Rohrmann, S. [24] | 10 European countries (2011) | M 52.7 W 50.8 (median) | Validated FFQ | 410,411 (1267) | M&W | Milk | NHL | 0.99 (0.83, 1.17) | Energy, alcohol, education, fruits, vegetables and smoking |
| 410,411 (159) | DLBCL | 1.14 (0.72, 1.82) | |||||||
| 410,411 (140) | FL | 0.51 (0.29, 0.90) | |||||||
| 410,411 (234) | SLL/CLL | 0.96 (0.66, 1.42) | |||||||
| 410,411 (1267) | Cheese | NHL | 1.09 (0.86, 1.40) | ||||||
| 410,411 (159) | DLBCL | 0.85 (0.40, 1.83) | |||||||
| 410,411 (140) | FL | 1.28 (0.65, 2.50) | |||||||
| 410,411 (234) | SLL/CLL | 1.38 (0.79, 2.42) | |||||||
| 410,411 (1267) | Yogurt | NHL | 1.02 (0.88, 1.17) | ||||||
| 410,411 (159) | DLBCL | 1.04 (0.70, 1.56) | |||||||
| 410,411 (140) | FL | 0.97 (0.63, 1.48) | |||||||
| 410,411 (234) | SLL/CLL | 0.92 (0.67, 1.28) | |||||||
| Chiu, B.C. [17] | America (1996) | 55–69 | Validated FFQ | 35,156 (104) | W | Total dairy | NHL | 1.04 (0.61, 1.77) | Age and total energy intake |
| Milk | NHL | 0.70 (0.42, 1.17) | |||||||
| Park, Y. [22] | America (2009) | 50–71 | Validated FFQ | 293,907 (1267) | M | Total dairy | NHL | 1.02 (0.85, 1.22) | Race/ethnicity, education, marital status, BMI, family history of cancer, vigorous physical activity, alcohol consumption, intakes of red meat and total energy, and smoking |
| 198,903 (660) | W | NHL | 1.00 (0.77, 1.30) |
| Exposure | Outcome | Subgroup | No. of Studies | No. of Cases | Pooled RR (95% CI) | I2 (%) | p heterogeneity |
|---|---|---|---|---|---|---|---|
| Total dairy product | |||||||
| Total dairy product | NHL | All studies | 8 | 4207 | 1.20 (1.02, 1.42) | 42.7 | 0.094 |
| Study design | |||||||
| Case-control | 5 | 2176 | 1.41 (1.17, 1.70) | 6.8 | 0.368 | ||
| Cohort | 3 | 2031 | 1.02 (0.88, 1.17) | 0.0 | 0.988 | ||
| Continent | |||||||
| North America | 6 | 3567 | 1.17 (0.98, 1.40) | 46.6 | 0.095 | ||
| Europe | 1 | 597 | 1.50 (1.06, 2.12) | NA | NA | ||
| Asia | 1 | 43 | 0.81 (0.29, 2.25) | NA | NA | ||
| DLBCL | All studies | 3 | 321 | 1.73 (1.22, 2.45) | 0.0 | 0.670 | |
| FL | All studies | 3 | 355 | 1.23 (0.88, 1.72) | 0.0 | 0.569 | |
| SLL/CLL | All studies | 3 | 390 | 1.35 (0.77, 2.39) | 53.8 | 0.115 | |
| Specific type of dairy product | |||||||
| Milk | NHL | All studies | 16 | 7109 | 1.41 (1.08, 1.84) | 88.6 | 0.000 |
| Study design | |||||||
| Case-control | 14 | 5738 | 1.53 (1.13, 2.06) | 87.7 | 0.000 | ||
| Cohort | 2 | 1371 | 0.91 (0.68, 1.22) | 36.8 | 0.209 | ||
| Continent | |||||||
| North America | 7 | 3579 | 1.21 (1.01, 1.46) | 37.8 | 0.140 | ||
| Latin America | 3 | 529 | 1.53 (0.63, 3.70) | 80.5 | 0.006 | ||
| Europe | 4 | 2483 | 1.32 (0.87, 1.98) | 85.0 | 0.000 | ||
| Asia | 2 | 518 | 2.09 (0.26, 16.71) | 97.7 | 0.000 | ||
| Dietary assessment | |||||||
| Validated FFQ | 11 | 6286 | 1.30 (1.02, 1.66) | 85.6 | 0.000 | ||
| FFQ | 5 | 823 | 1.68 (0.67, 4.20) | 87.3 | 0.000 | ||
| DLBCL | All studies | 3 | 352 | 1.49 (1.08, 2.06) | 8.9 | 0.333 | |
| FL | All studies | 3 | 390 | 0.99 (0.47, 2.07) | 81.8 | 0.004 | |
| SLL/CLL | All studies | 3 | 477 | 1.04 (0.69, 1.55) | 44.1 | 0.167 | |
| Cheese | NHL | All studies | 10 | 5519 | 1.14 (0.96, 1.34) | 58.2 | 0.011 |
| Study design | |||||||
| Case-control | 9 | 4252 | 1.14 (0.94, 1.38) | 61.9 | 0.007 | ||
| Cohort | 1 | 1267 | 1.09 (0.85, 1.39) | NA | NA | ||
| Continent | |||||||
| North America | 5 | 2866 | 0.95 (0.70, 1.29) | 75.7 | 0.002 | ||
| Europe | 4 | 2483 | 1.28 (1.09, 1.49) | 2.2 | 0.382 | ||
| Asia | 1 | 170 | 1.38 (0.79, 2.41) | NA | NA | ||
| Dietary assessment | |||||||
| Validated FFQ | 8 | 5204 | 1.24 (1.09, 1.40) | 23.1 | 0.245 | ||
| FFQ | 2 | 315 | 0.64 (0.44, 0.91) | 0.0 | 0.686 | ||
| DLBCL | All studies | 3 | 352 | 0.93 (0.63, 1.37) | 0.0 | 0.905 | |
| FL | All studies | 3 | 390 | 1.04 (0.74, 1.46) | 0.0 | 0.777 | |
| SLL/CLL | All studies | 3 | 477 | 1.28 (0.91, 1.81) | 0.0 | 0.876 | |
| Butter | NHL | All studies | 4 | 1534 | 1.31 (1.04, 1.65) | 36.9 | 0.190 |
| Yogurt | NHL | All studies | 4 | 2372 | 0.78 (0.54, 1.12) | 81.6 | 0.001 |
| DLBCL | All studies | 3 | 352 | 0.90 (0.67, 1.21) | 0.0 | 0.402 | |
| FL | All studies | 3 | 390 | 0.89 (0.63, 1.25) | 33.9 | 0.220 | |
| SLL/CLL | All studies | 3 | 477 | 0.97 (0.76, 1.23) | 0.0 | 0.679 | |
| Ice cream | NHL | All studies | 4 | 1598 | 1.57 (1.11, 2.20) | 72.3 | 0.013 |
© 2016 by the authors; licensee MDPI, Basel, Switzerland. This article is an open access article distributed under the terms and conditions of the Creative Commons by Attribution (CC-BY) license (http://creativecommons.org/licenses/by/4.0/).
Share and Cite
Wang, J.; Li, X.; Zhang, D. Dairy Product Consumption and Risk of Non-Hodgkin Lymphoma: A Meta-Analysis. Nutrients 2016, 8, 120. https://doi.org/10.3390/nu8030120
Wang J, Li X, Zhang D. Dairy Product Consumption and Risk of Non-Hodgkin Lymphoma: A Meta-Analysis. Nutrients. 2016; 8(3):120. https://doi.org/10.3390/nu8030120
Chicago/Turabian StyleWang, Jia, Xutong Li, and Dongfeng Zhang. 2016. "Dairy Product Consumption and Risk of Non-Hodgkin Lymphoma: A Meta-Analysis" Nutrients 8, no. 3: 120. https://doi.org/10.3390/nu8030120
APA StyleWang, J., Li, X., & Zhang, D. (2016). Dairy Product Consumption and Risk of Non-Hodgkin Lymphoma: A Meta-Analysis. Nutrients, 8(3), 120. https://doi.org/10.3390/nu8030120