Trends in Consumption of Solid Fats, Added Sugars, Sodium, Sugar-Sweetened Beverages, and Fruit from Fast Food Restaurants and by Fast Food Restaurant Type among US Children, 2003–2010

Abstract
:1. Introduction
2. Methods
2.1. Dietary Intake Data
2.2. Types of Fast Food Restaurants
2.3. Analytical Approach
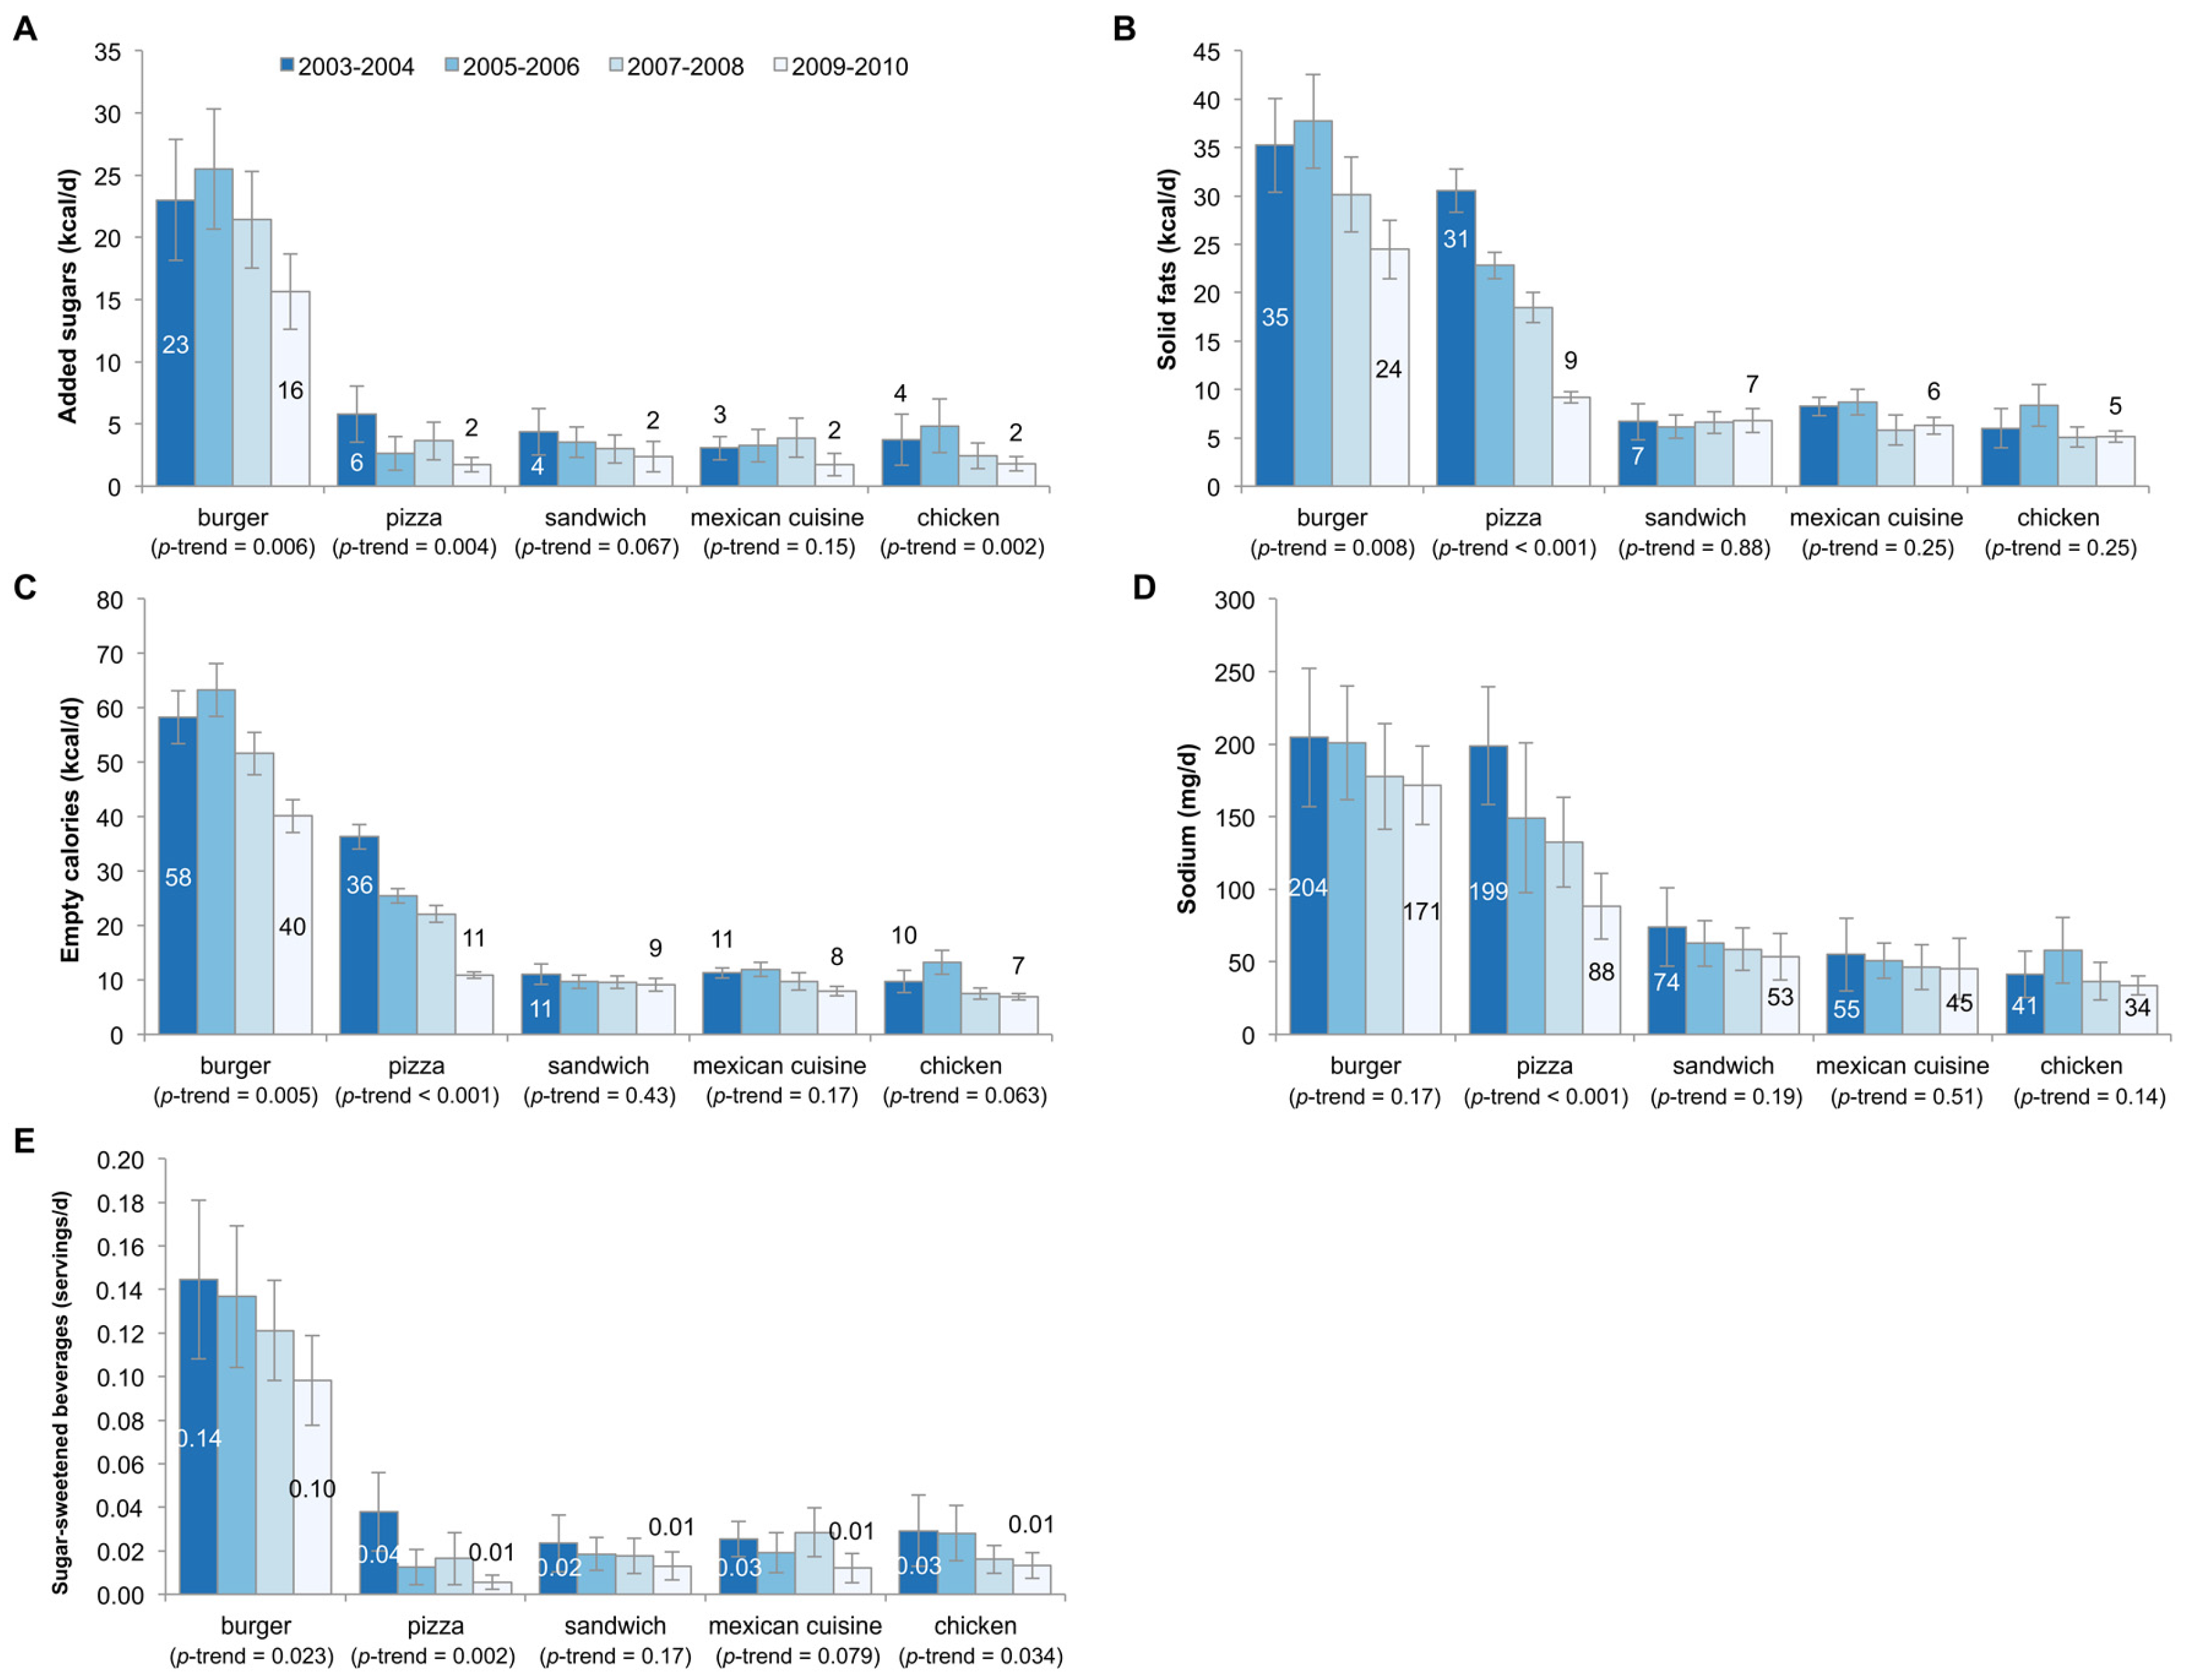
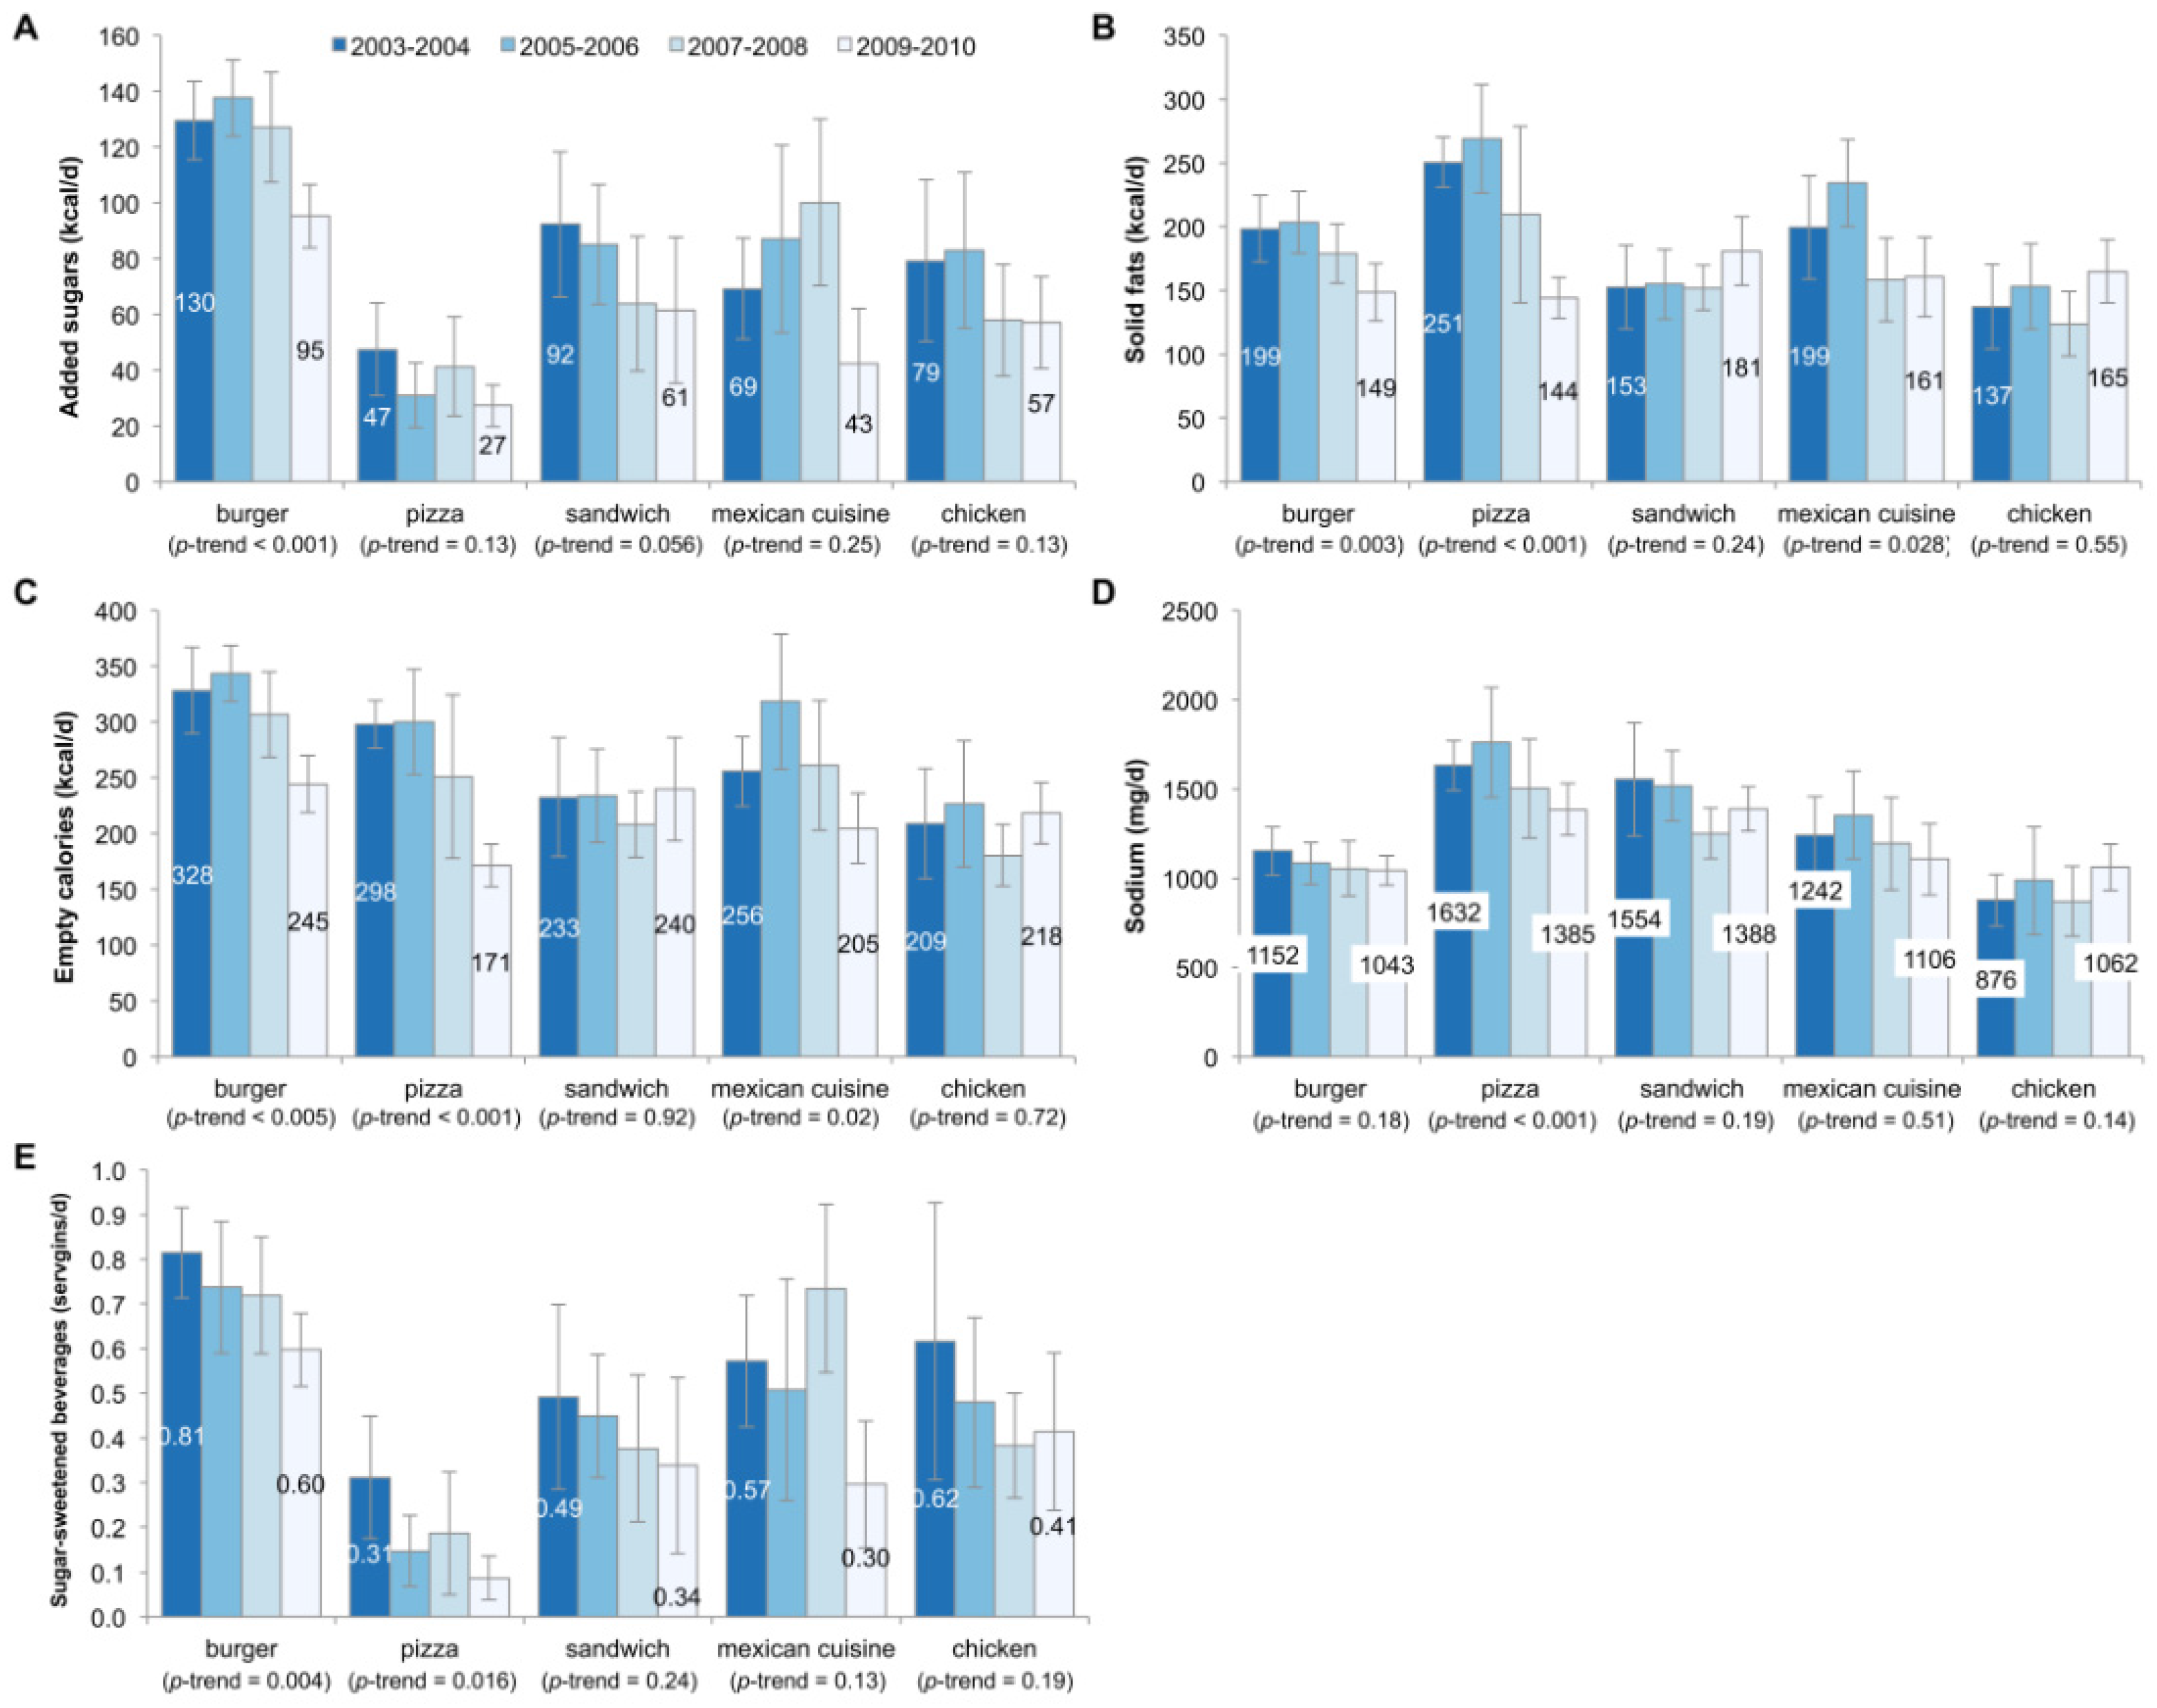
3. Results
Time Trends 2003–2010 by Food Location of Origin
4. Discussion
5. Conclusions
Acknowledgments
Author Contributions
Conflicts of Interest
Abbreviations
| FFR | Fast food restaurant |
| FSR | Full-service restaurant |
| MPED | MyPyramid Equivalents Database |
| NHANES | National Health and Nutrition Examination Survey |
References
- Rehm, C.D.; Drewnowski, A. Trends in energy intakes by type of fast food restaurant among US children from 2003 to 2010. JAMA Pediatr. 2015, 169, 502–504. [Google Scholar] [CrossRef] [PubMed]
- Poti, J.M.; Slining, M.M.; Popkin, B.M. Solid fat and added sugar intake among U.S. Children: The role of stores, schools, and fast food, 1994–2010. Am. J. Prev. Med. 2013, 45, 551–559. [Google Scholar] [CrossRef] [PubMed]
- Rehm, C.D.; Drewnowski, A. A new method to monitor the contribution of fast food restaurants to the diets of US children. PLoS ONE 2014, 9, e103543. [Google Scholar] [CrossRef] [PubMed]
- U.S. Department of Health and Human Services; U.S. Department of Agriculture. 2015–2020 Dietary Guidelines for Americans, 8th ed.U.S. Department of Health and Human Services; U.S. Department of Agriculture: Washington, DC, USA, 2015. Available online: http://health.gov/dietaryguidelines/2015/guidelines/ (accessed on 2 September 2016).
- Centers for Disease Control and Prevention (CDC). Trends in the prevalence of excess dietary sodium intake—United States, 2003–2010. MMWR Morb. Mortal. Wkly. Rep. 2013, 62, 1021–1025. [Google Scholar]
- Powell, L.M.; Nguyen, B.T. Fast-food and full-service restaurant consumption among children and adolescents: Effect on energy, beverage, and nutrient intake. JAMA Pediatr. 2013, 167, 14–20. [Google Scholar] [CrossRef] [PubMed]
- Bowman, S.A.; Gortmaker, S.L.; Ebbeling, C.B.; Pereira, M.A.; Ludwig, D.S. Effects of fast-food consumption on energy intake and diet quality among children in a national household survey. Pediatrics 2004, 113, 112–118. [Google Scholar] [CrossRef] [PubMed]
- Sebastian, R.S.; Wilkinson Enns, C.; Goldman, J.D. US adolescents and MyPyramid: Associations between fast-food consumption and lower likelihood of meeting recommendations. J. Am. Diet. Assoc. 2009, 109, 226–235. [Google Scholar] [CrossRef] [PubMed]
- Centers for Disease Control and Prevention. National Health and Nutrition Examination Survey (NHANES): Questionnaires, Datasets, and Related Documentation. Available online: https://wwwn.cdc.gov/nchs/nhanes/search/nhanes09_10.aspx (accessed on 3 September 2016).
- National Health and Nutrition Examination Survey. NCHS Research Ethics Review Board (ERB) Approval. Available online: http://www.cdc.gov/nchs/nhanes/irba98.htm (accessed on 2 September 2016).
- National Health and Nutrition Examination Survey. Dietary Interview: Individual Foods—First Day (dr1iff_f) Codebook. Available online: http://www.cdc.gov/nchs/nhanes/nhanes2009–2010/DR1IFF_F.htm (accessed on 2 September 2016).
- Bowman, S.A.; Friday, J.E.; Moshfegh, A. MyPyramid Equivalents Database, 2.0 for USDA Survey Foods, 2003–2004 (online). Food Surveys Research Group. Beltsville Human Nutrition Research Center, Agricultrural Research Service, U.S. Department of Agriculture: Beltsville, MD, USA. Available online: http://www.ars.usda.gov/ba/bhnrc/fsrg (accessed on 2 September 2016).
- Ervin, R.B.; Ogden, C.L. Consumption of Added Sugars among U.S. Adults, 2005–2010. NCHS Data Brief. 2013, 122, 1–8. [Google Scholar]
- Oches, S. Top 50 Breakdown by Market Segments. QSR Magazine Online. Available online: http://www.qsrmagazine.com/reports/top-50-breakdown-market-segments (accessed on 2 September 2016).
- Krebs-Smith, S.M.; Kott, P.S.; Guenther, P.M. Mean proportion and population proportion: Two answers to the same question? J. Am. Diet. Assoc. 1989, 89, 671–676. [Google Scholar] [PubMed]
- Reedy, J.; Krebs-Smith, S.M. Dietary sources of energy, solid fats, and added sugars among children and adolescents in the United States. J. Am. Diet. Assoc. 2010, 110, 1477–1484. [Google Scholar] [CrossRef] [PubMed]
- Drewnowski, A.; Rehm, C.D. Sodium intakes of US children and adults from foods and beverages by location of origin and by specific food source. Nutrients 2013, 5, 1840–1855. [Google Scholar] [CrossRef] [PubMed]
- Drewnowski, A.; Rehm, C.D. Energy intakes of US children and adults by food purchase location and by specific food source. Nutr. J. 2013, 12, 1–10. [Google Scholar] [CrossRef] [PubMed]
- Smith, D.P. The fall of Pizza. QSR Magazine. 3 March 2011. Available online: http://www.qsrmagazine.com/competition/fall-pizza (accessed on 2 September 2016).
- Eating Patterns in America. Available online: https://www.npd.com/latest-reports/eating-patterns-america-consumer-consumption-behavior/ (accessed on 2 September 2016).
- Wu, H.W.; Sturm, R. Changes in the energy and sodium content of main entrees in US chain restaurants from 2010 to 2011. J. Acad. Nutr. Diet. 2014, 114, 209–219. [Google Scholar] [CrossRef] [PubMed]
- Wu, H.W.; Sturm, R. What’s on the menu? A review of the energy and nutritional content of US chain restaurant menus. Public Health Nutr. 2013, 16, 87–96. [Google Scholar] [CrossRef] [PubMed]
- Bauer, K.W.; Hearst, M.O.; Earnest, A.A.; French, S.A.; Oakes, J.M.; Harnack, L.J. Energy content of U.S. Fast-food restaurant offerings: 14-year trends. Am. J. Prev. Med. 2012, 43, 490–497. [Google Scholar] [CrossRef] [PubMed]
- Kirkpatrick, S.I.; Reedy, J.; Kahle, L.L.; Harris, J.L.; Ohri-Vachaspati, P.; Krebs-Smith, S.M. Fast-food menu offerings vary in dietary quality, but are consistently poor. Public Health Nutr. 2014, 17, 924–931. [Google Scholar] [CrossRef] [PubMed]
- Bruemmer, B.; Krieger, J.; Saelens, B.E.; Chan, N. Energy, saturated fat, and sodium were lower in entrees at chain restaurants at 18 months compared with 6 months following the implementation of mandatory menu labeling regulation in king county, Washington. J. Acad. Nutr. Diet. 2012, 112, 1169–1176. [Google Scholar] [CrossRef] [PubMed]
- Hearst, M.O.; Harnack, L.J.; Bauer, K.W.; Earnest, A.A.; French, S.A.; Michael Oakes, J. Nutritional quality at eight U.S. Fast-food chains: 14-year trends. Am. J. Prev. Med. 2013, 44, 589–594. [Google Scholar] [CrossRef] [PubMed]
- Namba, A.; Auchincloss, A.; Leonberg, B.L.; Wootan, M.G. Exploratory analysis of fast-food chain restaurant menus before and after implementation of local calorie-labeling policies, 2005–2011. Prev. Chronic Dis. 2013, 10, E101. [Google Scholar] [CrossRef] [PubMed]
- Bollinger, B.; Leslie, P.; Sorensen, A. Calorie posting in chain restaurants. Am. Econ. J. Econ. Policy 2011, 3, 91–128. [Google Scholar] [CrossRef]
- Finkelstein, E.A.; Strombotne, K.L.; Chan, N.L.; Krieger, J. Mandatory menu labeling in one fast-food chain in king county, Washington. Am. J. Prev. Med. 2011, 40, 122–127. [Google Scholar] [CrossRef] [PubMed]
- Pulos, E.; Leng, K. Evaluation of a voluntary menu-labeling program in full-service restaurants. Am. J. Public Health 2010, 100, 1035–1039. [Google Scholar] [CrossRef] [PubMed]
- Schaeffer, J. Fast-food menu makeovers—Salads, fruit snacks, and smaller meal portions to tell clients about. Today’s Dietitian, July 2013; 18. [Google Scholar]
- Madhani, A. McDonald’s Nears Sale of 2 Billion Servings of Fruit, Yogurt. USA Today. 19 January 2016. Available online: http://www.usatoday.com/story/money/2016/01/19/mcdonalds-nears-sale-2-billion-servings-fruit-yogurt/79018448/ (accessed on 2 September 2016).
- Drewnowski, A.; Rehm, C.D. Consumption of added sugars among US children and adults by food purchase location and food source. Am. J. Clin. Nutr. 2014, 100, 901–907. [Google Scholar] [CrossRef] [PubMed]
- Rasmussen, L.B.; Matthiessen, J.; Biltoft-Jensen, A.; Tetens, I. Characteristics of misreporters of dietary intake and physical activity. Public Health Nutr. 2007, 10, 230–237. [Google Scholar] [CrossRef] [PubMed]

| 2003–2004 (n = 3400) | 2005–2006 (n = 3532) | 2007–2008 (n = 2643) | 2009–2010 (n = 2803) | ||||||
|---|---|---|---|---|---|---|---|---|---|
| Mean (SE) | % of Total | Mean (SE) | % of Total | Mean (SE) | % of Total | Mean (SE) | % of Total | p-Trend a | |
| Energy (kcal/day) | |||||||||
| Total | 2195 (20) | - | 2119 (35) | - | 1999 (23) | - | 1990 (25) | - | <0.001 |
| Store | 1423 (34) | 64.8 | 1348 (24) | 63.6 | 1274 (24) | 63.7 | 1337 (23) | 67.2 | 0.011 |
| Fast food restaurants | 341 (21) | 15.6 | 324 (19) | 15.3 | 276 (15) | 13.8 | 232 (12) | 11.7 | <0.001 |
| Full-service restaurants | 132 (12) | 6.0 | 128 (20) | 6.1 | 113 (14) | 5.6 | 92 (11) | 4.6 | 0.014 |
| School | 151 (22) | 6.9 | 131 (11) | 6.1 | 161 (19) | 8.1 | 155 (22) | 7.8 | 0.64 |
| Other | 148 (7) | 6.7 | 188 (9) | 8.9 | 176 (14) | 8.8 | 172 (11) | 8.7 | 0.16 |
| Solid fats (kcal/day) | |||||||||
| Total | 440 (6) | - | 444 (9) | - | 401 (8) | - | 391 (7) | - | <0.001 |
| Store | 261 (8) | 59.4 | 259 (6) | 58.4 | 241 (6) | 60.0 | 246 (6) | 62.8 | 0.051 |
| Fast food restaurants | 89 (5) | 20.2 | 87 (4) | 19.6 | 68 (5) | 16.7 | 57 (3) | 14.4 | <0.001 |
| Full-service restaurants | 30 (3) | 6.8 | 29 (5) | 6.6 | 24 (3) | 6.1 | 22 (3) | 5.4 | 0.044 |
| School | 35 (5) | 7.9 | 31 (3) | 6.9 | 36 (5) | 9.0 | 34 (5) | 8.7 | 0.92 |
| Other | 25 (2) | 5.8 | 38 (2) | 8.6 | 32 (4) | 8.0 | 34 (4) | 8.7 | 0.12 |
| Added sugars (kcal/day) | |||||||||
| Total | 389 (9) | - | 360 (12) | - | 325 (7) | - | 309 (8) | - | <0.001 |
| Store | 273 (9) | 70.3 | 245 (9) | 68.0 | 217 (6) | 66.8 | 217 (6) | 70.2 | <0.001 |
| Fast food restaurants | 41 (3) | 10.6 | 42 (4) | 11.5 | 36 (2) | 11.0 | 25 (3) | 8.2 | <0.001 |
| Full-service restaurants | 18 (2) | 4.7 | 17 (3) | 4.7 | 14 (1) | 4.2 | 14 (2) | 4.4 | 0.031 |
| School | 18 (3) | 4.5 | 15 (2) | 4.2 | 18 (2) | 5.6 | 17 (2) | 5.4 | 0.98 |
| Other | 39 (3) | 9.9 | 41 (3) | 11.5 | 41 (4) | 12.5 | 36 (3) | 11.8 | 0.62 |
| Sodium (mg/day) | |||||||||
| Total | 3313 (40) | - | 3284 (59) | - | 3160 (73) | - | 3210 (66) | - | 0.09 |
| Store | 2029 (61) | 61.2 | 1981 (46) | 60.3 | 1913 (49) | 60.5 | 2098 (47) | 65.4 | 0.56 |
| Fast food restaurants | 594 (37) | 17.9 | 557 (36) | 17.0 | 482 (29) | 15.3 | 428 (24) | 13.3 | <0.001 |
| Full-service restaurant | 261 (29) | 7.9 | 248 (35) | 7.6 | 231 (38) | 7.3 | 164 (20) | 5.1 | 0.011 |
| School | 243 (34) | 7.3 | 216 (19) | 6.6 | 270 (34) | 8.5 | 260 (41) | 8.1 | 0.53 |
| Other | 185 (11) | 5.6 | 282 (15) | 8.6 | 264 (26) | 8.4 | 260 (19) | 8.1 | 0.005 |
| Sugar-sweetened beverages (servings/day) b | |||||||||
| Total | 1.63 (0.07) | - | 1.45 (0.09) | - | 1.24 (0.06) | - | 1.16 (0.06) | - | <0.001 |
| Store | 1.12 (0.06) | 68.7 | 1.01 (0.07) | 69.8 | 0.81 (0.04) | 65.5 | 0.85 (0.06) | 73.1 | <0.001 |
| Fast food restaurants | 0.24 (0.02) | 14.7 | 0.19 (0.02) | 13.2 | 0.19 (0.01) | 14.9 | 0.12 (0.01) | 10.1 | <0.001 |
| Full-service restaurant | 0.10 (0.01) | 6.0 | 0.09 (0.02) | 6.1 | 0.07 (0.01) | 5.5 | 0.07 (0.01) | 6.1 | 0.03 |
| School | 0.04 (0.01) | 2.2 | 0.02 (0.008) | 1.6 | 0.03 (0.01) | 2.2 | 0.01 (0.004) | 0.9 | 0.037 |
| Other | 0.14 (0.01) | 8.4 | 0.13 (0.02) | 9.2 | 0.15 (0.02) | 11.7 | 0.11 (0.01) | 9.8 | 0.27 |
| Whole fruit (cup equivalents/day) c | |||||||||
| Total | 0.44 (0.04) | - | 0.5 (0.02) | - | 0.64 (0.06) | - | 0.65 (0.04) | - | <0.001 |
| Store | 0.35 (0.03) | 79.1 | 0.4 (0.02) | 78.9 | 0.5 (0.06) | 78.5 | 0.49 (0.02) | 75.8 | <0.001 |
| Fast food restaurants | 0.005 (0.002) | 1.1 | 0.01 (0.002) | 1.7 | 0.01 (0.003) | 1.6 | 0.01 (0.001) | 1.0 | 0.36 |
| Full-service restaurant | 0.01 (0.002) | 1.4 | 0.01 (0.003) | 1.7 | 0.01 (0.003) | 1.1 | 0.01 (0.002) | 1.3 | 0.62 |
| School | 0.04 (0.008) | 9.4 | 0.04 (0.007) | 8.2 | 0.06 (0.008) | 9.1 | 0.08 (0.01) | 11.7 | 0.003 |
| Other | 0.04 (0.008) | 8.9 | 0.05 (0.005) | 9.5 | 0.06 (0.014) | 9.7 | 0.07 (0.018) | 10.2 | 0.12 |
| Fruit juice (cup equivalents /day) d | |||||||||
| Total | 0.57 (0.04) | - | 0.48 (0.02) | - | 0.44 (0.03) | - | 0.45 (0.03) | - | 0.008 |
| Store | 0.47 (0.04) | 83.4 | 0.39 (0.02) | 80.8 | 0.34 (0.02) | 75.9 | 0.35 (0.03) | 78.9 | 0.003 |
| Fast food restaurants | 0.01 (0.002) | 1.8 | 0.01 (0.001) | 2.3 | 0.02 (0.004) | 4.0 | 0.01 (0.002) | 3.0 | 0.077 |
| Full-service restaurant | 0.01 (0.002) | 1.5 | 0.01 (0.003) | 2.1 | 0.01 (0.003) | 2.1 | 0.01 (0.002) | 1.7 | 0.70 |
| School | 0.04 (0.01) | 7.4 | 0.04 (0.01) | 7.5 | 0.04 (0.01) | 9.8 | 0.04 (0.01) | 8.9 | 0.99 |
| Other | 0.03 (0.01) | 5.9 | 0.04 (0.005) | 7.3 | 0.04 (0.01) | 8.3 | 0.03 (0.003) | 7.6 | 0.92 |
| 2003–2004 (n = 3400) | 2005–2006 (n = 3532) | 2007–2008 (n = 2643) | 2009–2010 (n = 2803) | ||||||
|---|---|---|---|---|---|---|---|---|---|
| Mean (SE) | % of Total | Mean (SE) | % of Total | Mean (SE) | % of Total | Mean (SE) | % of Total | p-Trend a | |
| Energy (kcal/day) | |||||||||
| 4–11 years | 281 (33) | 13.7 | 196 (14) | 10.3 | 201 (22) | 10.9 | 170 (13) | 9.4 | 0.004 |
| 12–19 years | 400 (22) | 17.1 | 445 (34) | 19.1 | 346 (16) | 16.1 | 293 (19) | 13.5 | <0.001 |
| Solid fats (kcal/day) | |||||||||
| 4–11 years | 73 (8) | 17.4 | 61 (4) | 15.0 | 53 (5) | 13.8 | 43 (4) | 11.6 | <0.001 |
| 12–19 years | 109 (5) | 23.9 | 123 (5) | 25.1 | 95 (5) | 22.7 | 79 (5) | 18.7 | <0.001 |
| Added sugars (kcal/day) | |||||||||
| 4–11 years | 35 (4) | 9.9 | 30 (4) | 9.4 | 29 (1) | 9.4 | 22 (2) | 8.0 | 0.009 |
| 12–19 years | 50 (3) | 11.8 | 56 (3) | 13.7 | 52 (5) | 14.1 | 34 (3) | 9.2 | 0.001 |
| Empty calories (kcal/day) | |||||||||
| 4–11 years | 106 (11) | 13.6 | 79 (6) | 11.2 | 79 (9) | 11.7 | 61 (5) | 9.6 | <0.001 |
| 12–19 years | 153 (8) | 17.4 | 175 (12) | 19.5 | 127 (7) | 16.5 | 102 (7) | 13.3 | <0.001 |
| Sodium (mg/day) | |||||||||
| 4–11 years | 421 (44) | 15.6 | 365 (27) | 13.5 | 324 (27) | 12.3 | 309 (24) | 11.6 | 0.018 |
| 12–19 years | 719 (35) | 20.9 | 775 (38) | 22.1 | 706 (39) | 21.0 | 586 (37) | 17.0 | 0.006 |
| Sugar-sweetened beverages (servings/day) b | |||||||||
| 4–11 years | 0.21 (0.03) | 17.4 | 0.11 (0.01) | 13.1 | 0.14 (0.02) | 15.7 | 0.1 (0.01) | 13.7 | 0.004 |
| 12–19 years | 0.33 (0.03) | 16.0 | 0.33 (0.04) | 16.1 | 0.27 (0.02) | 17.2 | 0.2 (0.03) | 12.6 | 0.001 |
| Whole fruit (cup equivalents/day) c | |||||||||
| 4–11 years | 0.003 (0.001) | 0.6 | 0.01 (0.003) | 1.3 | 0.02 (0.006) | 2.2 | 0.01 (0.002) | 0.7 | 0.18 |
| 12–19 years | 0.01 (0.004) | 1.7 | 0.01 (0.003) | 2.1 | 0.01 (0.002) | 1.0 | 0.01 (0.002) | 1.4 | 0.99 |
| Fruit juice (cup equivalents/day) d | |||||||||
| 4–11 years | 0.01 (0.002) | 1.1 | 0.01 (0.002) | 1.8 | 0.02 (0.004) | 3.6 | 0.01 (0.003) | 2.2 | 0.08 |
| 12–19 years | 0.01 (0.003) | 2.5 | 0.01 (0.002) | 2.7 | 0.02 (0.006) | 4.4 | 0.02 (0.004) | 3.9 | 0.44 |
| 2003–2004 (n = 1385) | 2005–2006 (n = 1475) | 2007–2008 (n = 988) | 2009–2010 (n = 979) | ||||||
|---|---|---|---|---|---|---|---|---|---|
| Mean (SE) | % of Total | Mean (SE) | % of Total | Mean (SE) | % of Total | Mean (SE) | % of Total | p-Trend a | |
| Energy (kcal/day) | 881 (22) | 37.7 | 858 (21) | 36.7 | 812 (37) | 37.3 | 714 (17) | 33.1 | <0.001 |
| Solid fats (kcal/day) | 229 (6) | 47.0 | 230 (7) | 45.1 | 201 (12) | 44.1 | 174 (6) | 39.2 | <0.001 |
| Added sugars (kcal/day) | 106 (6) | 25.0 | 110 (6) | 26.4 | 106 (6) | 27.8 | 77 (5) | 21.3 | <0.001 |
| Empty calories (kcal/day) | 335 (10) | 36.7 | 340 (9) | 37.0 | 306 (17) | 36.7 | 251 (6) | 31.1 | <0.001 |
| Sodium (mg/day) | 1534 (48) | 44.4 | 1476 (46) | 41.8 | 1422 (81) | 42.9 | 1315 (35) | 38.2 | <0.001 |
| Sugar-sweetened beverages (servings/day a) | 0.62 (0.03) | 31.4 | 0.51 (0.04) | 27.0 | 0.55 (0.04) | 34.5 | 0.36 (0.03) | 24.0 | <0.001 |
© 2016 by the authors; licensee MDPI, Basel, Switzerland. This article is an open access article distributed under the terms and conditions of the Creative Commons Attribution (CC-BY) license (http://creativecommons.org/licenses/by/4.0/).
Share and Cite
Rehm, C.D.; Drewnowski, A. Trends in Consumption of Solid Fats, Added Sugars, Sodium, Sugar-Sweetened Beverages, and Fruit from Fast Food Restaurants and by Fast Food Restaurant Type among US Children, 2003–2010. Nutrients 2016, 8, 804. https://doi.org/10.3390/nu8120804
Rehm CD, Drewnowski A. Trends in Consumption of Solid Fats, Added Sugars, Sodium, Sugar-Sweetened Beverages, and Fruit from Fast Food Restaurants and by Fast Food Restaurant Type among US Children, 2003–2010. Nutrients. 2016; 8(12):804. https://doi.org/10.3390/nu8120804
Chicago/Turabian StyleRehm, Colin D., and Adam Drewnowski. 2016. "Trends in Consumption of Solid Fats, Added Sugars, Sodium, Sugar-Sweetened Beverages, and Fruit from Fast Food Restaurants and by Fast Food Restaurant Type among US Children, 2003–2010" Nutrients 8, no. 12: 804. https://doi.org/10.3390/nu8120804
APA StyleRehm, C. D., & Drewnowski, A. (2016). Trends in Consumption of Solid Fats, Added Sugars, Sodium, Sugar-Sweetened Beverages, and Fruit from Fast Food Restaurants and by Fast Food Restaurant Type among US Children, 2003–2010. Nutrients, 8(12), 804. https://doi.org/10.3390/nu8120804