The Effect of Serum 25-Hydroxyvitamin D Concentrations on Elevated Serum C-Reactive Protein Concentrations in Normal Weight, Overweight and Obese Participants of a Preventive Health Program

 and
and
Abstract
:1. Introduction
2. Methods
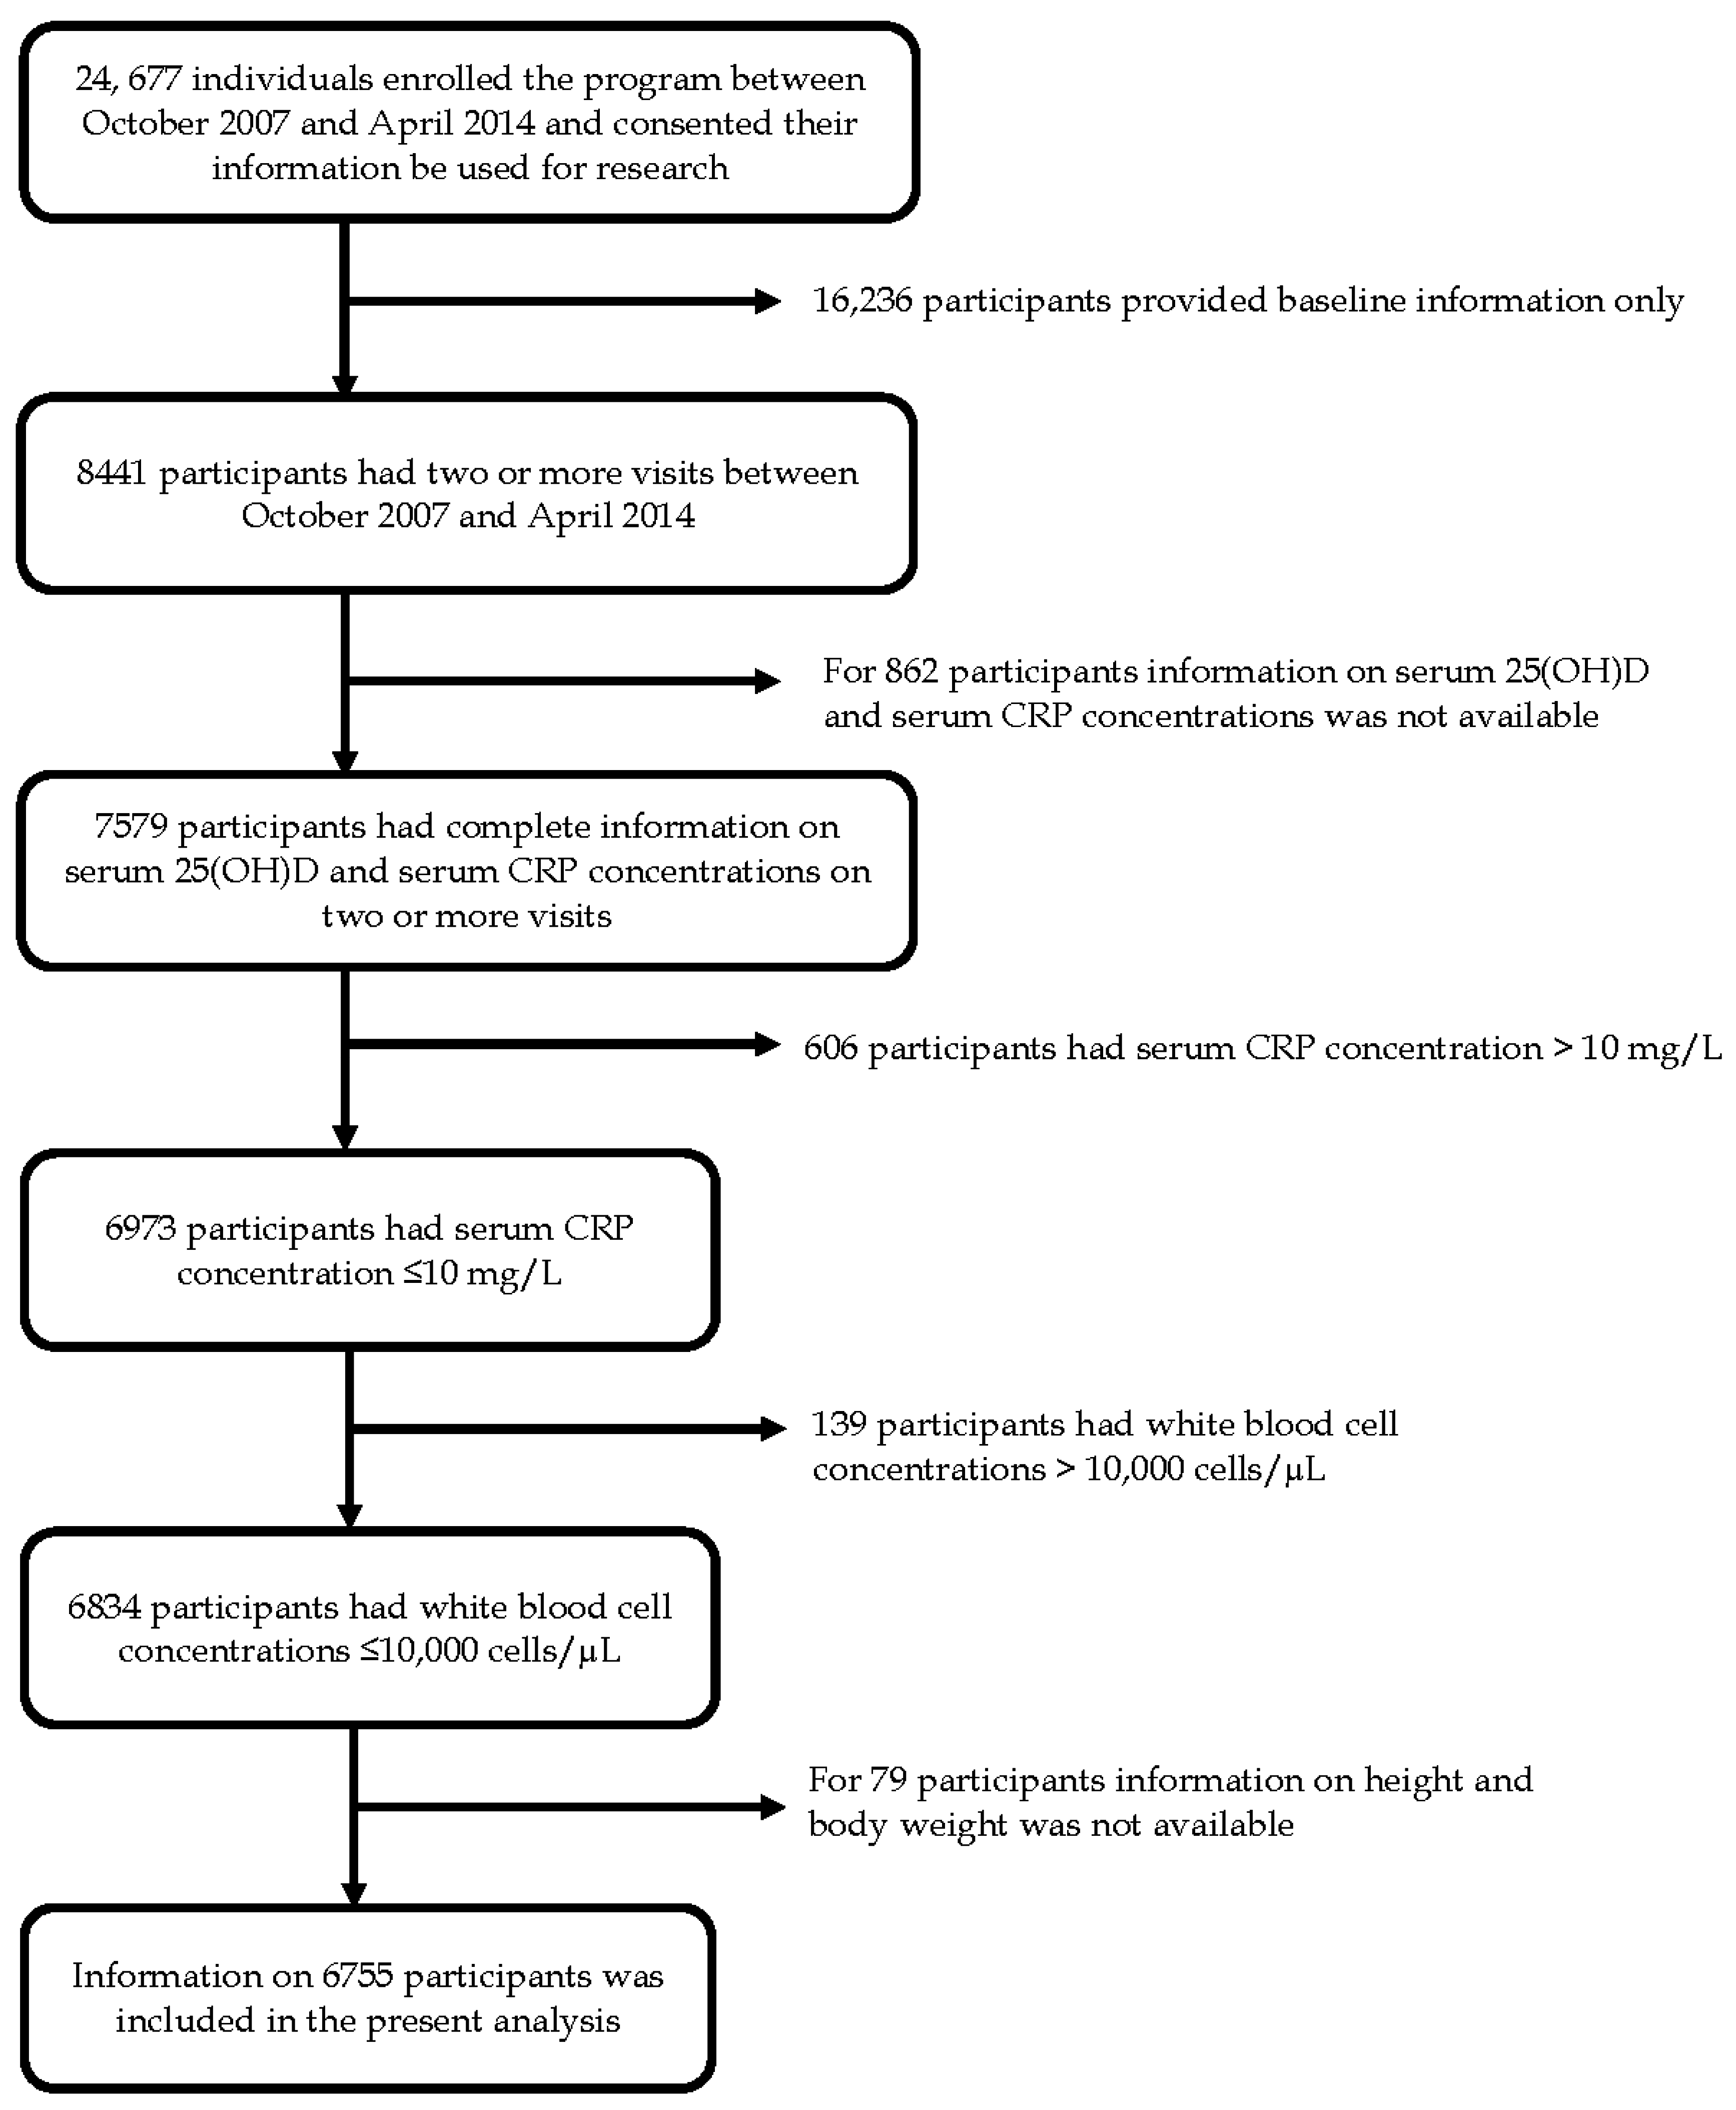
2.1. Study Design and Participants
2.2. Serum CRP Concentrations
2.3. Serum 25(OH)D Concentrations
2.4. Body Weight Status
2.5. Potential Confounding Variables
2.6. Statistical Analyses
3. Results
4. Discussion
5. Conclusions
Supplementary Materials
Acknowledgments
Author Contributions
Conflicts of Interest
References
- Yousuf, O.; Mohanty, B.D.; Martin, S.S.; Joshi, P.H.; Blaha, M.J.; Nasir, K.; Blumenthal, R.S.; Budoff, M.J. High-sensitivity C-reactive protein and cardiovascular disease: A resolute belief or an elusive link. J. Am. Coll. Cardiol. 2013, 62, 397–408. [Google Scholar] [CrossRef] [PubMed]
- Salazar, J.; Martínez, M.S.; Chávez, M.; Toledo, A.; Añez, R.; Torres, Y.; Apruzzese, V.; Silva, C.; Rojas, J.; Bermúdez, V. C-reactive protein: Clinical and epidemiological perspectives. Cardiol. Res. Pract. 2014, 2014, 1–10. [Google Scholar] [CrossRef] [PubMed]
- Pepys, M.B.; Hirschfield, G.M. C-reactive protein: A critical update. J. Clin. Investig. 2003, 111, 1805–1812. [Google Scholar] [CrossRef] [PubMed]
- Dubinsky, M.C. Serologic and laboratory markers in prediction of the disease course in inflammatory bowel disease. World J. Gastroenterol. 2010, 16, 2604–2608. [Google Scholar] [CrossRef] [PubMed]
- Hamer, M.; Bell, J.A.; Sabia, S.; Batty, G.D.; Kivimäki, M. Stability of metabolically healthy obesity over 8 years: The English Longitudinal Study of Ageing. Eur. J. Endocrinol. 2015, 173, 703–708. [Google Scholar] [CrossRef] [PubMed]
- Bastien, M.; Poirier, P.; Lemieux, I.; Després, J.P. Overview of epidemiology and contribution of obesity to cardiovascular disease. Prog. Cardiovasc. Dis. 2014, 56, 369–381. [Google Scholar] [CrossRef] [PubMed]
- McGown, C.; Birerdinc, A.; Younossi, Z.M. Adipose tissue as an endocrine organ. Clin. Liver Dis. 2014, 18, 41–58. [Google Scholar] [CrossRef] [PubMed]
- McPherson, R.; Frohlich, J.; Fodor, G.; Genest, J. Canadian Cardiovascular Society position statement-recommendations for the diagnosis and treatment of dyslipidemia and prevention of cardiovascular disease. Can. J. Cardiol. 2006, 22, 913–927. [Google Scholar] [CrossRef]
- Ridker, P.M. High-Sensitivity C-Reactive Protein: Potential Adjunct for Global Risk Assessment in the Primary Prevention of Cardiovascular Disease. Circulation 2001, 103, 1813–1818. [Google Scholar] [CrossRef] [PubMed]
- Holick, M.F. Vitamin D deficiency. N. Engl. J. Med. 2007, 357, 266–281. [Google Scholar] [CrossRef] [PubMed]
- Verstuyf, A.; Carmeliet, G.; Bouillon, R.; Mathieu, C. Vitamin D: A pleiotropic hormone. Kidney Int. 2010, 78, 140–145. [Google Scholar] [CrossRef] [PubMed]
- Lindqvist, P.G.; Epstein, E.; Nielsen, K.; Landin-Olsson, M.; Ingvar, C.; Olsson, H. Avoidance of sun exposure as a risk factor for major causes of death: A competing risk analysis of the Melanoma in Southern Sweden cohort. J. Intern. Med. 2016, 280, 375–387. [Google Scholar] [CrossRef] [PubMed]
- Bellia, A.; Garcovich, C.; D’Adamo, M.; Lombardo, M.; Tesauro, M.; Donadel, G.; Gentileschi, P.; Lauro, D.; Federici, M.; Lauro, R.; et al. Serum 25-hydroxyvitamin D levels are inversely associated with systemic inflammation in severe obese subjects. Intern. Emerg. Med. 2013, 8, 33–40. [Google Scholar] [CrossRef] [PubMed]
- Amer, M.; Qayyum, R. Relation between serum 25-hydroxyvitamin D and C-reactive protein in asymptomatic adults (from the continuous National Health and Nutrition Examination Survey 2001 to 2006). Am. J. Cardiol. 2012, 109, 226–230. [Google Scholar] [CrossRef] [PubMed]
- Murr, C.; Pilz, S.; Grammer, T.B.; Kleber, M.E.; Meinitzer, A.; Boehm, B.O.; Marz, W.; Fuchs, D. Vitamin D deficiency parallels inflammation and immune activation, the Ludwigshafen Risk and Cardiovascular Health (LURIC) study. Clin. Chem. Lab. Med. 2012, 50, 2205–2212. [Google Scholar] [CrossRef] [PubMed]
- Duggan, C.; de Dieu Tapsoba, J.; Mason, C.; Imayama, I.; Korde, L.; Wang, C.Y.; Tiernan, A. Effect of vitamin D3 supplementation in combination with weight loss on inflammatory biomarkers in postmenopausal women: A randomized controlled trial. Cancer Prev. Res. 2015, 8, 628–635. [Google Scholar] [CrossRef] [PubMed]
- Liefaard, M.C.; Ligthart, S.; Vitezova, A.; Hofman, A.; Uitterlinden, A.G.; Kiefte-de Jong, J.C.; Franco, O.H.; Zillikens, M.C.; Dehghan, A. Vitamin D and C-Reactive Protein: A Mendelian Randomization Study. PLoS ONE 2015, 10, e0131740. [Google Scholar] [CrossRef] [PubMed]
- Shah, S.; Wilson, D.M.; Bachrach, L.K. Large doses of vitamin D fail to increase 25 hydroxyvitamin D levels or to alter cardiovascular risk factors in obese adolescents: A pilot study. J. Adolesc. Health 2015, 57, 19–23. [Google Scholar] [CrossRef] [PubMed]
- Chandler, P.D.; Scott, J.B.; Drake, B.F.; Ng, K.; Manson, J.E.; Rifai, N.; Chan, A.T.; Bennett, G.G.; Hollis, B.W.; Giovannucci, E.L.; et al. Impact of vitamin D supplementation on inflammatory markers in African Americans: Results of a four-arm, randomized, placebo-controlled trial. Cancer Prev. Res. 2014, 7, 218–225. [Google Scholar] [CrossRef] [PubMed]
- Witham, M.D.; Dove, F.J.; Khan, F.; Lang, C.C.; Belch, J.J.; Struthers, A.D. Effects of Vitamin D supplementation on markers of vascular function after myocardial infarction—A randomised controlled trial. Int. J. Cardoil. 2013, 167, 745–749. [Google Scholar] [CrossRef] [PubMed]
- Jorde, R.; Sneve, M.; Torjesen, P.A.; Figenschau, Y.; Gøransson, L.G.; Omdal, R. No effect of supplementation with cholecalciferol on cytokines and markers of inflammation in overweight and obese subjects. Cytokine 2010, 50, 175–180. [Google Scholar] [CrossRef] [PubMed]
- Pittas, A.G.; Harris, S.S.; Stark, P.C.; Dawson-Hughes, B. The effects of calcium and vitamin D supplementation on blood glucose and markers of inflammation in nondiabetic adults. Diabetes Care 2007, 30, 980–986. [Google Scholar] [CrossRef] [PubMed]
- Jamka, M.; Woźniewicz, M.; Walkowiak, J.; Bogdański, P.; Jeszka, J.; Stelmach-Mardas, M. The effect of vitamin D supplementation on selected inflammatory biomarkers in obese and overweight subjects: A systematic review with meta-analysis. Eur. J. Nutr. 2015, 55, 2163–2175. [Google Scholar] [CrossRef] [PubMed]
- Chen, N.; Wan, Z.; Han, S.F.; Li, B.Y.; Zhang, Z.L.; Qin, L.Q. Effect of vitamin D supplementation on the level of circulating high-sensitivity C-reactive protein: A meta-analysis of randomized controlled trials. Nutrients 2014, 6, 2206–2216. [Google Scholar] [CrossRef] [PubMed]
- Pham, T.M.; Ekwaru, J.P.; Setayeshgar, S.; Veugelers, P.J. The Effect of Changing Serum 25-Hydroxyvitamin D Concentrations on Metabolic Syndrome: A Longitudinal Analysis of Participants of a Preventive Health Program. Nutrients 2015, 7, 7271–7284. [Google Scholar] [CrossRef] [PubMed]
- Veugelers, P.J.; Pham, T.M.; Ekwaru, J.P. Optimal Vitamin D Supplementation Doses that Minimize the Risk for Both Low and High Serum 25-Hydroxyvitamin D Concentrations in the General Population. Nutrients 2015, 7, 10189–10208. [Google Scholar] [CrossRef] [PubMed]
- Pearson, T.A. Markers of Inflammation and Cardiovascular Disease: Application to Clinical and Public Health Practice: A Statement for Healthcare Professionals from the Centers for Disease Control and Prevention and the American Heart Association. Circulation 2003, 107, 499–511. [Google Scholar] [CrossRef] [PubMed]
- Helal, I.; Zerelli, L.; Krid, M.; ElYounsi, F.; Maiz, H.B.; Zouari, B.; Adelmoula, J.; Kheder, A. Comparison of C-reactive protein and high-sensitivity C-reactive protein levels in patients on hemodialysis. Saudi J. Kidney Diseases Transplant. 2012, 23, 477. [Google Scholar]
- Lau, D.C.W.; Milan, G.; Pearson, G.J. New Canadian Guidelines for the Diagnosis and Management of Dyslipidemia—2009 Update. Available online: http://www.canadianhealthcarenetwork.ca/files/2010/02/Dyslipidemia_Guidelines_Feb2010.pdf (accessed on 20 August 2016).
- National Institute of Health. Clinical Guidelines on the Identification, Evaluatiuon, and Treatment of Overweight and Obesity in Adults. Available online: http://www.nhlbi.nih.gov/files/docs/guidelines/ob_gdlns.pdf (accessed on 12 July 1998).
- Akin, F.; Ayça, B.; Köse, N.; Duran, M.; Sari, M.; Uysal, O.K.; Karakukcu, C.; Arinc, H.; Covic, A.; Goldsmith, D.; et al. Serum vitamin D levels are independently associated with severity of coronary artery disease. J. Investig. Med. 2012, 60, 869–873. [Google Scholar] [CrossRef] [PubMed]
- Michos, E.D.; Streeten, E.A.; Ryan, K.A.; Rampersaud, E.; Peyser, P.A.; Bielak, L.F.; Shuldiner, A.R.; Mitchell, B.D.; Post, W. Serum 25-hydroxyvitamin d levels are not associated with subclinical vascular disease or C-reactive protein in the old order amish. Calcif. Tissue Int. 2009, 84, 195–202. [Google Scholar] [CrossRef] [PubMed]
- Ekwaru, J.P.; Zwicker, J.D.; Holick, M.F.; Giovannucci, E.; Veugelers, P.J. The importance of body weight for the dose response relationship of oral vitamin D supplementation and serum 25-hydroxyvitamin D in healthy volunteers. PLoS ONE 2014, 9, e111265. [Google Scholar] [CrossRef] [PubMed]
- Heaney, R.P. Guidelines for optimizing design and analysis of clinical studies of nutrient effects. Nutr. Rev. 2014, 72, 48–54. [Google Scholar] [CrossRef] [PubMed]
- Spedding, S.; Vanlint, S.; Morris, H.; Scragg, R. Does vitamin D sufficiency equate to a single serum 25-hydroxyvitamin D level or are different levels required for non-skeletal diseases. Nutrients 2013, 5, 5127–5139. [Google Scholar] [CrossRef] [PubMed]
- Zhang, Y.; Leung, D.Y.; Richers, B.N.; Liu, Y.; Remigio, L.K.; Riches, D.W.; Goleva, E. Vitamin D inhibits monocyte/macrophage proinflammatory cytokine production by targeting MAPK phosphatase-1. J. Immunol. 2012, 188, 2127–2135. [Google Scholar] [CrossRef] [PubMed]
- Dickie, L.J.; Church, L.D.; Coulthard, L.R.; Mathews, R.J.; Emery, P.; McDermott, M.F. Vitamin D3 down-regulates intracellular Toll-like receptor 9 expression and Toll-like receptor 9-induced IL-6 production in human monocytes. Rheumatology 2010, 49, 1466–1471. [Google Scholar] [CrossRef] [PubMed]
- Zittermann, A.; Schleithoff, S.S.; Koerfer, R. Putting cardiovascular disease and vitamin D insufficiency into perspective. Br. J. Nutr. 2005, 94, 483. [Google Scholar] [CrossRef] [PubMed]
- Mora, S.; Cook, N.; Buring, J.E.; Ridker, P.M.; Lee, I.M. Physical activity and reduced risk of cardiovascular events: Potential mediating mechanisms. Circulation 2007, 116, 2110–2118. [Google Scholar] [CrossRef] [PubMed]
- Myers, J. Exercise and Cardiovascular Health. Circulation 2003, 107, e2–e5. [Google Scholar] [CrossRef] [PubMed]
- Statistics Canada. Overweight and Obese Adults (Self-Reported), 2014. Available online: http://www.statcan.gc.ca/pub/82-625-x/2015001/article/14185-eng.htm (accessed on 18 August 2016).
- Statistics Canada. Vitamin D Levels of Canadians, 2012 to 2013. Available online: http://www.statcan.gc.ca/pub/82-625-x/2014001/article/14125-eng.htm (accessed on 18 August 2016).

| Characteristic | Baseline | Last Follow-up Visit |
|---|---|---|
| Serum 25(OH)D, nmol/L | ||
| Mean (SD) | 88.3 (42.2) | 121.0 (46.2) |
| Median (IQR) | 81.6 (60.5–108.0) | 115.0 (88.60–147.0) |
| Serum C-reactive protein, mg/L | ||
| Mean (SD) | 1.7 (1.8) | 1.6 (1.8) |
| Median (IQR) | 1.0 (0.5–2.2) | 0.9 (0.4–2.1) |
| Elevated C-reactive protein, % | ||
| Low-risk (<1 mg/L) | 47.0 | 51.2 |
| Average risk (1–2.99 mg/L) | 35.6 | 32.6 |
| High risk (≥3 mg/L) | 17.4 | 16.2 |
| Gender (%) | ||
| Female | 52.0 | 52.0 |
| Male | 48.0 | 48.0 |
| Age | ||
| Mean (SD) | 50.9 (15.2) | 52.4 (15.0) |
| Body weight status, % | ||
| Under weight | 1.0 | 1.0 |
| Normal weight | 34.2 | 34.3 |
| Over weight | 38.2 | 37.7 |
| Obesity | 26.6 | 27.0 |
| Blood pressure, % * | ||
| Normal (<140/90 mmHg) | 58.9 | 53.2 |
| Elevated (≥140/90 mmHg or anti-hypertensive medication use) | 36.2 | 33.6 |
| Missing | 4.9 | 13.2 |
| Serum LDL-cholesterol, % † | ||
| Normal (<2.6 mmol/L) | 34.3 | 30.0 |
| Elevated (≥2.6 mmol/L) | 61.7 | 67.3 |
| Missing | 4.0 | 2.7 |
| Smoking status, % | ||
| Never smoker | 41.5 | 30.2 |
| Ex-smoker | 21.6 | 15.6 |
| Current smoker | 8.7 | 6.6 |
| Missing | 28.2 | 47.6 |
| Alcohol consumption status, % | ||
| Non-drinker | 25.3 | 26.6 |
| Drinker | 42.1 | 41.6 |
| Missing | 32.6 | 31.8 |
| Physical activity level, % | ||
| Low | 28.3 | 28.3 |
| Moderate | 21.5 | 21.5 |
| High | 21.0 | 21.0 |
| Missing | 29.2 | 29.2 |
| Use of vitamin D-containing supplements, % | ||
| Yes | 47.4 | 74.2 |
| No | 35.7 | 9.6 |
| Missing | 16.9 | 16.2 |
| Vitamin D dose of the supplements, Median (IQR) IU/day | 3000 (2000–5000) | 6000 (4000–9000) |
| # Visits | Univariable model § | p | Multivariable model § | p | |
|---|---|---|---|---|---|
| OR (95% CI) | OR (95% CI) | ||||
| Serum 25(OHD) at baseline, nmol/L | |||||
| <50 | 1684 | ref | ref | ||
| 50–<75 | 2878 | 0.56 (0.41, 0.76) | <0.01 | 0.72 (0.56, 0.92) | 0.01 |
| 75–<100 | 2655 | 0.28 (0.20, 0.38) | <0.01 | 0.61 (0.47, 0.80) | <0.01 |
| 100–<125 | 1665 | 0.24 (0.17, 0.34) | <0.01 | 0.61 (0.45, 0.82) | <0.01 |
| ≥125 | 1501 | 0.18 (0.12, 0.26) | <0.01 | 0.58 (0.42, 0.80) | <0.01 |
| Change in serum 25(OH)D, nmol/L | |||||
| No improvement | 2032 | ref | ref | ||
| Increase of <25 | 2370 | 1.38 (1.09, 1.76) | 0.01 | 0.92 (0.74, 1.15) | 0.46 |
| Increase of 25–<50 | 2415 | 1.23 (0.97, 1.57) | 0.09 | 0.84 (0.77, 1.05) | 0.13 |
| Increase of 50–<75 | 1670 | 1.37 (1.05, 1.78) | 0.02 | 0.88 (0.68, 1.13) | 0.31 |
| Increase of ≥75 | 1896 | 1.28 (0.99, 1.67) | 0.06 | 0.88 (0.69, 1.13) | 0.32 |
| Serum CRP ≥1 mg/L at baseline | |||||
| No | 4965 | ref | ref | ||
| Yes | 5418 | 48.29 (37.23, 62.63) | <0.01 | 27.80 (21.95, 35.15) | <0.01 |
| Serum LDL-cholesterol at baseline * | |||||
| Normal | 3441 | ref | ref | ||
| Elevated | 6511 | 2.31 (1.87, 2.85) | <0.01 | 1.29 (1.09, 1.53) | <0.01 |
| Missing | 431 | 2.97 (1.79, 4.91) | <0.01 | 1.38 (0.92, 2.06) | 0.12 |
| Age at baseline (per 10 years) | 10,383 | 1.34 (1.25, 1.43) | <0.01 | 1.13 (1.06, 1.19) | <0.01 |
| Gender | |||||
| Female | 5188 | ref | ref | ||
| Male | 5195 | 1.05 (0.87, 1.28) | 0.58 | 0.75 (0.63, 0.89) | <0.01 |
| Body weight status at baseline | |||||
| Underweight/normal weight | 3526 | ref | ref | ||
| Overweight | 4028 | 4.88 (3.88, 6.14) | <0.01 | 2.17 (1.79, 2.63) | <0.01 |
| Obesity | 2829 | 39.03 (28.35, 53.71) | <0.01 | 5.30 (4.17, 6.74) | <0.01 |
| Blood pressure status at baseline † | |||||
| Normal | 5993 | ref | ref | ||
| Elevated | 3752 | 3.83 (3.09, 4.76) | <0.01 | 1.15 (0.97, 1.37) | 0.12 |
| Missing | 638 | 1.59 (1.03, 2.46) | 0.03 | 1.10 (0.78, 1.55) | 0.60 |
| Smoking status at baseline | |||||
| Never smoker | 3870 | ref | ref | ||
| Past smoker | 1996 | 1.59 (1.22, 2.05) | <0.01 | 1.04 (0.84, 1.29) | 0.70 |
| Current smoker | 743 | 1.87 (1.29, 2.70) | <0.01 | 1.70 (1.25, 1.31) | <0.01 |
| Missing | 3774 | 1.65 (1.31, 2.08) | <0.01 | 0.91 (0.62, 1.32) | 0.62 |
| Alcohol consumption status at baseline | |||||
| Non-drinker | 2273 | ref | ref | ||
| Drinker | 3966 | 0.66 (0.52, 0.84) | <0.01 | 0.99 (0.81, 1.21) | 0.91 |
| Missing | 4144 | 1.28 (1.00, 1.65) | 0.05 | 1.22 (0.96, 1.54) | 0.10 |
| Physical activity level at baseline | |||||
| Low | 2637 | ref | ref | ||
| Moderate | 1975 | 0.46 (0.35, 0.61) | <0.01 | 0.83 (0.66, 1.04) | 0.10 |
| High | 1927 | 0.26 (0.20, 0.35) | <0.01 | 0.75 (0.58, 0.95) | 0.02 |
| Missing | 3844 | 0.78 (0.61, 1.00) | 0.05 | 1.31 (0.87, 1.98) | 0.19 |
| Change in physical activity level | |||||
| Negative change | 1984 | ref | ref | ||
| No change | 394 | 0.71 (0.46, 1.09) | 0.12 | 0.60 (0.40, 0.89) | 0.01 |
| Positive change | 2464 | 0.75 (0.59, 0.96) | 0.02 | 0.67 (0.54, 0.83) | <0.01 |
| Missing | 5541 | 0.98 (0.79, 1.23) | 0.87 | 0.81 (0.64, 1.03) | 0.08 |
| Underweight/Normal Weight § # Follow up Visits = 3526 | Overweight and Not Obese § # Follow up Visits = 4028 | Obese § # Follow up Visits = 2829 | ||||
|---|---|---|---|---|---|---|
| OR (95% CI) | p | OR (95% CI) | p | OR (95% CI) | p | |
| Serum 25(OHD) at baseline, nmol/L | ||||||
| <50 | ref | ref | ref | |||
| 50–<75 | 0.71 (0.42, 1.19) | 0.19 | 0.82 (0.57, 1.20) | 0.31 | 0.59 (0.38, 0.92) | 0.02 |
| 75–<100 | 0.63 (0.38, 1.05) | 0.08 | 0.58 (0.39, 0.86) | 0.01 | 0.66 (0.40, 1.10) | 0.11 |
| 100–<125 | 0.67 (0.39, 1.16) | 0.15 | 0.62 (0.39, 0.96) | 0.03 | 0.51 (0.27, 0.96) | 0.04 |
| ≥125 | 0.64 (0.36, 1.14) | 0.13 | 0.69 (0.43, 1.13) | 0.14 | 0.35 (0.17, 0.73) | <0.01 |
| Change in serum 25(OH)D, nmol/L | ||||||
| No improvement | ref | ref | ref | |||
| Increase of <25 | 1.16 (0.79, 1.68) | 0.45 | 0.90 (0.64, 1.27) | 0.55 | 0.62 (0.39, 1.00) | 0.05 |
| Increase of 25–<50 | 1.12 (0.76, 1.67) | 0.56 | 0.79 (0.55, 1.12) | 0.18 | 0.58 (0.35, 0.96) | 0.03 |
| Increase of 50–<75 | 1.25 (0.82, 1.91) | 0.30 | 0.86 (0.58, 1.26) | 0.43 | 0.54 (0.32, 0.92) | 0.02 |
| Increase of ≥75 | 1.40 (0.92, 2.13) | 0.12 | 0.82 (0.56, 1.20) | 0.30 | 0.52 (0.31, 0.89) | 0.02 |
© 2016 by the authors; licensee MDPI, Basel, Switzerland. This article is an open access article distributed under the terms and conditions of the Creative Commons Attribution (CC-BY) license (http://creativecommons.org/licenses/by/4.0/).
Share and Cite
Mastroeni, S.S.B.S.; Munasinghe, L.L.; Pham, T.-M.; Loehr, S.A.; Ekwaru, J.P.; Mastroeni, M.F.; Veugelers, P.J. The Effect of Serum 25-Hydroxyvitamin D Concentrations on Elevated Serum C-Reactive Protein Concentrations in Normal Weight, Overweight and Obese Participants of a Preventive Health Program. Nutrients 2016, 8, 696. https://doi.org/10.3390/nu8110696
Mastroeni SSBS, Munasinghe LL, Pham T-M, Loehr SA, Ekwaru JP, Mastroeni MF, Veugelers PJ. The Effect of Serum 25-Hydroxyvitamin D Concentrations on Elevated Serum C-Reactive Protein Concentrations in Normal Weight, Overweight and Obese Participants of a Preventive Health Program. Nutrients. 2016; 8(11):696. https://doi.org/10.3390/nu8110696
Chicago/Turabian StyleMastroeni, Silmara S. B. S., Lalani L. Munasinghe, Truong-Minh Pham, Sarah A. Loehr, John Paul Ekwaru, Marco F. Mastroeni, and Paul J. Veugelers. 2016. "The Effect of Serum 25-Hydroxyvitamin D Concentrations on Elevated Serum C-Reactive Protein Concentrations in Normal Weight, Overweight and Obese Participants of a Preventive Health Program" Nutrients 8, no. 11: 696. https://doi.org/10.3390/nu8110696
APA StyleMastroeni, S. S. B. S., Munasinghe, L. L., Pham, T.-M., Loehr, S. A., Ekwaru, J. P., Mastroeni, M. F., & Veugelers, P. J. (2016). The Effect of Serum 25-Hydroxyvitamin D Concentrations on Elevated Serum C-Reactive Protein Concentrations in Normal Weight, Overweight and Obese Participants of a Preventive Health Program. Nutrients, 8(11), 696. https://doi.org/10.3390/nu8110696