Differential Effects of Red Meat/Refined Grain Diet and Dairy/Chicken/Nuts/Whole Grain Diet on Glucose, Insulin and Triglyceride in a Randomized Crossover Study


Abstract
:1. Introduction
2. Methods
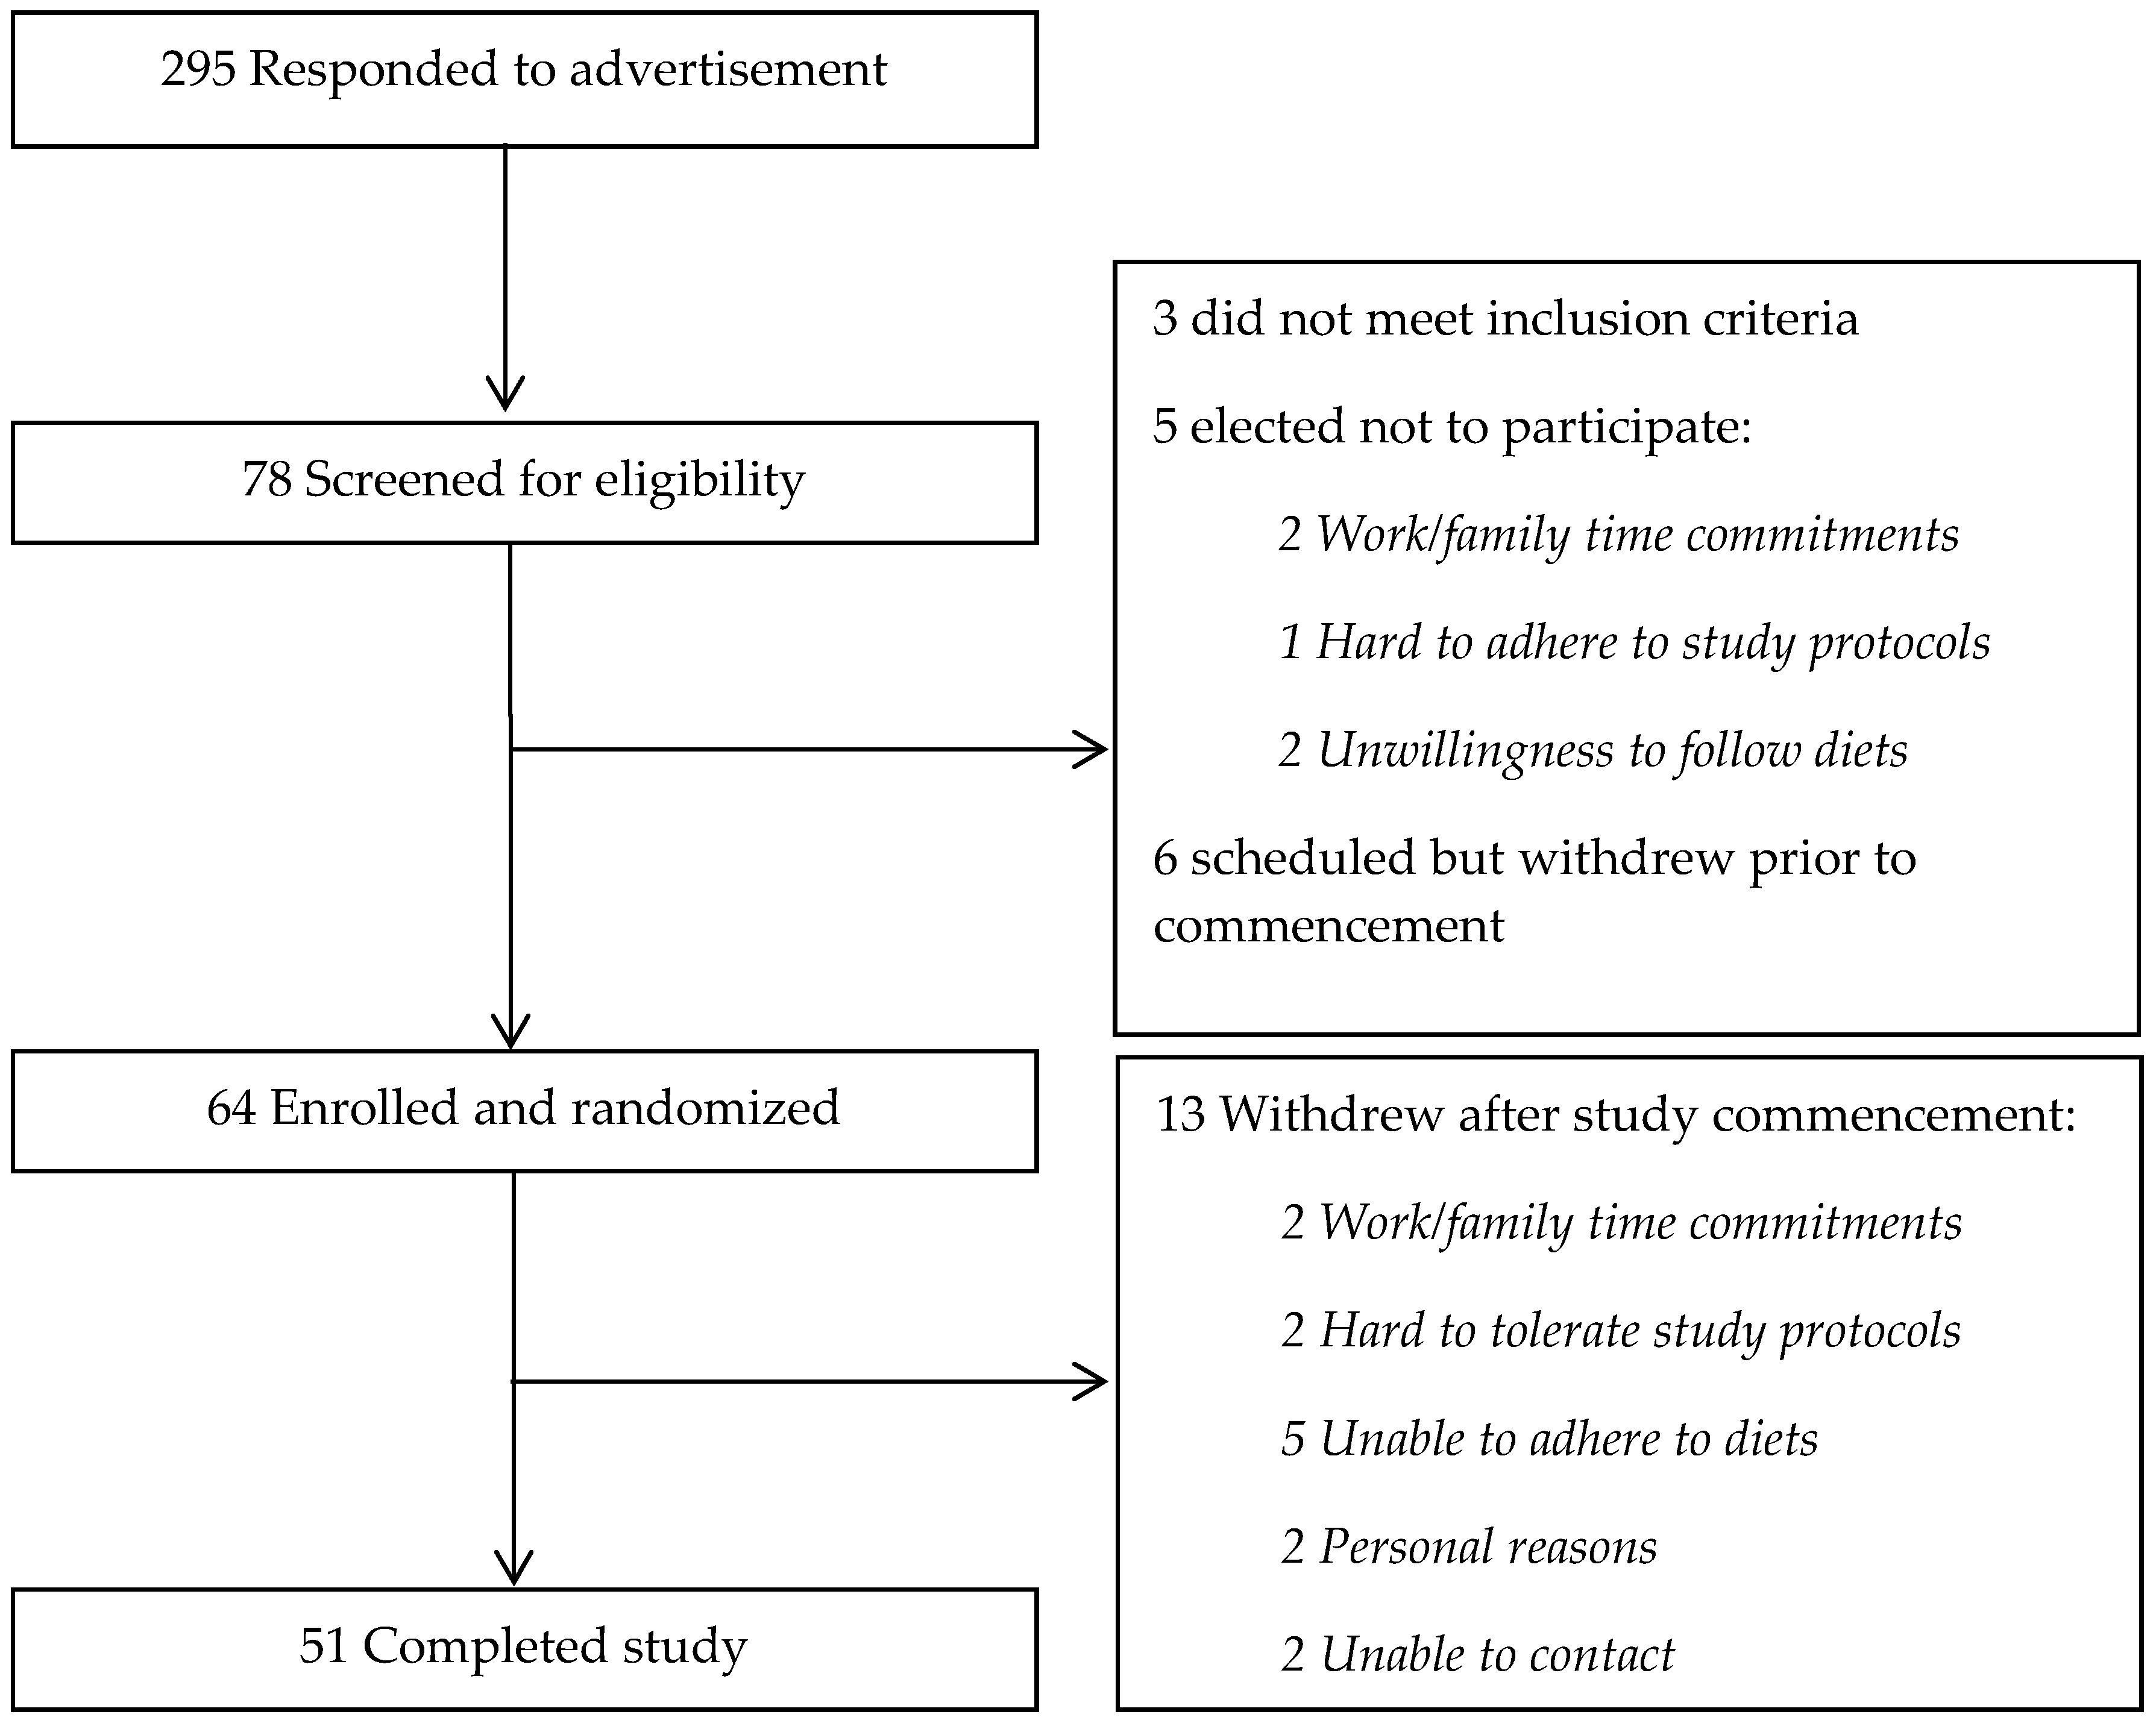
2.1. Participants
2.2. Dietary Intervention
2.3. Clinical Measurements
2.4. Analysis
3. Results
4. Discussion
5. Conclusions
Acknowledgments
Author Contributions
Conflicts of Interest
References
- Guariguata, L.; Whiting, D.R.; Hambleton, I.; Beagley, J.; Linnenkamp, U.; Shaw, J.E. Global estimates of diabetes prevalence for 2013 and projections for 2035. Diabetes Res. Clin. Pract. 2014, 103, 137–149. [Google Scholar] [CrossRef] [PubMed]
- Zhang, P.; Zhang, X.; Brown, J.; Vistisen, D.; Sicree, R.; Shaw, J.; Nichols, G. Global healthcare expenditure on diabetes for 2010 and 2030. Diabetes Res. Clin. Pract. 2010, 87, 293–301. [Google Scholar] [CrossRef] [PubMed]
- Lindstrom, J.; Neumann, A.; Sheppard, K.E.; Gilis-Januszewska, A.; Greaves, C.J.; Handke, U.; Pajunen, P.; Puhl, S.; Polonen, A.; Rissanen, A.; et al. Take action to prevent diabetes—The IMAGE toolkit for the prevention of type 2 diabetes in Europe. Horm. Metab. Res. 2010, 42, S37–S55. [Google Scholar] [CrossRef] [PubMed]
- Reaven, G.M. Banting lecture 1988. Role of insulin resistance in human disease. Diabetes 1988, 37, 1595–1607. [Google Scholar] [CrossRef] [PubMed]
- Weickert, M.O. What dietary modification best improves insulin sensitivity and why? Clin. Endocrinol. 2012, 77, 508–512. [Google Scholar] [CrossRef] [PubMed]
- Pan, X.R.; Li, G.W.; Hu, Y.H.; Wang, J.X.; Yang, W.Y.; An, Z.X.; Hu, Z.X.; Lin, J.; Xiao, J.Z.; Cao, H.B.; et al. Effects of diet and exercise in preventing niddm in people with impaired glucose tolerance. The da qing igt and diabetes study. Diabetes Care 1997, 20, 537–544. [Google Scholar] [CrossRef] [PubMed]
- Buyken, A.E.; Mitchell, P.; Ceriello, A.; Brand-Miller, J. Optimal dietary approaches for prevention of type 2 diabetes: A life-course perspective. Diabetologia 2010, 53, 406–418. [Google Scholar] [CrossRef] [PubMed]
- Hu, F.B. Dietary pattern analysis: A new direction in nutritional epidemiology. Curr. Opin. Lipidol. 2002, 13, 3–9. [Google Scholar] [CrossRef] [PubMed]
- Salas-Salvadó, J.; Guasch-Ferré, M.; Lee, C.-H.; Estruch, R.; Clish, C.B.; Ros, E. Protective effects of the mediterranean diet on type 2 diabetes and metabolic syndrome. J. Nutr. 2016. [Google Scholar] [CrossRef] [PubMed]
- Carter, P.; Gray, L.J.; Troughton, J.; Khunti, K.; Davies, M.J. Fruit and vegetable intake and incidence of type 2 diabetes mellitus: Systematic review and meta-analysis. BMJ 2010, 341, c4229. [Google Scholar] [CrossRef] [PubMed]
- Cooper, A.J.; Forouhi, N.G.; Ye, Z.; Buijsse, B.; Arriola, L.; Balkau, B.; Barricarte, A.; Beulens, J.W.; Boeing, H.; Buchner, F.L.; et al. Fruit and vegetable intake and type 2 diabetes: Epic-interact prospective study and meta-analysis. Eur. J. Clin. Nutr. 2012, 66, 1082–1092. [Google Scholar] [CrossRef] [PubMed]
- Micha, R.; Wallace, S.K.; Mozaffarian, D. Red and processed meat consumption and risk of incident coronary heart disease, stroke, and diabetes mellitus a systematic review and meta-analysis. Circulation 2010, 121, 2271–2283. [Google Scholar] [CrossRef] [PubMed]
- Pan, A.; Sun, Q.; Bernstein, A.M.; Schulze, M.B.; Manson, J.E.; Willett, W.C.; Hu, F.B. Red meat consumption and risk of type 2 diabetes: 3 cohorts of us adults and an updated meta-analysis. Am. J. Clin. Nutr. 2011, 94, 1088–1096. [Google Scholar] [CrossRef] [PubMed]
- Feskens, E.J.; Sluik, D.; van Woudenbergh, G.J. Meat consumption, diabetes, and its complications. Curr. Diab. Rep. 2013, 13, 298–306. [Google Scholar] [CrossRef] [PubMed]
- Van Dam, R.M.; Rimm, E.B.; Willett, W.C.; Stampfer, M.J.; Hu, F.B. Dietary patterns and risk for type 2 diabetes mellitus in U.S. Men. Ann. Intern. Med. 2002, 136, 201–209. [Google Scholar] [CrossRef] [PubMed]
- Salas-Salvado, J.; Bullo, M.; Estruch, R.; Ros, E.; Covas, M.I.; Ibarrola-Jurado, N.; Corella, D.; Aros, F.; Gomez-Gracia, E.; Ruiz-Gutierrez, V.; et al. Prevention of diabetes with mediterranean diets: A subgroup analysis of a randomized trial. Ann. Intern. Med. 2014, 160, 1–10. [Google Scholar] [CrossRef] [PubMed]
- Piatti, P.; Monti, L.; Caumo, A.; Santambrogio, G.; Magni, F.; Galli-Kienle, M.; Costa, S.; Pontiroli, A.; Alberti, K.; Pozza, G. The continuous low dose insulin and glucose infusion test: A simplified and accurate method for the evaluation of insulin sensitivity and insulin secretion in population studies. J. Clin. Endocrinol. Metab. 1995, 80, 34–40. [Google Scholar] [CrossRef] [PubMed]
- Van Baak, M.A. 24-h glucose profiles on diets varying in protein content and glycemic index. Nutrients 2014, 6, 3050–3061. [Google Scholar] [CrossRef] [PubMed]
- Haffner, S.M.; Stern, M.P.; Watanabe, R.M.; Bergman, R.N. Relationship of insulin clearance and secretion to insulin sensitivity in non-diabetic Mexican Americans. Eur. J. Clin. Investig. 1992, 22, 147–153. [Google Scholar] [CrossRef]
- Jones, C.N.; Abbasi, F.; Carantoni, M.; Polonsky, K.S.; Reaven, G.M. Roles of insulin resistance and obesity in regulation of plasma insulin concentrations. Am. J. Phys. Endocrinol. Metab. 2000, 278, E501–E508. [Google Scholar]
- Lee, C.C.; Lorenzo, C.; Haffner, S.M.; Wagenknecht, L.E.; Goodarzi, M.O.; Stefanovski, D.; Norris, J.M.; Rewers, M.J.; Hanley, A.J. Components of metabolic syndrome and 5-year change in insulin clearance—The insulin resistance atherosclerosis study. Diabetes Obes. Metab. 2013, 15, 441–447. [Google Scholar] [CrossRef] [PubMed]
- Lee, C.C.; Haffner, S.M.; Wagenknecht, L.E.; Lorenzo, C.; Norris, J.M.; Bergman, R.N.; Stefanovski, D.; Anderson, A.M.; Rotter, J.I.; Goodarzi, M.O.; et al. Insulin clearance and the incidence of type 2 diabetes in hispanics and African Americans: The iras family study. Diabetes Care 2013, 36, 901–907. [Google Scholar] [CrossRef] [PubMed]
- Lee, C.C.; Lorenzo, C.; Haffner, S.M.; Wagenknecht, L.E.; Festa, A.; Goodarzi, M.O.; Stefanovski, D.; Olson, N.C.; Norris, J.M.; Rewers, M.J.; et al. The association of inflammatory and fibrinolytic proteins with 5 years change in insulin clearance: The insulin resistance atherosclerosis study (iras). Diabetologia 2013, 56, 112–120. [Google Scholar] [CrossRef] [PubMed]
- Jensen, L.; Sloth, B.; Krog-Mikkelsen, I.; Flint, A.; Raben, A.; Tholstrup, T.; Brunner, N.; Astrup, A. A low-glycemic-index diet reduces plasma plasminogen activator inhibitor-1 activity, but not tissue inhibitor of proteinases-1 or plasminogen activator inhibitor-1 protein, in overweight women. Am. J. Clin. Nutr. 2008, 87, 97–105. [Google Scholar] [PubMed]
- Jarvi, A.E.; Karlstrom, B.E.; Granfeldt, Y.E.; Bjorck, I.E.; Asp, N.G.; Vessby, B.O. Improved glycemic control and lipid profile and normalized fibrinolytic activity on a low-glycemic index diet in type 2 diabetic patients. Diabetes Care 1999, 22, 10–18. [Google Scholar] [CrossRef] [PubMed]
- Jenkins, D.J.; Kendall, C.W.; Axelsen, M.; Augustin, L.S.; Vuksan, V. Viscous and nonviscous fibres, nonabsorbable and low glycaemic index carbohydrates, blood lipids and coronary heart disease. Curr. Opin. Lipidol. 2000, 11, 49–56. [Google Scholar] [CrossRef] [PubMed]
- Josse, A.R.; Kendall, C.W.; Augustin, L.S.; Ellis, P.R.; Jenkins, D.J. Almonds and postprandial glycemia—A dose-response study. Metabolism 2007, 56, 400–404. [Google Scholar] [CrossRef] [PubMed]
- Kendall, C.W.; Josse, A.R.; Esfahani, A.; Jenkins, D.J. The impact of pistachio intake alone or in combination with high-carbohydrate foods on post-prandial glycemia. Eur. J. Clin. Nutr. 2011, 65, 696–702. [Google Scholar] [CrossRef] [PubMed]
- Sabate, J.; Oda, K.; Ros, E. Nut consumption and blood lipid levels: A pooled analysis of 25 intervention trials. Arch. Intern. Med. 2010, 170, 821–827. [Google Scholar] [CrossRef] [PubMed]
- Weickert, M.O.; Roden, M.; Isken, F.; Hoffmann, D.; Nowotny, P.; Osterhoff, M.; Blaut, M.; Alpert, C.; Gogebakan, O.; Bumke-Vogt, C.; et al. Effects of supplemented isoenergetic diets differing in cereal fiber and protein content on insulin sensitivity in overweight humans. Am. J. Clin. Nutr. 2011, 94, 459–471. [Google Scholar] [CrossRef] [PubMed]
- Hattersley, J.G.; Pfeiffer, A.F.; Roden, M.; Petzke, K.J.; Hoffmann, D.; Rudovich, N.N.; Randeva, H.S.; Vatish, M.; Osterhoff, M.; Goegebakan, O.; et al. Modulation of amino acid metabolic signatures by supplemented isoenergetic diets differing in protein and cereal fiber content. J. Clin. Endocrinol. Metab. 2014, 99, E2599–E2609. [Google Scholar] [CrossRef] [PubMed]
- Leinonen, K.; Liukkonen, K.; Poutanen, K.; Uusitupa, M.; Mykkänen, H. Rye bread decreases postprandial insulin response but does not alter glucose response in healthy finish subjects. Eur. J. Clin. Nutr. 1999, 53, 262–267. [Google Scholar] [CrossRef] [PubMed]
- Pal, S.; Ellis, V. The acute effects of four protein meals on insulin, glucose, appetite and energy intake in lean men. Br. J. Nutr. 2010, 104, 1241–1248. [Google Scholar] [CrossRef] [PubMed]
- Turner, K.M.; Keogh, J.B.; Clifton, P.M. Acute effect of red meat and dairy on glucose and insulin: A randomized crossover study. Am. J. Clin. Nutr. 2016, 103, 71–76. [Google Scholar] [CrossRef] [PubMed]
- Ma, J.; Stevens, J.E.; Cukier, K.; Maddox, A.F.; Wishart, J.M.; Jones, K.L.; Clifton, P.M.; Horowitz, M.; Rayner, C.K. Effects of a protein preload on gastric emptying, glycemia, and gut hormones after a carbohydrate meal in diet-controlled type 2 diabetes. Diabetes Care 2009, 32, 1600–1602. [Google Scholar] [CrossRef] [PubMed]
- Hutchison, A.T.; Piscitelli, D.; Horowitz, M.; Jones, K.L.; Clifton, P.M.; Standfield, S.; Hausken, T.; Feinle-Bisset, C. Acute load-dependent effects of oral whey protein on gastric emptying, gut hormone release, glycemia, appetite, and energy intake in healthy men. Am. J. Clin. Nutr. 2015, 102, 1574–1584. [Google Scholar] [CrossRef] [PubMed]
- Turner, K.M.; Keogh, J.B.; Clifton, P.M. Dairy consumption and insulin sensitivity: A systematic review of short- and long-term intervention studies. Nutr. Metab. Cardiovasc. Dis. 2015, 25, 3–8. [Google Scholar] [CrossRef] [PubMed]
- Turner, K.M.; Keogh, J.B.; Clifton, P.M. Red meat, dairy, and insulin sensitivity: A randomized crossover intervention study. Am. J. Clin. Nutr. 2015, 101, 1173–1179. [Google Scholar] [CrossRef] [PubMed]
- Larsen, N.; Vogensen, F.K.; van den Berg, F.W.; Nielsen, D.S.; Andreasen, A.S.; Pedersen, B.K.; Al-Soud, W.A.; Sørensen, S.J.; Hansen, L.H.; Jakobsen, M. Gut microbiota in human adults with type 2 diabetes differs from non-diabetic adults. PLoS ONE 2010, 5, e9085. [Google Scholar] [CrossRef] [PubMed]
- Hill, R.J.; Davies, P.S. The validity of self-reported energy intake as determined using the doubly labelled water technique. Br. J. Nutr. 2001, 85, 415–430. [Google Scholar] [CrossRef] [PubMed]
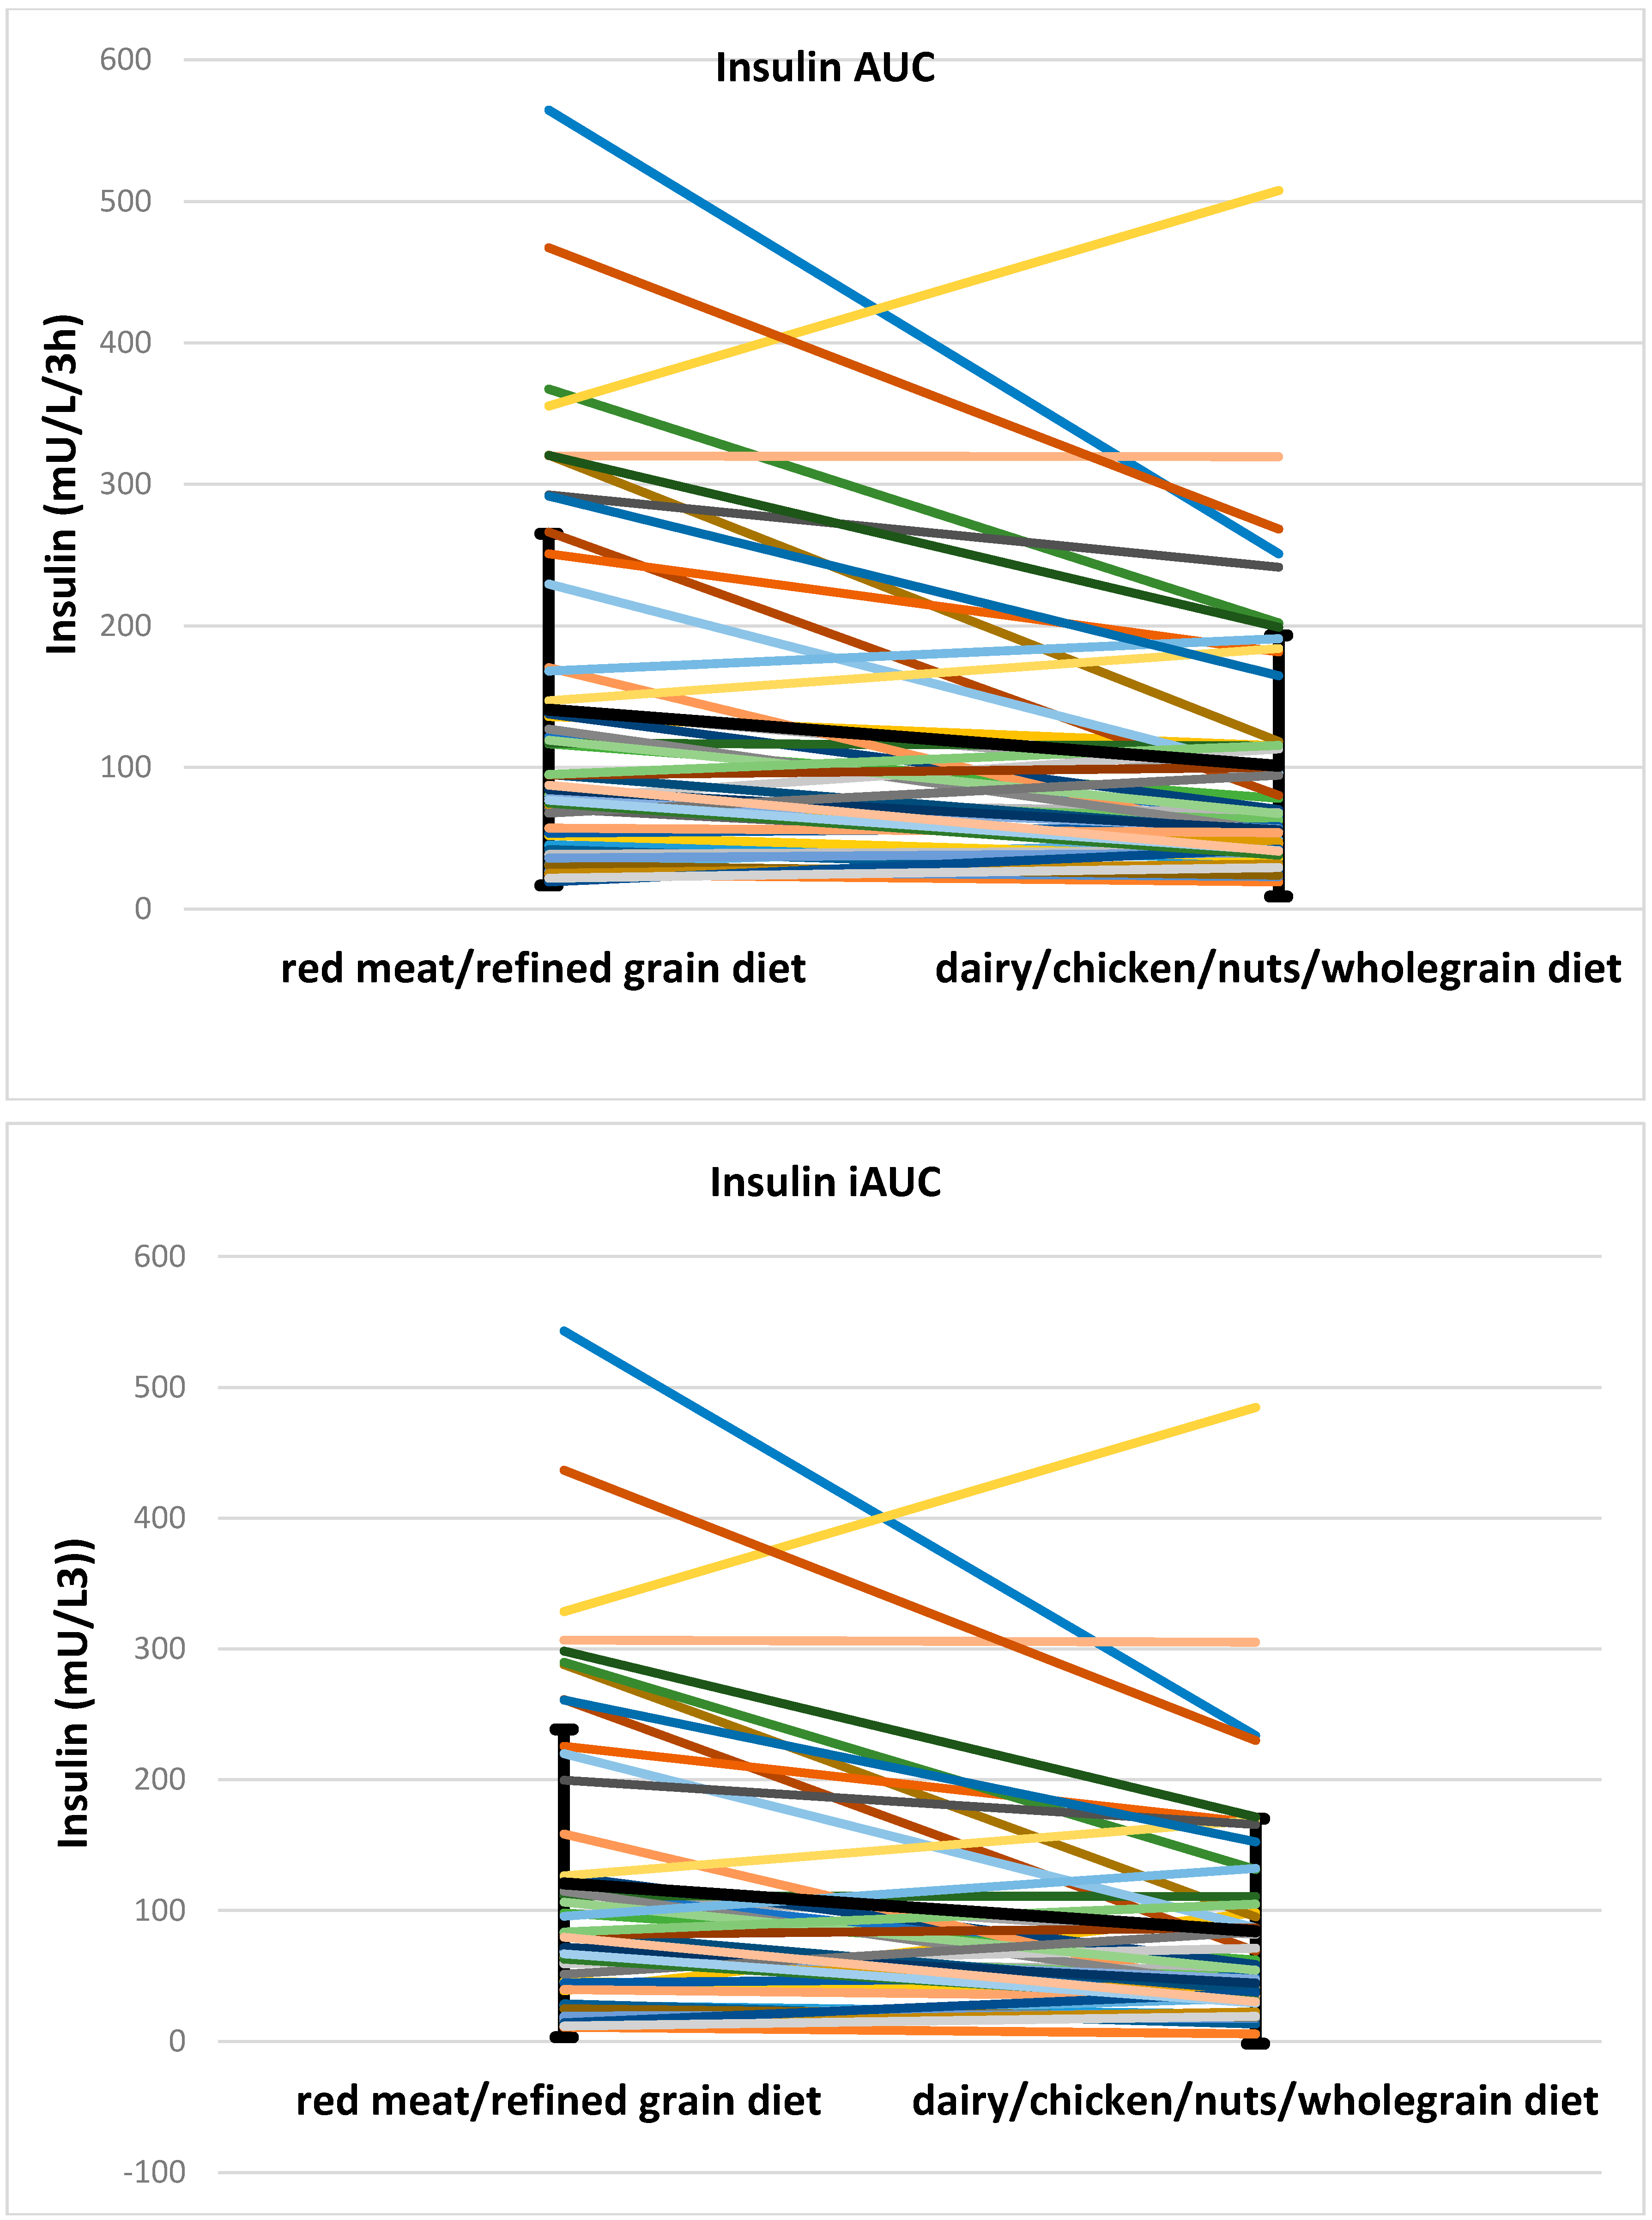
 red meat/refined grain diet;
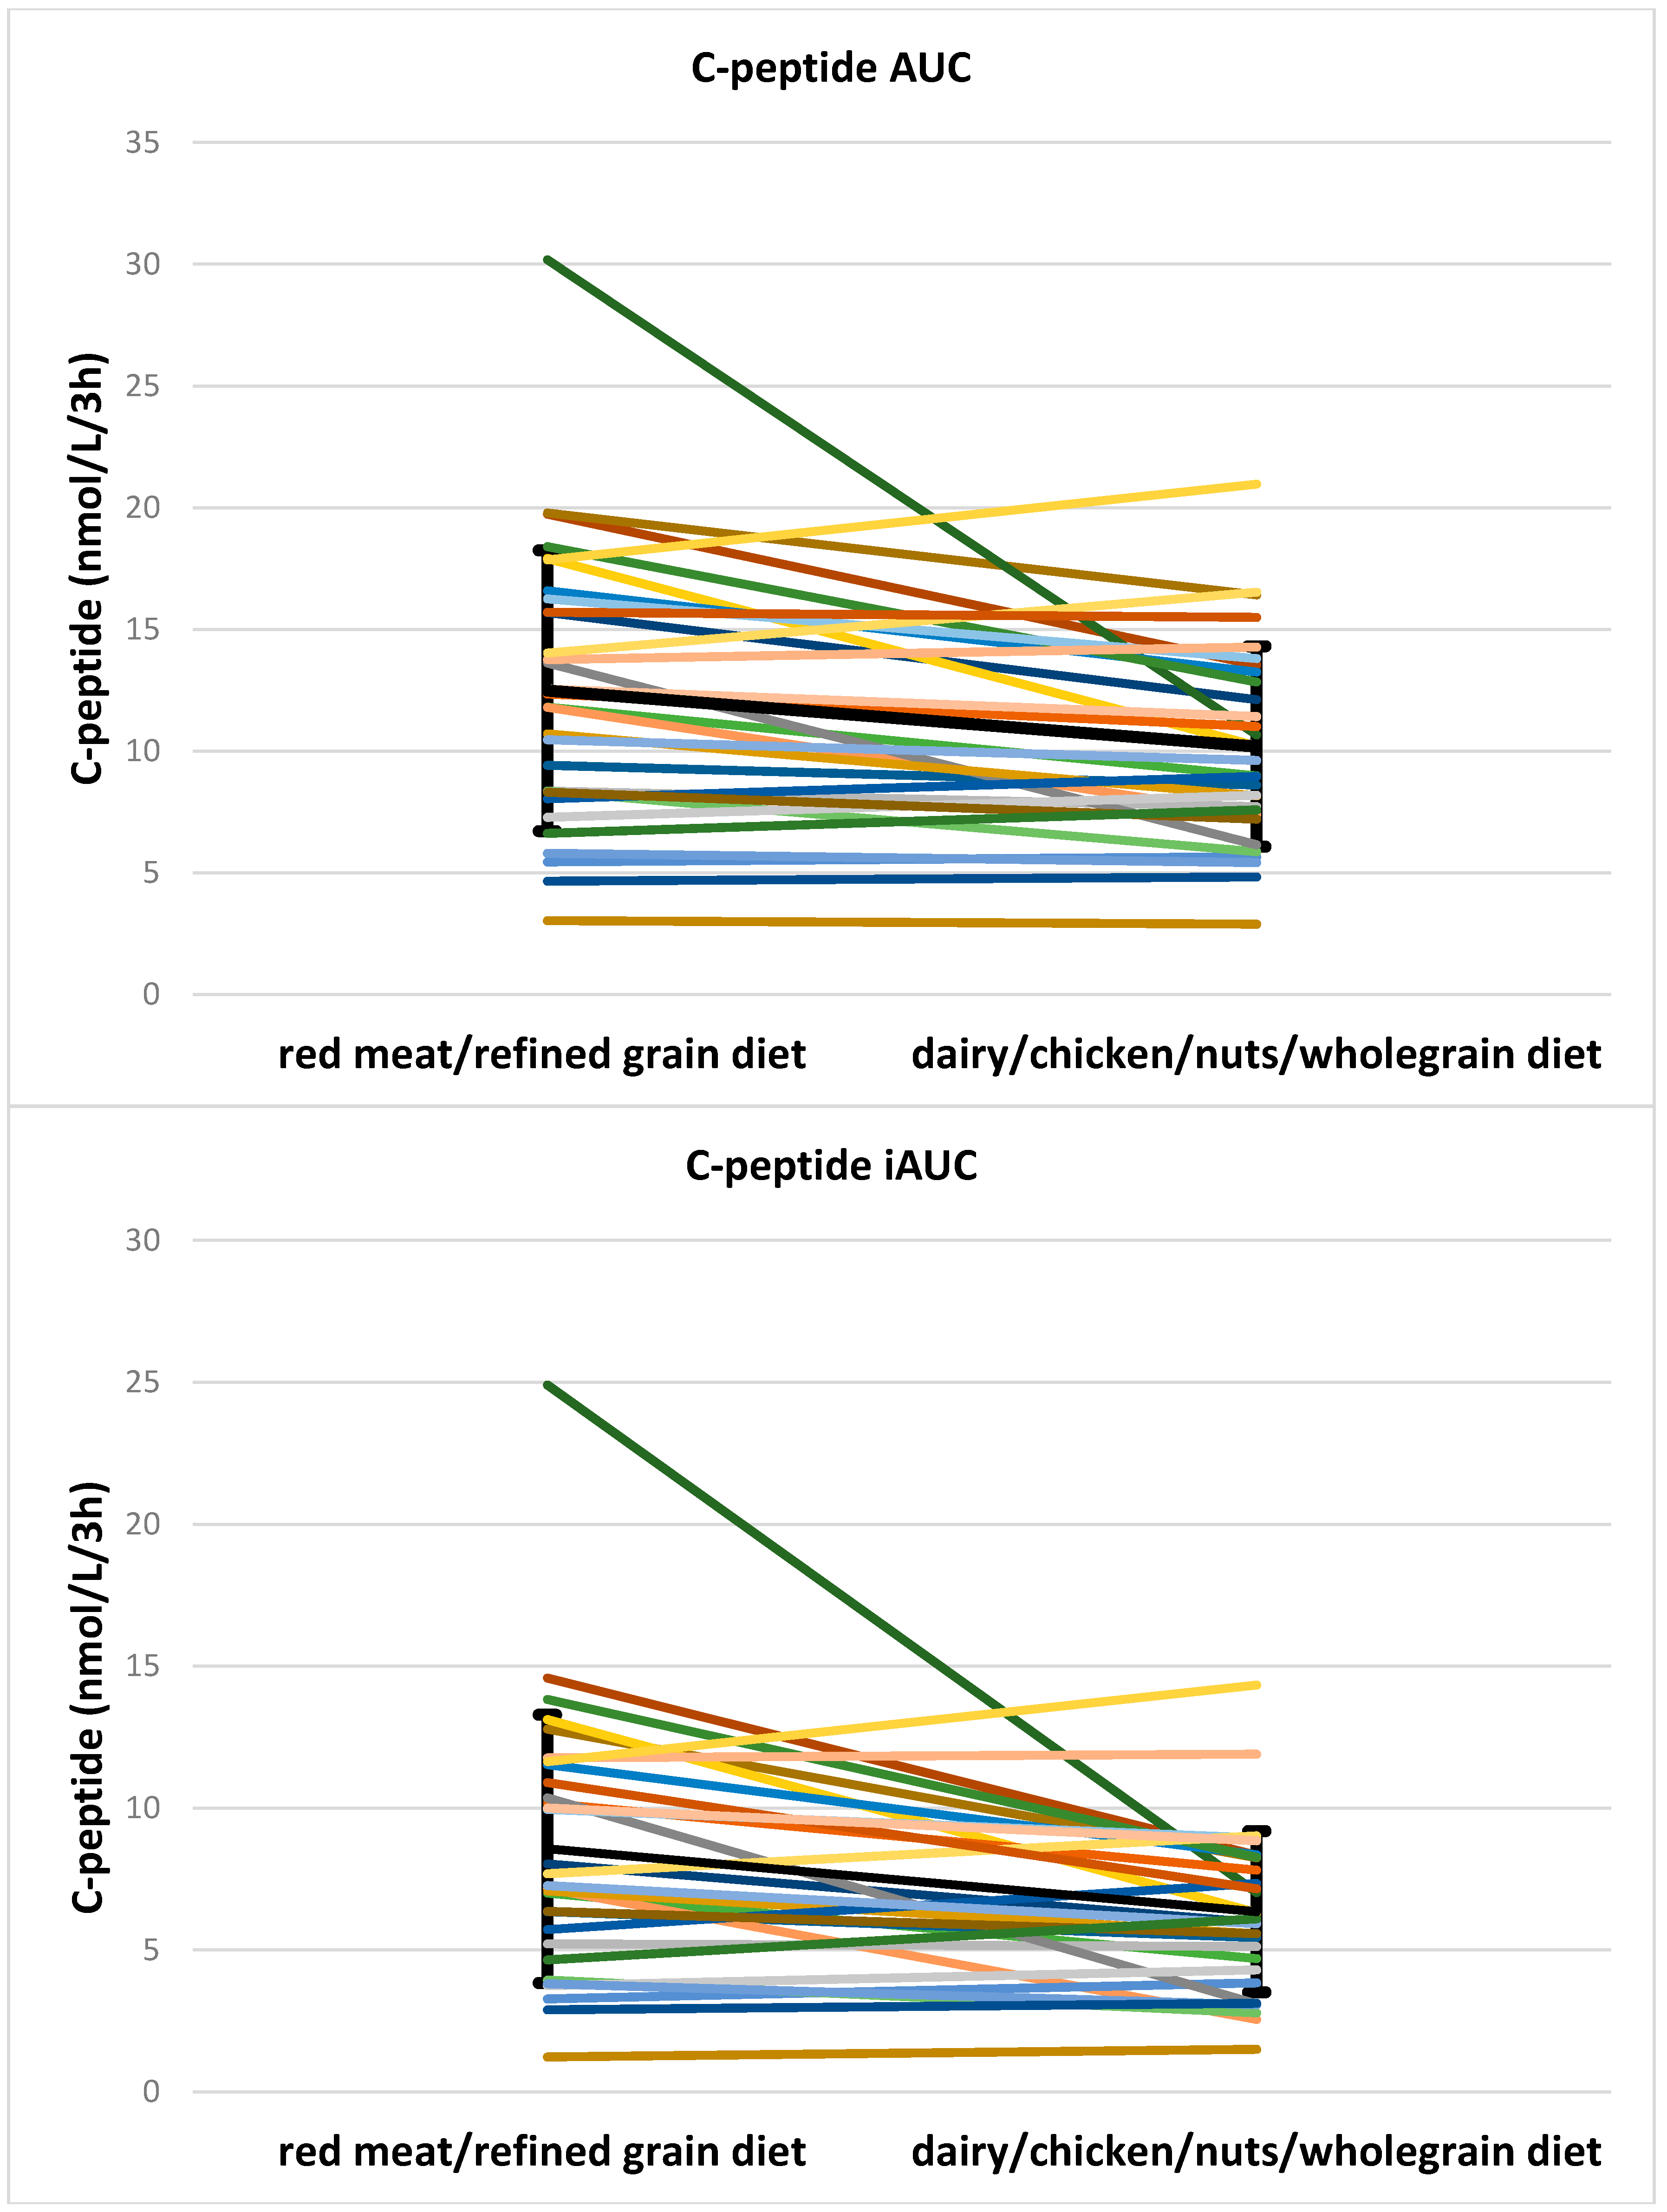
  dairy/chicken/nuts/whole grain diet.
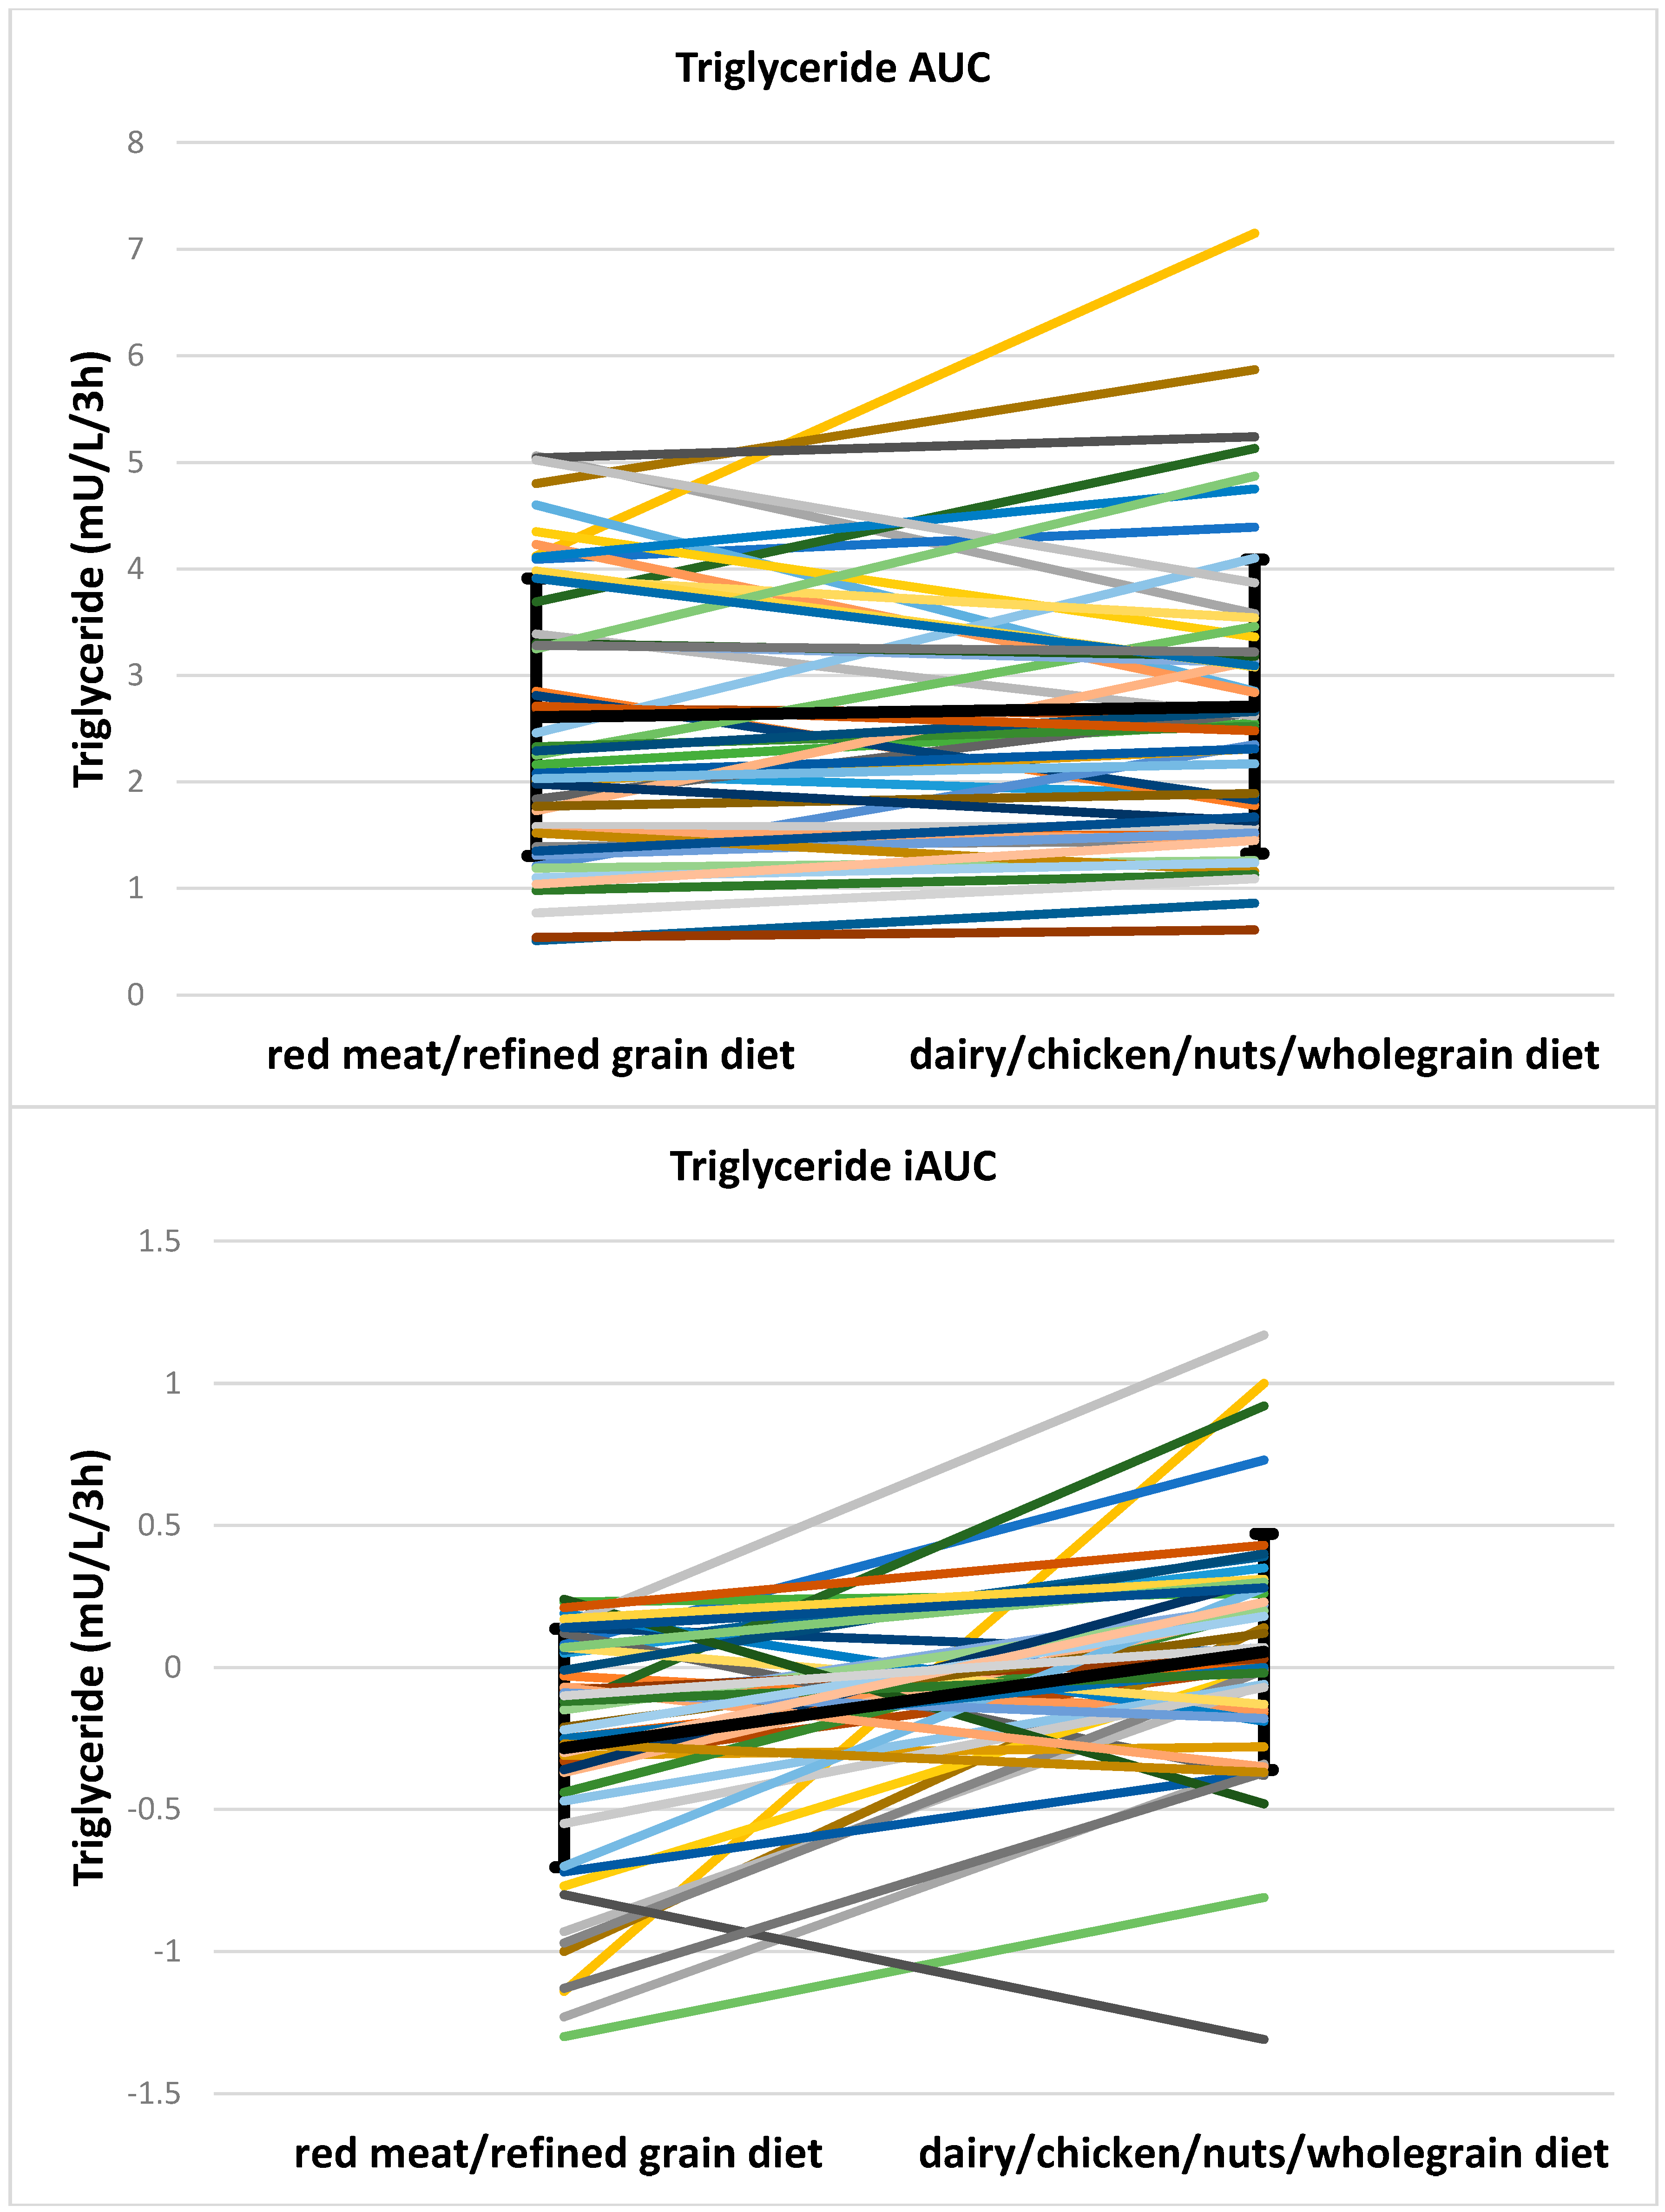
red meat/refined grain diet; dairy/chicken/nuts/whole grain diet.
dairy/chicken/nuts/whole grain diet.
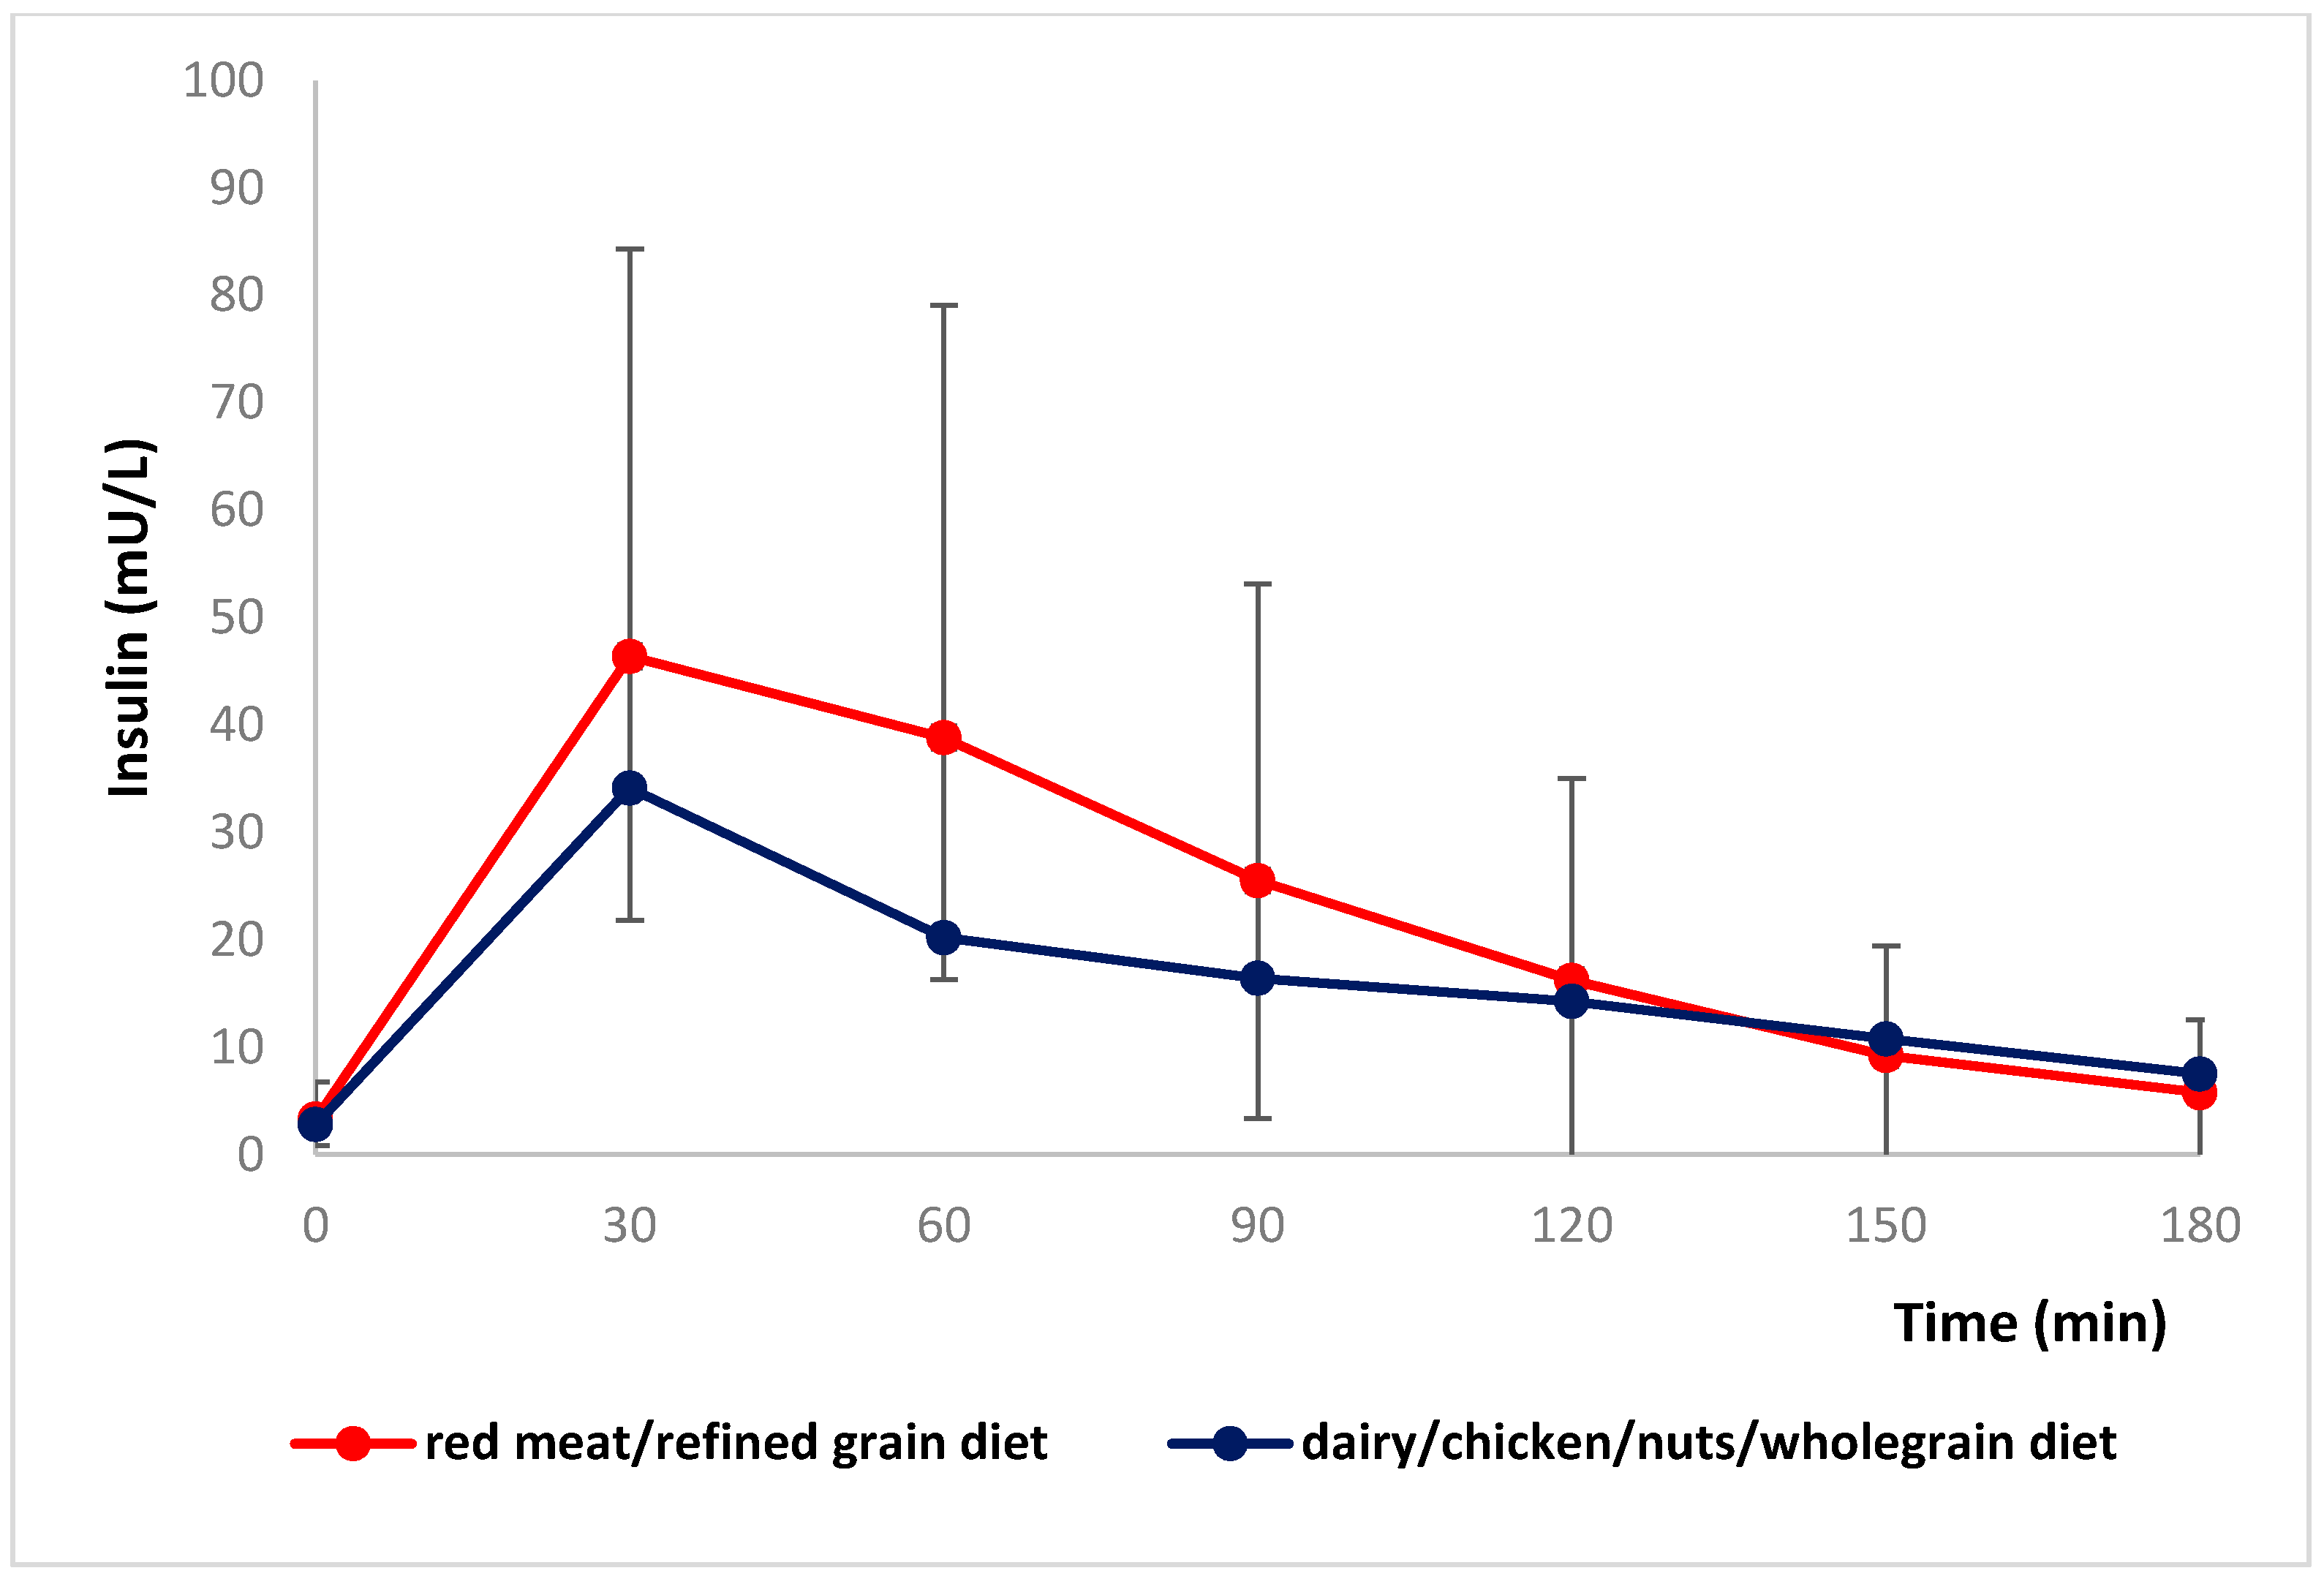
red meat/refined grain diet; dairy/chicken/nuts/whole grain diet.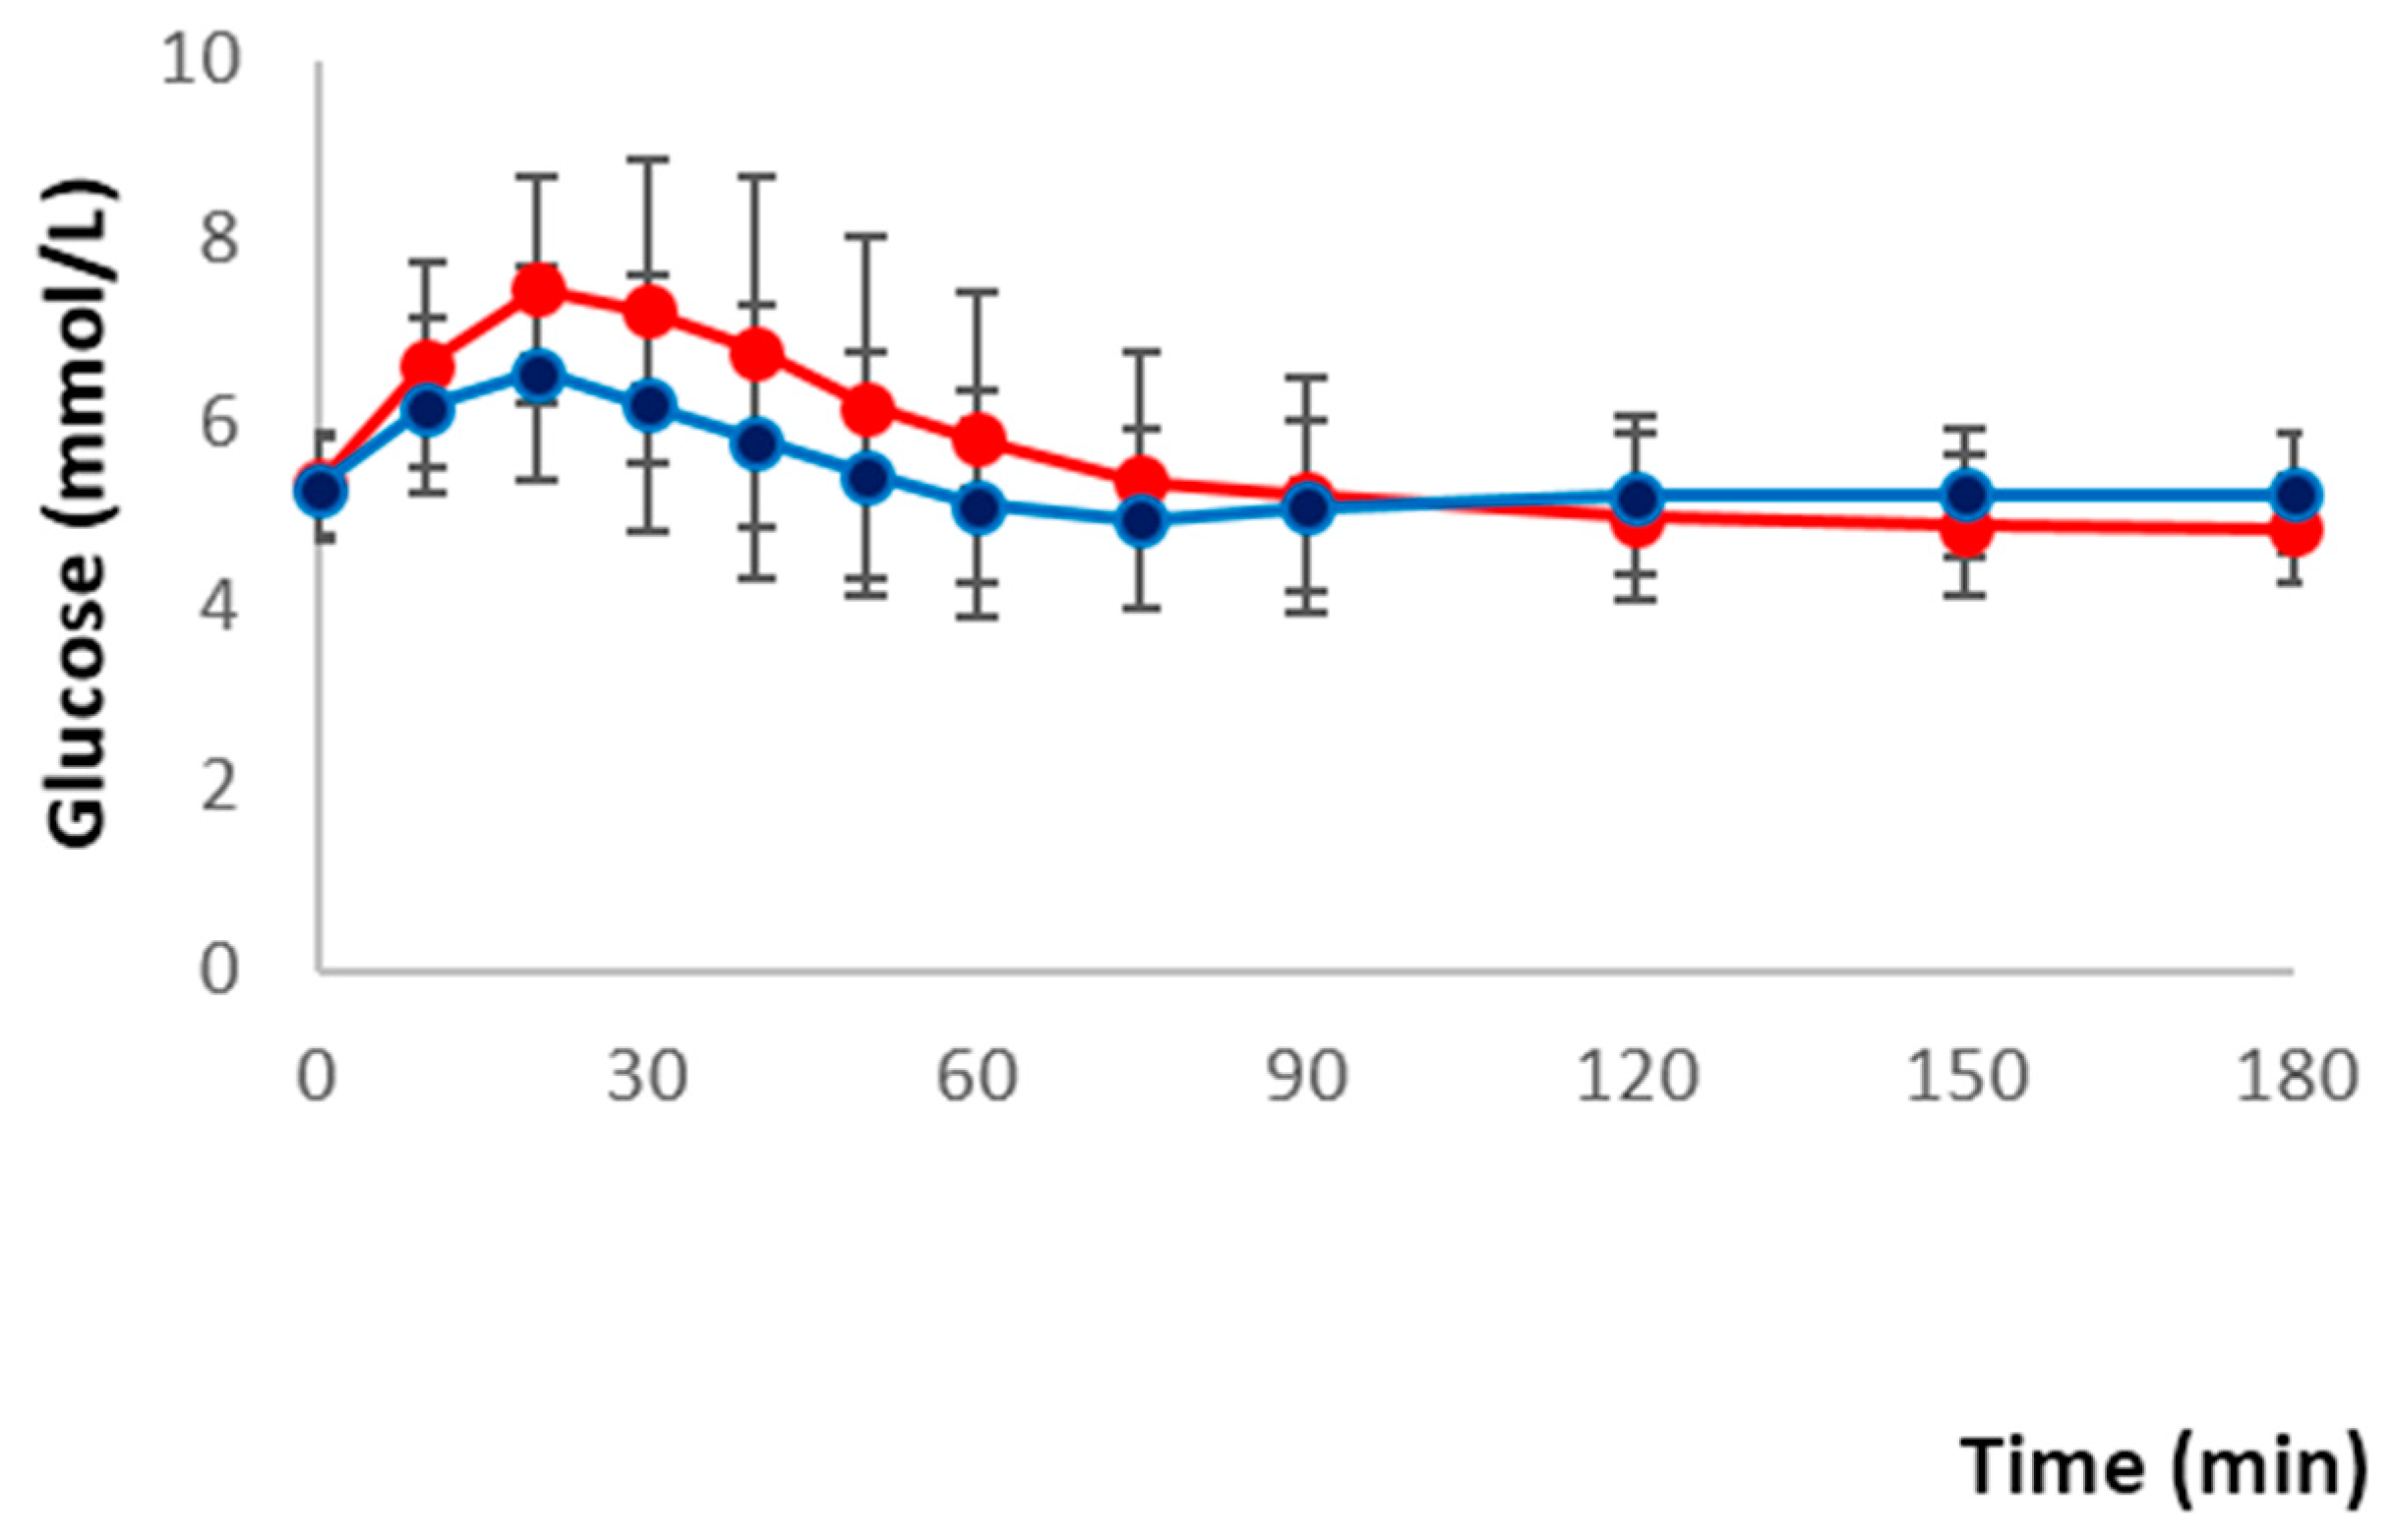


| Red Meat/Refined Grain Diet | Dairy/Chicken/Nuts/Whole Grain Diet | ||
|---|---|---|---|
| Food | Daily Goal | Food | Daily Goal |
| Red meat | 200–300 g | Chicken Fish Cooked legumes | 80–150 g 70–150 g 150–225 g (l cup–1.5 cups) |
| Processed meat | ≥50 g | Nuts | 60–90 g |
| Refined grains | 4–6 serves | Whole grains | 3–4 serves |
| Dairy products | minimal | Dairy products | 4 serves |
| Potato | 200–300 g | ||
| Vegetables | 1–2 serves | Vegetables | 1–2 serves |
| Fruits | 1–2 serves | Fruits | 1–2 serves |
| Oil/spread | 3–9 serves | Oil/spread | 2–7 serves |
| Jam or marmalade | 1 serve | Jam or marmalade | ≤1 serve |
| Wine/Alcohol | Optional | Wine/Alcohol | Optional |
| Indulgence food | 3–4 serves To replace refined grains or potato if desired | ||
| Amount (g) | Energy (kJ) | CHO (g) | Food GI | Protein (g) | Fat (g) | Sat Fat (g) | Cholesterol (mg) | Sugar (g) | Dietary Fibre (g) | Sodium (mg) | |
|---|---|---|---|---|---|---|---|---|---|---|---|
| Red meat/refined grain meal | |||||||||||
| Bread, white, | 80 | 848 | 39.2 | 70 | 6.4 | 1.52 | 0.24 | 0 | 2.32 | 2.16 | 320 |
| 25% orange juice | 250 | 481 | 26.8 | 52 | 0.3 | 0 | 0 | 0 | 25.7 | 0.2 | 1 |
| Lettuce, iceberg, raw | 20 | 8 | 0.08 | 0.2 | 0.02 | 0 | 0 | 0.08 | 0.3 | 5.2 | |
| Tomato, raw | 10 | 7.4 | 0.24 | 0.1 | 0.01 | 0 | 0 | 0.23 | 0.12 | 0.8 | |
| Ham, leg, lean & fat | 105 | 804 | 1.5 | 20.7 | 11.6 | 4.7 | 73.5 | 0.1 | 0 | 1614 | |
| Onion, raw | 3 | 3.81 | 0.14 | 0.05 | 0 | 0 | 0 | 0.14 | 0.06 | 0.3 | |
| Pickle | 3 | 10.44 | 0.5 | 0.02 | 0.02 | 0 | 0 | 0.44 | 0.04 | 18.6 | |
| Total | 2162.65 | 68.46 | 60.4 | 27.77 | 13.17 | 4.94 | 73.5 | 29.01 | 2.88 | 1959.9 | |
| Dairy/chicken/nuts/wholegrain meal | |||||||||||
| Bread, wholegrain, | 80 | 840 | 34.6 | 53 | 7.6 | 2.56 | 0.32 | 0 | 2.8 | 4.16 | 320 |
| Nuts, cashews, raw | 7 | 170.59 | 1.18 | 22 | 1.19 | 3.44 | 0.59 | 0 | 0.39 | 0.41 | 0.77 |
| Nuts, peanuts, raw | 7 | 166 | 1.12 | 14 | 1.82 | 3.43 | 0.49 | 0 | 0.28 | 0.63 | 1.26 |
| Yoghurt, greek, natural | 100 | 557 | 6.9 | 27 | 4.7 | 9.7 | 6.4 | - | 6.9 | 0 | 62 |
| Chicken, breast, lean, raw | 50 | 219 | 0 | 11.15 | 0.8 | 0.25 | 29.5 | 0 | 0 | 20.5 | |
| Milk, reduced fat | 200 | 372 | 9.6 | 37 | 6.64 | 2.6 | 1.8 | - | 9.6 | 0 | 86 |
| Lettuce, iceberg, raw | 20 | 8 | 0.08 | 0.2 | 0.02 | 0 | 0.08 | 0.3 | 5.2 | ||
| Tomato, raw | 10 | 7.4 | 0.24 | 0.1 | 0.01 | 0 | 0.23 | 0.12 | 0.8 | ||
| Total | 2339.99 | 53.72 | 44.9 | 33.4 | 22.56 | 9.85 | 29.5 | 20.28 | 5.62 | 496.53 |
| All Participants | Participants Randomized to Red Meat/Refined Grain Diet First and Then Dairy/Chicken/Nuts/Whole Grain Diet (n = 27) | Participants Randomized to Dairy/Chicken/Nuts/Whole Grain Diet First and Then Red Meat/Refined Grain Diet (n = 24) | p Value | |
|---|---|---|---|---|
| Sex (Male/Female) | 15/36 | 9/18 | 6/18 | 0.5 |
| Age (year) | 35.1 ± 15.6 | 33 ± 12.7 | 37.4 ± 18.3 | 0.3 |
| NGT (n) | 17 | 10 | 7 | 0.6 |
| IFG/IGT (n) | 34 | 17 | 17 | |
| Baseline fasting glucose (mmol/L) | 5.5 ± 0.7 | 5.6 ± 0.7 | 5.4 ± 0.7 | 0.4 |
| Baseline 2-h glucose (mmol/L) | 7.3 ± 1.6 | 6.9 ± 1.3 | 7.8 ± 1.8 | 0.04 * |
| Baseline weight (kg) | 79.4 ± 21.36 | 82.6 ± 21.4 | 75.8 ± 21.2 | 0.3 |
| BMI (kg/m2) | 27.7 ± 6.9 | 28.6 ± 7.0 | 26.7 ± 6.9 | 0.3 |
| Baseline SBP (mmHg) | 112.2 ± 10.7 2 | 112.2 ± 12.4 3 | 112.2 ± 8.4 4 | 1 |
| Baseline DBP (mmHg) | 70.7 ± 9.7 2 | 70.4 ± 9.7 3 | 71.3 ± 9.9 4 | 0.8 |
| Total Fat Mass (kg) | 29 ± 15.7 | 30.4 ± 15.6 | 27.4 ± 16.0 | 0.5 |
| Total Lean Mass (kg) | 46.6 ± 11.5 | 48.4 ± 12.3 | 44.6 ± 10.4 | 0.2 |
| Total Fat Mass (%) | 36.6 ± 12.6 | 37.3 ± 12.2 | 35.9 ± 13.3 | 0.7 |
| Red Meat/Refined Grain Diet | Dairy/Chicken/Nuts/Wholegrain Diet | ||
|---|---|---|---|
| Food | Average intake | Food | Average intake |
| Red meat | 241.3 g | Chicken | 105.5 g |
| Fish | 110.5 g | ||
| Cooked legumes | 154.3 g | ||
| Processed meat | 55.8 g | Nuts | 70 g |
| Refined grains | 5.2 serves (320.4 g) * | Whole grains | 3.9 serves (235.8 g) * |
| Dairy products | 3.8 serves (687.4 g) | ||
| Red Meat/Refined Grain Diet | Dairy/Chicken/Nuts/Whole Grain Diet | p Value | |
|---|---|---|---|
| Energy (kJ) | 8406 ± 1172 | 8382 ± 1078 | 0.76 |
| Protein (g) | 95, 13.7 | 97, 14 | 0.41 |
| Total fat (g) | 73 ± 18 | 87 ± 16 | p < 0.001 |
| Saturated fat (g) | 26.2, 8.5 | 26, 9.3 | 0.93 |
| Polyunsaturated fat (g) | 8.7, 4.4 | 17.2, 6.6 | p < 0.001 |
| Monounsaturated fat (g) | 31 ± 9 | 37 ± 7 | p < 0.001 |
| Cholesterol (mg) | 219.4, 52 | 158, 67 | p < 0.001 |
| Carbohydrate (g) | 218.3, 43 | 181,40 | p < 0.001 |
| Sugars (g) | 61, 26 | 89, 26 | p < 0.001 |
| Starch (g) | 151.3, 46 | 93, 43 | p < 0.001 |
| Alcohol (g) | 0, 8.7 | 0, 1.8 | p < 0.05 |
| Dietary fibre (g) | 17, 6.4 | 27,8 | p < 0.001 |
| Thiamine (mg) | 1.5, 0.6 | 1.9, 0.5 | p < 0.05 |
| Riboflavin (mg) | 1, 0.5 | 2.8, 0.7 | p < 0.001 |
| Niacin (mg) | 46.1, 12 | 44, 9.4 | 0.12 |
| Vitamin C (mg) | 90.5, 50 | 54, 40 | p < 0.001 |
| Total folate (µg) | 236, 157 | 386, 131 | p < 0.001 |
| Sodium (mg) | 2092, 918 | 1588, 523 | p < 0.001 |
| Potassium (mg) | 2886 ± 531 | 3441 ± 450 | p < 0.001 |
| Magnesium (mg) | 229, 51 | 518, 138 | p < 0.001 |
| Calcium (mg) | 245, 116 | 1418, 253 | p < 0.001 |
| Iron (mg) | 11.5, 3 | 11.5, 4 | 0.7 |
| Zinc (mg) | 13.6, 3.8 | 12, 2.6 | p < 0.001 |
| Protein (% energy) | 19.2, 3 | 19.6, 3 | 0.4 |
| Fat (% energy) | 32 ± 5 | 39 ± 5 | p < 0.001 |
| Carbohydrate (% energy) | 44 ± 6 | 37 ± 5 | p < 0.001 |
| Fibre (% energy) | 1.7, 0.4 | 2.7, 0.7 | p < 0.001 |
| All (n = 51) | Group with NGT (n = 17) | Group with IFG or IGT (n = 34) | ||||||||
|---|---|---|---|---|---|---|---|---|---|---|
| Red Meat/Refined Grain Diet | Dairy/Chicken/Nuts/Wholegrain Diet | p Value | p Group by Meal | Red Meat/Refined Grain Diet | Dairy/Chicken/Nuts/Wholegrain Diet | p Value | Red Meat/Refined Grain Diet | Dairy/Chicken/Nuts/Wholegrain Diet | p Value | |
| Fasting glucose (mmol/L) | 5.3, 0.9 | 5.3, 0.6 | 0.828 | NS | 5.2, 0.6 | 5.2, 0.8 | 0.59 | 5.4, 0.9 | 5.4, 0.6 | 0.99 |
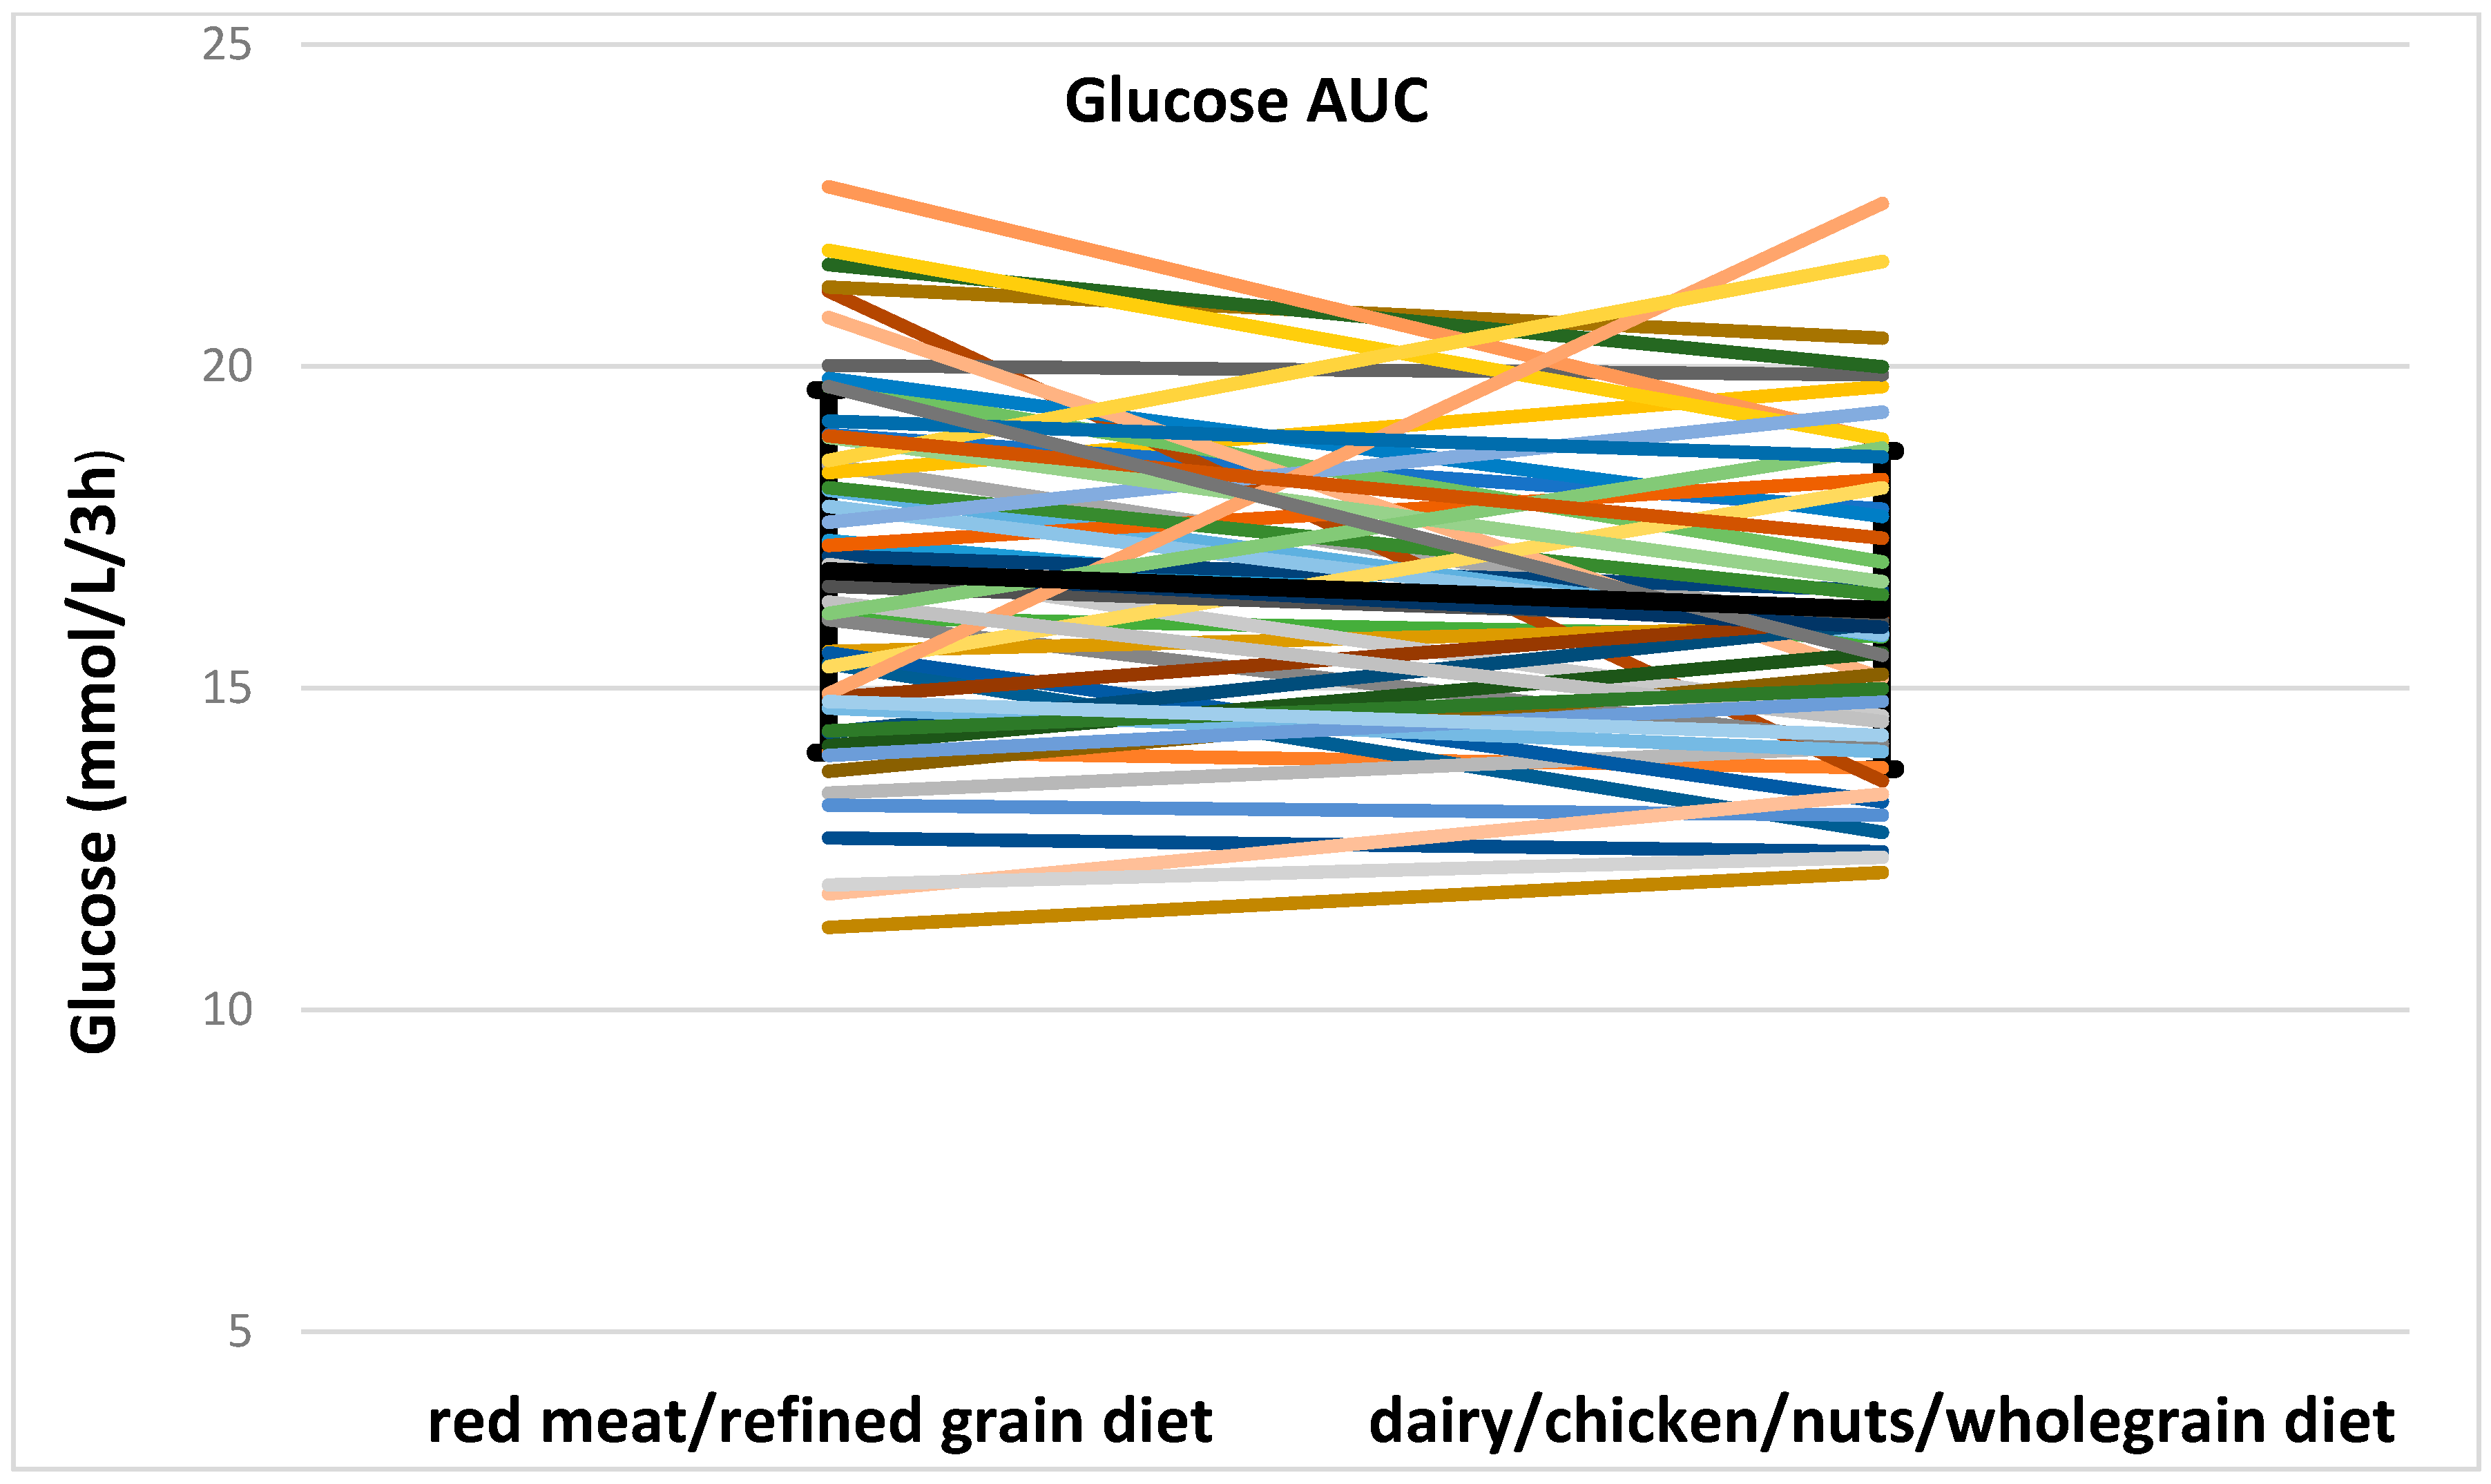
| Glucose AUC (mmol/L/3 h) | 16.8 ± 2.8 | 16.2 ± 2.5 | 0.077 | 0.047 | 16.5 ± 2.9 | 14.9 ± 2.0 | 0.017 | 17 ± 2.8 | 16.9 ± 2.4 | 0.7 |
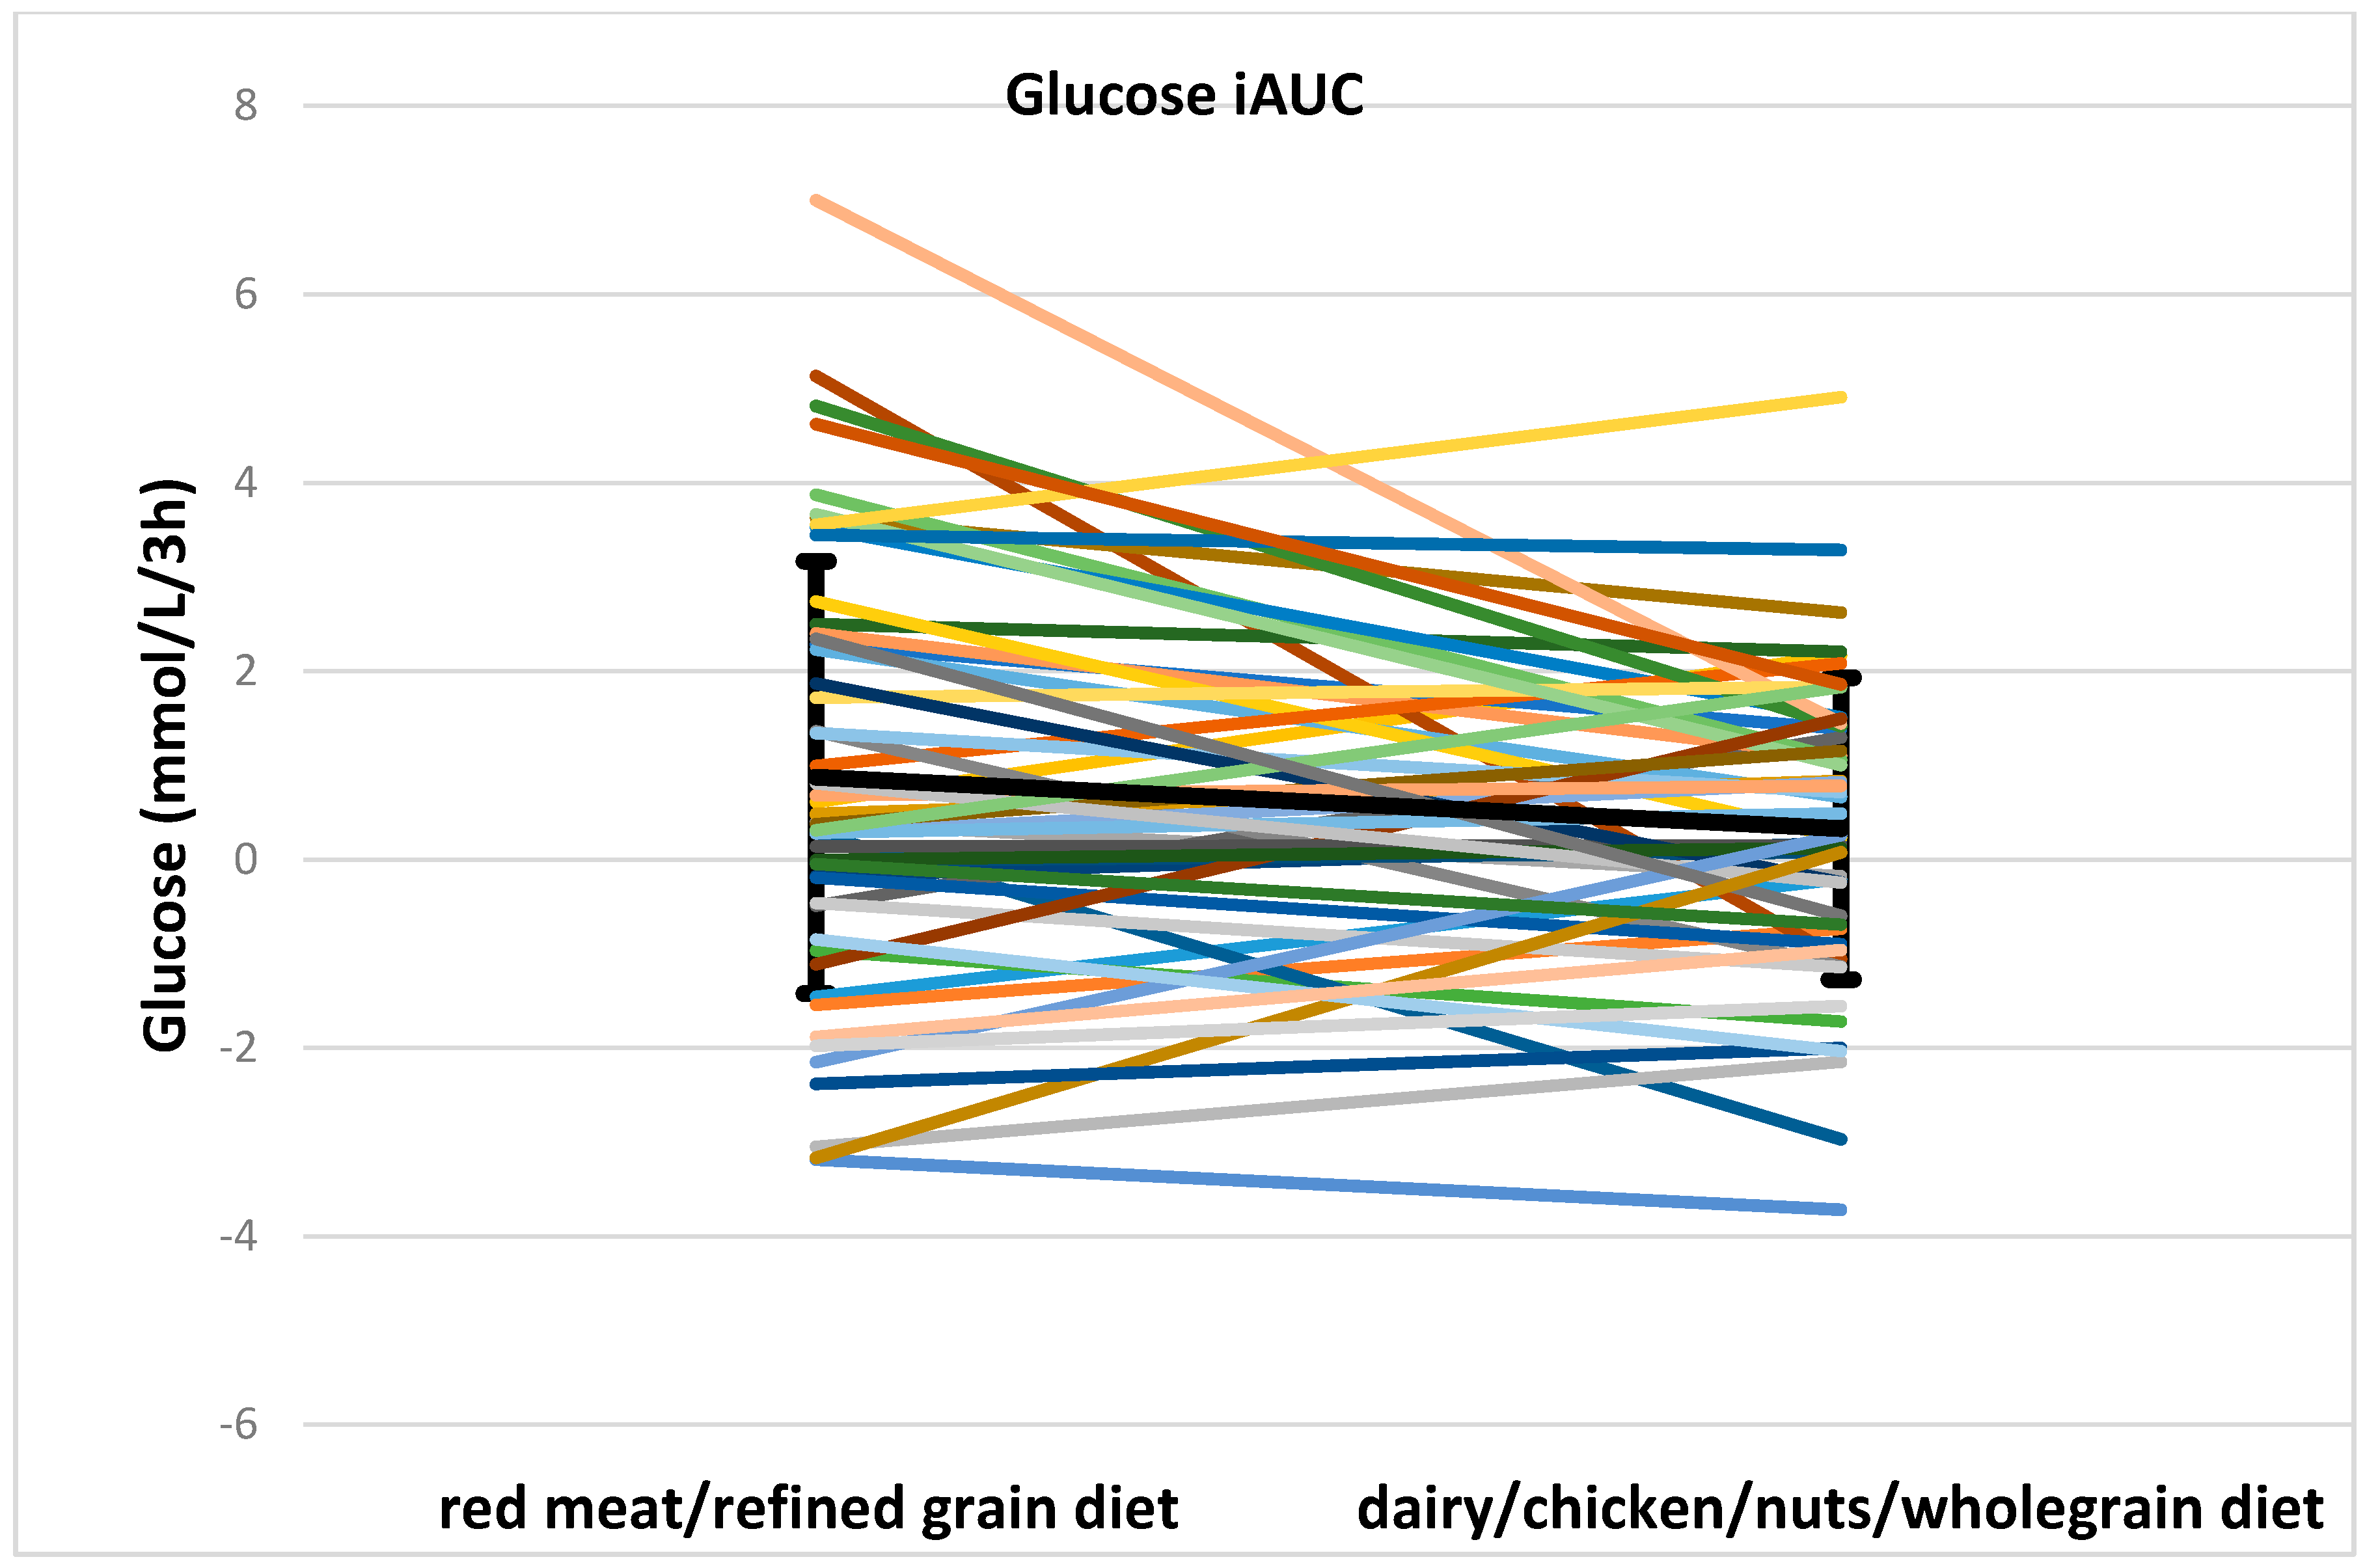
| Glucose iAUC (mmol/L/3 h) | 0.9 ± 2.3 | 0.3 ± 1.6 | 0.046 | 0.016 | 1.1 ± 2.9 | −0.3 ± 1.7 | 0.024 | 0.8 ± 1.9 | 0.7 ± 1.5 | 0.7 |
| Fasting insulin (mU/L) | 2.2, 1.9 | 2.2, 1.2 | 0.023 | NS | 2.1, 1.1 | 2.1, 0.88 | 0.78 | 2.5, 2.1 | 2.3, 1.4 | 0.012 |
| Insulin AUC (mU/L/3 h) | 94.4, 117 | 65.9, 74.3 | <0.001 | NS | 116.5, 169.5 | 65.9, 116.6 | 0.012 | 85.8, 129.4 | 62.1, 74.1 | 0.001 |
| Insulin iAUC (mU/L/3 h) | 79.7, 119.2 | 54.3, 71.9 | 0.001 | NS | 95.7, 120.7 | 54.3, 92.7 | 0.033 | 70.2, 134.7 | 50.8, 67.9 | 0.008 |
| C-peptide AUC (nmol/L/3 h) | 12.5 ± 5.8 | 10.2 ± 4.1 | 0.006 | NS | 10.9 ± 5.0 | 9.0 ± 4.2 | 0.075 | 13.3 ± 6.1 | 10.8 ± 4.1 | 0.03 |
| C-peptide iAUC (nmol/L/3 h) | 8.6, 6.5 | 6.4, 4.1 | 0.002 | NS | 6.7, 7.3 | 5.1, 4.6 | 0.112 | 7.9, 6.1 | 6.2, 3.1 | 0.014 |
| TG AUC (mU/L/3 h) | 2.3, 2.4 | 2.6, 1.8 | 0.172 | 0.013 | 2.0, 1.5 | 2.4, 2.1 | 0.008 | 2.8, 2.3 | 2.7, 1.7 | 0.78 |
| TG iAUC (mU/L/3 h) | −0.2, 0.5 | 0.0, 0.4 | <0.001 | NS | −0.2, 0.8 | 0.2, 0.5 | 0.004 | −0.2, 0.5 | 0.0, 0.4 | 0.001 |
© 2016 by the authors; licensee MDPI, Basel, Switzerland. This article is an open access article distributed under the terms and conditions of the Creative Commons Attribution (CC-BY) license (http://creativecommons.org/licenses/by/4.0/).
Share and Cite
Kim, Y.; Keogh, J.B.; Clifton, P.M. Differential Effects of Red Meat/Refined Grain Diet and Dairy/Chicken/Nuts/Whole Grain Diet on Glucose, Insulin and Triglyceride in a Randomized Crossover Study. Nutrients 2016, 8, 687. https://doi.org/10.3390/nu8110687
Kim Y, Keogh JB, Clifton PM. Differential Effects of Red Meat/Refined Grain Diet and Dairy/Chicken/Nuts/Whole Grain Diet on Glucose, Insulin and Triglyceride in a Randomized Crossover Study. Nutrients. 2016; 8(11):687. https://doi.org/10.3390/nu8110687
Chicago/Turabian StyleKim, Yoona, Jennifer B. Keogh, and Peter M. Clifton. 2016. "Differential Effects of Red Meat/Refined Grain Diet and Dairy/Chicken/Nuts/Whole Grain Diet on Glucose, Insulin and Triglyceride in a Randomized Crossover Study" Nutrients 8, no. 11: 687. https://doi.org/10.3390/nu8110687
APA StyleKim, Y., Keogh, J. B., & Clifton, P. M. (2016). Differential Effects of Red Meat/Refined Grain Diet and Dairy/Chicken/Nuts/Whole Grain Diet on Glucose, Insulin and Triglyceride in a Randomized Crossover Study. Nutrients, 8(11), 687. https://doi.org/10.3390/nu8110687