Is Hypovitaminosis D Associated with Stress Perception in the Elderly? A Nationwide Representative Study in Korea


 ,
,
Abstract
:1. Introduction
2. Materials and Methods
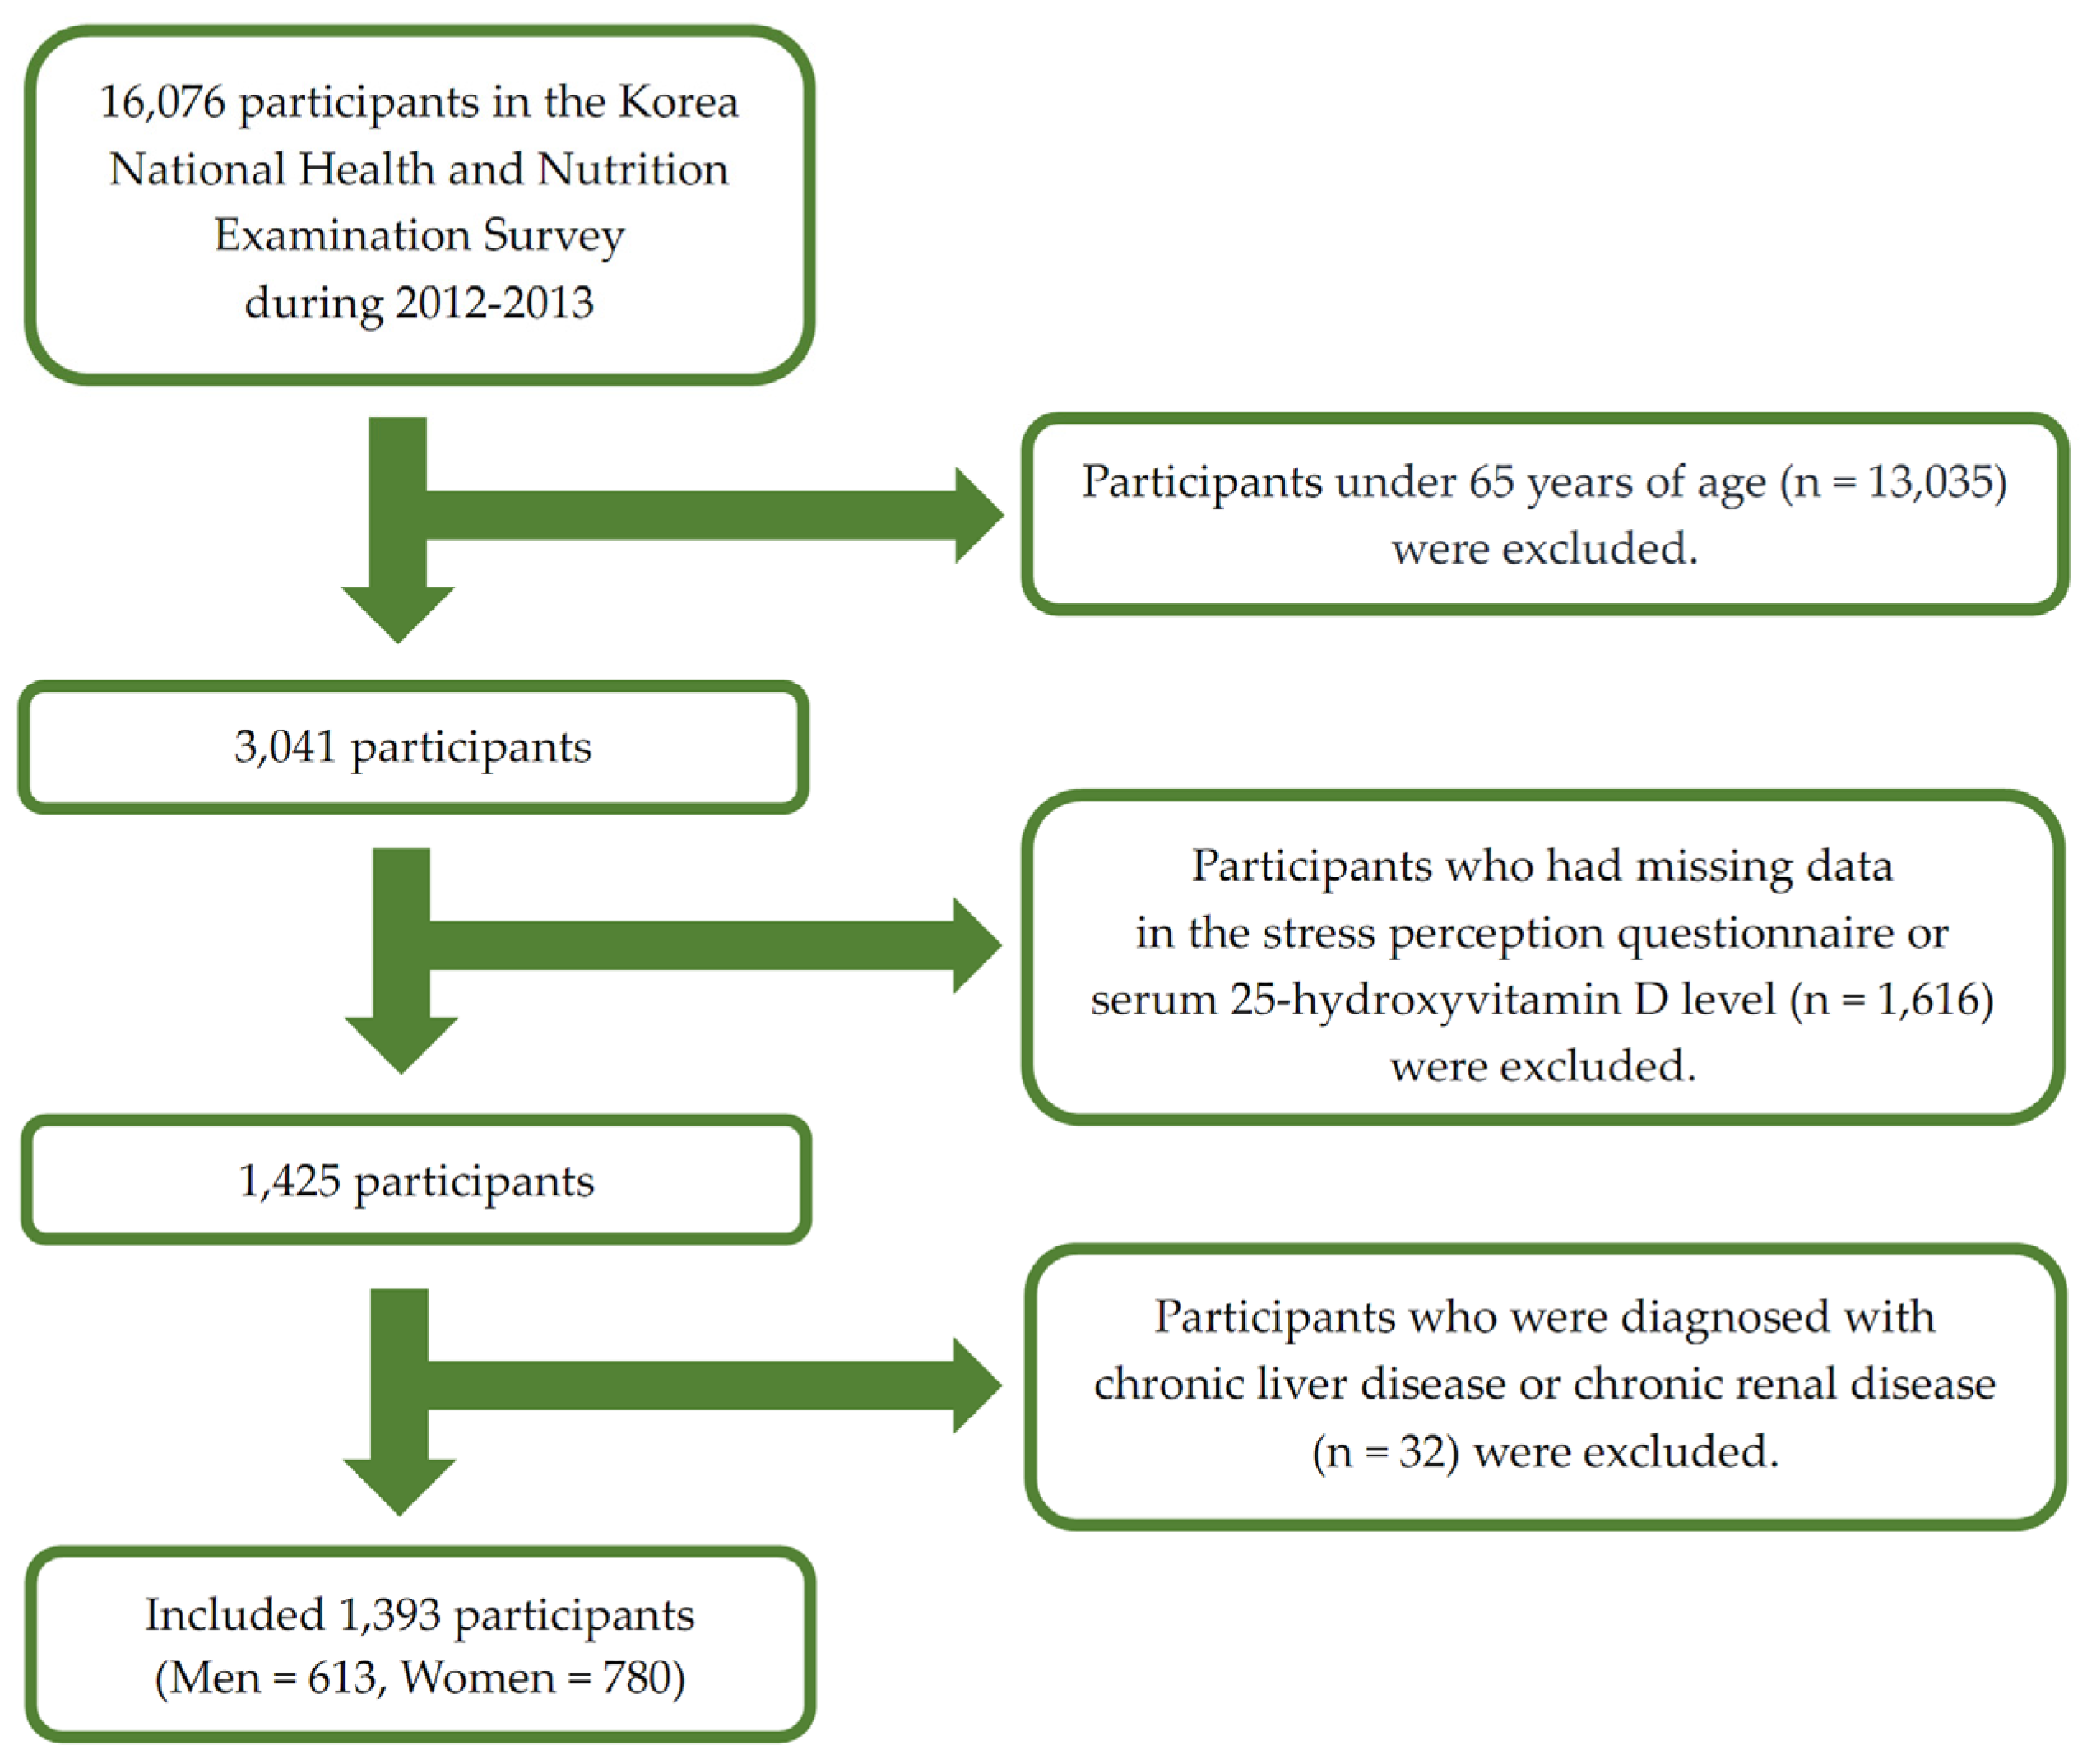
2.1. Study Population
2.2. General Characteristics of the Participants
2.3. Serum 25(OH)D Assessment
2.4. Perceived Stress Status
2.5. Statistical Analysis
3. Results
3.1. Participant Characteristics
3.2. Association between Hypovitaminosis D and Perceived Stress Status
4. Discussion
5. Conclusions
Acknowledgments
Author Contributions
Conflicts of Interest
References
- Van der Wielen, R.P.; Löwik, M.R.; van den Berg, H.; de Groot, L.C.; Haller, J.; Moreiras, O.; van Staveren, W.A. Serum vitamin D concentrations among elderly people in Europe. Lancet 1995, 346, 207–210. [Google Scholar] [CrossRef]
- Bischoff-Ferrari, H.A.; Willett, W.C.; Wong, J.B.; Giovannucci, E.; Dietrich, T.; Dawson-Hughes, B. Fracture prevention with vitamin D supplementation: A meta-analysis of randomized controlled trials. JAMA 2005, 293, 2257–2264. [Google Scholar] [CrossRef] [PubMed]
- Houston, D.K.; Cesari, M.; Ferrucci, L.; Cherubini, A.; Maggio, D.; Bartali, B.; Johnson, M.A.; Schwartz, G.G.; Kritchevsky, S.B. Association between vitamin D status and physical performance: The InCHIANTI study. J Gerontol. A Biol. Sci. Med. Sci. 2007, 62, 440–446. [Google Scholar] [CrossRef] [PubMed]
- Visser, M.; Deeg, D.J.; Lips, P. Longitudinal Aging Study Amsterdam. Low vitamin D and high parathyroid hormone levels as determinants of loss of muscle strength and muscle mass (sarcopenia): The Longitudinal Aging Study Amsterdam. J. Clin. Endocrinol. Metab. 2003, 88, 5766–5772. [Google Scholar] [CrossRef] [PubMed]
- Hicks, G.E.; Shardell, M.; Miller, R.R.; Bandinelli, S.; Guralnik, J.; Cherubini, A.; Lauretani, F.; Ferrucci, L. Associations between vitamin D status and pain in older adults: The Invecchiare in Chianti study. J. Am. Geriatr. Soc. 2008, 56, 785–791. [Google Scholar] [CrossRef] [PubMed]
- Visser, M.; Deeg, D.J.; Puts, M.T.; Seidell, J.C.; Lips, P. Low serum concentrations of 25-hydroxyvitamin D in older persons and the risk of nursing home admission. Am. J. Clin. Nutr. 2006, 84, 616–622. [Google Scholar] [PubMed]
- Autier, P.; Gandini, S. Vitamin D supplementation and total mortality: A meta-analysis of randomized controlled trials. Arch. Intern. Med. 2007, 167, 1730–1737. [Google Scholar] [CrossRef] [PubMed]
- Holick, M.F. Sunlight and vitamin D for bone health and prevention of autoimmune diseases, cancers, and cardiovascular disease. Am. J. Clin. Nutr. 2004, 80, 1678S–1688S. [Google Scholar] [PubMed]
- Fernandes de Abreu, D.A.; Eyles, D.; Fѐron, F. Vitamin D, a neuro-immunomodulator: Implications for neurodegenerative and autoimmune diseases. Psychoneuroendocrinology 2009, 34, S265–S277. [Google Scholar] [CrossRef] [PubMed]
- McCann, J.C.; Ames, B.N. Is there convincing biological or behavioral evidence linking vitamin D deficiency to brain dysfunction? FASEB J. 2008, 22, 982–1001. [Google Scholar] [CrossRef] [PubMed]
- Pardridge, W.M.; Sakiyama, R.; Coty, W.A. Restricted transport of vitamin D and A derivatives through the rat blood-brain barrier. J. Neurochem. 1985, 44, 1138–1141. [Google Scholar] [CrossRef] [PubMed]
- Kesby, J.P.; Eyles, D.W.; Burne, T.H.; McGrath, J.J. The effects of vitamin D on brain development and adult brain function. Mol. Cell. Endocrinol. 2011, 347, 121–127. [Google Scholar] [CrossRef] [PubMed]
- Chung, H.K.; Cho, Y.; Choi, S.; Shin, M.J. The association between serum 25-hydroxyvitamin D concentrations and depressive symptoms in Korean adults: Findings from the fifth Korea National Health and Nutrition Examination Survey 2010. PLoS ONE 2014, 9, e99185. [Google Scholar] [CrossRef] [PubMed]
- Mizoue, T.; Kochi, T.; Akter, S.; Eguchi, M.; Kurotani, K.; Tsuruoka, H.; Kuwahara, K.; Ito, R.; Kabe, I.; Nanri, A. Low serum 25-hydroxyvitamin D concentrations are associated with increased likelihood of having depressive symptoms among Japanese workers. J. Nutr. 2015, 145, 541–546. [Google Scholar] [CrossRef] [PubMed]
- Williams, J.A.; Sink, K.M.; Tooze, J.A.; Atkinson, H.H.; Cauley, J.A.; Yaffe, K.; Tylavsky, F.A.; Rubin, S.M.; Simonsick, E.M.; Kritchevsky, S.B.; et al. Low 25-hydroxyvitamin D concentrations predict incident depression in well-functioning older adults: The health, aging, and body composition study. J. Gerontol. Ser. A Biol. Sci. Med. Sci. 2015, 70, 757–763. [Google Scholar] [CrossRef] [PubMed]
- Jääskeläinen, T.; Knekt, P.; Suvisaari, J.; Männistὂ, S.; Partonen, T.; Sääksjärvi, K.; Kaartinen, N.E.; Kanerva, N.; Lindfors, O. Higher serum 25-hydroxyvitamin D concentrations are related to a reduced risk of depression. Br. J. Nutr. 2015, 113, 1418–1426. [Google Scholar] [CrossRef] [PubMed]
- Jorde, R.; Waterloo, K.; Saleh, F.; Haug, E.; Svartberg, J. Neuropsychological function in relation to serum parathyroid hormone and serum 25-hydroxyvitamin D levels. The Tromso study. J. Neurol. 2006, 253, 464–470. [Google Scholar] [CrossRef] [PubMed]
- Berk, M.; Sanders, K.M.; Pasco, J.A.; Jacka, F.N.; Williams, L.J.; Hayles, A.L.; Dodd, S. Vitamin D deficiency may play a role in depression. Med. Hypotheses 2007, 69, 1316–1319. [Google Scholar] [CrossRef] [PubMed]
- Annweiler, C.; Schott, A.M.; Allali, G.; Bridenbaugh, S.A.; Kressig, R.W.; Allain, P.; Herrmann, F.R.; Beauchet, O. Association of vitamin D deficiency with cognitive impairment in older women: Cross-sectional study. Neurology 2010, 74, 27–32. [Google Scholar] [CrossRef] [PubMed]
- Lee, H.B.; Chiu, H.F.K.; Kwok, W.Y.; Leung, C.M.; Kwong, P.K.; Chung, D.W.S. Chinese elderly and the GDS short form: A preliminary study. Clin. Gerontol. 1993, 14, 37–42. [Google Scholar]
- Wilkins, C.H.; Sheline, Y.I.; Roe, C.M.; Birge, S.J.; Morris, J.C. Vitamin D deficiency is associated with low mood and worse cognitive performance in older adults. Am. J. Geriatr. Psychiatry 2006, 14, 1032–1040. [Google Scholar] [CrossRef] [PubMed]
- Wilkins, C.H.; Birge, S.J.; Sheline, Y.I.; Morris, J.C. Vitamin D deficiency is associated with worse cognitive performance and lower bone density in older African Americans. J. Natl. Med. Assoc. 2009, 101, 349–354. [Google Scholar] [CrossRef]
- Llewellyn, D.J.; Lang, I.A.; Langa, K.M.; Muniz-Terrera, G.; Philips, C.L.; Cherubini, A.; Ferrucci, L.; Melzer, D. Vitamin D and risk of cognitive decline in elderly persons. Arch. Intern. Med. 2010, 170, 1135–1141. [Google Scholar] [CrossRef] [PubMed]
- The Korean Academy of Family Medicine. Textbook of Family Medicine, 4th ed.; The Korean Academy of Family Medicine: Seoul, Korea, 2013. [Google Scholar]
- Shin, H.C. Measuring stress with questionnaires. J. Korean Med. Assoc. 2013, 56, 485–495. [Google Scholar] [CrossRef]
- Song, T.M.; Song, J.; An, J.Y.; Hayman, L.L.; Woo, J.M. Psychological and social factors affecting Internet searches on suicide in Korea: A big data analysis of Google search trends. Yonsei Med. J. 2014, 55, 254–263. [Google Scholar] [CrossRef] [PubMed]
- Lim, M.; Kim, S.W.; Nam, Y.Y.; Moon, E.; Yu, J.; Lee, S.; Chang, J.S.; Jhoo, J.H.; Cha, B.; Choi, J.S.; et al. Reasons for desiring death: Examining causative factors of suicide attempters treated in emergency rooms in Korea. J. Affect. Disord. 2014, 168, 349–356. [Google Scholar] [CrossRef] [PubMed]
- Song, T.M.; An, J.Y.; Hayman, L.L.; Woo, J.M.; Yom, Y.H. Stress, depression, and lifestyle behaviors in Korean adults: A latent means and multi-group analysis on the Korea health panel data. Behav. Med. 2016, 42, 72–81. [Google Scholar] [CrossRef] [PubMed]
- Baltes, P.B.; Mayer, K.V. The Berlin Aging Study: Aging from 70 to100; Cambridge University Press: New York, NY, USA, 1999; pp. 154–196. [Google Scholar]
- Chu, S.K.; Yoo, J.H. The effects of perceived stress on cognition in the community elderly. J. Korean Acad. Community Health Nurs. 2008, 19, 369–382. [Google Scholar]
- Miller, A.H.; Maletic, V.; Raison, C.L. Inflammation and its discontents: The role of cytokines in the pathophysiology of major depression. Biol. Psychiatr. 2009, 65, 732–741. [Google Scholar] [CrossRef] [PubMed]
- Bergdahl, J.; Bergdahl, M. Perceived stress in adults: Prevalence and association of depression, anxiety and medication in a Swedish population. Stress Health 2002, 18, 235–241. [Google Scholar] [CrossRef]
- Hewitt, P.L.; Flett, G.L.; Mosher, S.W. The perceived stress scale: Factor structure and relation to depression symptoms in a psychiatric sample. J. Psychopathol. Behav. Assess. 1992, 14, 247–257. [Google Scholar] [CrossRef]
- Institute of Medicine Food and Nutrition Board. Dietary Reference Intakes for Calcium and Vitamin D; National Academy Press: Washington, DC, USA, 2011. [Google Scholar]
- Kweon, S.; Kim, Y.; Jang, M.-J.; Kim, Y.; Kim, K.; Choi, S.; Chun, C.; Khang, Y.-H.; Oh, K. Data resource profile: The Korea National Health and Nutrition Examination Survey (KNHANES). Int. J. Epidemiol. 2014, 43, 69–77. [Google Scholar] [CrossRef] [PubMed]
- Chan, R.; Chan, D.; Woo, J.; Ohlsson, C.; Mellström, D.; Kwok, T.; Leung, P. Association between serum 25-hydroxyvitamin D and psychological health in older Chinese men in a cohort study. J. Affect. Disord. 2011, 130, 251–259. [Google Scholar] [CrossRef] [PubMed]
- Zhao, G.; Ford, E.S.; Li, C.; Balluz, L.S. No associations between serum concentrations of 25-hydroxyvitamin D and parathyroid hormone and depression among US adults. Br. J. Nutr. 2010, 104, 1696–1702. [Google Scholar] [CrossRef] [PubMed]
- Pan, A.; Lu, L.; Franco, O.H.; Yu, Z.; Li, H.; Lin, X. Association between depressive symptoms and 25-hydroxyvitamin D in middle-aged and elderly Chinese. J. Affect. Disord. 2009, 118, 240–243. [Google Scholar] [CrossRef] [PubMed]
- Nanri, A.; Mizoue, T.; Matsushita, Y.; Poudel-Tandukar, K.; Sato, M.; Ohta, M.; Mishima, N. Association between serum 25-hydroxyvitamin D and depressive symptoms in Japanese: Analysis by survey season. Eur. J. Clin. Nutr. 2009, 63, 1444–1447. [Google Scholar] [CrossRef] [PubMed]
- McGrath, J.; Scragg, R.; Chant, D.; Eyles, D.; Burne, T.; Obradovic, D. No association between serum 25-hydroxyvitamin D3 level and performance on psychometric tests in NHANES III. Neuroepidemiology 2007, 29, 49–54. [Google Scholar] [CrossRef] [PubMed]
- Alexopoulos, G.S. Depression in the elderly. Lancet 2005, 365, 1961–1970. [Google Scholar] [CrossRef]
- Eyles, D.W.; Smith, S.; Kinobe, R.; Hewison, M.; McGrath, J.J. Distribution of the vitamin D receptor and 1α-hydroxylase in human brain. J. Chem. Neuroanat. 2005, 29, 21–30. [Google Scholar] [CrossRef] [PubMed]
- Eyles, D.; Brown, J.; Mackay-Sim, A.; McGrath, J.; Feron, F. Vitamin D3 and brain development. Neuroscience 2003, 118, 641–653. [Google Scholar] [CrossRef]
- Langub, M.C.; Herman, J.P.; Malluche, H.H.; Koszewski, N.J. Evidence of functional vitamin D receptors in rat hippocampus. Neuroscience 2001, 104, 49–56. [Google Scholar] [CrossRef]
- Camfield, D.A.; Wetherell, M.A.; Scholey, A.B.; Cox, K.H.; Fogg, E.; White, D.J.; Sarris, J.; Kras, M.; Stough, C.; Sali, A.; et al. The Effects of multivitamin supplementation on diurnal cortisol secretion and perceived stress. Nutrients 2013, 5, 4429–4450. [Google Scholar] [CrossRef] [PubMed]
- Tak, Y.J.; Lee, J.G.; Kim, Y.J.; Lee, S.Y.; Cho, B.M. 25-hydroxyvitamin D and its relationship with autonomic dysfunction using time- and frequency-domain parameters of heart rate variability in Korean populations: A cross-sectional study. Nutrients 2014, 6, 4373–4388. [Google Scholar] [CrossRef] [PubMed]
- Herman, J.P.; Cullinan, W.E. Neurocircuitry of stress: Central control of the hypothalamo-pituitary-adrenocortical axis. Trends Neurosci. 1997, 20, 78–84. [Google Scholar] [CrossRef]
- Jacobson, L.; Sapolsky, R. The role of the hippocampus in feedback regulation of the hypothalamic-pituitary-adrenocortical axis. Endocr. Rev. 1991, 12, 118–134. [Google Scholar] [CrossRef] [PubMed]
- Siiteri, P.K.; Murai, J.T.; Hammond, G.L.; Nisker, J.A.; Raymoure, W.J.; Kuhn, R.W. The serum transport of steroid hormones. Recent Prog. Horm. Res. 1982, 38, 457–510. [Google Scholar] [PubMed]
- Dore, S.; Kar, S.; Rowe, W.; Quirion, R. Distribution and levels of [125I]IGF-I, [125I]IGF-II and [125I]insulin receptor binding sites in the hippocampus of aged memory-unimpaired and -impaired rats. Neuroscience 1997, 80, 1033–1040. [Google Scholar] [CrossRef]
- Donahue, C.P.; Kosik, K.S.; Shors, T.J. Growth hormone is produced within the hippocampus where it responds to age, sex, stress. Proc. Natl. Acad. Sci. USA 2006, 103, 6031–6036. [Google Scholar] [CrossRef] [PubMed]
- Nashold, F.E.; Spach, K.M.; Spanier, J.A.; Hayes, C.E. Estrogen controls vitamin D3-mediated resistance to experimental autoimmune encephalomyelitis by controlling vitamin D3 metabolism and receptor expression. J. Immunol. 2009, 183, 3672–3681. [Google Scholar] [CrossRef] [PubMed]
- Correale, J.; Ysrraelit, M.C.; Gaitán, M.I. Gender differences in 1,25 dihydroxyvitamin D3 immunomodulatory effects in multiple sclerosis patients and healthy subjects. J. Immunol. 2010, 185, 4948–4958. [Google Scholar] [CrossRef] [PubMed]
- Verdoia, M.; Schaffer, A.; Barbieri, L.; Di Giovine, G.; Marino, P.; Suryapranata, H.; De Luca, G. Impact of gender difference on vitamin D status and its relationship with the extent of coronary artery disease. Nutr. Metab. Cardiovasc. Dis. 2015, 25, 464–470. [Google Scholar] [CrossRef] [PubMed]
- Kim, H.J. Reliability and validity of the 4-item version of the Korean perceived stress scale. Res. Nurs. Health 2016. [Google Scholar] [CrossRef] [PubMed]
- Young, S.N. Has the time come for clinical trials on the antidepressant effect of vitamin D? J. Psychiatr. Neurosci. 2009, 34, 3. [Google Scholar]
- Van Dam, R.M.; Snijder, M.B.; Dekker, J.M.; Stehouwer, C.D.; Bouter, L.M.; Heine, R.J.; Lips, P. Potentially modifiable determinants of vitamin D status in an older population in The Netherlands: The Hoorn Study. Am. J. Clin. Nutr. 2007, 85, 755–761. [Google Scholar] [PubMed]


| Variables | Total (n = 1393) | Men (n = 613) | Women (n = 780) | p-Value | Effect Size |
|---|---|---|---|---|---|
| Age (years) | 71.35 ± 0.19 | 70.86 ± 0.23 | 71.75 ± 0.24 | 0.003 | 0.001 |
| Body mass index (kg/m2) | 24.05 ± 0.11 | 23.49 ± 0.14 | 24.49 ± 0.15 | <0.001 | 0.024 |
| Waist circumference (cm) | 84.06 ± 0.33 | 85.09 ± 0.42 | 83.22 ± 0.43 | 0.001 | 0.012 |
| Low household income | 77.7 ± 1.7 (1052) | 72.9 ± 2.5 (443) | 81.5 ± 1.7 (609) | <0.001 | 0.69 |
| Urban residence | 79.9 ± 3.7 (962) | 72.5 ± 3.7 (437) | 67.9 ± 4.1 (525) | 0.056 | 0.051 |
| Current smoker | 12.3 ± 1.0 (164) | 23.1 ± 1.9 (141) | 3.6 ± 0.8 (23) | <0.001 | 0.323 |
| Alcohol drinker | 38.2 ± 1.6 (516) | 60.7 ± 2.4 (364) | 19.9 ± 1.7 (152) | <0.001 | 0.413 |
| Regular exercise | 40.6 ± 1.6 (576) | 48.7 ± 2.4 (306) | 34.1 ± 2.1 (270) | <0.001 | 0.153 |
| Alone at home | 16.8 ± 1.1 (271) | 6.9 ± 1.1 (47) | 24.8 ± 1.7 (224) | <0.001 | 0.263 |
| Hypertension | 87.0 ± 1.2 (740) | 82.6 ± 2.1 (287) | 90.4 ± 1.4 (453) | 0.002 | 0.107 |
| Diabetes mellitus | 55.8 ± 2.7 (244) | 49.1 ± 4.2 (112) | 62.4 ± 3.4 (132) | 0.019 | 0.070 |
| Dyslipidemia | 65.0 ± 2.5 (310) | 52.8 ± 4.2 (103) | 74.4 ± 2.8 (207) | <0.001 | 0.201 |
| Energy intake (kJ/day) | 7096 ± 114.72 | 8267 ± 155.72 | 6150 ± 114.13 | <0.001 | 0.104 |
| Sleep duration (h/day) | 6.79 ± 0.23 | 6.94 ± 0.12 | 6.68 ± 0.36 | 0.423 | 0.001 |
| 25-Hydroxyvitamin D (nmol/L) | 46.65 ± 0.72 | 47.90 ± 0.85 | 45.64 ± 0.92 | 0.032 | 0.004 |
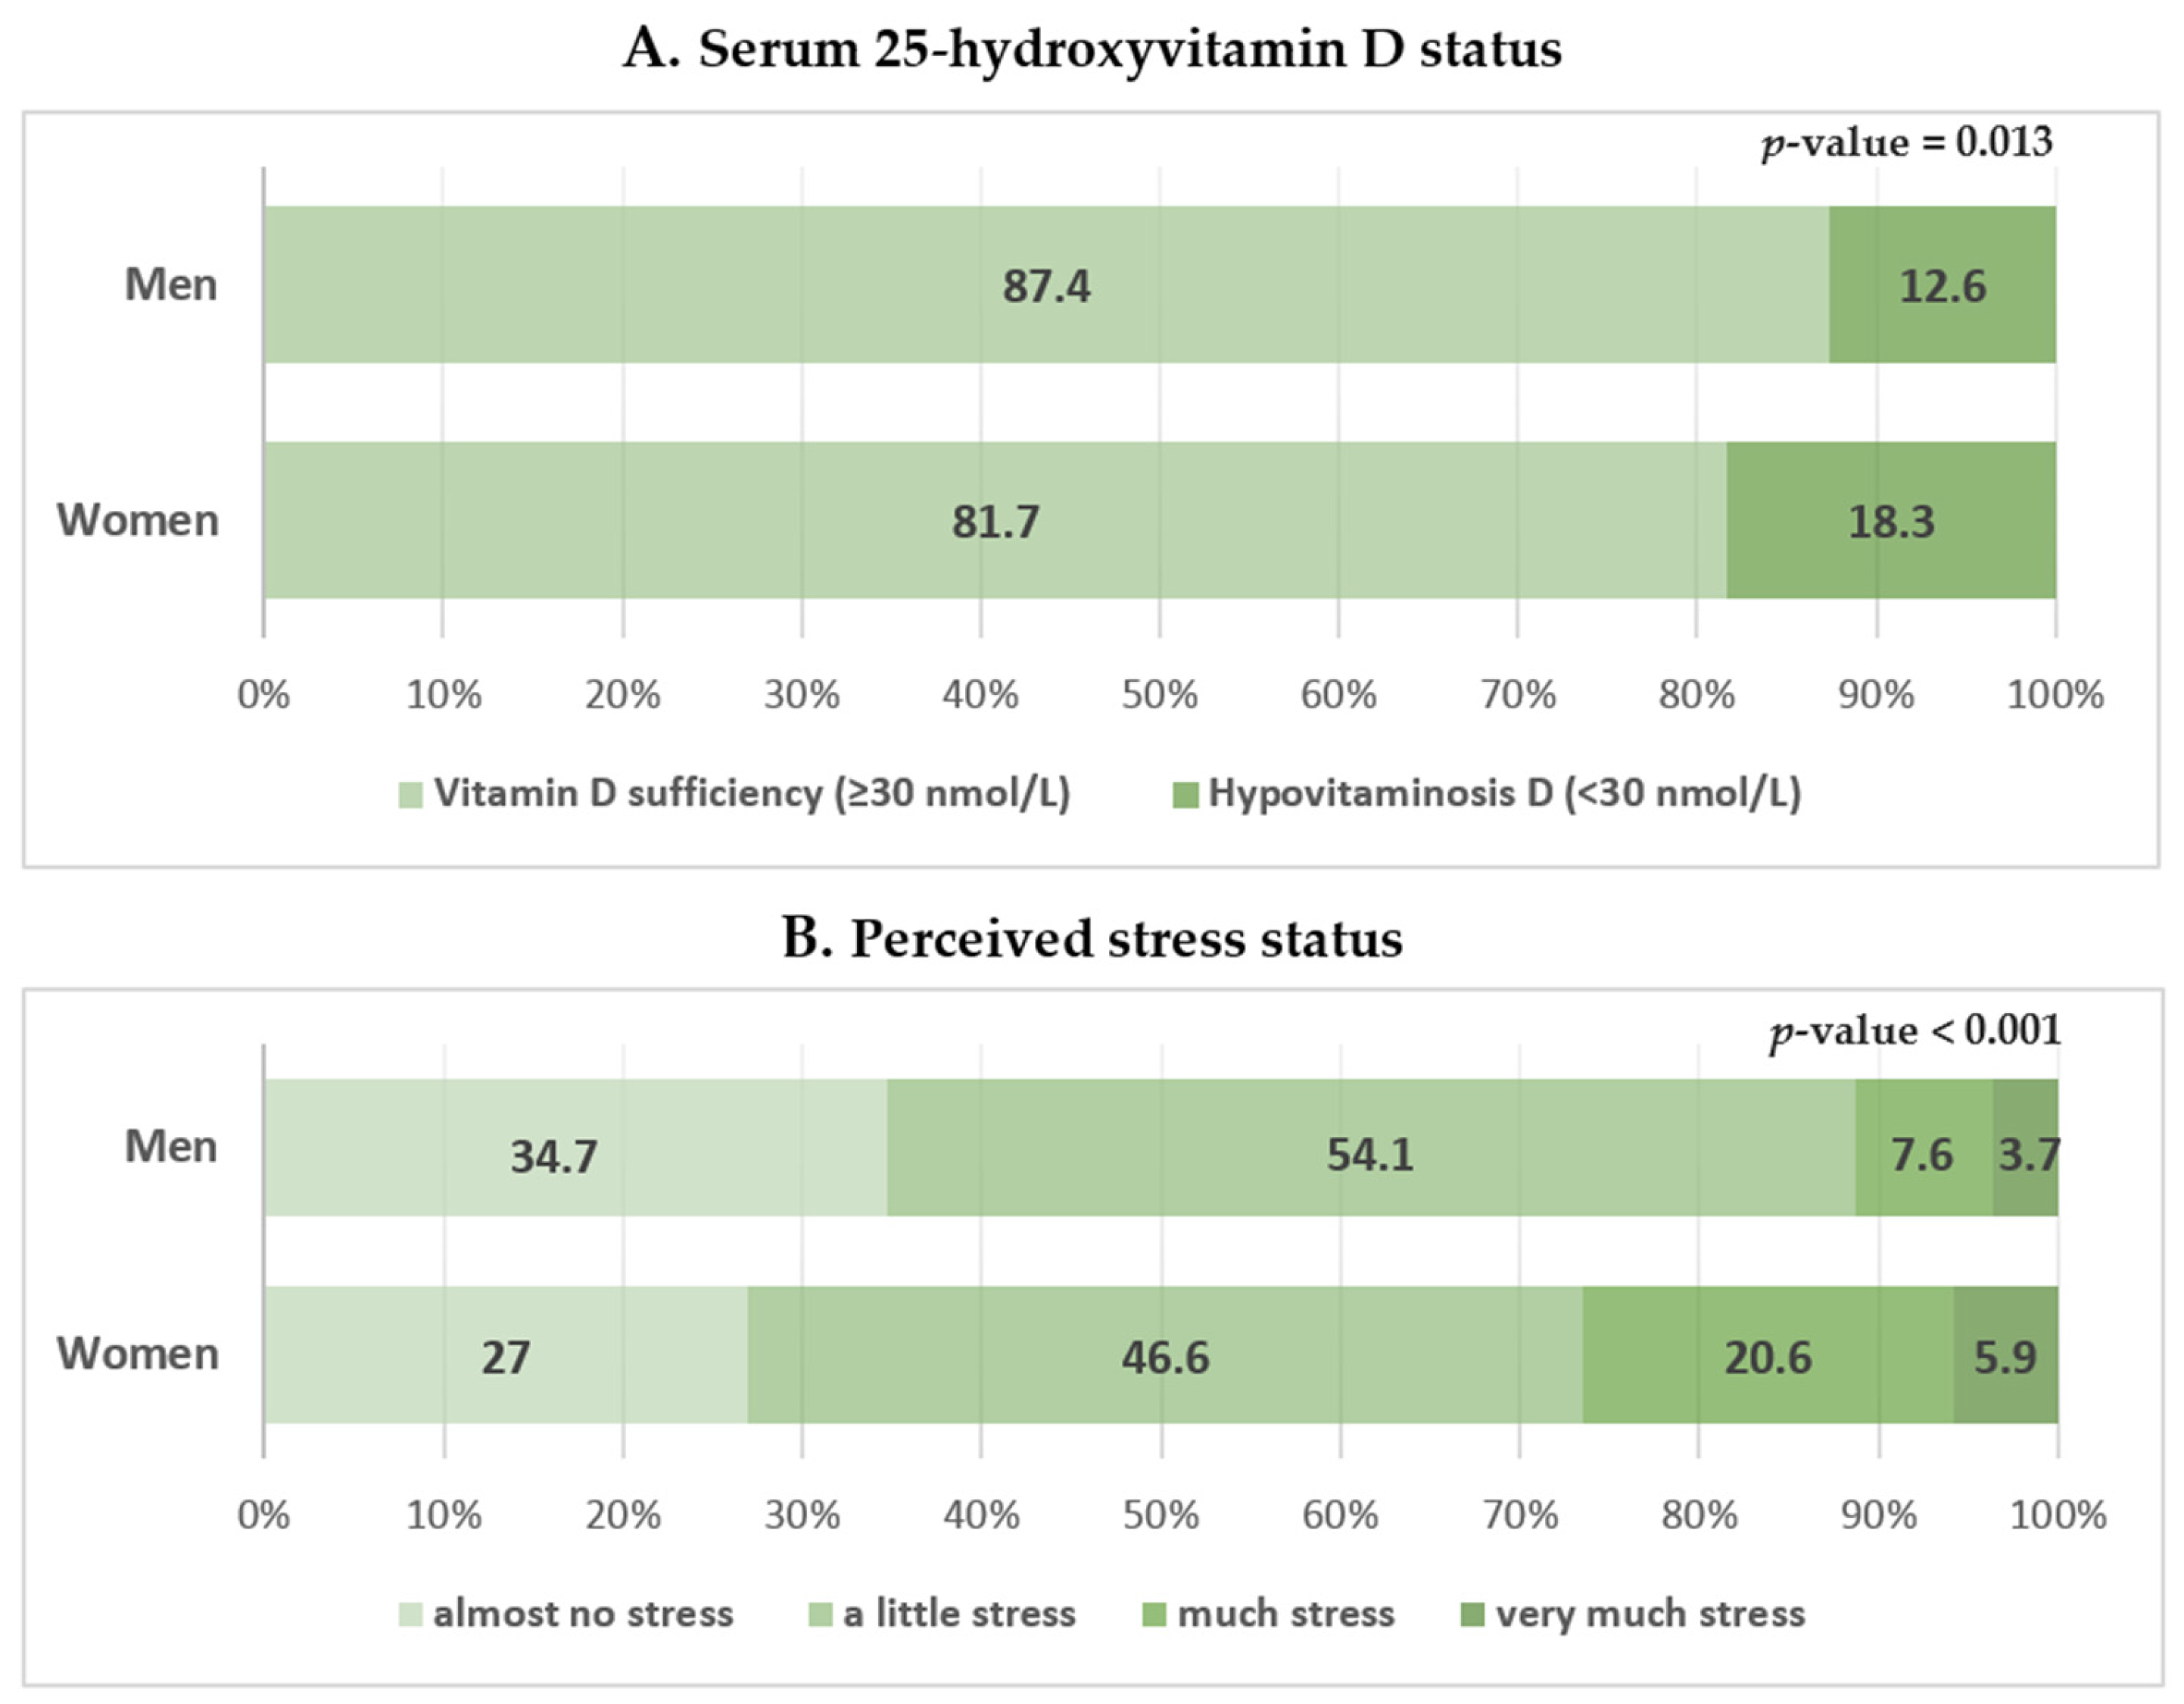
| Hypovitaminosis D * | 15.8 ± 1.4 (207) | 12.6 ± 1.8 (69) | 18.3 ± 1.7 (138) | 0.013 | 0.096 |
| High stress † | 19.6 ± 1.4 (278) | 11.2 ± 1.5 (74) | 26.4 ± 2.1 (204) | <0.001 | 0.177 |
| Variables | Vitamin D Sufficiency * (n = 544) | Hypovitaminosis D * (n = 69) | p-Value | Effect Size |
|---|---|---|---|---|
| Age (years) | 70.78 ± 0.24 | 71.42 ± 0.54 | 0.272 | 0.001 |
| Body mass index (kg/m2) | 23.42 ± 0.14 | 24.04 ± 0.36 | 0.096 | 0.004 |
| Waist circumference (cm) | 84.83 ± 0.44 | 86.87 ± 1.13 | 0.088 | 0.006 |
| Low household income | 72.9 ± 2.6 (393) | 72.5 ± 6.0 (50) | 0.940 | 0.003 |
| Urban residence | 70.3 ± 4.0 (378) | 88.0 ± 4.4 (59) | 0.007 | 0.108 |
| Current smoker | 21.4 ± 2.0 (121) | 34.9 ± 6.6 (20) | 0.034 | 0.033 |
| Alcohol drinker | 60.0 ± 2.6 (319) | 65.3 ± 6.3 (45) | 0.472 | 0.028 |
| Regular exercise | 50.0 ± 2.5 (264) | 60.6 ± 5.6 (43) | 0.086 | 0.074 |
| Alone at home | 6.5 ± 1.1 (39) | 9.6 ± 3.7 (8) | 0.359 | 0.048 |
| Hypertension | 83.5 ± 2.0 (255) | 76.9 ± 6.4 (32) | 0.301 | 0.069 |
| Diabetes mellitus | 48.0 ± 4.0 (94) | 55.4 ± 9.6 (18) | 0.476 | 0.043 |
| Dyslipidemia | 53.0 ± 4.2 (90) | 51.5 ± 10.6 (13) | 0.889 | 0.039 |
| Energy intake (kJ/day) | 8363 ± 172.84 | 4941 ± 309.11 | 0.028 | 0.009 |
| Sleep duration (h/day) | 6.93 ± 0.10 | 7.01 ± 0.66 | 0.903 | 0.006 |
| 25-Hydroxyvitamin D (nmol/L) | 51.17 ± 0.72 | 24.38 ± 0.70 | <0.001 | 0.295 |
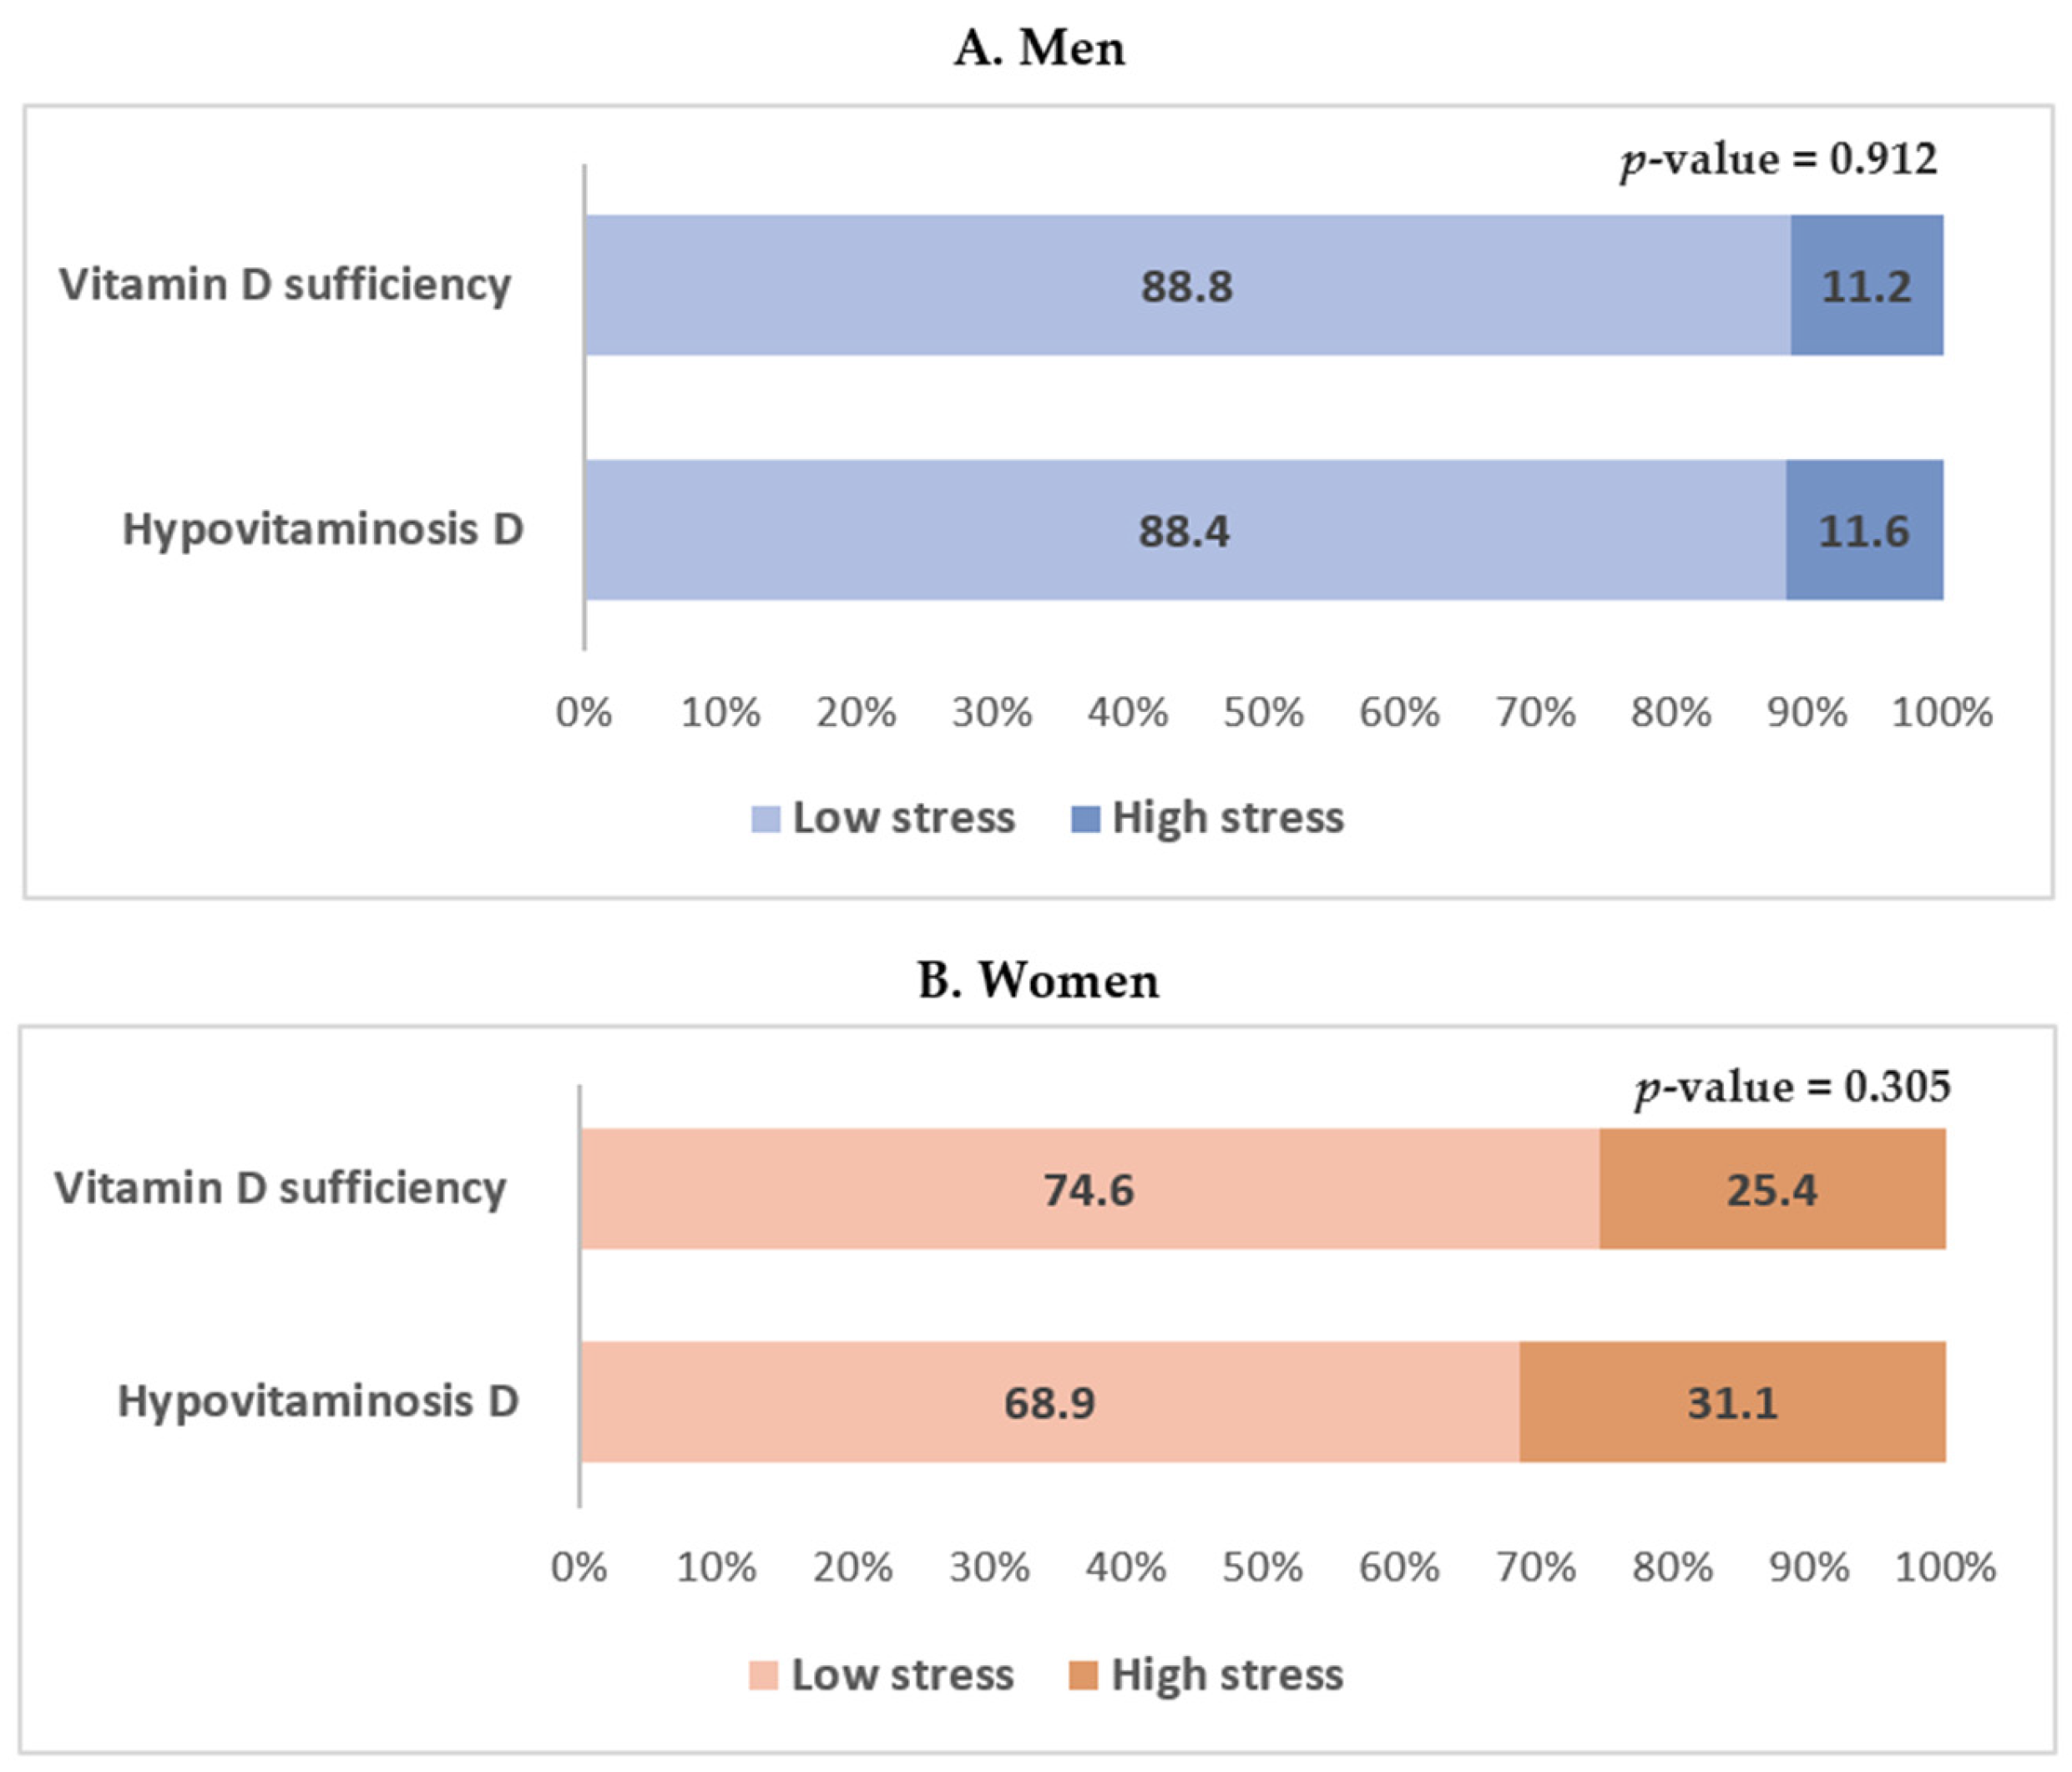
| High stress † | 11.2 ± 1.7 (63) | 11.6 ± 3.7 (11) | 0.912 | 0.036 |
| Variables | Vitamin D Sufficiency * (n = 642) | Hypovitaminosis D * (n = 138) | p-Value | Effect Size |
|---|---|---|---|---|
| Age (years) | 71.99 ± 0.25 | 70.69 ± 0.56 | <0.001 | 0.003 |
| Body mass index (kg/m2) | 24.37 ± 0.17 | 25.02 ± 0.35 | 0.111 | 0.001 |
| Waist circumference (cm) | 83.03 ± 0.48 | 84.08 ± 0.88 | 0.277 | 0.000 |
| Low household income | 81.8 ± 1.9 (501) | 80.2 ± 3.8 (108) | 0.708 | 0.012 |
| Urban residence | 66.3 ± 4.2 (417) | 75.1 ± 6.0 (108) | 0.141 | 0.120 |
| Current smoker | 3.6 ± 0.9 (18) | 3.9 ± 1.8 (53) | 0.877 | 0.017 |
| Alcohol drinker | 20.1 ± 1.9 (126) | 19.3 ± 4.2 (26) | 0.868 | 0.010 |
| Regular exercise | 64.4 ± 2.4 (415) | 72.7 ± 4.7 (94) | 0.142 | 0.026 |
| Alone in home | 26.2 ± 1.9 (192) | 18.3 ± 3.6 (32) | 0.074 | 0.054 |
| Hypertension | 90.1 ± 1.3 (370) | 91.6 ± 2.8 (83) | 0.638 | 0.010 |
| Diabetes mellitus | 63.8 ± 3.6 (110) | 56.8 ± 8.6 (22) | 0.476 | 0.041 |
| Dyslipidemia | 74.9 ± 2.8 (160) | 73.0 ± 6.3 (47) | 0.783 | 0.013 |
| Energy intake (kJ/day) | 6163 ± 130.58 | 6091 ± 183.59 | 0.748 | 0.000 |
| Sleep duration (h/day) | 6.49 ± 0.32 | 7.53 ± 1.35 | 0.454 | 0.000 |
| 25-Hydroxyvitamin D (nmol/L) | 50.12 ± 0.85 | 25.10 ± 0.37 | <0.001 | 0.348 |
| High stress † | 25.4 ± 2.4 (163) | 31.1 ± 5.0 (41) | 0.305 | 0.025 |
| Sex | Model | Vitamin D Sufficiency (≥30 nmol/L) | Hypovitaminosis D (<30 nmol/L) | p-Value |
|---|---|---|---|---|
| Men | Unadjusted | 1.00 (Reference) | 1.045 (0.481–2.270) | 0.912 |
| Model 1 | 1.00 (Reference) | 1.067 (0.491–2.323) | 0.869 | |
| Model 2 | 1.00 (Reference) | 1.126 (0.521–2.433) | 0.762 | |
| Model 3 | 1.00 (Reference) | 0.829 (0.172–4.002) | 0.815 | |
| Women | Unadjusted | 1.00 (Reference) | 1.329 (0.771–2.290) | 0.305 |
| Model 1 | 1.00 (Reference) | 1.297 (0.762–2.206) | 0.337 | |
| Model 2 | 1.00 (Reference) | 1.268 (0.744–2.160) | 0.383 | |
| Model 3 | 1.00 (Reference) | 2.739 (1.107–6.774) | 0.029 |
© 2016 by the authors; licensee MDPI, Basel, Switzerland. This article is an open access article distributed under the terms and conditions of the Creative Commons Attribution (CC-BY) license (http://creativecommons.org/licenses/by/4.0/).
Share and Cite
Gwon, M.; Tak, Y.J.; Kim, Y.J.; Lee, S.Y.; Lee, J.G.; Jeong, D.W.; Yi, Y.H.; Lee, S.H.; Hwang, H.R.; Lee, Y. Is Hypovitaminosis D Associated with Stress Perception in the Elderly? A Nationwide Representative Study in Korea. Nutrients 2016, 8, 647. https://doi.org/10.3390/nu8100647
Gwon M, Tak YJ, Kim YJ, Lee SY, Lee JG, Jeong DW, Yi YH, Lee SH, Hwang HR, Lee Y. Is Hypovitaminosis D Associated with Stress Perception in the Elderly? A Nationwide Representative Study in Korea. Nutrients. 2016; 8(10):647. https://doi.org/10.3390/nu8100647
Chicago/Turabian StyleGwon, Mieun, Young Jin Tak, Yun Jin Kim, Sang Yeoup Lee, Jeong Gyu Lee, Dong Wook Jeong, Yu Hyeon Yi, Seung Hoon Lee, Hye Rim Hwang, and Youngin Lee. 2016. "Is Hypovitaminosis D Associated with Stress Perception in the Elderly? A Nationwide Representative Study in Korea" Nutrients 8, no. 10: 647. https://doi.org/10.3390/nu8100647
APA StyleGwon, M., Tak, Y. J., Kim, Y. J., Lee, S. Y., Lee, J. G., Jeong, D. W., Yi, Y. H., Lee, S. H., Hwang, H. R., & Lee, Y. (2016). Is Hypovitaminosis D Associated with Stress Perception in the Elderly? A Nationwide Representative Study in Korea. Nutrients, 8(10), 647. https://doi.org/10.3390/nu8100647