Contribution of Water from Food and Fluids to Total Water Intake: Analysis of a French and UK Population Surveys

 , ,
, ,
Abstract
:1. Introduction
2. Materials and Methods
2.1. The French Nutritional Survey (CCAF 2013)
2.2. The UK Nutritional Survey (NDNS 2008/2009–2011/2012)
2.3. Statistical Analysis
3. Results
3.1. Contribution of Water from Food Moisture and Fluids to Total Water Intake According to Country, Gender and Age Groups
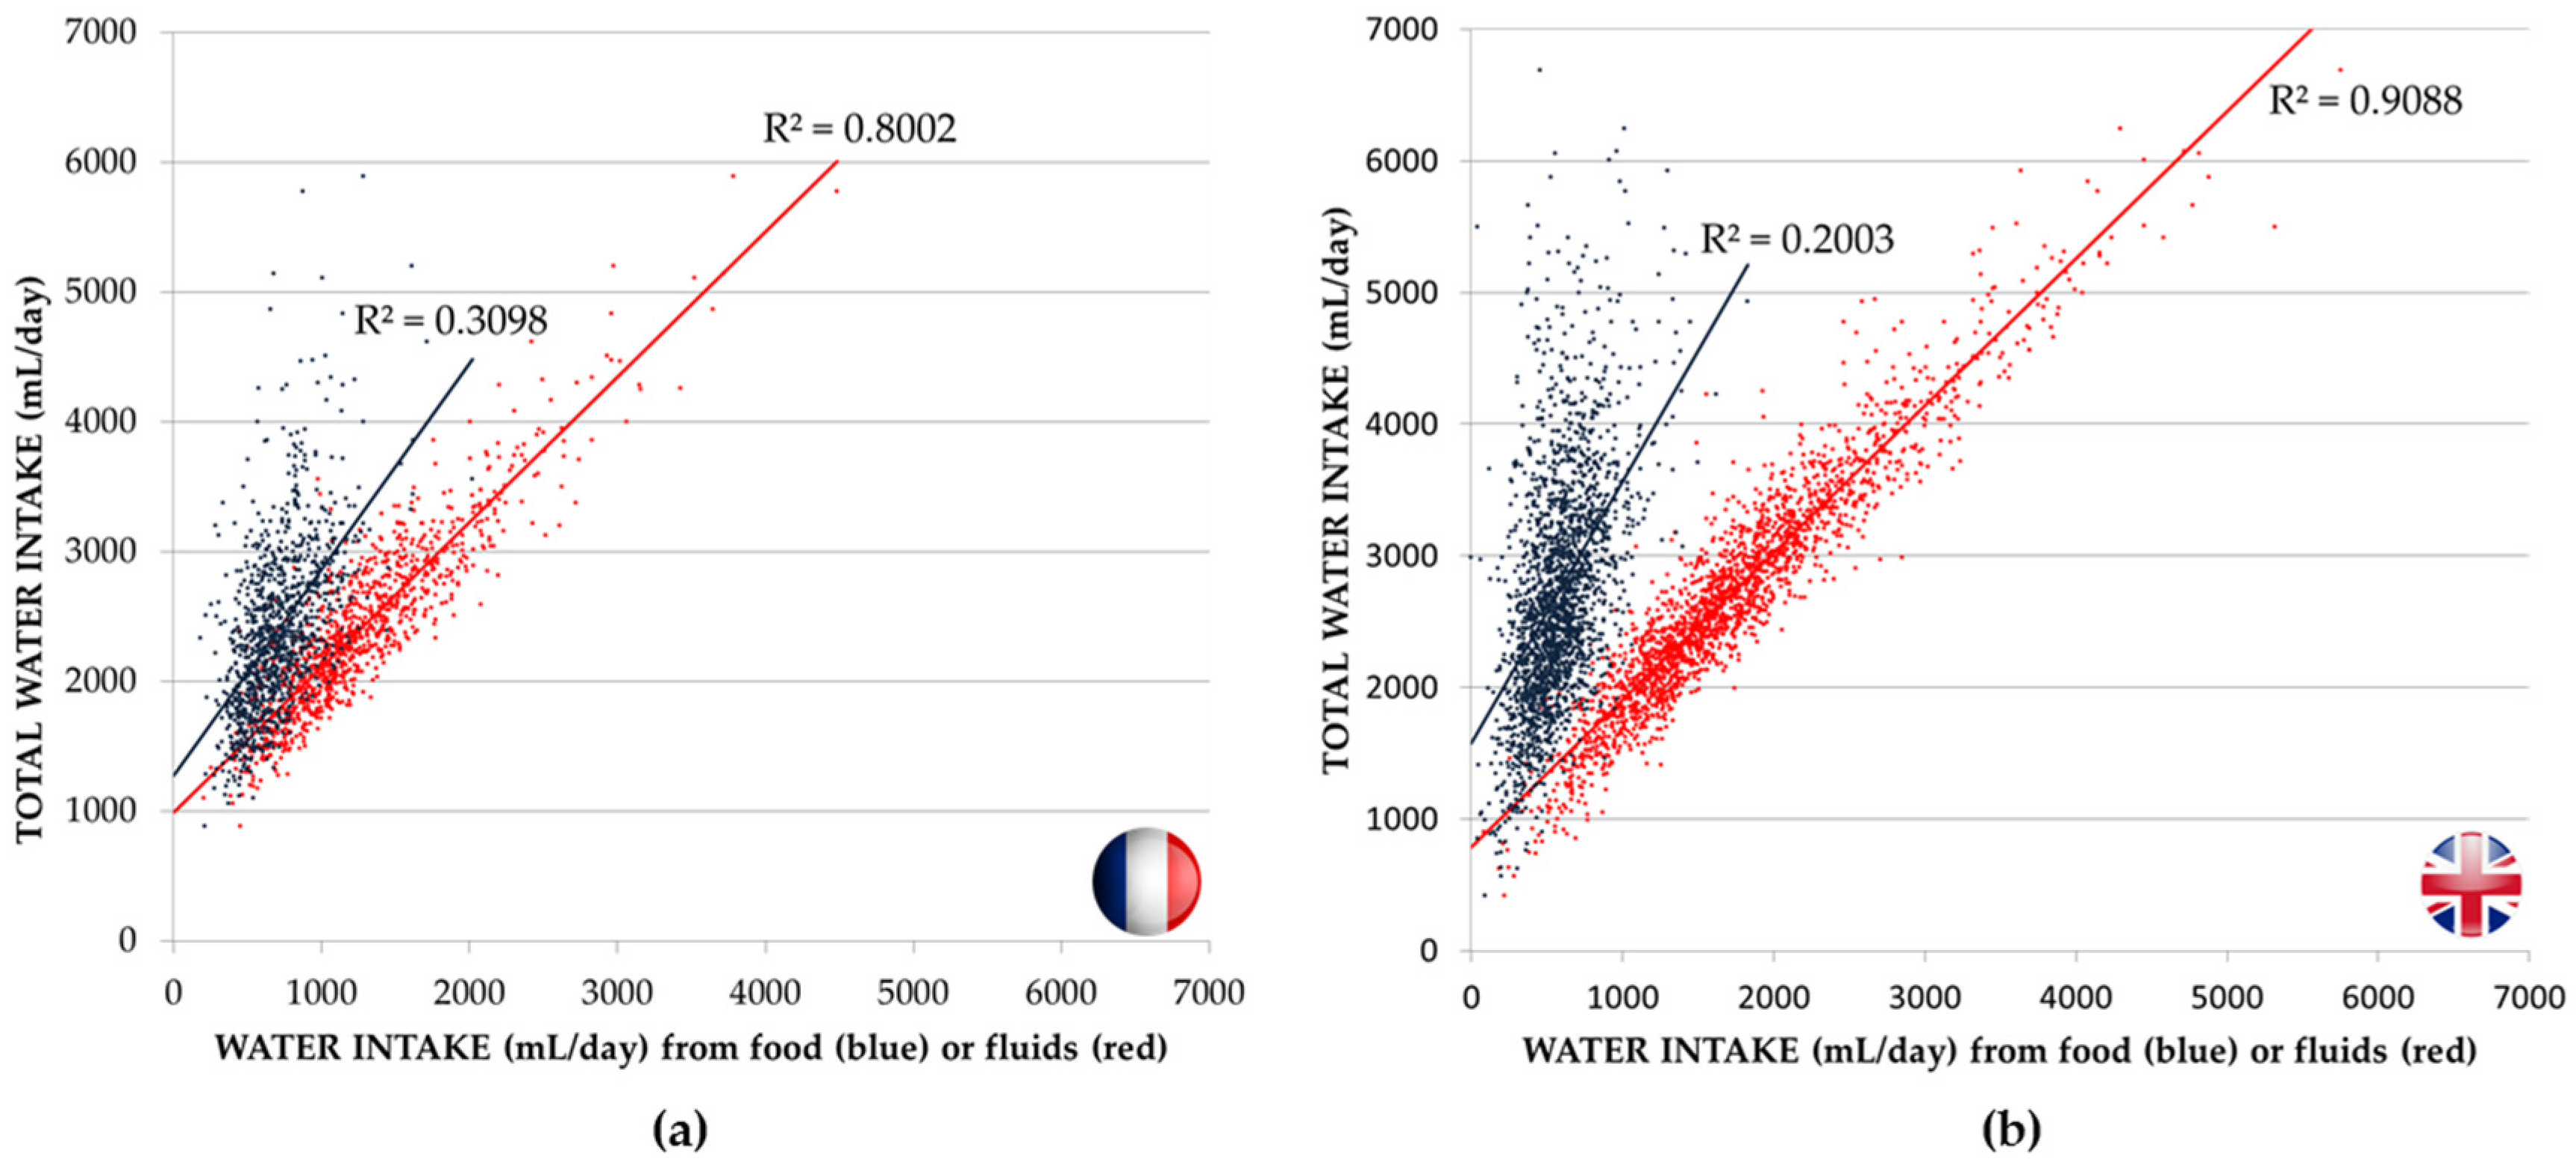
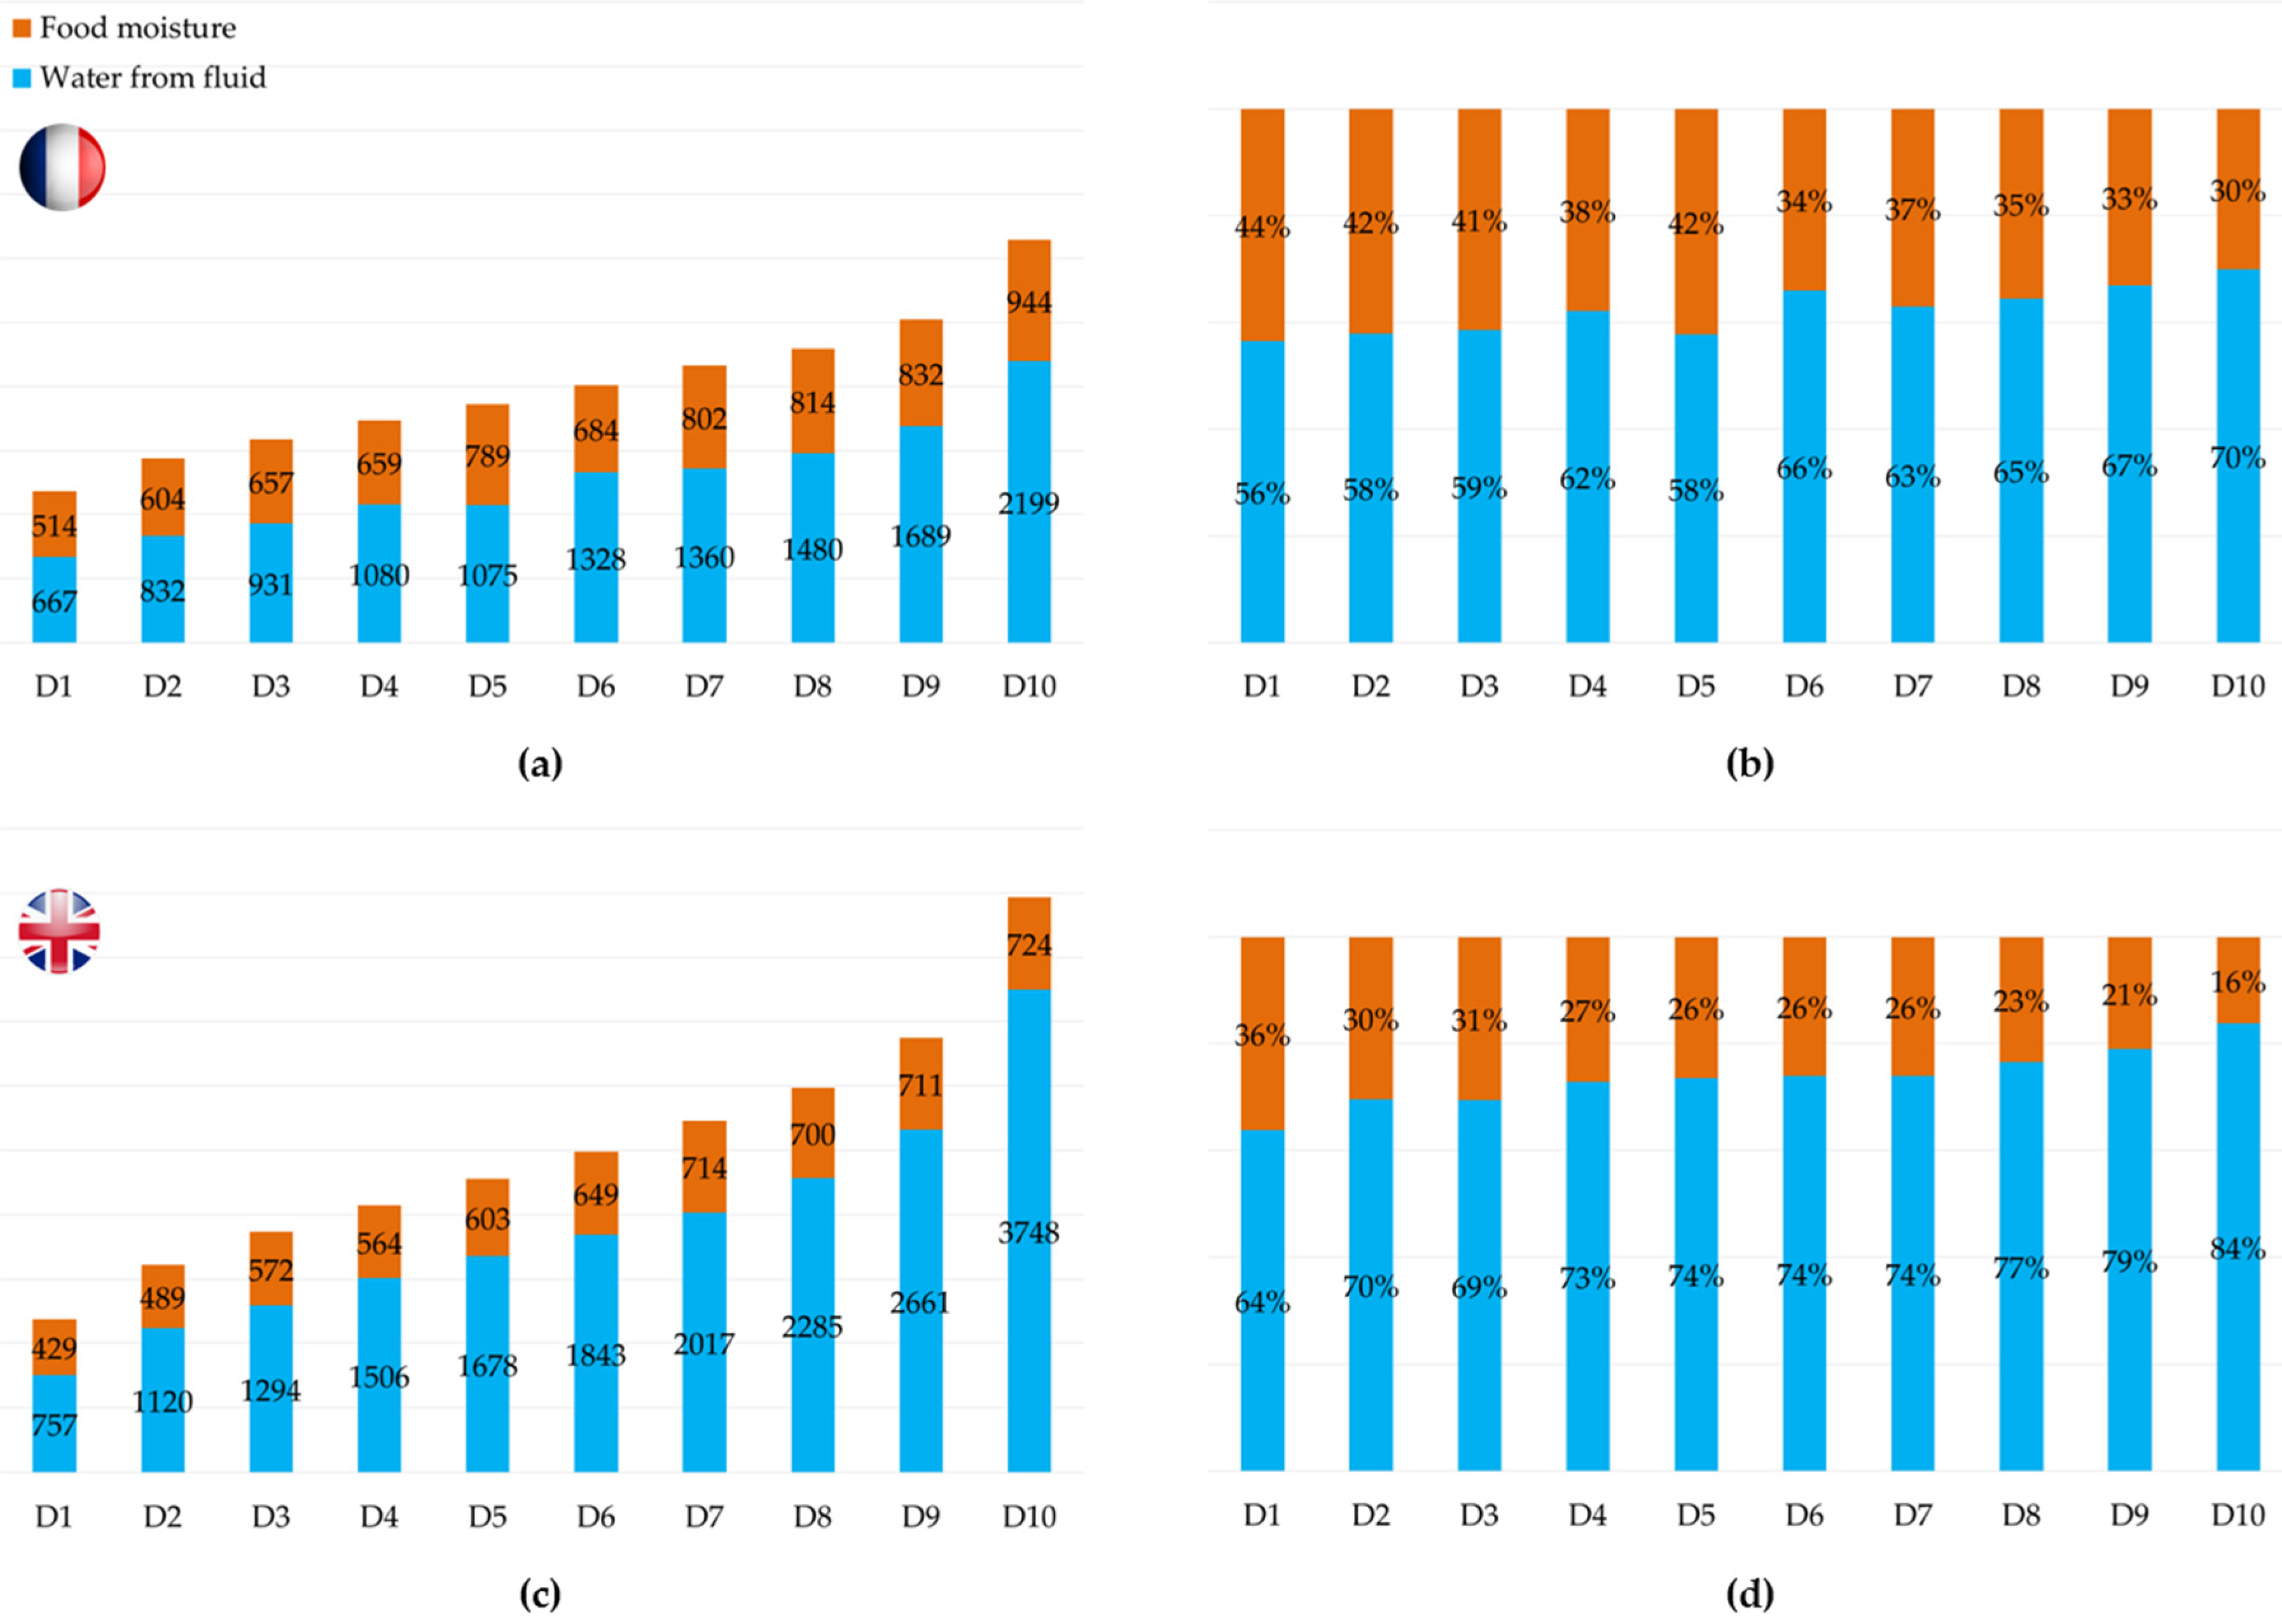
3.2. Contribution of Water from Food Moisture and Fluids to TWI According to Deciles of Total Water Intake
3.3. Contribution of Water from Food Moisture and Fluids to TWI According to Adherence to EFSA Adequate Intake
4. Discussion
5. Conclusions
Supplementary Materials
Acknowledgments
Author Contributions
Conflicts of Interest
References
- Clark, W.F.; Sontrop, J.M.; Huang, S.H.; Moist, L.; Bouby, N.; Bankir, L. Hydration and chronic kidney disease progression: A critical review of the evidence. Am. J. Nephrol. 2016, 43, 281–292. [Google Scholar] [CrossRef] [PubMed]
- Guelinckx, I.; Vecchio, M.; Perrier, E.T.; Lemetais, G. Fluid intake and vasopressin: Connecting the dots. Ann. Nutr. Metab. 2016, 68, 6–11. [Google Scholar] [CrossRef] [PubMed]
- Melander, O. Vasopressin, from regulator to disease predictor for diabetes and cardiometabolic risk. Ann. Nutr. Metab. 2016, 68, 24–28. [Google Scholar] [CrossRef] [PubMed]
- Popkin, B.M.; D’Anci, K.E.; Rosenberg, I.H. Water, hydration, and health. Nutr. Rev. 2010, 68, 439–458. [Google Scholar] [CrossRef] [PubMed]
- EFSA Panel on Dietetic Products Nutrition and Allergies (NDA). Scientific opinion on dietary reference values for water. EFSA J. 2010, 8, 1459. [Google Scholar]
- Institute of Medicine, Food and Nutrition Board. Dietary Reference Intakes for Water, Potassium, Sodium, Chloride and Sulfate; National Academies Press: Washington, DC, USA, 2004. [Google Scholar]
- Food Composition and Diet Team, Public Health Directorate. Nutrient Analysis of Fish and Fish Products. 2013. Available online: https://www.gov.uk/government/publications/nutrient-analysis-of-fish (accessed on 10 July 2016). [Google Scholar]
- Department of Health/Food Standards Agency. Nutrient Analysis of Biscuits, Buns, Cakes and Pastries—Summary Report. 2011. Available online: https://www.gov.uk/government/publications/nutrient-analysis-survey-of-biscuits-buns-cakes-and-pastries (accessed on 10 July 2016). [Google Scholar]
- Food Composition and Diet Team, Public Health Directorate. Nutrient Analysis of Fruit and Vegetables. 2013. Available online: https://www.gov.uk/government/publications/nutrient-analysis-of-fruit-and-vegetables (accessed on 10 July 2016). [Google Scholar]
- Food Composition and Diet Team, Public Health Directorate. Nutrient Analysis of Eggs. 2013. Available online: https://www.gov.uk/government/publications/nutrient-analysis-of-eggs (accessed on 10 July 2016). [Google Scholar]
- Mela, D.J. Food choice and intake: The human factor. Proc. Nutr. Soc. 1999, 58, 513–521. [Google Scholar] [CrossRef] [PubMed]
- Zhang, Q.; Hu, X.; Zou, S.; Zou, J.; Pan, Q.; Liu, C.; Pan, H.; Ma, G. Water intake of adults in four cities of China in summer. Chin. J. Prev. Med. 2011, 45, 677–682. [Google Scholar]
- Kant, A.K.; Graubard, B.I.; Atchison, E.A. Intakes of plain water, moisture in foods and beverages, and total water in the adult US population—Nutritional, meal pattern, and body weight correlates: National health and nutrition examination surveys 1999–2006. Am. J. Clin. Nutr. 2009, 90, 655–663. [Google Scholar] [CrossRef] [PubMed]
- Drewnowski, A.; Rehm, C.D.; Constant, F. Water and beverage consumption among adults in the United States: Cross-sectional study using data from NHANES 2005–2010. BMC Public Health 2013, 13, 1068. [Google Scholar] [CrossRef] [PubMed]
- Drewnowski, A.; Rehm, C.D.; Constant, F. Water and beverage consumption among children age 4–13 years in the United States: Analyses of 2005–2010 NHANES data. Nutr. J. 2013, 12, 85. [Google Scholar] [CrossRef] [PubMed]
- Piernas, C.; Barquera, S.; Popkin, B.M. Current patterns of water and beverage consumption among Mexican children and adolescents aged 1–18 years: Analysis of the mexican national health and nutrition survey 2012. Public Health Nutr. 2014, 17, 2166–2175. [Google Scholar] [CrossRef] [PubMed]
- Guelinckx, I.; Iglesia-Altaba, I.; Bottin, J.H.; De Miguel-Etayo, P.; Gonzalez-Gil, E.M.; Salas-Salvado, J.; Kavouras, S.A.; Gandy, J.; Martinez, H.; Bardosono, S.; et al. Intake of water and beverages of children and adolescents in 13 countries. Eur. J. Nutr. 2015, 54, S69–S79. [Google Scholar] [CrossRef] [PubMed]
- Gandy, J.; Le Bellego, L.; Konig, J.; Piekarz, A.; Tavoularis, G.; Tennant, D.R. Recording of fluid, beverage and water intakes at the population level in Europe. Br. J. Nutr. 2016, 116, 677–682. [Google Scholar] [CrossRef] [PubMed]
- German Nutrition Society. Dreidimensionale DGE-Lebensmittelpyramide. Available online: https://www.dge.de/ernaehrungspraxis/vollwertige-ernaehrung/lebensmittelpyramide/ (accessed on 10 July 2016).
- Public Health England; Welsh Government Food Standards Scotland; The Food Standards Agency Northern Ireland. Eatwell Guide; Public Health England: London, UK, 2016.
- Hebel, P. Comportements et Consommations Alimentaires en France; Lavoisier: Paris, France, 2012. [Google Scholar]
- Hercberg, S.; Deheeger, M.; Preziosi, P. Su-vi-Max. Portions Alimentaires. Manuel Photos pour l’Estimation des Quantités; Poly Technica: Paris, France, 1994. [Google Scholar]
- French Agency for Food, Environmental and Occupational Health Safety. French Food Composition Table. Table Ciqual 2012. Available online: http://www.ansespro.fr/TableCIQUAL/ (accessed on 16 November 2015).
- Bates, B.; Lennox, A.; Prentice, A.; Bates, C.; Page, P.; Nicholson, S.; Swan, G. National Diet and Nutrition Survey Results from Years 1, 2, 3 and 4 (Combined) of the Rolling Programme (2008/2009–2011/2012); Public Health England Publications: London, UK, 2014. [Google Scholar]
- University of Essex. UK Data Archive. Available online: http://www.data-archive.ac.uk (accessed on 15 November 2015).
- Ferreira-Pego, C.; Guelinckx, I.; Moreno, L.A.; Kavouras, S.A.; Gandy, J.; Martinez, H.; Bardosono, S.; Abdollahi, M.; Nasseri, E.; Jarosz, A.; et al. Total fluid intake and its determinants: Cross-sectional surveys among adults in 13 countries worldwide. Eur. J. Nutr. 2015, 54, 35–43. [Google Scholar] [CrossRef] [PubMed]
- Gibson, S.; Shirreffs, S.M. Beverage consumption habits “24/7” among British adults: Association with total water intake and energy intake. Nutr. J. 2013, 12, 9. [Google Scholar] [CrossRef] [PubMed]
- Iglesia, I.; Guelinckx, I.; De Miguel-Etayo, P.M.; Gonzalez-Gil, E.M.; Salas-Salvado, J.; Kavouras, S.A.; Gandy, J.; Martinez, H.; Bardosono, S.; Abdollahi, M.; et al. Total fluid intake of children and adolescents: Cross-sectional surveys in 13 countries worldwide. Eur. J. Nutr. 2015, 54, 57–67. [Google Scholar] [CrossRef] [PubMed]
- Vieux, F.; Maillot, M.; Constant, F.; Drewnowski, A. Water and beverage consumption among children aged 4–13 years in France: Analyses of INCA 2 (Etude Individuelle Nationale des Consommations Alimentaires 2006–2007) data. Public Health Nutr. 2016, 19, 2305–2314. [Google Scholar] [CrossRef] [PubMed]
- Gandy, J. First findings of the United Kingdom fluid intake study. Nutr. Today 2012, 47, S14–S16. [Google Scholar] [CrossRef]
- Bar-David, Y. The effect of voluntary dehydration on cognitive functions of elementaty school children. Acta Paediatr. 2005, 94, 1667–1673. [Google Scholar] [CrossRef] [PubMed]
- Kavouras, S.A.; Arnaoutis, G.; Makrillos, M.; Garagouni, C.; Nikolaou, E.; Chira, O.; Ellinikaki, E.; Sidossis, L.S. Educational intervention on water intake improves hydration status and enhances exercise performance in athletic youth. Scand. J. Med. Sci. Sports 2011, 22, 684–689. [Google Scholar] [CrossRef] [PubMed]
- Landau, D.; Tovbin, D.; Shalev, H. Pediatric urolithiasis in southern Israel: The role of uricosuria. Pediatr. Nephrol. 2000, 14, 1105–1110. [Google Scholar] [CrossRef] [PubMed]
- Bellisle, F.; Thornton, S.N.; Hebel, P.; Denizeau, M.; Tahiri, M. A study of fluid intake from beverages in a sample of healthy French children, adolescents and adults. Eur. J. Clin. Nutr. 2010, 64, 350–355. [Google Scholar] [CrossRef] [PubMed]
- Ng, S.W.; Ni, M.C.; Jebb, S.A.; Popkin, B.M. Patterns and trends of beverage consumption among children and adults in Great Britain, 1986–2009. Br. J. Nutr. 2012, 108, 536–551. [Google Scholar] [CrossRef] [PubMed]
- Sichert-Hellert, W.; Kersting, M.; Manz, F. Fifteen year trends in water intake in German children and adolescents: Results of the donald study. Dortmund nutritional and anthropometric longitudinally designed study. Acta Paediatr. 2001, 90, 732–737. [Google Scholar] [CrossRef] [PubMed]
- Nissensohn, M.; Sanchez-Villegas, A.; Ortega, R.M.; Aranceta-Bartrina, J.; Gil, A.; Gonzalez-Gross, M.; Varela-Moreiras, G.; Serra-Majem, L. Beverage consumption habits and association with total water and energy intakes in the Spanish population: Findings of the anibes study. Nutrients 2016, 8, 232. [Google Scholar] [CrossRef] [PubMed]
- O’Connor, L.; Walton, J.; Flynn, A. Water intakes and dietary sources of a nationally representative sample of Irish adults. J. Hum. Nutr. Dietet. 2014, 27, 550–556. [Google Scholar] [CrossRef] [PubMed]
- Nelson, M.; Bingham, S. Assessment of food consumption and nutrient intake. In Design Concepts in Nutritional Epidemiology; Margetts, B., Nelson, M., Eds.; Oxford University Press: Oxford, UK, 1997; pp. 153–191. [Google Scholar]
- Bardosono, S.; Monrozier, R.; Permadhi, I.; Manikam, N.; Rohan, R.; Guelinckx, I. Total fluid intake assessed with a seven-dayfluid record versus a 24 h dietary recall: A cross-over study in Indonesian adolescents and adults. Eur. J. Nutr. 2015, 54, 17–25. [Google Scholar] [CrossRef] [PubMed]
- Henderson, L.; Gregory, J.; Swan, G. National Diet and Nutrition Survey: Adults Aged 19 to 64 Years; TSO: London, UK, 2002; Volume 1. [Google Scholar]


| Age and Physiological Classes | Total Water Adequate Intake | ||
|---|---|---|---|
| Infants | 0–6 months | 680 mL/day through milk | |
| 6–12 months | 800–1000 mL/day | ||
| Children | 1–2 years | 1100–1200 mL/day | |
| 2–3 years | 1300 mL/day | ||
| 4–8 years | 1600 mL/day | ||
| 9–13 years | Boys | 2100 mL/day | |
| Girls | 1900 mL/day | ||
| >14 years | Same as adults | ||
| Adults | Men | 2500 mL/day | |
| Women | 2000 mL/day | ||
| Pregnant women | +300 mL/day vs. adults | ||
| Lactating women | +600–700 mL/day vs. adults | ||
| Elderly | Same as adults | ||
| CCAF 2013 | NDNS 2008/2009–2011/2012 | p-Values | ||||
|---|---|---|---|---|---|---|
| France | UK | |||||
| Males | Females | Males | Females | Males | Females | |
| 4–18 years | ||||||
| Sample size | 478 | 423 | 859 | 828 | ||
| Weight (kg) | 41 ± 17 | 41 ± 17 | 45 ± 13 | 44 ± 14 | 0.0002 | 0.0001 |
| Height (m) | 146 ± 23 | 144 ± 21 | 148 ± 15 | 145 ± 14 | 0.1407 | 0.5264 |
| Energy Intake (kcal/day) | 1906 ± 598 | 1636 ± 478 | 1802 ± 303 | 1540 ± 244 | 0.007 | <0.0001 |
| ≥19 years | ||||||
| Sample size | 426 | 636 | 901 | 1182 | ||
| Weight (kg) | 78 ± 14 | 65 ± 12 | 85 ± 20 | 72 ± 20 | <0.0001 | <0.0001 |
| Height (m) | 175 ± 8 | 163 ± 6 | 175 ± 10 | 161 ± 8 | 0.3374 | 0.0002 |
| Energy Intake (kcal/day) | 2229 ± 523 | 1832 ± 399 | 2109 ± 851 | 1588 ± 591 | 0.0018 | <0.0001 |
| TWI | Water from Fluids | Water from Food | |||||
|---|---|---|---|---|---|---|---|
| N | (mL/Day) * | (mL/Day) * | % TWI | (mL/Day) * | % TWI | ||
| CCAF 2013—France | |||||||
| 4–10 years | Males | 252 | 1254 (1074–1519) | 738 (616–912) | 61% | 483 (405–606) | 39% |
| Females | 194 | 1213 (1016–1519) | 752 (585–948) | 64% | 450 (372–549) | 36% | |
| 11–18 years | Males | 226 | 1510 (1255–1818) | 951 (740–1182) | 62% | 560 (473–689) | 38% |
| Females | 229 | 1382 (1143–1649) | 846 (676–1055) | 64% | 520 (394–617) | 36% | |
| 19–64 years | Males | 324 | 1922 (1559–2273) | 1188 (921–1573) | 65% | 671 (538–814) | 35% |
| Females | 492 | 1763 (1437–2143) | 1139 (840–1458) | 66% | 597 (488–745) | 34% | |
| ≥65 years | Males | 102 | 1929 (1699–2325) | 1115 (874–1420) | 59% | 810 (664–972) | 41% |
| Females | 144 | 1921 (1633–2373) | 1130 (882–1460) | 61% | 782 (638–923) | 39% | |
| 4–18 years | total | 901 | 1358 (1114–1645) | 825 (650–1055) | 65% | 508 (402–611) | 35% |
| ≥19 years | Males | 426 | 1923 (1591–2281) | 1186 (916–1532) | 62% | 697 (569–858) | 38% |
| ≥19 years | Females | 636 | 1796 (1479–2199) | 1135 (847–1458) | 65% | 631 (508–795) | 35% |
| NDNS 2008/2009–2011/2012—UK | |||||||
| 4–10 years | Males | 414 | 1253 (1045–1509) | 837 (664–1056) | 67% | 418 (343–502) | 33% |
| Females | 389 | 1225 (1016–1470) | 789 (627–994) | 67% | 411 (328–508) | 33% | |
| 11–18 years | Males | 445 | 1588 (1289–1978) | 1110 (860–1486) | 72% | 463 (367–570) | 28% |
| Females | 439 | 1348 (1083–1678) | 934 (699–1249) | 72% | 392 (316–482) | 28% | |
| 19–64 years | Males | 710 | 2415 (1890–3018) | 1793 (1306–2369) | 76% | 573 (457–732) | 24% |
| Females | 945 | 2060 (1692–2578) | 1522 (1150–1981) | 75% | 536 (413–656) | 25% | |
| ≥65 years | Males | 191 | 2260 (1796–2703) | 1645 (1200–2026) | 72% | 628 (503–764) | 28% |
| Females | 237 | 2002 (1692–2468) | 1466 (1170–1840) | 72% | 567 (460–665) | 28% | |
| 4–18 years | total | 1687 | 1352 (1102–1686) | 920 (692–121) | 67% | 416 (337–522) | 33% |
| ≥19 years | Males | 901 | 2386 (1875–2968) | 1745 (1292–2289) | 76% | 591 (469–739) | 24% |
| ≥19 years | Females | 1182 | 2050 (1692–2559) | 1510 (1153–1921) | 72% | 542 (425–658) | 28% |
| TWI | Water from Fluids | Water from Food | |||||
|---|---|---|---|---|---|---|---|
| N (%) | mL/Day * | mL/Day * | % TWI | mL/Day * | % TWI | ||
| CCAF 2013—France | |||||||
| Children | <AI | 811 (91%) | 1310 (1082–1528) | 786 (629–985) | 62% | 498 (398–593) | 38% |
| ≥AI | 85 (9%) | 2079 (1849–2276) | 1450 (1233–1641) | 68% | 627 (505–800) | 32% | |
| Male adults | <AI | 435 (84%) | 1832 (1534–2144) | 1102 (879–1371) | 62% | 675 (546–810) | 38% |
| ≥AI | 82 (16%) | 2752 (2609–3100) | 1928 (1680–2195) | 68% | 870 (731–1093) | 32% | |
| Female adults | <AI | 361 (64%) | 1592 (1338–1776) | 950 (754–1131) | 61% | 574 (473–714) | 39% |
| ≥AI | 199 (36%) | 2384 (2167–2689) | 1585 (1405–1964) | 69% | 778 (607–960) | 31% | |
| NDNS 2008/2009–2011/2012—UK | |||||||
| Children | <AI | 1477 (88%) | 1288 (1056–1526) | 864 (675–1093) | 68% | 404 (329–502) | 32% |
| ≥AI | 210 (12%) | 2186 (1893–2665) | 1688 (1349–2161) | 78% | 520 (405–637) | 22% | |
| Male adults | <AI | 495 (56%) | 1922 (1586–2204) | 1326 (1089–1615) | 71% | 528 (422–658) | 29% |
| ≥AI | 406 (44%) | 3086 (2794–3579) | 2377 (2072–2883) | 79% | 682 (540–834) | 21% | |
| Female adults | <AI | 538 (47%) | 1661 (1396–1831) | 1141 (907–1301) | 69% | 477 (374–580) | 31% |
| ≥AI | 644 (53%) | 2493 (2227–2932) | 1894 (1648–2312) | 77% | 606 (483–710) | 23% | |
© 2016 by the authors; licensee MDPI, Basel, Switzerland. This article is an open access article distributed under the terms and conditions of the Creative Commons Attribution (CC-BY) license (http://creativecommons.org/licenses/by/4.0/).
Share and Cite
Guelinckx, I.; Tavoularis, G.; König, J.; Morin, C.; Gharbi, H.; Gandy, J. Contribution of Water from Food and Fluids to Total Water Intake: Analysis of a French and UK Population Surveys. Nutrients 2016, 8, 630. https://doi.org/10.3390/nu8100630
Guelinckx I, Tavoularis G, König J, Morin C, Gharbi H, Gandy J. Contribution of Water from Food and Fluids to Total Water Intake: Analysis of a French and UK Population Surveys. Nutrients. 2016; 8(10):630. https://doi.org/10.3390/nu8100630
Chicago/Turabian StyleGuelinckx, Isabelle, Gabriel Tavoularis, Jürgen König, Clémentine Morin, Hakam Gharbi, and Joan Gandy. 2016. "Contribution of Water from Food and Fluids to Total Water Intake: Analysis of a French and UK Population Surveys" Nutrients 8, no. 10: 630. https://doi.org/10.3390/nu8100630
APA StyleGuelinckx, I., Tavoularis, G., König, J., Morin, C., Gharbi, H., & Gandy, J. (2016). Contribution of Water from Food and Fluids to Total Water Intake: Analysis of a French and UK Population Surveys. Nutrients, 8(10), 630. https://doi.org/10.3390/nu8100630