Significant Beneficial Association of High Dietary Selenium Intake with Reduced Body Fat in the CODING Study

 ,
,
Abstract
:1. Introduction
2. Subjects and Methods
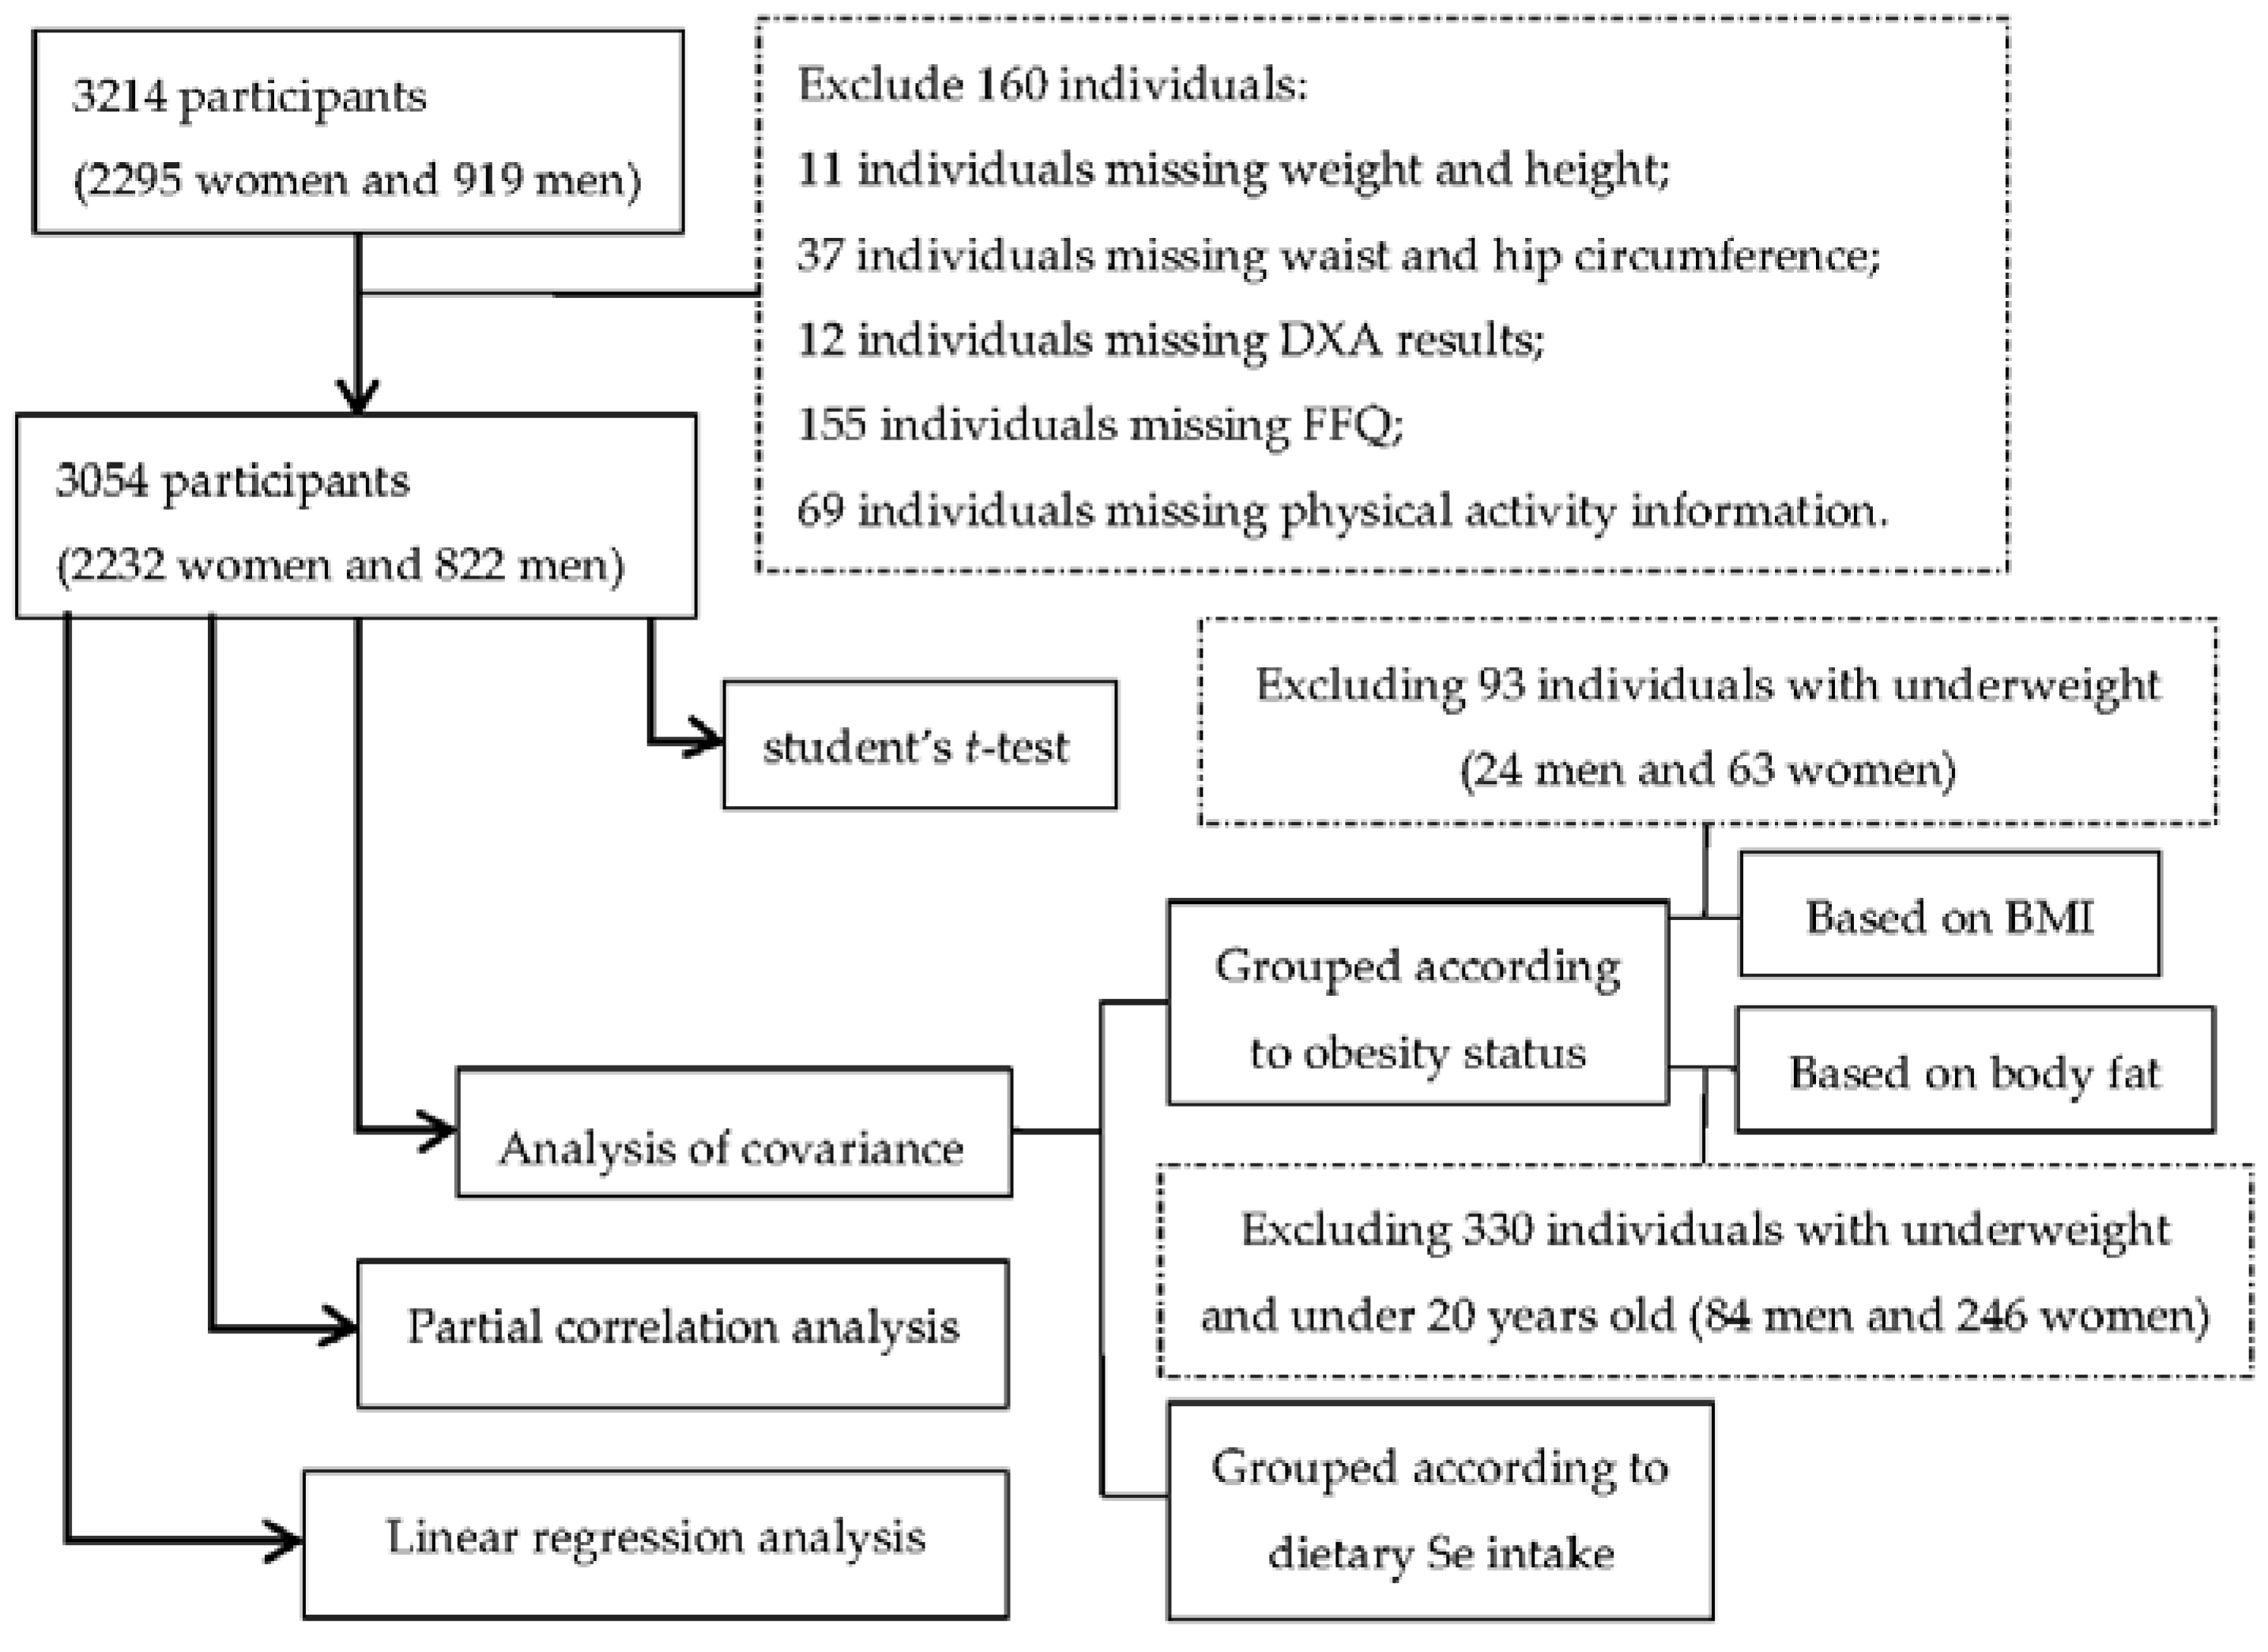
2.1. Subjects

2.2. Anthropometric Measurements
2.3. Body Composition Measurements
2.4. Dietary Assessment
2.5. Physical Activity Assessment and Other Information
2.6. Data Analyses
3. Results
3.1. Body Composition and Dietary Se Intake

| Entire Cohort (n = 3054) | Women (n = 2232) | Men (n = 822) | p | |
|---|---|---|---|---|
| Age (year) | 42.92 ± 0.24 | 43.71 ± 0.27 | 40.63 ± 0.49 | <0.001 |
| Weight (kg) | 74.06 ± 0.29 | 69.50 ± 0.29 | 86.60 ± 0.54 | <0.001 |
| BMI (kg/m2) | 26.70 ± 0.90 | 26.32 ± 0.11 | 27.71 ± 0.16 | <0.001 |
| WC (cm) | 91.89 ± 0.25 | 89.85 ± 0.29 | 97.40 ± 0.46 | <0.001 |
| WHR | 0.91 ± 0.01 | 0.89 ± 0.01 | 0.97 ± 0.02 | <0.001 |
| TF% | 36.36 ± 0.18 | 38.62 ± 0.19 | 30.13 ± 0.34 | <0.001 |
| AF% | 41.43 ± 0.21 | 43.43 ± 0.23 | 35.84 ± 0.41 | <0.001 |
| GF% | 40.25 ± 0.18 | 44.56 ± 0.14 | 28.39 ± 0.28 | <0.001 |
| BF% | 34.06 ± 0.17 | 37.34 ± 0.17 | 25.05 ± 0.28 | <0.001 |
| Calorie intake (kcal/d) | 1976.36 ± 16.20 | 1867.03 ± 17.15 | 2281.53 ± 36.17 | <0.001 |
| Physical activity | 8.28 ± 0.03 | 8.17 ± 0.03 | 8.52 ± 0.06 | <0.001 |
| Dietary Se intake (μg/day) | 108.10 ± 1.04 | 101.78 ± 1.06 | 125.42 ± 2.52 | <0.001 |
| Dietary Se intake (μg/kg/day) | 1.51 ± 0.02 | 1.51 ± 0.02 | 1.50 ± 0.03 | 0.10 |
3.2. Variations in Dietary Se Intake Based on Obesity Status
| Grouped According to BMI 2 | Normal Weight | Overweight | Obese | p-Trend | |
|---|---|---|---|---|---|
| Women | N | 1004 | 722 | 437 | |
| Dietary Se intake (μg/day) | 100.76 ± 1.04 | 101.85 ± 1.21 | 104.08 ± 1.58 | 0.71 | |
| Dietary Se intake (μg/kg/day) | 1.70 ± 0.02 | 1.44 ± 0.02 | 1.18 ± 0.03 | <0.001 | |
| Dietary Se intake decline | −15% 4 | −31% 4 | |||
| Men | N | 234 | 350 | 214 | |
| Dietary Se intake (μg/day) | 122.52 ± 2.98 | 125.37 ± 2.37 | 128.74 ± 3.07 | 0.54 | |
| Dietary Se intake (μg/kg/day) | 1.74 ± 0.04 | 1.48 ± 0.03 | 1.26 ± 0.04 | <0.001 | |
| Dietary Se intake decline | −15% 4 | −28% 4 | |||
| Grouped According to BMI 2 | Obese Class I | Obese Class II | Obese Class III | p-Trend | |
| Women | N | 294 | 95 | 48 | |
| Dietary Se intake (μg/day) | 102.49 ± 2.16 | 103.98 ± 3.79 | 104.18 ± 5.41 | 0.93 | |
| Dietary Se intake (μg/kg/day) | 1.22 ± 0.03 | 1.09 ± 0.04 | 0.93 ± 0.06 | <0.001 | |
| Dietary Se intake decline | −11% 5 | −24% 5 | |||
| Men | N | 158 | 45 | 11 | |
| Dietary Se intake (μg/day) | 114.22 ± 3.02 | 116.35 ± 5.6 | 119.96 ± 11.81 | 0.29 | |
| Dietary Se intake (μg/kg/day) | 1.14 ± 0.03 | 1.00 ± 0.06 | 0.90 ± 0.12 | 0.001 | |
| Dietary Se intake decline | −12% 5 | −21% 5 | |||
| Grouped According to Body Fat 3 | Normal Weight | Overweight | Obese | p-Trend | |
| Women | N | 664 | 542 | 780 | |
| Dietary Se intake (μg/day) | 99.47 ± 1.26 | 99.87 ± 1.36 | 100.28 ± 1.16 | 0.87 | |
| Dietary Se intake (μg/kg/day) | 1.68 ± 0.02 | 1.51 ± 0.02 | 1.25 ± 0.02 | 0.001 | |
| Dietary Se intake decline | −10% 4 | −26% 4 | |||
| Men | N | 254 | 199 | 285 | |
| Dietary Se intake (μg/day) | 123.96 ± 2.71 | 118.78 ± 2.96 | 120.74 ± 2.53 | 0.79 | |
| Dietary Se intake (μg/kg/day) | 1.64 ± 0.03 | 1.41 ± 0.04 | 1.25 ± 0.03 | <0.001 | |
| Dietary Se intake decline | −14% 4 | −24% 4 | |||
3.3. Variations in Obesity Measurements According to Amount of Dietary Se Intake
| Dietary Se Intake (μg/Day) | Low | Medium | High | p-Trend | ||
|---|---|---|---|---|---|---|
| n (Women/Men) | 744/274 | 744/274 | 744/274 | |||
| Women | Se (μg/day) | 14.16~80.64 | 80.64~117.06 | 117.06~669.77 | ||
| Weight (kg) | 68.06 ± 0.59 | 69.51 ± 0.49 | 70.97 ± 0.59 | 0.01 | ||
| BMI (kg/m2) | 25.97 ± 0.22 | 26.31 ± 0.18 | 26.71 ± 0.22 | 0.10 | ||
| WC (cm) | 89.50 ± 0.57 | 89.75 ± 0.48 | 90.41 ± 0.57 | 0.57 | ||
| WHR | 0.89 ± 0.003 | 0.89 ± 0.002 | 0.89 ± 0.003 | 0.64 | ||
| TF% | 38.25 ± 0.36 | 38.64 ± 0.30 | 39.01 ± 0.36 | 0.43 | ||
| AF% | 43.17 ± 0.44 | 43.47 ± 0.37 | 43.75 ± 0.44 | 0.73 | ||
| GF% | 44.19 ± 0.28 | 44.83 ± 0.23 | 44.72 ± 0.28 | 0.23 | ||
| BF% | 36.90 ± 0.32 | 37.43 ± 0.26 | 37.72 ± 0.31 | 0.26 | ||
| Men | Se (μg/day) | 20.13~92.07 | 92.07~133.59 | 133.59~683.93 | ||
| Weight (kg) | 84.19 ± 1.13 | 87.20 ± 0.90 | 88.27 ± 1.15 | 0.07 | ||
| BMI (kg/m2) | 27.24 ± 0.33 | 28.03 ± 0.26 | 27.83 ± 0.33 | 0.16 | ||
| WC (cm) | 96.95 ± 0.89 | 97.89 ± 0.71 | 97.26 ± 0.90 | 0.65 | ||
| WHR | 0.97 ± 0.004 | 0.98 ± 0.003 | 0.98 ± 0.004 | 0.40 | ||
| TF% | 30.44 ± 0.63 | 30.78 ± 0.50 | 29.14 ± 0.65 | 0.14 | ||
| AF% | 36.53 ± 0.77 | 36.39 ± 0.61 | 34.60 ± 0.78 | 0.18 | ||
| GF% | 28.73 ± 0.56 | 28.83 ± 0.44 | 27.62 ± 0.57 | 0.25 | ||
| BF% | 25.30 ± 0.54 | 25.63 ± 0.43 | 24.20 ± 0.55 | 0.12 | ||
| Dietary Se Intake (μg/kg/Day) | Low | Medium | High | Variations 1 | p-Trend | |
| n (Women/Men) | 744/274 | 744/274 | 744/274 | |||
| Women | Se (μg/kg/day) | 0.14~1.12 | 1.12~1.66 | 1.66~13.46 | ||
| Weight (kg) | 78.76 ± 0.52 | 69.03 ± 0.44 | 60.70 ± 0.52 | −8.93 | <0.001 | |
| BMI (kg/m2) | 29.52 ± 0.19 | 26.11 ± 0.16 | 23.35 ± 0.19 | −2.98 | <0.001 | |
| WC (cm) | 97.99 ± 0.52 | 89.12 ± 0.44 | 82.55 ± 0.51 | −8.03 | <0.001 | |
| WHR | 0.91 ± 0.003 | 0.89 ± 0.002 | 0.88 ± 0.003 | −0.013 | <0.001 | |
| TF% | 43.09 ± 0.33 | 38.48 ± 0.28 | 34.35 ± 0.33 | −4.58 | <0.001 | |
| AF% | 48.65 ± 0.41 | 43.40 ± 0.35 | 38.34 ± 0.40 | −5.56 | <0.001 | |
| GF% | 47.02 ± 0.27 | 44.76 ± 0.23 | 41.95 ± 0.26 | −3.05 | <0.001 | |
| BF% | 41.26 ± 0.29 | 37.25 ± 0.25 | 33.55 ± 0.29 | −4.16 | <0.001 | |
| Men | Se (μg/kg/day) | 0.22~1.04 | 1.05~1.60 | 1.61~9.59 | ||
| Weight (kg) | 95.56 ± 1.04 | 87.42 ± 0.84 | 76.58 ± 1.07 | −8.85 | <0.001 | |
| BMI (kg/m2) | 30.24 ± 0.30 | 27.88 ± 0.25 | 24.96 ± 0.31 | −2.34 | <0.001 | |
| WC (cm) | 104.71 ± 0.81 | 97.75 ± 0.66 | 89.61 ± 0.84 | −7.39 | <0.001 | |
| WHR | 0.99 ± 0.004 | 0.98 ± 0.003 | 0.96 ± 0.004 | −0.020 | <0.001 | |
| TF% | 34.15 ± 0.59 | 31.45 ± 0.48 | 24.70 ± 0.61 | −5.43 | <0.001 | |
| AF% | 40.60 ± 0.72 | 37.13 ± 0.58 | 29.72 ± 0.72 | −5.94 | <0.001 | |
| GF% | 31.54 ± 0.53 | 29.10 ± 0.43 | 24.47 ± 0.54 | −4.19 | <0.001 | |
| BF% | 28.61 ± 0.50 | 25.93 ± 0.40 | 20.53 ± 0.52 | −4.45 | <0.001 | |
3.4. Correlation between Dietary Se Intake and Obesity Measurements
| All Women (n = 2232) | Obese Women (n = 437) | All Men (n = 822) | Obese Men (n = 214) | ||
|---|---|---|---|---|---|
| r (p) | r’ (p) | r (p) | r’ (p) | ||
| Dietary Se intake (μg/day) | Weight | 0.02 (0.32) | 0.005 (0.92) | 0.08 (0.02) | 0.12 (0.08) |
| BMI1 | 0.01 (0.53) | 0.004 (0.93) | 0.06 (0.09) | 0.07 (0.32) | |
| WC1 | −0.03 (0.13) | −0.120 (0.01) | 0.01 (0.76) | 0.03 (0.68) | |
| WHR | −0.03 (0.15) | −0.129 (0.01) | 0.04 (0.28) | 0.04 (0.57) | |
| TF% | −0.01 (0.66) | −0.046 (0.34) | −0.07 (0.07) | 0.001 (0.99) | |
| AF% | −0.02 (0.31) | −0.031 (0.51) | −0.08 (0.03) | −0.06 (0.41) | |
| GF% | −0.004 (0.84) | 0.012 (0.80) | −0.07 (0.05) | −0.10 (0.14) | |
| BF% | −0.001 (0.95) | −0.024 (0.62) | −0.06 (0.09) | 0.01 (0.91) | |
| Dietary Se intake (μg/kg/day) | Weight | −0.52 (<0.001) | −0.37 (<0.001) | −0.46 (<0.001) | −0.30 (<0.001) |
| BMI | −0.49 (<0.001) | −0.29 (<0.001) | −0.43 (<0.001) | −0.25 (<0.001) | |
| WC | −0.49 (<0.001) | −0.36 (<0.001) | −0.46 (<0.001) | −0.29 (<0.001) | |
| WHR | −0.19 (<0.001) | −0.13 (0.01) | −0.22 (<0.001) | −0.05 (0.51) | |
| TF% | −0.41 (<0.001) | −0.12 (0.01) | −0.43 (<0.001) | −0.12 (0.08) | |
| AF% | −0.40 (<0.001) | −0.12 (0.01) | −0.41 (<0.001) | −0.19 (0.01) | |
| GF% | −0.30 (<0.001) | −0.05 (0.26) | −0.35 (<0.001) | −0.21 (0.002) | |
| BF% | −0.41 (<0.001) | −0.16 (0.001) | −0.43 (<0.001) | −0.16 (0.02) | |
| Smoking | Alcohol | Medication | Menopausal | |||||
|---|---|---|---|---|---|---|---|---|
| No r’ | Yes r’ | No r’ | Yes r’ | No r’ | Yes r’ | Pre r’ | Post r’ | |
| Women | ||||||||
| Weight | −0.03 | −0.03 | −0.04 | −0.02 | −0.03 | −0.03 | −0.05 | 0.02 |
| BMI | −0.04 | −0.01 | −0.04 | −0.04 | −0.04 | −0.03 | −0.05 | 0.01 |
| WC | −0.07 ** | −0.19 ** | −0.09 ** | −0.06 | −0.08 | −0.08 | −0.10 | 0.04 |
| WHR | −0.03 | −0.16 * | −0.05 * | −0.04 | −0.03 | −0.05 | −0.07 | −0.02 |
| TF% | −0.05 * | −0.05 | −0.06 * | −0.02 | −0.07 * | −0.04 | −0.07 * | −0.01 * |
| AF% | −0.06 * | −0.10 | −0.07 ** | −0.04 | −0.09 * | −0.05 | −0.08 * | −0.02 * |
| GF% | −0.04 * | −0.04 | −0.05 * | −0.01 | −0.07 * | −0.01 | −0.06 * | 0.03 * |
| BF% | −0.05 * | −0.02 | −0.06 * | −0.01 | −0.06* | −0.03 | −0.07 * | 0.01 * |
| Men | ||||||||
| Weight | 0.06 | 0.02 | −0.03 | 0.19 | 0.02 | 0.13 | ||
| BMI | 0.04 | −0.03 | −0.01 | 0.17 | 0.01 | 0.08 | ||
| WC | −0.01 | −0.10 | −0.04 | 0.11 | −0.04 | 0.03 | ||
| WHR | 0.04 | −0.07 | −0.01 | 0.14 | 0.06 | −0.03 | ||
| TF% | −0.12 ** | −0.01 | −0.123 ** | 0.03 | −0.13 ** | −0.04 | ||
| AF% | −0.12 ** | −0.08 | −0.126 ** | −0.02 | −0.13 ** | −0.07 | ||
| GF% | −0.10 ** | −0.09 | −0.104 ** | −0.06 | −0.13 ** | −0.03 | ||
| BF% | −0.11 ** | −0.04 | −0.117 ** | −0.03 | −0.14 ** | −0.01 | ||
| Women (n = 2232) | Men (n = 822) | |||||
|---|---|---|---|---|---|---|
| R2 | β | p Value | R2 | β | p Value | |
| Dietary Se intake (μg/day) | ||||||
| weight | 0.051 | 0.032 | 0.348 | 0.044 | 0.095 | 0.139 |
| BMI | 0.085 | 0.026 | 0.447 | 0.090 | 0.049 | 0.430 |
| WC | 0.136 | −0.052 | 0.117 | 0.199 | 0.010 | 0.862 |
| WHR | 0.039 | −0.049 | 0.157 | 0.100 | 0.063 | 0.310 |
| TF% | 0.176 | −0.013 | 0.692 | 0.260 | −0.128 | 0.023 |
| AF% | 0.153 | −0.030 | 0.352 | 0.249 | −0.149 | 0.009 |
| GF% | 0.106 | −0.009 | 0.786 | 0.122 | −0.142 | 0.021 |
| BF% | 0.175 | 0.001 | 0.985 | 0.221 | −0.121 | 0.036 |
| Dietary Se intake (μg/kg/day) | ||||||
| Weight | 0.315 | −0.781 | <0.001 | 0.266 | −0.821 | <0.001 |
| BMI | 0.301 | −0.708 | <0.001 | 0.283 | −0.761 | <0.001 |
| WC | 0.341 | −0.692 | <0.001 | 0.374 | −0.734 | <0.001 |
| WHR | 0.074 | −0.289 | <0.001 | 0.144 | −0.368 | <0.001 |
| TF% | 0.315 | −0.569 | <0.001 | 0.405 | −0.670 | <0.001 |
| AF% | 0.286 | −0.557 | <0.001 | 0.380 | −0.642 | <0.001 |
| GF% | 0.191 | −0.445 | <0.001 | 0.229 | −0.580 | <0.001 |
| BF% | 0.315 | −0.571 | <0.001 | 0.373 | −0.682 | <0.001 |
4. Discussion
5. Conclusions
Acknowledgments
Author Contributions
Conflicts of Interest
References
- Ng, M.; Fleming, T.; Robinson, M.; Thomson, B.; Graetz, N.; Margono, C.; Mullany, E.C.; Biryukov, S.; Abbafati, C.; Abera, S.F.; et al. Global, regional, and national prevalence of overweight and obesity in children and adults during 1980–2013: A systematic analysis for the Global Burden of Disease Study 2013. Lancet 2014, 384, 766–781. [Google Scholar] [CrossRef]
- Sturm, R.; An, R. Obesity and Economic Environments. CA Cancer J. Clin. 2014, 64, 337–350. [Google Scholar] [CrossRef] [PubMed]
- Lim, S.S.; Vos, T.; Flaxman, A.D.; Danaei, G.; Shibuya, K.; Adair-Rohani, H.; Amann, M.; Anderson, H.R.; Andrews, K.G.; Aryee, M.; et al. A comparative risk assessment of burden of disease and injury attributable to 67 risk factors and risk factor clusters in 21 regions, 1990–2010: A systematic analysis for the Global Burden of Disease Study 2010. Lancet 2012, 380, 2224–2260. [Google Scholar] [CrossRef]
- Morris, M.J.; Beilharz, J.E.; Maniam, J.; Reichelt, A.C.; Westbrook, R.F. Why is obesity such a problem in the 21st century? The intersection of palatable food, cues and reward pathways, stress, and cognition. Neurosci. Biobehav. Rev. 2015, 58, 36–45. [Google Scholar] [CrossRef] [PubMed]
- Riera-Crichton, D.; Tefft, N. Macronutrients and obesity: Revisiting the calories in, calories out framework. Econ. Hum. Biol. 2014, 14, 33–49. [Google Scholar] [CrossRef] [PubMed]
- García, O.P.; Long, K.Z.; Rosado, J.L. Impact of micronutrient deficiencies on obesity. Nutr. Rev. 2009, 67, 559–572. [Google Scholar] [CrossRef] [PubMed]
- García, O.P.; Ronquillo, D.; Caamano Mdel, C.; Camacho, M.; Long, K.Z.; Rosado, J.L. Zinc, vitamin A, and vitamin C status are associated with leptin concentrations and obesity in Mexican women: Results from a cross-sectional study. Nutr. Metab. 2012, 9, 59. [Google Scholar] [CrossRef] [PubMed]
- García, O.P.; Ronquillo, D.; del Carmen Caamaño, M.; Martínez, G.; Camacho, M.; López, V.; Rosado, J.L. Zinc, iron and vitamins A, C and E are associated with obesity, inflammation, lipid profile and insulin resistance in Mexican school-aged children. Nutrients 2013, 5, 5012–5030. [Google Scholar] [CrossRef] [PubMed]
- Touat-Hamici, Z.; Legrain, Y.; Bulteau, A.L.; Chavatte, L. Selective up-regulation of human selenoproteins in response to oxidative stress. J. Biol. Chem. 2014, 289, 14750–14761. [Google Scholar] [CrossRef] [PubMed]
- Sabino, P.; Stranges, S.; Strazzullo, P. Does selenium matter in cardiometabolic disorders? A short review of the evidence. J. Endocrinol. Investig. 2013, 36, 21–27. [Google Scholar]
- Alehagen, U.; Aaseth, J. Selenium and coenzyme Q10 interrelationship in cardiovascular diseases—A clinician’s point of view. J. Trace Elem. Med. Biol. 2015, 31, 157–162. [Google Scholar] [CrossRef] [PubMed]
- Facompre, N.; el-Bayoumy, K. Potential Stages for Prostate Cancer Prevention with Selenium: Implications for Cancer Survivors. Cancer Res. 2009, 69, 2699–2703. [Google Scholar] [CrossRef] [PubMed]
- Sun, L.H.; Li, J.G.; Zhao, H.; Shi, J.; Huang, J.Q.; Wang, K.N.; Xia, X.J.; Li, L.; Lei, X.G. Porcine serum can be biofortified with selenium to inhibit proliferation of three types of human cancer cells. J. Nutr. 2013, 143, 1115–1122. [Google Scholar] [CrossRef] [PubMed]
- Rayman, M.P.; Stranges, S. Epidemiology of selenium and type 2 diabetes: Can we make sense of it? Free Radic. Biol. Med. 2013, 65, 1557–1564. [Google Scholar] [CrossRef] [PubMed]
- Rocourt, C.R.B.; Cheng, W.H. Selenium supranutrition: Are the potential benefits of chemoprevention outweighed by the promotion of diabetes and insulin resistance? Nutrients 2013, 5, 1349–1365. [Google Scholar] [CrossRef] [PubMed]
- Mao, S.; Zhang, A.; Huang, S. Selenium supplementation and the risk of type 2 diabetes mellitus: A meta-analysis of randomized controlled trials. Endocrine 2014, 47, 758–763. [Google Scholar] [CrossRef] [PubMed]
- Kim, J.E.; Choi, S.I.; Lee, H.R.; Hwang, I.S.; Lee, Y.J.; An, B.S.; Lee, S.H.; Kim, H.J.; Kang, B.C.; Hwang, D.Y. Selenium significantly inhibits adipocyte hypertrophy and abdominal fat accumulation in OLETF rats via induction of fatty acid β-Oxidation. Biol. Trace Elem. Res. 2012, 150, 360–370. [Google Scholar] [CrossRef] [PubMed]
- Kim, C.Y.; Kim, G.N.; Wiacek, J.L.; Chen, C.Y.; Kim, K.H. Selenate inhibits adipogenesis through induction of transforming growth factor-β1 (TGF-β1) signaling. Biochem. Biophys. Res. Commun. 2012, 426, 551–557. [Google Scholar] [CrossRef] [PubMed]
- Kimmons, J.E.; Blanck, H.M.; Tohill, B.C.; Zhang, J.; Khan, L.K. Associations between body mass index and the prevalence of low micronutrient levels among US adults. Med. Gen. Med. 2006, 8, 59. [Google Scholar]
- Spina, A.; Guallar, E.; Rayman, M.P.; Tigbe, W.; Kandala, N.B.; Stranges, S. Anthropometric indices and selenium status in British adults: The UK National Diet and Nutrition Survey. Free Radic. Biol. Med. 2013, 65, 1315–1321. [Google Scholar] [CrossRef] [PubMed]
- Arnaud, J.; Bertrais, S.; Roussel, A.M.; Arnault, N.; Ruffieux, D.; Favier, A.; Berthelin, S.; Estaquio, C.; Galan, P.; Czernichow, S.; et al. Serum selenium determinants in French adults: The SU.VI.M.AX study. Br. J. Nutr. 2006, 95, 313–320. [Google Scholar] [CrossRef] [PubMed]
- Kennedy, A.P.; Shea, J.L.; Sun, G. Comparison of the classification of obesity by BMI vs. dual-energy X-ray absorptiometry in the Newfoundland population. Obesity 2009, 17, 2094–2099. [Google Scholar] [CrossRef] [PubMed]
- Cahill, F.; Shahidi, M.; Shea, J.; Wadden, D.; Gulliver, W.; Randell, E.; Vasdev, S.; Sun, G. High Dietary magnesium intake is associated with low insulin resistance in the Newfoundland population. PLoS ONE 2013, 8, e58278. [Google Scholar] [CrossRef] [PubMed]
- Shea, J.L.; King, M.T.; Yi, Y.; Gulliver, W.; Sun, G. Body fat percentage is associated with cardiometabolic dysregulation in BMI-defined normal weight subjects. Nutr. Metab. Cardiovasc. Dis. 2012, 22, 741–747. [Google Scholar] [CrossRef] [PubMed]
- Fontaine-Bisson, B.; Thorburn, J.; Gregory, A.; Zhang, H.; Sun, G. Melanin-concentrating hormone receptor 1 polymorphisms are associated with components of energy balance in the Complex Diseases in the Newfoundland Population: Environment and Genetics (CODING) study. Am. J. Clin. Nutr. 2014, 99, 384–391. [Google Scholar] [CrossRef] [PubMed]
- Sun, G.; Cahill, F.; Gulliver, W.; Yi, Y.; Xie, Y.; Bridger, T.; Pace, D.; Zhang, H. Concordance of BAI and BMI with DXA in the Newfoundland population. Obesity 2013, 21, 499–503. [Google Scholar] [CrossRef] [PubMed]
- Willett, W.C.; Sampson, L.; Stampfer, M.J.; Rosner, B.; Bain, C.; Witschi, J.; Hennekens, C.H.; Speizer, F.E. Reproducibility and validity of a semiquantitative food frequency questionnaire. Am. J. Epidemiol. 1985, 122, 51–65. [Google Scholar] [PubMed]
- Subar, A.F.; Thompson, F.E.; Kipnis, V.; Midthune, D.; Hurwitz, P.; McNutt, S.; McIntosh, A.; Rosenfeld, S. Comparative validation of the Block, Willett, and National Cancer Institute food frequency questionnaires: The Eating at America’s Table Study. Am. J. Epidemiol. 2001, 154, 1089–1099. [Google Scholar] [CrossRef] [PubMed]
- World Health Organization. Obesity: Preventing and Managing the Global Epidemic. Report of a WHO Consultation; WHO Technical Report Series 894; World Health Organization: Geneva, Switzerland, 2000. [Google Scholar]
- Bray, G.A. Contemporary Diagnosis and Management of Obesity and the Metabolic Syndrome, 3rd ed.; Handbooks in Health Care: Newtown, PA, USA, 2003. [Google Scholar]
- Canadian Council of Ministers of the Environment. Canadian Soil Quality Guidelines: SELENIUM-Environmental and Human Health Effects; Scientific Criteria Document; CCME: Winnipeg, MB, Canada, 2009. [Google Scholar]
- Ortega, R.M.; Rodríguez-Rodríguez, E.; Aparicio, A.; Jiménez-Ortega, A.I.; Palmeros, C.; Perea, J.M.; Navia, B.; López-Sobaler, A.M. Young children with excess of weight show an impaired selenium status. Int. J. Vitam. Nutr. Res. 2012, 82, 121–129. [Google Scholar] [CrossRef] [PubMed]
- Bucholz, E.M.; Desai, M.M.; Rosenthal, M.S. Dietary intake in Head Start vs. non-Head Start preschool-aged children: Results from the 1999–2004 National Health and Nutrition Examination Survey. J. Am. Diet. Assoc. 2011, 111, 1021–1030. [Google Scholar] [CrossRef] [PubMed]
- Laclaustra, M.; Stranges, S.; Navas-Acien, A.; Ordovas, J.M.; Guallar, E. Serum selenium and serum lipids in US adults: National Health and Nutrition Examination Survey (NHANES) 2003–2004. Atherosclerosis 2010, 210, 643–648. [Google Scholar] [CrossRef] [PubMed]
- Stranges, S.; Sieri, S.; Vinceti, M.; Grioni, S.; Guallar, E.; Laclaustra, M.; Muti, P.; Berrino, F.; Krogh, V. A prospective study of dietary selenium intake and risk of type 2 diabetes. BMC Public Health 2010, 10, 564. [Google Scholar] [CrossRef] [PubMed]
- Azab, S.F.; Saleh, S.H.; Elsaeed, W.F.; Elshafie, M.A.; Sherief, L.M.; Esh, A.M. Serum trace elements in obese Egyptian children: A case–control study. Ital. J. Pediatr. 2014, 40, 20. [Google Scholar] [CrossRef] [PubMed]
- Alasfar, F.; Ben-Nakhi, M.; Khoursheed, M.; Kehinde, E.O.; Alsaleh, M. Selenium is significantly depleted among morbidly obese female patients seeking bariatric surgery. Obes. Surg. 2011, 21, 1710–1713. [Google Scholar] [CrossRef] [PubMed]
- Hakkak, R. Obesity Decreases Serum Selenium Levels in a Mammary Tumor Zucker Rat Model. Vitam. Trace Elem. 2012, 1, 1000106. [Google Scholar] [CrossRef]
- Kuk, J.L.; Saunders, T.J.; Davidson, L.E.; Ross, R. Age-related changes in total and regional fat distribution. Ageing Res. Rev. 2009, 8, 339–348. [Google Scholar] [CrossRef] [PubMed]
- Economos, C.D.; Hatfield, D.P.; King, A.C.; Ayala, G.X.; Ann Pentz, M. Food and physical activity environments: An energy balance approach for research and practice. Am. J. Prev. Med. 2015, 48, 620–629. [Google Scholar] [CrossRef] [PubMed]
- Ohkawara, K.; Tanaka, S.; Ishikawa-Takata, K.; Tabata, I. Twenty-four-hour analysis of elevated energy expenditure after physical activity in a metabolic chamber: Models of daily total energy expenditure. Am. J. Clin. Nutr. 2008, 87, 1268–1276. [Google Scholar] [PubMed]
- Geer, E.B.; Shen, W. Gender differences in insulin resistance, body composition, and energy balance. Gend. Med. 2009, 6, 60–75. [Google Scholar] [CrossRef] [PubMed]
- Arganini, C.; Saba, A.; Comitato, R.; Virgili, F.; Turrini, A. Gender Differences in Food Choice and Dietary Intake in Modern Western Societies. In Public Health - Social and Behavioral Health; Maddock, J., Ed.; INTECH Open Access Publisher: New York, NY, USA, 2012; pp. 83–102. [Google Scholar]
- Lovejoy, J.C.; Champagne, C.M.; de Jonge, L.; Xie, H.; Smith, S.R. Increased visceral fat and decreased energy expenditure during the menopausal transition. Int. J. Obes. 2008, 32, 949–958. [Google Scholar] [CrossRef] [PubMed]
- Chen, H.; Saad, S.; Sandow, S.L.; Bertrand, P.P. Cigarette smoking and brain regulation of energy homeostasis. Front. Pharmacol. 2012, 3, 147. [Google Scholar] [CrossRef] [PubMed]
- Caton, S.J.; Ball, M.; Ahern, A.; Hetherington, M.M. Dose-dependent effects of alcohol on appetite and food intake. Physiol. Behav. 2004, 81, 51–58. [Google Scholar] [CrossRef] [PubMed]
- Wang, X.; Zhang, W.; Chen, H.; Liao, N.; Wang, Z.; Zhang, X.; Hai, C. High selenium impairs hepatic insulin sensitivity through opposite regulation of ROS. Toxicol. Lett. 2014, 224, 16–23. [Google Scholar] [CrossRef] [PubMed]
- Netto, A.S.; Zanetti, M.A.; Claro, G.R.; de Melo, M.P.; Vilela, F.G.; Correa, L.B. Effects of copper and selenium supplementation on performance and lipid metabolism in confined brangus bulls. Asian-Australas. J. Anim. Sci. 2014, 27, 488–494. [Google Scholar] [CrossRef] [PubMed]
- Hawkes, W.C.; Keim, N.L. Dietary selenium intake modulates thyroid hormone and energy metabolism in men. J. Nutr. 2003, 133, 3443–3448. [Google Scholar] [PubMed]
- Navas-Carretero, S.; Cuervo, M.; Abete, I.; Zulet, M.A.; Martínez, J.A. Frequent consumption of selenium-enriched chicken meat by adults causes weight loss and maintains their antioxidant status. Biol. Trace Elem. Res. 2011, 143, 8–19. [Google Scholar] [CrossRef] [PubMed]
- Rangan, A.M.; Schindeler, S.; Hector, D.J.; Gill, T.P.; Webb, K.L. Consumption of “extra” foods by Australian adults: Types, quantities and contribution to energy and nutrient intakes. Eur. J. Clin. Nutr. 2009, 63, 865–871. [Google Scholar] [CrossRef] [PubMed]
- Paz-Tal, O.; Canfi, A.; Marko, R.; Katorza, E.; Karpas, Z.; Shai, I.; Schwarzfuchs, D.; Sheiner, E.K. Effect of changes in food groups intake on magnesium, zinc, copper, and selenium serum levels during 2 years of dietary intervention. J. Am. Coll. Nutr. 2015, 34, 1–14. [Google Scholar] [CrossRef] [PubMed]
- Chen, X.L.; Hausman, D.B.; Dean, R.G.; Hausman, G.J. Hormonal regulation of leptin mRNA expression and preadipocyte recruitment and differentiation in porcine primary cultures of S-V cells. Obes. Res. 1998, 6, 164–172. [Google Scholar] [CrossRef] [PubMed]
- Lee, K.; Hausman, D.B.; Dean, R.G. Expression of CCAAT/enhancer binding protein C/EBP alpha, beta and delta in rat adipose stromal-vascular cells in vitro. Biochim. Biophys. Acta 1999, 1450, 397–405. [Google Scholar] [CrossRef]
- Xia, Y.; Hill, K.E.; Li, P.; Xu, J.; Zhou, D.; Motley, A.K.; Wang, L.; Byrne, D.W.; Burk, R.F. Optimization of selenoprotein P and other plasma selenium biomarkers for the assessment of the selenium nutritional requirement: A placebo-controlled, double-blind study of selenomethionine supplementation in selenium-deficient Chinese subjects. Am. J. Clin. Nutr. 2010, 92, 525–531. [Google Scholar] [CrossRef] [PubMed]
- Ashton, K.; Hooper, L.; Harvey, L.J.; Hurst, R.; Casgrain, A.; Fairweather-Tait, S.J. Methods of assessment of selenium status in humans: A systematic review. Am. J. Clin. Nutr. 2009, 89, 2025S–2039S. [Google Scholar] [CrossRef] [PubMed]
- Harris, H.R.; Bergkvist, L.; Wolk, A. Selenium intake and breast cancer mortality in a cohort of Swedish women. Breast Cancer Res. Treat. 2012, 134, 1269–1277. [Google Scholar] [CrossRef] [PubMed]
- Karita, K.; Sasaki, S.; Ishihara, J.; Tsugane, S.; JPHC Study Group. Validity of a self-administered food frequency questionnaire used in the 5-year follow-up survey of the JPHC Study to assess selenium intake: Comparison with dietary records and blood levels. J. Epidemiol. 2003, 13, S92–S97. [Google Scholar] [CrossRef] [PubMed]
- Pounis, G.; Costanzo, S.; Persichillo, M.; de Curtis, A.; Sieri, S.; Vinceti, M.; Zito, F.; di Castelnuovo, A.F.; Donati, M.B.; de Gaetano, G.; et al. Mushroom and dietary selenium intakes in relation to fasting glucose levels in a free-living Italian adult population: The Moli-sani Project. Diabetes Metab. 2014, 40, 34–42. [Google Scholar] [CrossRef] [PubMed]
- Bjornberg, K.A.; Vahter, M.; Grawé, K.P.; Berglund, M. Methyl mercury exposure in Swedish women with high fish consumption. Sci. Total Environ. 2005, 341, 45–52. [Google Scholar] [CrossRef] [PubMed]
- Serra-Majem, L.; Pfrimer, K.; Doreste-Alonso, J.; Ribas-Barba, L.; Sánchez-Villegas, A.; Ortiz-Andrellucchi, A.; Henríquez-Sánchez, P. Dietary assessment methods for intakes of iron, calcium, selenium, zinc and iodine. Br. J. Nutr. 2009, 102, S38–S55. [Google Scholar] [CrossRef] [PubMed]
© 2016 by the authors; licensee MDPI, Basel, Switzerland. This article is an open access article distributed under the terms and conditions of the Creative Commons by Attribution (CC-BY) license (http://creativecommons.org/licenses/by/4.0/).
Share and Cite
Wang, Y.; Gao, X.; Pedram, P.; Shahidi, M.; Du, J.; Yi, Y.; Gulliver, W.; Zhang, H.; Sun, G. Significant Beneficial Association of High Dietary Selenium Intake with Reduced Body Fat in the CODING Study. Nutrients 2016, 8, 24. https://doi.org/10.3390/nu8010024
Wang Y, Gao X, Pedram P, Shahidi M, Du J, Yi Y, Gulliver W, Zhang H, Sun G. Significant Beneficial Association of High Dietary Selenium Intake with Reduced Body Fat in the CODING Study. Nutrients. 2016; 8(1):24. https://doi.org/10.3390/nu8010024
Chicago/Turabian StyleWang, Yongbo, Xiang Gao, Pardis Pedram, Mariam Shahidi, Jianling Du, Yanqing Yi, Wayne Gulliver, Hongwei Zhang, and Guang Sun. 2016. "Significant Beneficial Association of High Dietary Selenium Intake with Reduced Body Fat in the CODING Study" Nutrients 8, no. 1: 24. https://doi.org/10.3390/nu8010024
APA StyleWang, Y., Gao, X., Pedram, P., Shahidi, M., Du, J., Yi, Y., Gulliver, W., Zhang, H., & Sun, G. (2016). Significant Beneficial Association of High Dietary Selenium Intake with Reduced Body Fat in the CODING Study. Nutrients, 8(1), 24. https://doi.org/10.3390/nu8010024