The Relationship between Serum 25-Hydroxyvitamin D Concentration, Cardiorespiratory Fitness, and Insulin Resistance in Japanese Men

Abstract
:1. Introduction
2. Materials and Methods
2.1. Subjects
2.2. Anthropometric Characteristics
2.3. Cardiorespiratory Fitness
2.4. Blood Sample Collection and Analysis
2.5. Statistical Analysis
3. Results

| Variable | All | Low CRF | High CRF | p | |||
|---|---|---|---|---|---|---|---|
| (n = 107) | (n = 53) | (n = 54) | |||||
| Age (years) | 65.0 | (61.0–70.0) | 67.0 | (61.5–71.0) | 65.0 | (60.8–70.0) | 0.300 |
| Height (cm) | 168.8 | (6.5) | 167.6 | (5.7) | 170.0 | (7.1) | 0.057 |
| Weight (kg) | 66.8 | (8.7) | 66.4 | (8.8) | 67.1 | (8.7) | 0.684 |
| BMI (kg/m2) | 23.4 | (2.3) | 23.6 | (2.4) | 23.1 | (2.1) | 0.328 |
| VFA (cm2) | 109.5 | (46.9) | 119.4 | (48.2) | 99.8 | (43.4) | 0.029 |
| SFA (cm2) | 82.5 | (58.5–120.9) | 77.8 | (58.8–127.3) | 91.1 | (56.1–113.7) | 0.528 |
| CRF (mL/kg/min) | 32.3 | (27.4–36.2) | 27.4 | (22.8–29.8) | 35.4 | (32.5–39.1) | <0.001 |
| Glucose (mg/dL) | 98.2 | (9.6) | 99.0 | (11.3) | 97.4 | (7.6) | 0.396 |
| HbA1c (%) | 5.0 | (0.3) | 5.1 | (0.3) | 4.9 | (0.2) | 0.032 |
| Insulin (μU/mL) | 5.0 | (3.5–6.5) | 5.8 | (4.0–8.1) | 4.3 | (3.0–5.9) | 0.002 |
| HOMA-IR | 1.14 | (0.86–1.66) | 1.37 | (0.94–1.94) | 1.04 | (0.72–1.37) | 0.002 |
| Total cholesterol (mg/dL) | 213.9 | (32.9) | 213.5 | (34.0) | 214.2 | (32.1) | 0.907 |
| HDL cholesterol (mg/dL) | 61.0 | (52.0–68.0) | 59.0 | (50.0–65.0) | 64.0 | (54.0–70.0) | 0.028 |
| LDL cholesterol (mg/dL) | 122.5 | (30.3) | 124.4 | (32.5) | 120.6 | (28.2) | 0.529 |
| Triglycerides (mg/dL) | 91.0 | (65.0–119.0) | 97.0 | (67.5–139.5) | 83.0 | (62.0–104.3) | 0.052 |
| 25(OH)D (nmol/L) | 36.3 | (26.4–50.2) | 33.2 | (22.0–38.8) | 45.3 | (29.6–66.8) | <0.001 |
| Vitamin D intake (μg/day) | 12.6 | (8.9–18.8) | 10.8 | (8.5–16.9) | 14.2 | (9.3–24.5) | 0.034 |
| Alcohol consumption (g/day) | 21.5 | (8.8–42.2) | 15.7 | (0.8–36.1) | 25.4 | (9.8–49.3) | 0.106 |
| Smoking status (%) | 51.4 | 60.4 | 42.6 | 0.066 | |||
| Medication use (%) | 29.0 | 28.3 | 29.6 | 0.880 | |||
| Variable | 25(OH)D (Age- and Season-Adjusted) | 25(OH)D (Age-, Season- and VFA-Adjusted) | ||
|---|---|---|---|---|
| r | p | r | p | |
| BMI (kg/m2) | −0.033 | 0.742 | 0.127 | 0.198 |
| VFA (cm2) | −0.199 | 0.042 | ||
| SFA (cm2) | 0.022 | 0.822 | 0.152 | 0.124 |
| CRF (mL/kg/min) | 0.370 | <0.001 | 0.340 | <0.001 |
| Glucose (mg/dL) | −0.009 | 0.929 | 0.000 | 0.999 |
| HbA1c (%) | −0.134 | 0.171 | −0.114 | 0.249 |
| Insulin (μU/mL) | −0.348 | <0.001 | −0.301 | 0.002 |
| HOMA-IR | −0.331 | 0.001 | −0.283 | 0.004 |
| Total cholesterol (mg/dL) | −0.015 | 0.879 | −0.027 | 0.782 |
| HDL cholesterol (mg/dL) | 0.247 | 0.011 | 0.198 | 0.044 |
| LDL cholesterol (mg/dL) | −0.087 | 0.375 | −0.081 | 0.416 |
| Triglycerides (mg/dL) | −0.304 | 0.002 | −0.251 | 0.010 |
| Vitamin D intake (μg/day) | 0.299 | 0.002 | 0.280 | 0.004 |
| Blood Variable | Low CRF | High CRF | CRF | 25(OH)D | Interaction | ||
|---|---|---|---|---|---|---|---|
| Low 25(OH)D | High 25(OH)D | Low 25(OH)D | High 25(OH)D | p | p | p | |
| (n = 34) | (n = 19) | (n = 19) | (n = 35) | ||||
| Glucose (mg/dL) | 98.1 ± 1.6 | 100.6 ± 2.2 | 98.2 ± 2.3 | 97.1 ± 1.7 | 0.409 | 0.743 | 0.343 |
| HbA1c (%) | 5.06 ± 0.05 | 5.06 ± 0.06 | 5.02 ± 0.07 | 4.92 ± 0.05 | 0.115 | 0.433 | 0.340 |
| Insulin (μU/mL) | 5.2 ± 1.08 | 6.03 ± 1.1 | 5.3 ± 1.11 | 4.02 ± 1.08 *,† | 0.034 | 0.494 | 0.016 |
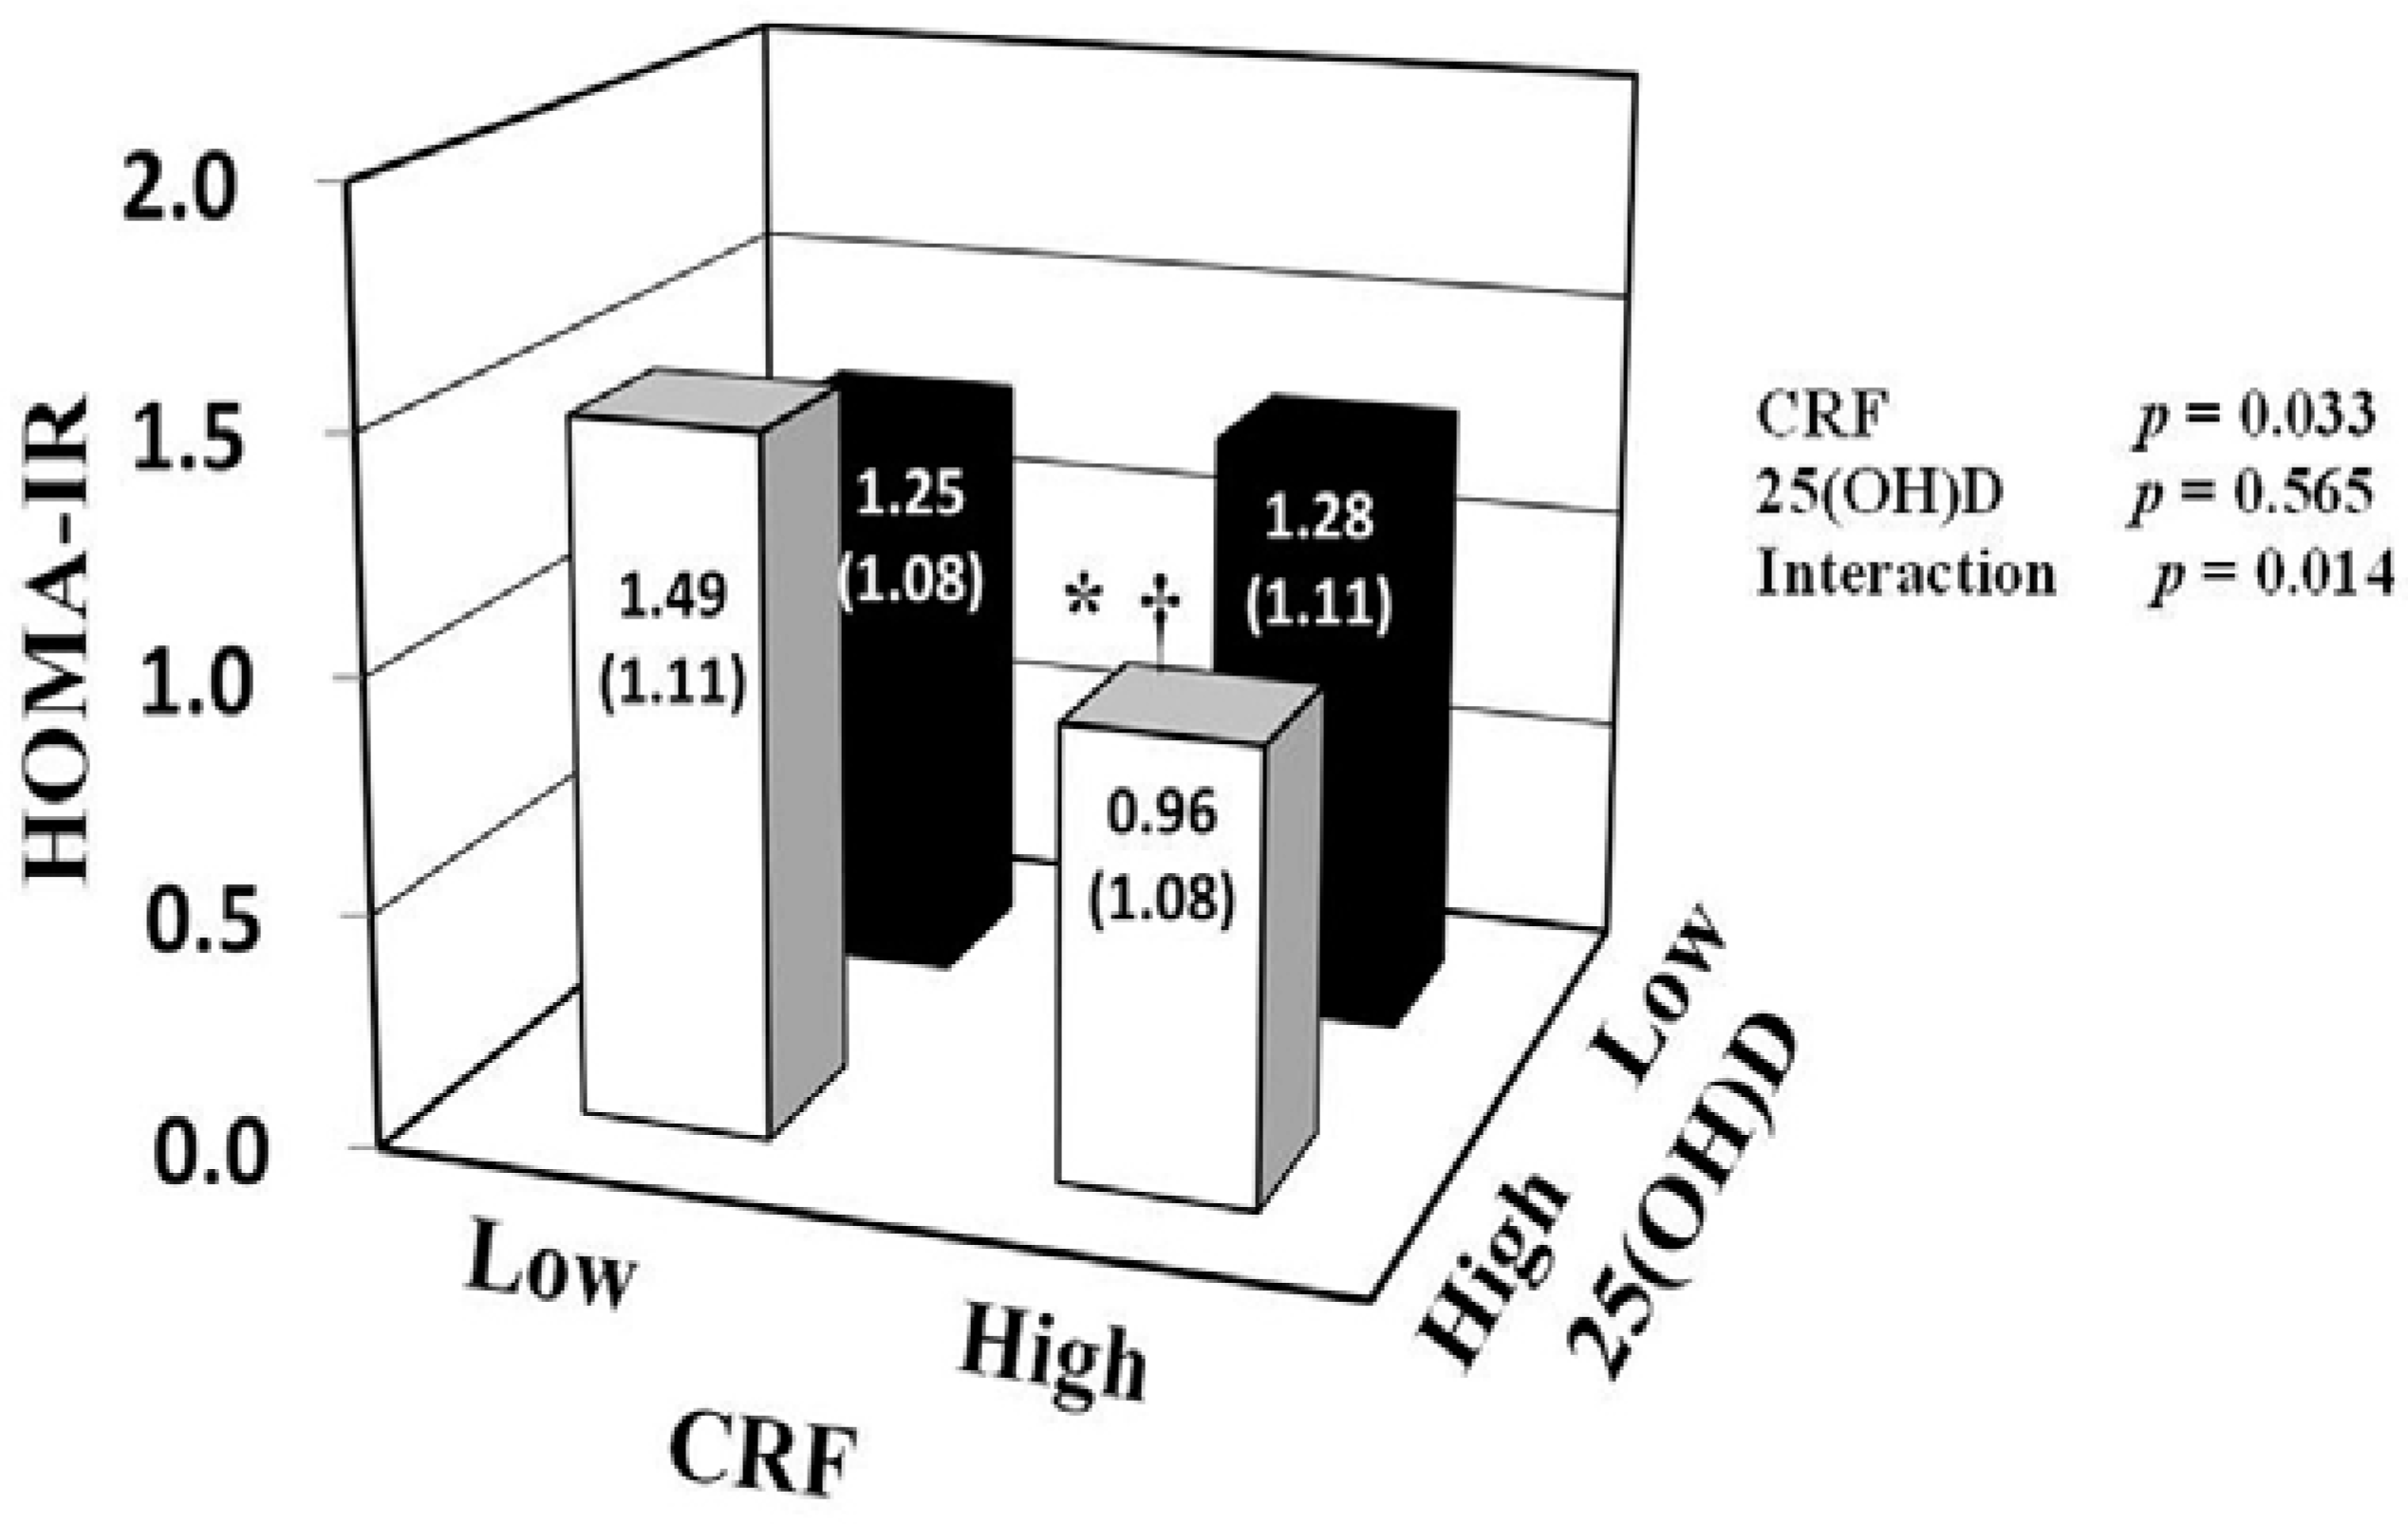
| HOMA-IR | 1.25 ± 1.08 | 1.49 ± 1.11 | 1.28 ± 1.11 | 0.96 ± 1.08 *,† | 0.033 | 0.565 | 0.014 |
| Triglycerides (mg/dL) | 103.5 ± 1.1 | 84 ± 1.1 | 88.9 ± 1.1 | 84.5 ± 1.1 | 0.458 | 0.200 | 0.403 |
| LDL cholesterol (mg/dL) | 126.9 ± 5.4 | 120.7 ± 7.2 | 118 ± 7.5 | 121.5 ± 5.5 | 0.541 | 0.842 | 0.442 |
| HDL cholesterol (mg/dL) | 60.3 ± 1 | 56.9 ± 1.1 | 57.8 ± 1.1 | 64.6 ± 1 | 0.368 | 0.582 | 0.058 |

4. Discussion
5. Conclusions
Acknowledgments and Funding
Author Contributions
Conflicts of interest
References
- Caballero, B. The global epidemic of obesity: An overview. Epidemiol. Rev. 2007, 29, 1–5. [Google Scholar] [CrossRef] [PubMed]
- Pisunyer, F.X. Health implications of obesity. Am. J. Clin. Nutr. 1991, 53, S1595–S1603. [Google Scholar]
- Yoon, K.H.; Lee, J.H.; Kim, J.W.; Cho, J.H.; Choi, Y.H.; Ko, S.H.; Zimmet, P.; Son, H.Y. Epidemic obesity and type 2 diabetes in Asia. Lancet 2006, 368, 1681–1688. [Google Scholar] [CrossRef] [PubMed]
- Sone, H.; Ito, H.; Ohashi, Y.; Akanuma, Y.; Yamada, N. Obesity and type 2 diabetes in Japanese patients. Lancet 2003, 361, 85. [Google Scholar] [CrossRef] [PubMed]
- Sun, X.; Cao, Z.B.; Zhang, Y.; Ishimi, Y.; Tabata, I.; Higuchi, M. Association between serum 25-hydroxyvitamin D and inflammatory cytokines in healthy adults. Nutrients 2014, 6, 221–230. [Google Scholar] [CrossRef] [PubMed]
- Parker, J.; Hashmi, O.; Dutton, D.; Mavrodaris, A.; Stranges, S.; Kandala, N.B.; Clarke, A.; Franco, O.H. Levels of vitamin D and cardiometabolic disorders: Systematic review and meta-analysis. Maturitas 2010, 65, 225–236. [Google Scholar] [CrossRef] [PubMed]
- Girgis, C.M.; Clifton-Bligh, R.J.; Turner, N.; Lau, S.L.; Gunton, J.E. Effects of vitamin D in skeletal muscle: Falls, strength, athletic performance and insulin sensitivity. Clin. Endocrinol. 2014, 80, 169–181. [Google Scholar] [CrossRef]
- Wacker, M.; Holick, M.F. Vitamin D-effects on skeletal and extraskeletal health and the need for supplementation. Nutrients 2013, 5, 111–148. [Google Scholar] [CrossRef] [PubMed]
- Scragg, R.; Holdaway, I.; Singh, V.; Metcalf, P.; Baker, J.; Dryson, E. Serum 25-hydroxyvitamin D3 levels decreased in impaired glucose tolerance and diabetes mellitus. Diabetes Res. Clin. Pract. 1995, 27, 181–188. [Google Scholar] [CrossRef] [PubMed]
- Cavalier, E.; Delanaye, P.; Souberbielle, J.C.; Radermecker, R.P. Vitamin D and type 2 diabetes mellitus: Where do we stand? Diabetes Metab. 2011, 37, 265–272. [Google Scholar] [CrossRef] [PubMed]
- Knekt, P.; Laaksonen, M.; Mattila, C.; Harkanen, T.; Marniemi, J.; Heliovaara, M.; Rissanen, H.; Montonen, J.; Reunanen, A. Serum vitamin D and subsequent occurrence of type 2 diabetes. Epidemiology 2008, 19, 666–671. [Google Scholar] [CrossRef] [PubMed]
- Gagnon, C.; Lu, Z.X.; Magliano, D.J.; Dunstan, D.W.; Shaw, J.E.; Zimmet, P.Z.; Sikaris, K.; Grantham, N.; Ebeling, P.R.; Daly, R.M. Serum 25-hydroxyvitamin D, calcium intake, and risk of type 2 diabetes after 5 years: Results from a national, population-based prospective study (the Australian diabetes, obesity and lifestyle study). Diabetes Care 2011, 34, 1133–1138. [Google Scholar] [CrossRef] [PubMed]
- Forouhi, N.G.; Luan, J.; Cooper, A.; Boucher, B.J.; Wareham, N.J. Baseline serum 25-hydroxy vitamin D is predictive of future glycemic status and insulin resistance: The medical research council ely prospective study 1990–2000. Diabetes 2008, 57, 2619–2625. [Google Scholar] [CrossRef] [PubMed]
- Liu, E.; Meigs, J.B.; Pittas, A.G.; McKeown, N.M.; Economos, C.D.; Booth, S.L.; Jacques, P.F. Plasma 25-hydroxyvitamin D is associated with markers of the insulin resistant phenotype in nondiabetic adults. J. Nutr. 2009, 139, 329–334. [Google Scholar] [CrossRef] [PubMed]
- Lee, D.C.; Sui, X.; Church, T.S.; Lee, I.M.; Blair, S.N. Associations of cardiorespiratory fitness and obesity with risks of impaired fasting glucose and type 2 diabetes in men. Diabetes Care 2009, 32, 257–262. [Google Scholar] [CrossRef] [PubMed]
- Yokoyama, H.; Emoto, M.; Araki, T.; Fujiwara, S.; Motoyama, K.; Morioka, T.; Koyama, H.; Shoji, T.; Okuno, Y.; Nishizawa, Y. Effect of aerobic exercise on plasma adiponectin levels and insulin resistance in type 2 diabetes. Diabetes Care 2004, 27, 1756–1758. [Google Scholar] [CrossRef] [PubMed]
- Tanisawa, K.; Ito, T.; Sun, X.; Ise, R.; Oshima, S.; Cao, Z.B.; Sakamoto, S.; Tanaka, M.; Higuchi, M. High cardiorespiratory fitness can reduce glycated hemoglobin levels regardless of polygenic risk for type 2 diabetes mellitus in non-diabetic Japanese men. Physiol. Genomics 2014, 46, 497–504. [Google Scholar] [CrossRef] [PubMed]
- Borghouts, L.B.; Keizer, H.A. Exercise and insulin sensitivity: A review. Int. J. Sports Med. 2000, 21, 1–12. [Google Scholar] [CrossRef] [PubMed]
- Kawakami, R.; Sawada, S.S.; Matsushita, M.; Okamoto, T.; Tsukamoto, K.; Higuchi, M.; Miyachi, M. Reference values for cardiorespiratory fitness and incidence of type 2 diabetes. J. Epidemiol. 2014, 24, 25–30. [Google Scholar] [CrossRef] [PubMed]
- Sieverdes, J.C.; Sui, X.; Lee, D.C.; Church, T.S.; McClain, A.; Hand, G.A.; Blair, S.N. Physical activity, cardiorespiratory fitness and the incidence of type 2 diabetes in a prospective study of men. Br. J. Sports Med. 2010, 44, 238–244. [Google Scholar] [CrossRef] [PubMed]
- Sawada, S.S.; Lee, I.M.; Naito, H.; Noguchi, J.; Tsukamoto, K.; Muto, T.; Higaki, Y.; Tanaka, H.; Blair, S.N. Long-term trends in cardiorespiratory fitness and the incidence of type 2 diabetes. Diabetes Care 2010, 33, 1353–1357. [Google Scholar] [CrossRef] [PubMed]
- Usui, C.; Asaka, M.; Kawano, H.; Aoyama, T.; Ishijima, T.; Sakamoto, S.; Higuchi, M. Visceral fat is a strong predictor of insulin resistance regardless of cardiorespiratory fitness in non-diabetic people. J. Nutr. Sci. Vitaminol. 2010, 56, 109–116. [Google Scholar] [CrossRef] [PubMed]
- Murakami, K.; Mizoue, T.; Sasaki, S.; Ohta, M.; Sato, M.; Matsushita, Y.; Mishima, N. Dietary intake of folate, other B vitamins, and omega-3 polyunsaturated fatty acids in relation to depressive symptoms in Japanese adults. Nutrition 2008, 24, 140–147. [Google Scholar] [CrossRef] [PubMed]
- Sawada, S.S.; Lee, I.M.; Muto, T.; Matuszaki, K.; Blair, S.N. Cardiorespiratory fitness and the incidence of type 2 diabetes: Prospective study of Japanese men. Diabetes Care 2003, 26, 2918–2922. [Google Scholar] [CrossRef] [PubMed]
- Kay, S.J.; Fiatarone Singh, M.A. The influence of physical activity on abdominal fat: A systematic review of the literature. Obes. Rev. 2006, 7, 183–200. [Google Scholar] [CrossRef] [PubMed]
- Blair, S.N.; Cheng, Y.; Holder, J.S. Is physical activity or physical fitness more important in defining health benefits? Med. Sci. Sports Exerc. 2001, 33, s379–399. [Google Scholar] [CrossRef] [PubMed]
- Kampert, J.B.; Blair, S.N.; Barlow, C.E.; Kohl, H.W., III. Physical activity, physical fitness, and all-cause and cancer mortality: A prospective study of men and women. Ann. Epidemiol. 1996, 6, 452–457. [Google Scholar] [CrossRef] [PubMed]
- Lee, D.C.; Sui, X.; Ortega, F.B.; Kim, Y.S.; Church, T.S.; Winett, R.A.; Ekelund, U.; Katzmarzyk, P.T.; Blair, S.N. Comparisons of leisure-time physical activity and cardiorespiratory fitness as predictors of all-cause mortality in men and women. Br. J. Sports Med. 2011, 45, 504–510. [Google Scholar] [CrossRef] [PubMed]
- Nibbelink, K.A.; Tishkoff, D.X.; Hershey, S.D.; Rahman, A.; Simpson, R.U. 1,25(OH)2D vitamin D3 actions on cell proliferation, size, gene expression, and receptor localization, in the HL-1 cardiac myocyte. J. Steroid Biochem. Mol. Biol. 2007, 103, 533–537. [Google Scholar] [CrossRef] [PubMed]
- Scragg, R.; Camargo, C.A. Frequency of leisure-time physical activity and serum 25-hydroxyvitamin D levels in the US population: Results from the third national health and nutrition examination survey. Am. J. Epidemiol. 2008, 168, 577–586. [Google Scholar] [CrossRef]
- Chiu, K.C.; Chu, A.; Go, V.L.; Saad, M.F. Hypovitaminosis D is associated with insulin resistance and β cell dysfunction. Am. J. Clin. Nutr. 2004, 79, 820–825. [Google Scholar] [PubMed]
- Zhang, L.; Qiao, Q.; Tuomilehto, J.; Hammar, N.; Alberti, K.G.M.M.; Eliasson, M.; Heine, R.J.; Stehouwer, C.D.A.; Ruotolo, G.; Grp, D.S. Blood lipid levels in relation to glucose status in European men and women without a prior history of diabetes: The decode study. Diabetes Res. Clin. Pract. 2008, 82, 364–377. [Google Scholar] [CrossRef] [PubMed]
- Sun, X.; Cao, Z.B.; Tanisawa, K.; Ito, T.; Osima, S.; Ishimi, Y.; Tabata, I.; Higuchi, M. Associations between the serum 25(OH)D concentration and lipid profiles in Japanese men. J. Atheroscler. Thromb. 2014. Available online: http://dx.doi.org/10.5551/jat.26070 (accessed on 27 October 2014). [CrossRef]
- Matthews, D.R.; Hosker, J.P.; Rudenski, A.S.; Naylor, B.A.; Treacher, D.F.; Turner, R.C. Homeostasis model assessment: Insulin resistance and beta-cell function from fasting plasma glucose and insulin concentrations in man. Diabetologia 1985, 28, 412–419. [Google Scholar] [CrossRef] [PubMed]
- Bonora, E.; Targher, G.; Alberiche, M.; Bonadonna, R.C.; Saggiani, F.; Zenere, M.B.; Monauni, T.; Muggeo, M. Homeostasis model assessment closely mirrors the glucose clamp technique in the assessment of insulin sensitivity: Studies in subjects with various degrees of glucose tolerance and insulin sensitivity. Diabetes Care 2000, 23, 57–63. [Google Scholar] [CrossRef] [PubMed]
© 2014 by the authors; licensee MDPI, Basel, Switzerland. This article is an open access article distributed under the terms and conditions of the Creative Commons Attribution license (http://creativecommons.org/licenses/by/4.0/).
Share and Cite
Sun, X.; Cao, Z.-B.; Tanisawa, K.; Ito, T.; Oshima, S.; Higuchi, M. The Relationship between Serum 25-Hydroxyvitamin D Concentration, Cardiorespiratory Fitness, and Insulin Resistance in Japanese Men. Nutrients 2015, 7, 91-102. https://doi.org/10.3390/nu7010091
Sun X, Cao Z-B, Tanisawa K, Ito T, Oshima S, Higuchi M. The Relationship between Serum 25-Hydroxyvitamin D Concentration, Cardiorespiratory Fitness, and Insulin Resistance in Japanese Men. Nutrients. 2015; 7(1):91-102. https://doi.org/10.3390/nu7010091
Chicago/Turabian StyleSun, Xiaomin, Zhen-Bo Cao, Kumpei Tanisawa, Tomoko Ito, Satomi Oshima, and Mitsuru Higuchi. 2015. "The Relationship between Serum 25-Hydroxyvitamin D Concentration, Cardiorespiratory Fitness, and Insulin Resistance in Japanese Men" Nutrients 7, no. 1: 91-102. https://doi.org/10.3390/nu7010091
APA StyleSun, X., Cao, Z.-B., Tanisawa, K., Ito, T., Oshima, S., & Higuchi, M. (2015). The Relationship between Serum 25-Hydroxyvitamin D Concentration, Cardiorespiratory Fitness, and Insulin Resistance in Japanese Men. Nutrients, 7(1), 91-102. https://doi.org/10.3390/nu7010091