Hepcidin-25, Mean Corpuscular Volume, and Ferritin as Predictors of Response to Oral Iron Supplementation in Hemodialysis Patients

Abstract
:1. Introduction
2. Experimental Section
2.1. Patient Population
2.2. Study Design
2.3. Measurements of Parameters
2.4. Statistical Analysis
3. Results

| Clinical Characteristics | Responder Group (n = 16) | Non-Responder Group (n = 35) | p-Value |
|---|---|---|---|
| Age (years) | 61.0 ± 14.1 | 75.8 ± 9.2 | 0.054 |
| Female (%) | 39.0 | 31.0 | 0.798 |
| Body mass index (kg/m2) | 21.8 ± 3.6 | 20.9 ± 2.5 | 0.859 |
| HD vintage (years) | 10.3 ± 9.2 | 6.9 ± 6.9 | 0.931 |
| spKt/V | 1.48 ± 0.35 | 1.36 ± 0.30 | 0.884 |
| Serum albumin (g/dL) | 3.4 ± 0.4 | 3.4 ± 0.4 | 0.578 |
| Serum prealbumin (mg/dL) | 29.1 ± 6.5 | 30.5 ± 9.3 | 0.288 |
| Serum calcium (mg/dL) | 9.3 ± 1.1 | 9.1 ± 0.8 | 0.739 |
| Serum phosphorus (mg/dL) | 5.3 ± 1.7 | 5.7 ± 1.5 | 0.183 |
| i-PTH (pg/mL) | 107.9 ± 102.4 | 93.9 ± 79.6 | 0.701 |
| CRP (mg/L) | 0.97 ± 0.65 | 1.62 ± 2.34 | 0.142 |
| CERA dose (IU/kg/week) | 0.95 ± 0.52 | 0.77 ± 0.37 | 0.885 |
| Comorbidities (%) | |||
| Diabetes mellitus | 43.8 | 22.9 | 0.129 |
| Hypertension | 81.3 | 88.6 | 0.684 |
| Coronary artery disease | 56.3 | 45.7 | 0.485 |
| Congestive heart failure | 18.8 | 14.3 | 0.684 |
| Vascular disease | 56.3 | 40.0 | 0.279 |
| Variable | Responder Group (n = 16) | Non-Responder Group (n = 35) |
|---|---|---|
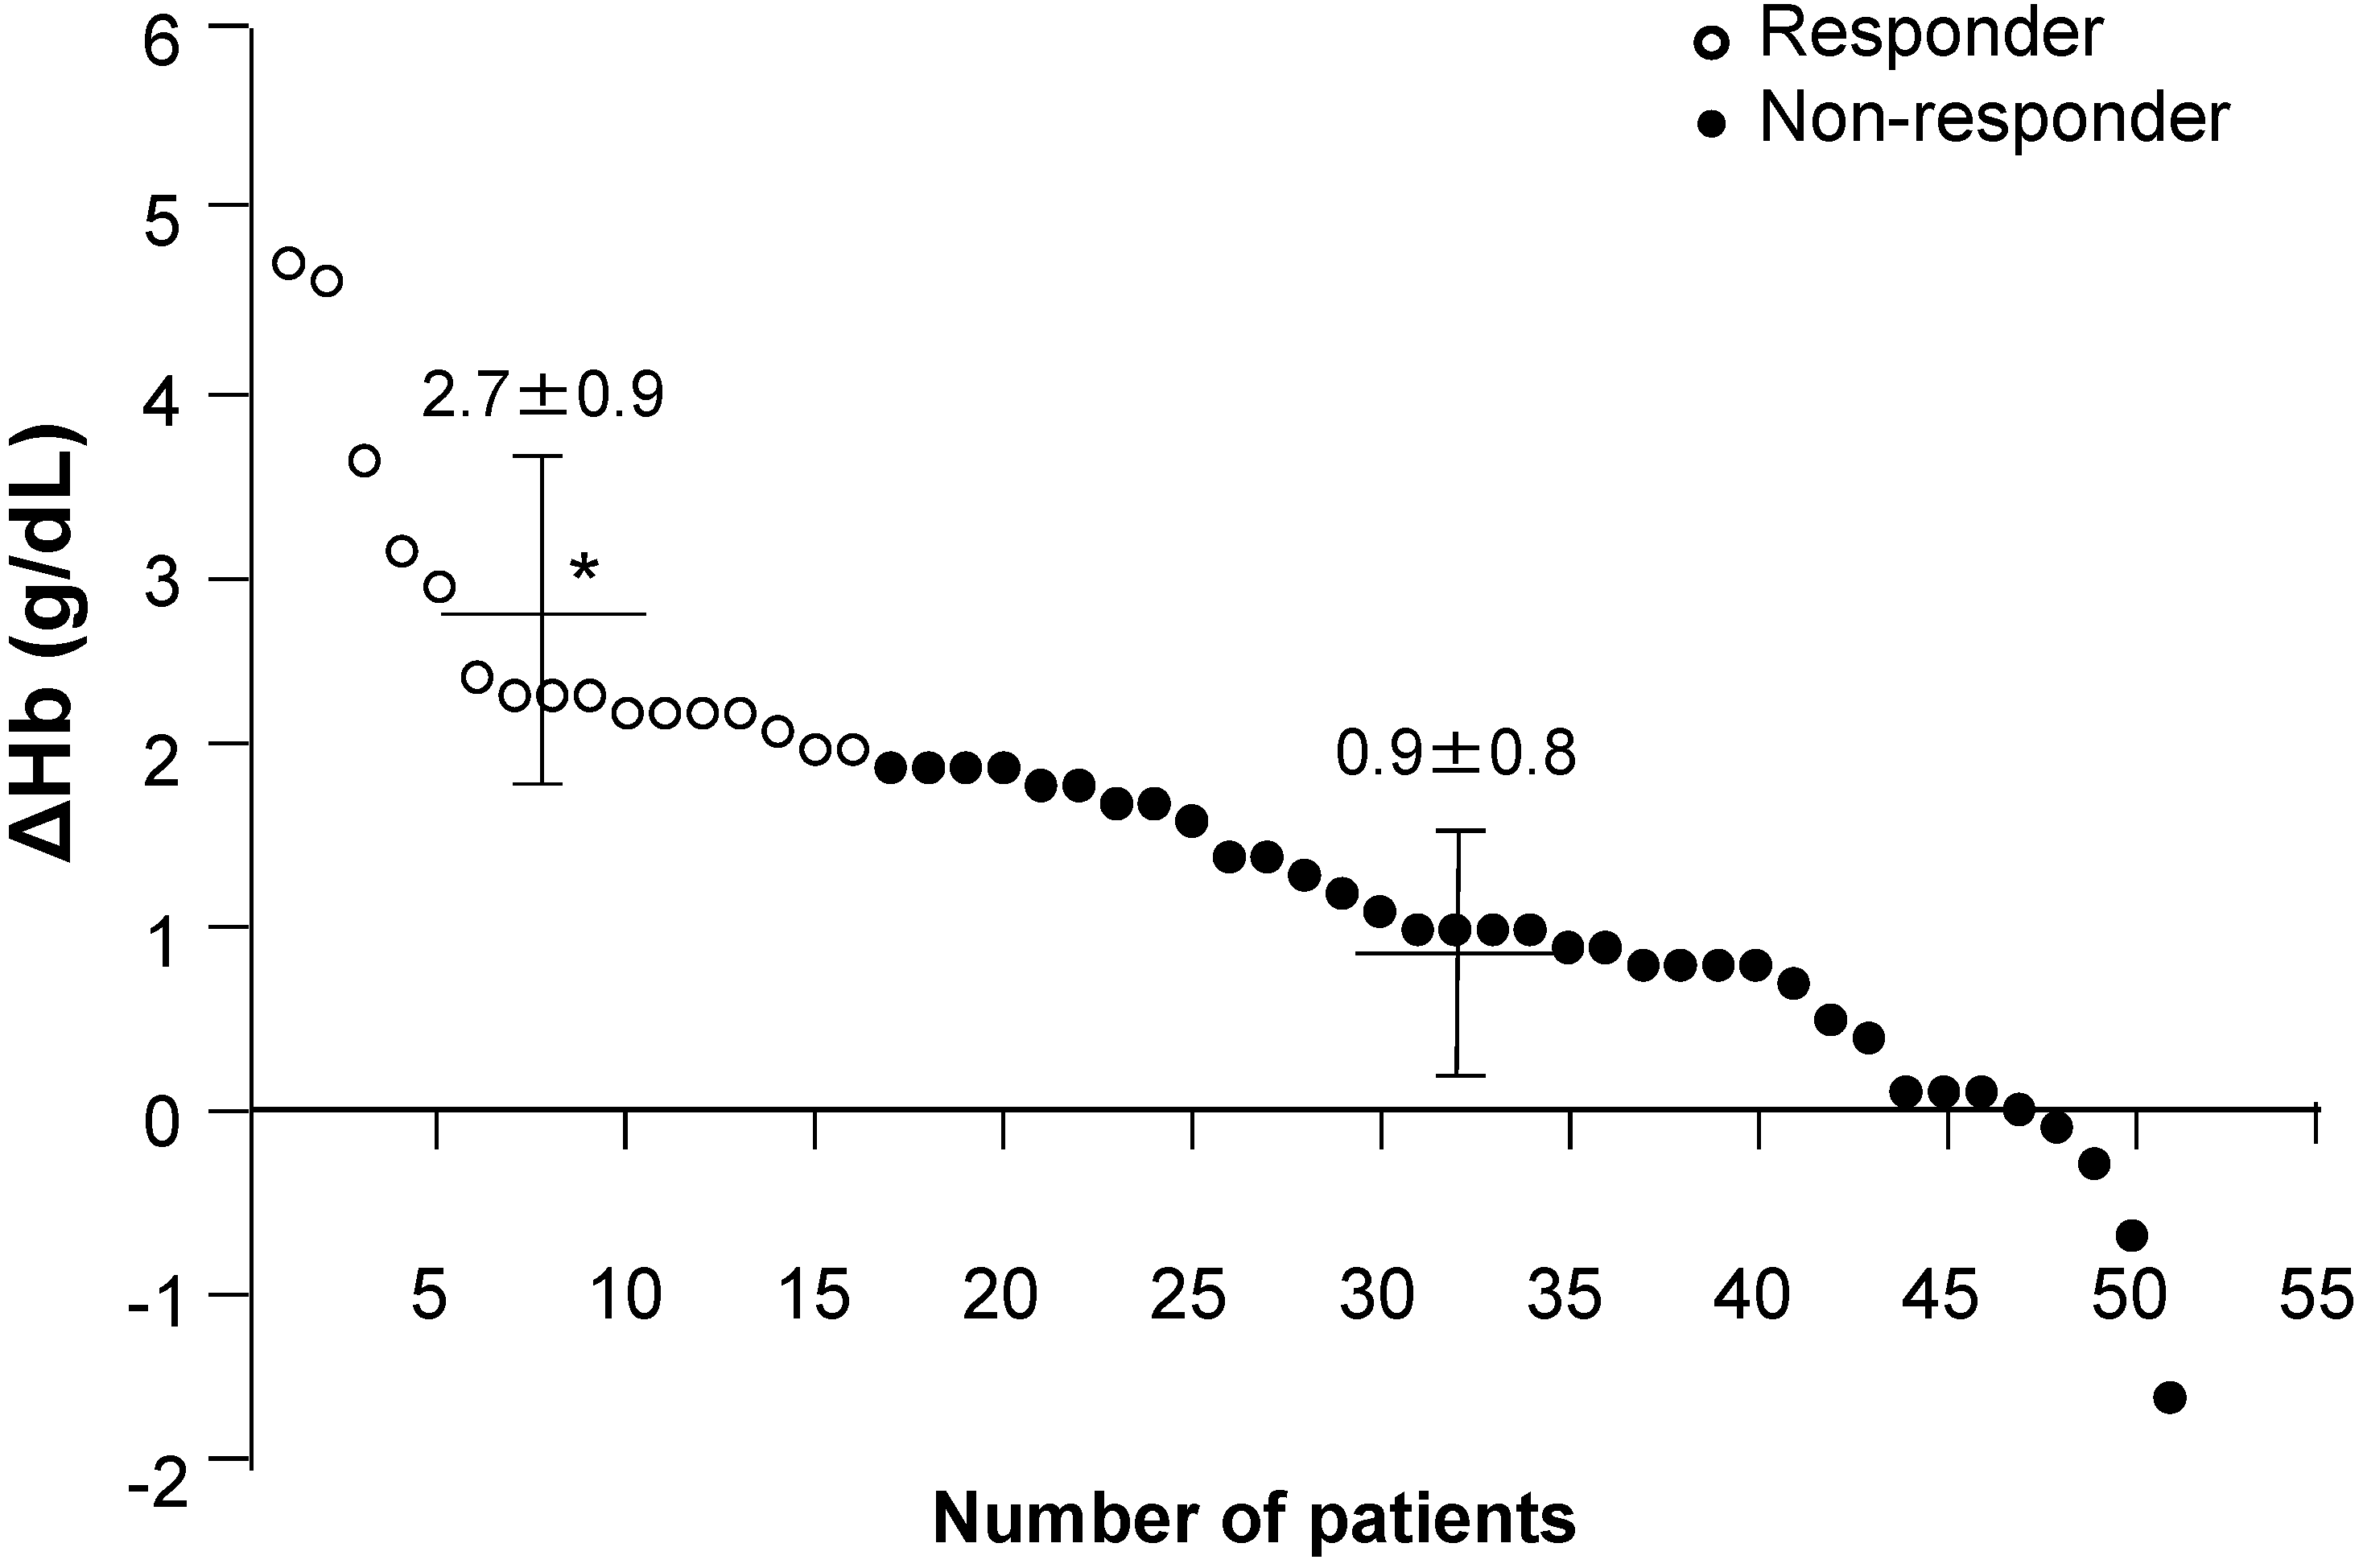
| Hb 3 months before study (g/dL) | 9.5 ± 0.9 * | 10.3 ± 1.3 |
| Hb at start of study (g/dL) | 8.8 ± 1.2 * # | 10.1 ± 1.3 |
| Serum hepcidin-25 (ng/mL) | 10.8 ± 16.7 * | 32.8 ± 38.3 |
| MCV (fL) | 85.1 ± 5.3 * | 89.2 ± 3.7 |
| Serum ferritin 3 months before study (ng/mL) | 19.8 ± 12.3 | 30.6 ± 30.4 |
| Serum ferritin at start of study (ng/mL) | 17.7 ± 17.5 * | 33.5 ± 24.2 |
| Serum iron (μg/dL) | 67.3 ± 21.3 | 77.8 ± 28.7 |
| TIBC (μg/dL) | 307.8 ± 59.2 | 278.7 ± 42.3 |
| Serum transferrin (mg/dL) | 239.8 ± 49.0 * | 214.2 ± 38.3 |
| TSAT (%) | 22.9 ± 8.6 * | 30.0 ± 14.7 |
| Variable | R | p-Value | 95% CI |
|---|---|---|---|
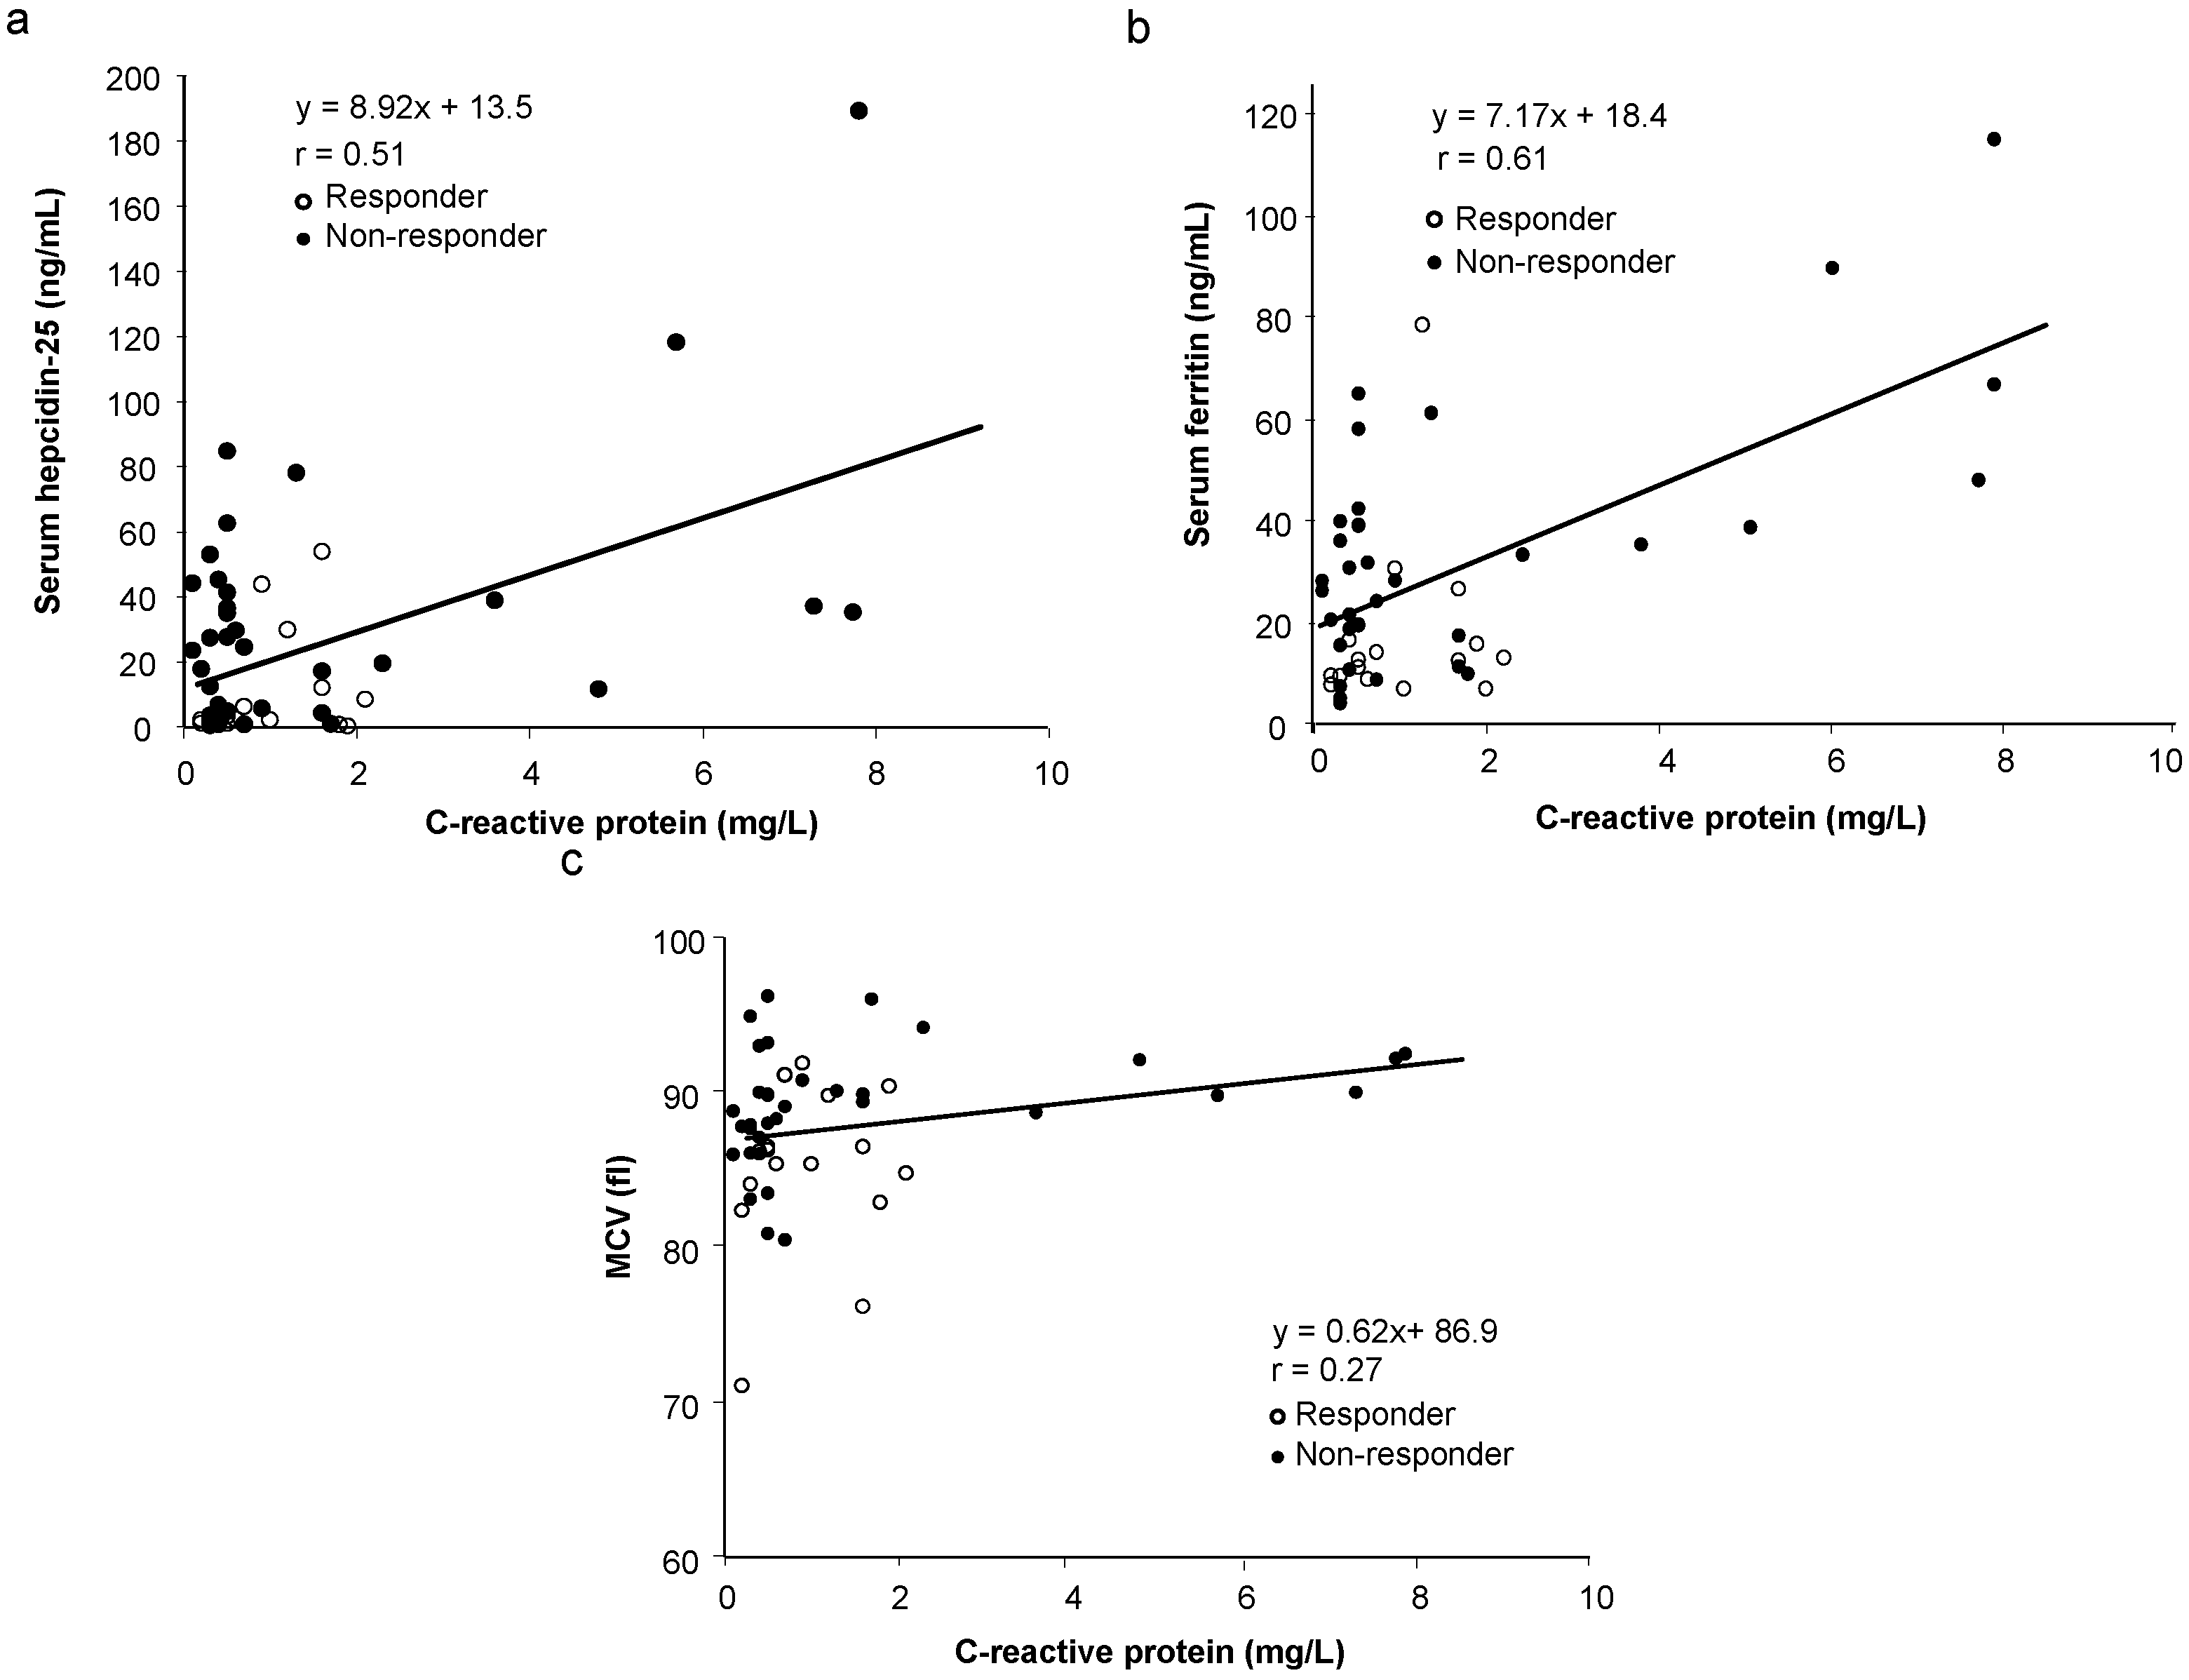
| Serum hepcidin-25 and ferritin | 0.86 | 0.0001 * | [0.77, 0.92] |
| Serum hepcidin-25 and baseline Hb | 0.44 | 0.0006 * | [0.19, 0.64] |
| Serum hepcidin-25 and MCV | 0.20 | 0.1655 | [−0.08, 0.45] |
| MCV and baseline Hb | 0.30 | 0.0167 * | [0.02, 0.53] |
| MCV and serum ferritin | 0.05 | 0.3512 | [−0.22, 0.33] |
| Serum ferritin and baseline Hb | 0.51 | 0.0001 * | [0.27, 0.69] |
| Serum hepcidin-25 and ΔHb | −0.41 | 0.0016 * | [−0.61, −0.15] |
| MCV and ΔHb | −0.41 | 0.0013 * | [−0.61, 10.15] |
| Serum ferritin and ΔHb | −0.42 | 0.0010 * | [−0.63, −0.17] |
| Variable | Regression Coefficient | p-Value | 95% CI |
|---|---|---|---|
| Age | 0.001 | 0.920 | [−1.329, 0.462] |
| Gender | 0.001 | 0.998 | [−0.717, 0.719] |
| DM or non DM | −0.433 | 0.333 | [−1.329, 0.462] |
| Serum hepcidin-25 | −0.008 | 0.338 | [−0.026, 0.009] |
| Baseline Hb | −0.146 | 0.466 | [−0.550, 0.257] |
| MCV | −0.071 | 0.107 | [−0.159, −0.016] |
| Serum ferritin | −0.004 | 0.786 | [−0.037, 0.028] |
| Serum iron | 0.004 | 0.546 | [0.010, 0.018] |
| Serum transferrin | 0.007 | 0.671 | [−0.027, 0.041] |
| CRP | 1.095 | 0.289 | [−0.967, 0.157] |
| CERA dose | 0.343 | 0.487 | [−0.647, 1.334] |
| Variable | Regression Co-Efficient | F-value |
|---|---|---|
| Serum hepcidin-25 | −0.00750 | 2.711 ** |
| MCV | −0.06538 | 3.652 ** |
| Baseline Hb | −0.27063 | 4.388 ** |
4. Discussion
5. Conclusions
Acknowledgments
Author Contributions
Conflicts of Interest
References
- Albaramki, J.; Hodson, E.M.; Craig, J.C.; Webster, A.C. Parenteral versus oral iron therapy for adults and children with chronic kidney disease. Cochrane Database Syst. Rev. 2012, 1, CD007857. [Google Scholar] [CrossRef] [PubMed]
- Adhikary, L.; Acharya, S. Efficacy of IV iron compared to oral iron for increment of haemoglobin level in anemic chronic kidney disease patients on erythropoietin therapy. JNMA J. Nepal Med. Assoc. 2011, 51, 133–136. [Google Scholar] [PubMed]
- Liles, A.M. Intravenous versus oral iron for treatment of iron deficiency in non-hemodialysis-dependent patients with chronic kidney disease. Am. J. Health Syst. Pharm. 2012, 69, 1206–1211. [Google Scholar] [CrossRef]
- Lenga, I.; Lok, C.; Marticorena, R.; Hunter, J.; Dacouris, N.; Goldstein, M. Role of oral iron in the management of long-term hemodialysis patients. Clin. J. Am. Soc. Nephrol. 2007, 2, 688–693. [Google Scholar] [CrossRef] [PubMed]
- Tsuchida, A.; Paudyal, B.; Paudyal, P.; Ishii, Y.; Hiromura, K.; Nojima, Y.; Komai, M. Effectiveness of oral iron to manage anemia in long-term hemodialysis patients with the use of ultrapure dialysate. Exp. Ther. Med. 2010, 1, 777–781. [Google Scholar] [PubMed]
- Hastka, J.; Lasserre, J.J.; Schwarzbeck, A.; Reiter, A.; Hehlmann, R. Laboratory tests of iron status: Correlation or common sense? Clin. Chem. 1996, 42, 718–724. [Google Scholar] [PubMed]
- Johnson-Wimbley, T.D.; Graham, D.Y. Diagnosis and management of iron deficiency anemia in the 21st century. Ther. Adv. Gastroenterol. 2011, 4, 177–184. [Google Scholar] [CrossRef]
- Pasricha, S.R.; Flecknoe-Brown, S.C.; Allen, K.J.; Gibson, P.R.; McMahon, L.P.; Olynyk, J.K.; Roger, S.D.; Savoia, H.F.; Tampi, R.; Thomson, A.R.; et al. Diagnosis and management of iron deficiency anaemia: A clinical update. Med. J. Aust. 2010, 193, 525–532. [Google Scholar]
- Iolascon, A.; de Falco, L.; Beaumont, C. Molecular basis of inherited microcytic anemia due to defects in iron acquisition or heme synthesis. Haematologica 2009, 94, 395–408. [Google Scholar] [CrossRef] [PubMed]
- Ganz, T. Hepcidin and iron regulation, 10 years later. Blood 2011, 117, 4425–4433. [Google Scholar] [CrossRef] [PubMed]
- Mercadel, L.; Metzger, M.; Haymann, J.P.; Thervet, E.; Boffa, J.J.; Flamant, M.; Vrtovsnik, F.; Houillier, P.; Froissart, M.; Stengel, B.; et al. The relation of hepcidin to iron disorders, inflammation and hemoglobin in chronic kidney disease. PLoS One 2014, 9, e99781. [Google Scholar] [CrossRef] [PubMed]
- Malyszko, J.; Malyszko, J.S.; Mysliwiec, M. Serum prohepcidin and hepcidin in hemodialyzed patients undergoing iron therapy. Kidney Blood Press. Res. 2009, 32, 235–238. [Google Scholar] [CrossRef] [PubMed]
- Tessitore, N.; Girelli, D.; Campostrini, N.; Bedogna, V.; Pietro Solero, G.; Castagna, A.; Melilli, E.; Mantovani, W.; de Matteis, G.; Olivieri, O.; et al. Hepcidin is not useful as a biomarker for iron needs in haemodialysis patients on maintenance erythropoiesis-stimulating agents. Nephrol. Dial. Transplant. 2010, 25, 3996–4002. [Google Scholar] [CrossRef]
- Kato, A.; Tsuji, T.; Luo, J.; Sakao, Y.; Yasuda, H.; Hishida, A. Association of prohepcidin and hepcidin-25 with erythropoietin response and ferritin in hemodialysis patients. Am. J. Nephrol. 2008, 28, 115–121. [Google Scholar] [CrossRef] [PubMed]
- Kuragano, T.; Shimonaka, Y.; Kida, A.; Furuta, M.; Nanami, M.; Otaki, Y.; Hasuike, Y.; Nonoguchi, H. Determinants of hepcidin in patients on maintenance hemodialysis: Role of inflammation. Am. J. Nephrol. 2010, 31, 534–540. [Google Scholar] [CrossRef] [PubMed]
- Van der Weerd, N.C.; Grooteman, M.P.; Bots, M.L.; van den Dorpel, M.A.; den Hoedt, C.H.; Mazairac, A.H.; Nubé, M.J.; Penne, E.L.; Gaillard, C.A.; Wetzels, J.F.; et al. Hepcidin-25 in chronic hemodialysis patients is related to residual kidney function and not to treatment with erythropoiesis stimulating agents. PLoS One 2012, 7, e39783. [Google Scholar] [CrossRef]
- Uehata, T.; Tomosugi, N.; Shoji, T.; Sakaguchi, Y.; Suzuki, A.; Kaneko, T.; Okada, N.; Yamamoto, R.; Nagasawa, Y.; Kato, K.; et al. Serum hepcidin-25 levels and anemia in non-dialysis chronic kidney disease patients: A cross-sectional study. Nephrol. Dial. Transplant. 2012, 27, 1076–1083. [Google Scholar] [CrossRef]
- Peters, H.P.; Laarakkers, C.M.; Swinkels, D.W.; Wetzels, J.F. Serum hepcidin-25 levels in patients with chronic kidney disease are independent of glomerular filtration rate. Nephrol. Dial. Transplant. 2010, 25, 848–853. [Google Scholar] [CrossRef] [PubMed]
- Takasawa, K.; Tomosugi, N.; Takaeda, C.; Maeda, T.; Ueda, N. Regulation of hepcidin-25 by short-and long-acting rhEPO may be dependent on ferritin and predict the response to rhEPO in hemodialysis patients. Nephron Extra 2014, 4, 55–63. [Google Scholar] [CrossRef] [PubMed]
- Thomas, C.; Kobold, U.; Balan, S.; Roeddiger, R.; Thomas, L. Serum hepcidin-25 may replace the ferritin index in the Thomas plot in assessing iron status in anemic patients. Int. J. Lab. Hematol. 2011, 33, 187–193. [Google Scholar] [CrossRef] [PubMed]
- Bregman, D.B.; Morris, D.; Koch, T.A.; He, A.; Goodnough, L.T. Hepcidin levels predict nonresponsiveness to oral iron therapy in patients with iron deficiency anemia. Am. J. Hematol. 2013, 88, 97–101. [Google Scholar] [CrossRef] [PubMed]
- Chand, S.; Ward, D.G.; Ng, Z.Y.; Hodson, J.; Kirby, H.; Steele, P.; Rooplal, I.; Bantugon, F.; Iqbal, T.; Tselepis, C.; et al. Serum hepcidin-25 and response to intravenous iron in patients with non-dialysis chronic kidney disease. J. Nephrol. 2014, 2014. [Google Scholar] [CrossRef]
- Chen, Y.C.; Hung, S.C.; Tarng, D.C. Association between transferrin receptor-ferritin index and conventional measures of iron responsiveness in hemodialysis patients. Am. J. Kidney Dis. 2006, 47, 1036–1044. [Google Scholar] [CrossRef] [PubMed]
- Zlotkin, S.; Arthur, P.; Antwi, K.Y.; Yeung, G. Treatment of anemia with microencapsulated ferrous fumarate plus ascorbic acid supplied as sprinkles to complementary (weaning) foods. Am. J. Clin. Nutr. 2001, 74, 791–795. [Google Scholar] [PubMed]
- DeLong, E.R.; DeLong, D.M.; Clarke-Pearson, D.L. Comparing the areas under two or more correlated receiver operating characteristic curves: A nonparametric approach. Biometrics 1988, 44, 837–845. [Google Scholar] [CrossRef] [PubMed]
- Zimmermann, J.; Herrlinger, S.; Pruy, A.; Metzger, T.; Wanner, C. Inflammation enhances cardiovascular risk and mortality in hemodialysis patients. Kidney Int. 1999, 55, 648–658. [Google Scholar] [CrossRef] [PubMed]
- Peters, H.P.; Rumjon, A.; Bansal, S.S.; Laarakkers, C.M.; van den Brand, J.A.; Sarafidis, P.; Musto, R.; Malyszko, J.; Swinkels, D.W.; Wetzels, J.F.; et al. Intra-individual variability of serum hepcidin-25 in haemodialysis patients using mass spectrometry and ELISA. Nephrol. Dial. Transplant. 2012, 27, 3923–3929. [Google Scholar] [CrossRef]
- Ford, B.A.; Eby, C.S.; Scott, M.G.; Coyne, D.W. Intra-individual variability in serum hepcidin precludes its use as a marker of iron status in hemodialysis patients. Kidney Int. 2010, 78, 769–773. [Google Scholar] [CrossRef] [PubMed]
- Macdougall, I.C.; Malyszko, J.; Hider, R.C.; Bansal, S.S. Current status of the measurement of blood hepcidin levels in chronic kidney disease. Clin. J. Am. Soc. Nephrol. 2010, 5, 1681–1689. [Google Scholar] [CrossRef] [PubMed]
- Hsu, S.P.; Chiang, C.K.; Chien, C.T.; Hung, K.Y. Plasma prohepcidin positively correlates with hematocrit in chronic hemodialysis patients. Blood Purif. 2006, 24, 311–316. [Google Scholar] [CrossRef] [PubMed]
- Nakanishi, T.; Kuragano, T.; Kaibe, S.; Nagasawa, Y.; Hasuike, Y. Should we reconsider iron administration based on prevailing ferritin and hepcidin concentrations? Clin. Exp. Nephrol. 2012, 16, 819–826. [Google Scholar] [CrossRef] [PubMed]
- Goldwasser, P.; Koutelos, T.; Abraham, S.; Avram, M.M. Serum ferritin, hematocrit and mean corpuscular volume in hemodialysis. Nephron 1994, 67, 30–35. [Google Scholar] [CrossRef]
- Lynn, K.L.; Mitchell, T.R.; Shepperd, J. Red cell indices and iron stores in patients undergoing haemodialysis. Br. Med. J. (Clin. Res. Ed.) 1981, 282, 2096. [Google Scholar] [CrossRef]
- Gokal, R.; Weatherall, D.J.; Bunch, C. Iron induced increase in red cell size in haemodialysis patients. Q. J. Med. 1979, 48, 393–401. [Google Scholar] [PubMed]
- Nuwayri-Salti, N.; Jabre, F.; Daouk, M.; Sa’ab, G.; Salem, Z. Hematologic parameters and iron stores in patients on hemodialysis for chronic renal failure. Clin. Nephrol. 1992, 38, 101–104. [Google Scholar] [PubMed]
- Moreb, J.; Popovtzer, M.M.; Friedlaender, M.M.; Konijn, A.M.; Hershko, C. Evaluation of iron status in patients on chronic hemodialysis: Relative usefulness of bone marrow hemosiderin, serum ferritin, transferrin saturation, mean corpuscular volume and red cell protoporphyrin. Nephron 1983, 35, 196–200. [Google Scholar] [CrossRef] [PubMed]
- Markowitz, G.S.; Kahn, G.A.; Feingold, R.E.; Coco, M.; Lynn, R.I. An evaluation of the effectiveness of oral iron therapy in hemodialysis patients receiving recombinant human erythropoietin. Clin. Nephrol. 1997, 48, 34–40. [Google Scholar] [PubMed]
- Majoni, S.W.; Ellis, J.A.; Hall, H.; Abeyaratne, A.; Lawton, P.D. Inflammation, high ferritin, and erythropoietin resistance in indigenous maintenance hemodialysis patients from the Top End of Northern Australia. Hemodial. Int. 2014. [Google Scholar] [CrossRef]
- Zimmermann, M.B.; Troesch, B.; Biebinger, R.; Egli, I.; Zeder, C.; Hurrell, R.F. Plasma hepcidin is a modest predictor of dietary iron bioavailability in humans, whereas oral iron loading, measured by stable-isotope appearance curves, increases plasma hepcidin. Am. J. Clin. Nutr. 2009, 90, 1280–1287. [Google Scholar] [CrossRef] [PubMed]
- Pasricha, S.R.; Atkinson, S.H.; Armitage, A.E.; Khandwala, S.; Veenemans, J.; Cox, S.E.; Eddowes, L.A.; Hayes, T.; Doherty, C.P.; Demir, A.Y.; et al. Expression of the iron hormone hepcidin distinguishes different types of anemia in African children. Sci. Transl. Med. 2014, 6, 235re3. [Google Scholar] [CrossRef] [PubMed]
- Singh, A.K.; Coyne, D.W.; Shapiro, W.; Rizkala, A.R.; the DRIVE Study Group. Predictors of the response to treatment in anemic hemodialysis patients with high serum ferritin and low transferrin saturation. Kidney Int. 2007, 71, 1163–1171. [Google Scholar] [CrossRef] [PubMed]
- Wright, C.M.; Kelly, J.; Trail, A.; Parkinson, K.N.; Summerfield, G. The diagnosis of borderline iron deficiency: Results of a therapeutic trial. Arch. Dis. Child. 2004, 89, 1028–1031. [Google Scholar] [CrossRef] [PubMed]
- Vreugdenhil, G.; Baltus, J.A.; van Eijk, H.G.; Swaak, A.J. Prediction and evaluation of the effect of iron treatment in anaemic RA patients. Clin. Rheumatol. 1989, 8, 352–362. [Google Scholar] [CrossRef]
- Macdougall, I.C. Strategies for iron supplementation: Oral versus intravenous. Kidney Int. Suppl. 1999, 69, S61–S66. [Google Scholar] [CrossRef] [PubMed]
© 2014 by the authors; licensee MDPI, Basel, Switzerland. This article is an open access article distributed under the terms and conditions of the Creative Commons Attribution license (http://creativecommons.org/licenses/by/4.0/).
Share and Cite
Takasawa, K.; Takaeda, C.; Maeda, T.; Ueda, N. Hepcidin-25, Mean Corpuscular Volume, and Ferritin as Predictors of Response to Oral Iron Supplementation in Hemodialysis Patients. Nutrients 2015, 7, 103-118. https://doi.org/10.3390/nu7010103
Takasawa K, Takaeda C, Maeda T, Ueda N. Hepcidin-25, Mean Corpuscular Volume, and Ferritin as Predictors of Response to Oral Iron Supplementation in Hemodialysis Patients. Nutrients. 2015; 7(1):103-118. https://doi.org/10.3390/nu7010103
Chicago/Turabian StyleTakasawa, Kazuya, Chikako Takaeda, Teiryo Maeda, and Norishi Ueda. 2015. "Hepcidin-25, Mean Corpuscular Volume, and Ferritin as Predictors of Response to Oral Iron Supplementation in Hemodialysis Patients" Nutrients 7, no. 1: 103-118. https://doi.org/10.3390/nu7010103
APA StyleTakasawa, K., Takaeda, C., Maeda, T., & Ueda, N. (2015). Hepcidin-25, Mean Corpuscular Volume, and Ferritin as Predictors of Response to Oral Iron Supplementation in Hemodialysis Patients. Nutrients, 7(1), 103-118. https://doi.org/10.3390/nu7010103