Assessing the Average Sodium Content of Prepacked Foods with Nutrition Declarations: The Importance of Sales Data


Abstract
:
1. Introduction
2. Experimental Section
2.1. Collection of Data
2.2. Calculation of the Average Sodium Content per (Sub)Category
2.3. Assessment of the Use of Sodium-Related Nutrition and Health Claims
2.4. Statistical Analyses
3. Results

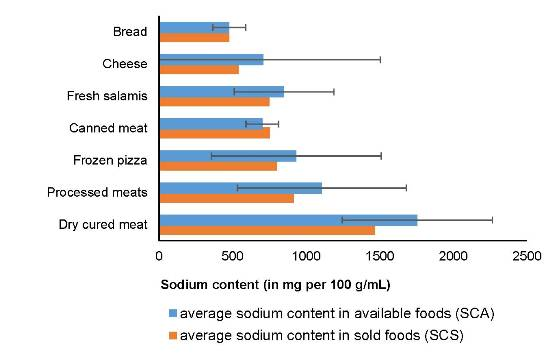
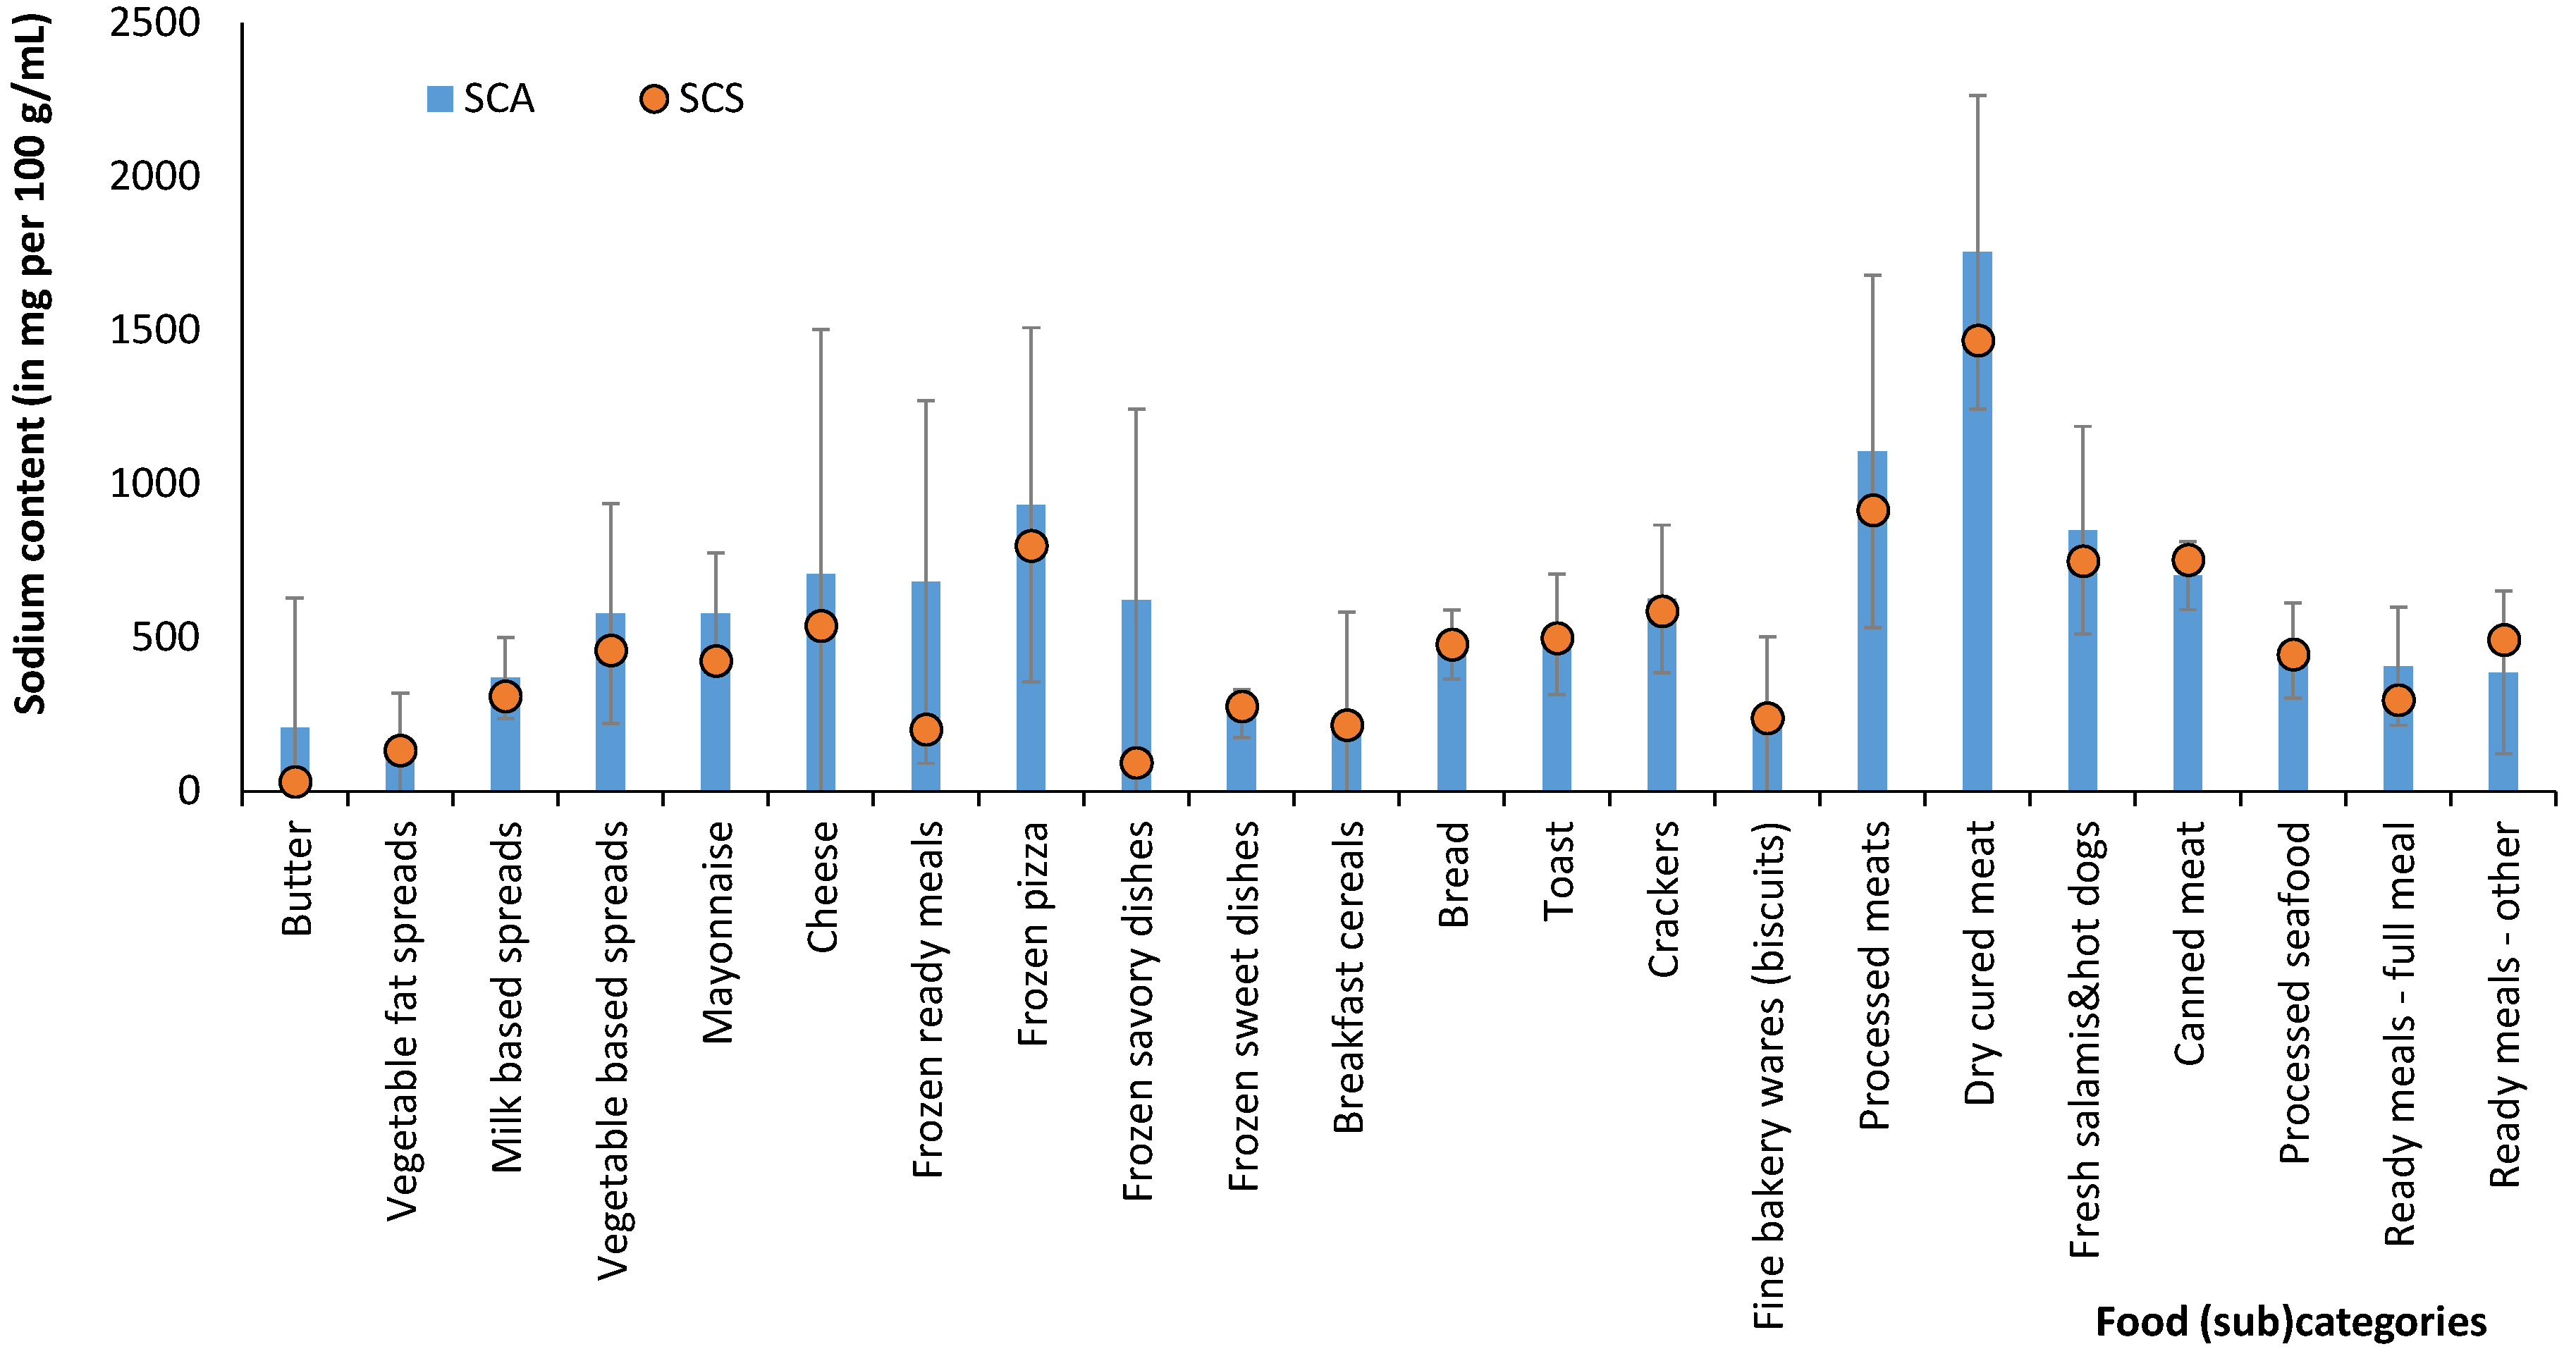
| Food Category | N | % LSC 1 | Average Sodium Content (mg per 100 g/mL) | SAR: SCS/SCA Ratio 4 | |
|---|---|---|---|---|---|
| SCA ± SD 2 | SCS 3 | ||||
| Milk | 53 | 36% | 42 ± 4 | 41 | 98% |
| Yoghurt and fermented milk drinks | 294 | 50% | 47 ± 41 | 42 | 91% |
| Butter and spreads | 196 | 47% | 345 ± 309 | 194 | 56% |
| Butter | 36 | 28% | 205 ± 423 | 31 | 15% |
| Vegetable fat spreads | 39 | 92% | 158 ± 160 | 133 | 84% |
| Milk-based spreads | 46 | 26% | 368 ± 131 | 309 | 84% |
| Vegetable-based spreads | 39 | 44% | 578 ± 357 | 459 | 79% |
| Mayonnaise | 36 | 47% | 576 ± 200 | 424 | 74% |
| Cheese | 335 | 11% | 707 ± 795 | 539 | 76% |
| Other dairy products | 138 | 26% | 49 ± 24 | 46 | 94% |
| Frozen fruit and vegetables | 111 | 32% | 37 ± 79 | 46 | 127% |
| Frozen ready meals | 239 | 17% | 681 ± 590 | 202 | 30% |
| Frozen pizza | 23 | 70% | 932 ± 577 | 799 | 86% |
| Frozen savory dishes | 155 | 11% | 622 ± 622 | 93 | 15% |
| Frozen sweet dishes | 61 | 11% | 253 ± 77 | 276 | 109% |
| Breakfast cereals | 276 | 82% | 228 ± 355 | 215 | 94% |
| Breads and similar products | 297 | 42% | 510 ± 257 | 510 | 100% |
| Bread | 121 | 25% | 477 ± 112 | 478 | 100% |
| Toast | 29 | 55% | 511 ± 196 | 499 | 98% |
| Crackers | 122 | 52% | 626 ± 240 | 587 | 94% |
| Fine bakery wares (biscuits) | 323 | 37% | 250 ± 253 | 239 | 95% |
| Soft drinks | 312 | 41% | 20 ± 35 | 21 | 104% |
| Energy drinks | 29 | 69% | 46 ± 27 | 41 | 88% |
| Isotonic and sport drinks | 20 | 90% | 44 ± 22 | 26 | 59% |
| Processed meats | 429 | 13% | 1,106 ± 573 | 915 | 83% |
| Dry cured meat | 107 | 16% | 1,754 ± 510 | 1467 | 84% |
| Fresh salamis & hot dogs | 201 | 17% | 849 ± 339 | 749 | 88% |
| Canned meat | 121 | 4% | 702 ± 111 | 753 | 107% |
| Processed seafood | 237 | 12% | 457 ± 155 | 445 | 97% |
| Ready meals, full meal | 96 | 51% | 407 ± 192 | 297 | 73% |
| Ready meals, other | 133 | 21% | 386 ± 264 | 492 | 127% |
| Milk imitates | 30 | 100% | 39 ± 25 | 30 | 77% |
| Yoghurt imitates | 32 | 88% | 42 ± 28 | 39 | 94% |
4. Discussion
| Food Category | Average Sodium Content (mg per 100 g/mL) | Food Category (Hlastan Ribič et al. [33]) | |
|---|---|---|---|
| SCS 1 | SCLA 2 | ||
| Bread | 478 | 455 | Brown bread |
| 506 | Mixed bread | ||
| 565 | White bread | ||
| Cheese | 539 | 694 | Cheese |
| Dry cured meat | 1467 | 1800 | Dry meat |
| 2445 | Prosciutto | ||
| Fresh salamis and hot dogs | 749 | 837 | Various sausages |
| 699 | Frankfurters (hot dog) | ||
| 839 | Various salamis | ||
5. Conclusions
Acknowledgments
Author Contributions
Conflicts of Interest
References
- WHO: Global Health Observatory (GHO). Available online: http://www.who.int/gho/ncd/risk_factors/blood_pressure_prevalence_text/en/ (accessed on 29 April 2014).
- Lewington, S.; Clarke, R.; Qizilbash, N.; Peto, R.; Collins, R. Age-specific relevance of usual blood pressure to vascular mortality: A meta-analysis of individual data for one million adults in 61 prospective studies. Lancet 2002, 360, 1903–1913. [Google Scholar] [CrossRef]
- Cappuccio, F.P.; Pravst, I. Health claims on foods: Promoting healthy food choices or high salt intake? Br. J. Nutr. 2011, 106, 1770–1771. [Google Scholar]
- Poggio, R.; Gutierrez, L.; Matta, M.G.; Elorriaga, N.; Irazola, V.; Rubinstein, A. Daily sodium consumption and CVD mortality in the general population: Systematic review and meta-analysis of prospective studies. Public Health Nutr. 2014. [Google Scholar] [CrossRef]
- He, F.J.; MacGregor, G.A. Effect of modest salt reduction on blood pressure: A meta-analysis of randomized trials. Implications for public health. J. Hum. Hypertens. 2002, 16, 761–770. [Google Scholar]
- He, F.J.; MacGregor, G.A. Reducing population salt intake worldwide: From evidence to implementation. Prog. Cardiovasc. Dis. 2010, 52, 363–382. [Google Scholar] [CrossRef]
- He, F.J.; MacGregor, G.A. How far should salt intake be reduced? Hypertension 2003, 42, 1093–1099. [Google Scholar]
- Reducing Salt Intake in Populations: Report of a WHO Forum and Technical Meeting, Geneva, 2006. Available online: http://www.who.int/dietphysicalactivity/Salt_Report_VC_april07.pdf (accessed on 20 June 2014).
- Prevention of Cardiovascular Disease at the Population Level; NICE Public Health Guidance 25: London, UK, 2010. Available online: http://www.nice.org.uk/guidance/PH25 (accessed on 17 June 2014).
- Strategies to Reduce Sodium Intake in the United States. Available online: http://www.iom.edu/~/media/Files/Report%20Files/2010/Strategies-to-Reduce-Sodium-Intake-in-the-United-States/Strategies%20to%20Reduce%20Sodium%20Intake%202010%20%20Report%20Brief.pdf (accessed on 11 June 2014).
- Sodium Reduction Strategy for Canada: Recommendations of the Sodium Working Group. Available online: http://www.hc-sc.gc.ca/fn-an/alt_formats/pdf/nutrition/sodium/strateg/reduct-strat-eng.pdf (accessed on 20 June 2014).
- Campbell, N.R.; Willis, K.J.; L’Abbe, M.; Strang, R.; Young, E. Canadian initiatives to prevent hypertension by reducing dietary sodium. Nutrients 2011, 3, 756–764. [Google Scholar]
- Eilat-Adar, S.; Sinai, T.; Yosefy, C.; Henkin, Y. Nutritional recommendations for cardiovascular disease prevention. Nutrients 2013, 5, 3646–3683. [Google Scholar]
- He, F.J.; MacGregor, G.A. A comprehensive review on salt and health and current experience of worldwide salt reduction programmes. J. Hum. Hypertens. 2009, 23, 363–384. [Google Scholar] [CrossRef]
- Guideline: Sodium Intake for Adults and Children. Available online: http://apps.who.int/iris/bitstream/10665/77985/1/9789241504836_eng.pdf (accessed on 20 June 2014).
- Hlastan Ribic, C.; Maučec Zakotnik, J.; Vertnik, L.; Vegnuti, M.; Cappuccio, F.P. Salt intake of the Slovene population assessed by 24 h urinary sodium excretion. Public Health Nutr. 2010, 13, 1803–1809. [Google Scholar]
- Strazzullo, P.; D’Elia, L.; Kandala, N.B.; Cappuccio, F.P. Salt intake, stroke, and cardiovascular disease: Meta-analysis of prospective studies. BMJ 2009, 339, b4567. [Google Scholar] [CrossRef]
- Newson, R.S.; Elmadfa, I.; Biro, G.; Cheng, Y.; Prakash, V.; Rust, P.; Barna, M.; Lion, R.; Meijer, G.W.; Neufingerl, N.; et al. Barriers for progress in salt reduction in the general population. An international study. Appetite 2013, 71, 22–31. [Google Scholar]
- Liem, D.G.; Miremadi, F.; Keast, R.S. Reducing sodium in foods: The effect on flavor. Nutrients 2011, 3, 694–711. [Google Scholar] [CrossRef]
- Girgis, S.; Neal, B.; Prescott, J.; Prendergast, J.; Dumbrell, S.; Turner, C.; Woodward, M. A one-quarter reduction in the salt content of bread can be made without detection. Eur. J. Clin. Nutr. 2003, 57, 616–620. [Google Scholar] [CrossRef]
- Pravst, I. The evaluation of health claims in Europe: What have we learned? Agro Food Ind. Hi-Tech 2010, 21, 4–6. [Google Scholar]
- Pravst, I. Functional foods in Europe: A focus on health claims. In Scientific, Health and Social Aspects of the Food Industry; Valdez, B., Ed.; Intech: Rijeka, Croatia, 2012; pp. 165–208. [Google Scholar]
- Espeland, M.A.; Kumanyika, S.; Wilson, A.C.; Reboussin, D.M.; Easter, L.; Self, M.; Robertson, J.; Brown, W.M.; McFarlane, M. Statistical issues in analyzing 24-h dietary recall and 24-h urine collection data for sodium and potassium intakes. Am. J. Epidemiol. 2001, 153, 996–1006. [Google Scholar] [CrossRef]
- Anderson, C.A.; Appel, L.J.; Okuda, N.; Brown, I.J.; Chan, Q.; Zhao, L.; Ueshima, H.; Kesteloot, H.; Miura, K.; Curb, J.D.; et al. Dietary sources of sodium in China, Japan, the United Kingdom, and the United States, women and men aged 40 to 59 years: The INTERMAP study. J. Am. Diet. Assoc. 2010, 110, 736–745. [Google Scholar] [CrossRef]
- Keast, D.R.; Fulgoni, V.L., III; Nicklas, T.A.; O’Neil, C.E. Food sources of energy and nutrients among children in the United States: National Health and Nutrition Examination Survey 2003–2006. Nutrients 2013, 5, 283–301. [Google Scholar]
- Webster, J.L.; Dunford, E.K.; Neal, B.C. A systematic survey of the sodium contents of processed foods. Am. J. Clin. Nutr. 2010, 91, 413–420. [Google Scholar] [CrossRef]
- Mhurchu, C.N.; Capelin, C.; Dunford, E.K.; Webster, J.L.; Neal, B.C.; Jebb, S.A. Sodium content of processed foods in the United Kingdom: Analysis of 44,000 foods purchased by 21,000 households. Am. J. Clin. Nutr. 2011, 93, 594–600. [Google Scholar]
- Keogh, J.B.; Lange, K.; Hogarth, R.; Clifton, P.M. Foods contributing to sodium intake and urinary sodium excretion in a group of Australian women. Public Health Nutr. 2013, 16, 1837–1842. [Google Scholar]
- Hendriksen, M.A.H.; Hoogenveen, R.T.; Hoekstra, J.; Geleijnse, J.M.; Boshuizen, H.C.; van Raaij, J.M.A. Potential effect of salt reduction in processed foods on health. Am. J. Clin. Nutr. 2014, 99, 446–453. [Google Scholar]
- Survey on Members States’ Implementation of the EU Salt Reduction Framework. Available online: http://ec.europa.eu/health/nutrition_physical_activity/docs/salt_report1_en.pdf (accessed on 20 June 2014).
- Salt Campaign (European Commission, DG SANCO). Available online: http://ec.europa.eu/health/nutrition_physical_activity/high_level_group/nutrition_salt_en.htm (accessed on 29 April 2014).
- He, F.J.; Brinsden, H.C.; Macgregor, G.A. Salt reduction in the United Kingdom: A successful experiment in public health. J. Hum. Hypertens. 2013. [Google Scholar] [CrossRef]
- Hlastan Ribič, C.; Maučec Zakotnik, J.; Koroušič Seljak, B.; Poličnik, R.; Blaznik, U.; Fidler Mis, N.; Eržen, I.; Ji, C.; Cappucio, F.P. Estimation of sodium availability in food in Slovenia: Results from household food purchase data from 2000 to 2009. Slov. J. Public Health 2014, 53, 209. [Google Scholar] [CrossRef]
- Buse, K.; Waxman, A. Public-private health partnerships: A strategy for WHO. Bull. World Health Organ. 2001, 79, 748–754. [Google Scholar]
- Eyles, H.; Webster, J.; Jebb, S.; Capelin, C.; Neal, B.; Mhurchu, C.N. Impact of the UK voluntary sodium reduction targets on the sodium content of processed foods from 2006 to 2011: Analysis of household consumer panel data. Prev. Med. 2013, 57, 555–560. [Google Scholar] [CrossRef]
- Nutrition and Health Claims on Foods in Slovenia. Available online: http://www.uvhvvr.gov.si/fileadmin/uvhvvr.gov.si/pageuploads/DELOVNA_PODROCJA/Zivila/trditve/CRP-Zagotovimo_si_hrano-Zakljucno_porocilo.pdf (accessed on 18 August 2014).
- Lalor, F.; Kennedy, J.; Flynn, M.A.; Wall, P.G. A study of nutrition and health claims: A snapshot of what's on the Irish market. Public Health Nutr. 2010, 13, 704–711. [Google Scholar] [CrossRef]
- Households and Families, Slovenia, January 2011–Final Data. Available online: http://www.stat.si/novica_prikazi.aspx?id=4029 (accessed on 17 June 2014).
- Average Annual Quantity of Food and Beverages Consumed per Household Member, Slovenia. Available online: http://pxweb.stat.si/pxweb/Dialog/varval.asp?ma=0872105E&ti=&path=../Database/Demographics/08_level_living/03_household_budget/05_08721_alloc_assets_food/&lang=1 (accessed on 17 June 2014).
- Bonsmann, S.S.; Celemín, L.F.; Larrañaga, A.; Egger, S.; Wills, J.M.; Hodgkins, C.; Raats, M. Penetration of nutrition information on food labels across the EU-27 plus Turkey. Eur. J. Clin. Nutr. 2010, 64, 1379–1385. [Google Scholar]
- Regulation (EU) No 1169/2011 of the European Parliament and of the Council of 25 October 2011. Available online: http://eur-lex.europa.eu/legal-content/EN/TXT/PDF/?uri=CELEX:02011R1169-20140219 (accessed on 18 August 2014).
- Gabrijelčič Blenkuš, M.; Gregorič, M.; Tivadar, B.; Koch, V.; Kostanjevec, S.; Fajdiga Turk, V.; Žalar, A.; Lavtar, D.; Kuhar, D.; Rozman, U. Prehrambene Navade Odraslih Prebivalcev Slovenije z Vidika Varovanja Zdravja; Univerza v Ljubljani, Pedagoška fakulteta: Ljubljana, Slovenia, 2009; p. 183. [Google Scholar]
- Schermel, A.; Emrich, T.E.; Arcand, J.; Wong, C.L.; L’Abbe, M.R. Nutrition marketing on processed food packages in Canada: 2010 Food Label Information Program. Appl. Physiol. Nutr. Metab. 2013, 38, 666–672. [Google Scholar]
- Ng, S.W.; Dunford, E. Complexities and opportunities in monitoring and evaluating US and global changes by the food industry. Obes. Rev. 2013, 14, 29–41. [Google Scholar]
- Dunford, E.; Webster, J.; Metzler, A.B.; Czernichow, S.; Mhurchu, C.N.; Wolmarans, P.; Snowdon, W.; L’Abbe, M.; Li, N.; Maulik, P.K.; et al. International collaborative project to compare and monitor the nutritional composition of processed foods. Eur. J. Prev. Card. 2012, 19, 1326–1332. [Google Scholar]
- The Food Monitoring Group. International collaborative project to compare and track the nutritional composition of fast foods. BMC Public Health 2012, 12, 559. [Google Scholar] [CrossRef]
- Neal, B.; Sacks, G.; Swinburn, B.; Vandevijvere, S.; Dunford, E.; Snowdon, W.; Webster, J.; Barquera, S.; Friel, S.; Hawkes, C.; et al. Monitoring the levels of important nutrients in the food supply. Obes. Rev. 2013, 14, 49–58. [Google Scholar] [CrossRef]
© 2014 by the authors; licensee MDPI, Basel, Switzerland. This article is an open access article distributed under the terms and conditions of the Creative Commons Attribution license (http://creativecommons.org/licenses/by/3.0/).
Share and Cite
Korošec, Ž.; Pravst, I. Assessing the Average Sodium Content of Prepacked Foods with Nutrition Declarations: The Importance of Sales Data. Nutrients 2014, 6, 3501-3515. https://doi.org/10.3390/nu6093501
Korošec Ž, Pravst I. Assessing the Average Sodium Content of Prepacked Foods with Nutrition Declarations: The Importance of Sales Data. Nutrients. 2014; 6(9):3501-3515. https://doi.org/10.3390/nu6093501
Chicago/Turabian StyleKorošec, Živa, and Igor Pravst. 2014. "Assessing the Average Sodium Content of Prepacked Foods with Nutrition Declarations: The Importance of Sales Data" Nutrients 6, no. 9: 3501-3515. https://doi.org/10.3390/nu6093501
APA StyleKorošec, Ž., & Pravst, I. (2014). Assessing the Average Sodium Content of Prepacked Foods with Nutrition Declarations: The Importance of Sales Data. Nutrients, 6(9), 3501-3515. https://doi.org/10.3390/nu6093501