Accuracy of Canadian Food Labels for Sodium Content of Food


Abstract
:1. Introduction
2. Experimental Section
2.1. Study Design
2.2. CFIA Laboratory Analysis

| Conclusion | CFIA Definition |
|---|---|
| Unsatisfactory | Lab results exceeded label value by >20% |
| Investigative | Non-compliant with CFIA rounding rules |
| Satisfactory | Lab results were accurate within 20% of the label value |
| No Decision | No NFT available |
2.3. Statistical Analysis
3. Results
3.1. Analysis of CFIA Conclusions by Nutrient
| Nutrients | Unsatisfactory | Satisfactory | Investigative | No Decision | Total | |||||
|---|---|---|---|---|---|---|---|---|---|---|
| n | % | n | % | n | % | n | % | n | % | |
| Overall | 169 | 16.7 | 777 | 76.9 | 44 | 4.4 | 20 | 2.0 | 1010 | 100.0 |
| Sodium | 49 | 18.4 | 200 | 75.2 | 15 | 5.6 | 2 | 0.8 | 266 | 100.0 |
| Calories | 31 | 14.2 | 169 | 77.2 | 11 | 5.0 | 8 | 3.7 | 219 | 100.0 |
| Saturated Fat | 60 | 15.8 | 298 | 78.4 | 17 | 4.5 | 5 | 1.3 | 380 | 100.0 |
| Trans fat | 16 | 4.3 | 347 | 92.3 | 3 | 0.8 | 10 | 2.7 | 376 | 100.0 |
| Sugar | 17 | 12.9 | 112 | 84.9 | 2 | 1.5 | 1 | 0.8 | 132 | 100.0 |
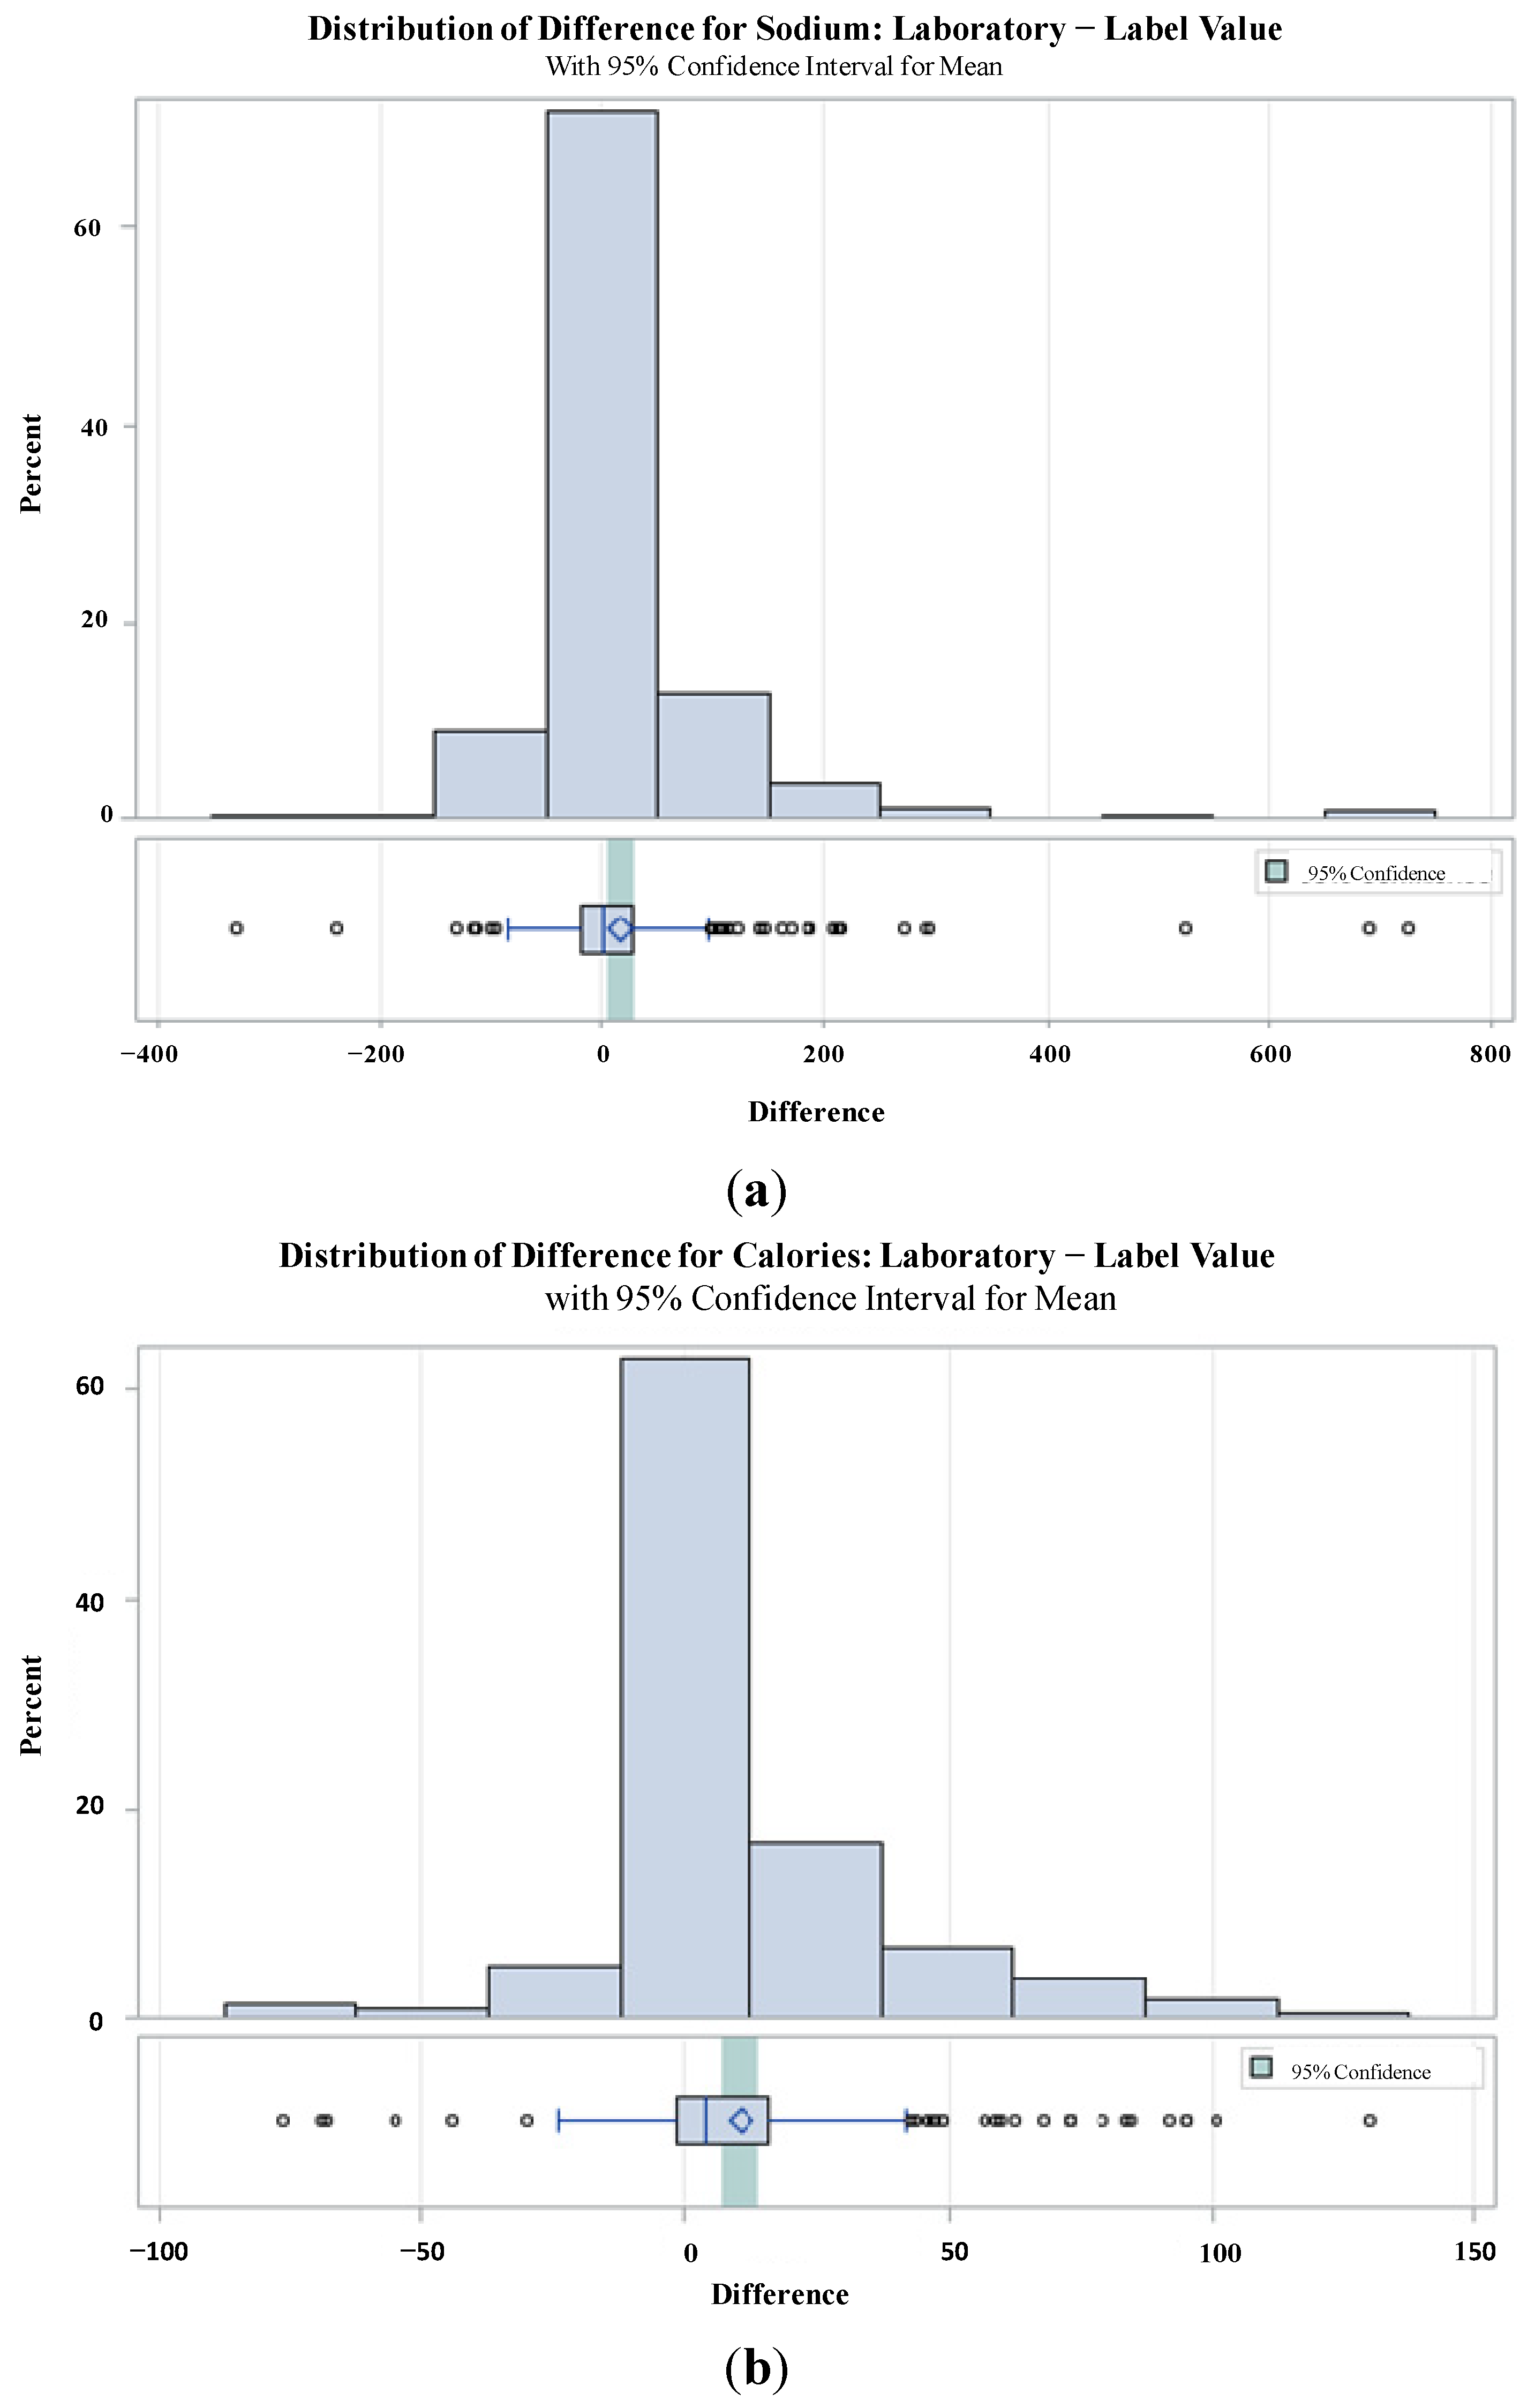
3.2. Comparing Label and Laboratory Values: Mean Differences
| Nutrients | Label Value | Laboratory Value | Difference | p-Value | |||
|---|---|---|---|---|---|---|---|
| Mean | 95% CI | Mean | 95% CI | Mean | 95% CI | ||
| Sodium (mg/portion) | |||||||
| Overall (n = 266) | 268.4 | (229.7,307.1) | 285.9 | (245.8,326.0) | 17.6 | (5.9,29.2) | 0.003 |
| Positive (n = 142) | 277.0 | (225.4,328.5) | 339.2 | (281.7,396.6) | 62.2 | (44.4,80.0) | |
| Negative (n = 122) | 261.9 | (202.0,321.7) | 227.8 | (172.9,282.7) | −34.1 | (−41.7,−26.4) | |
| Calories | |||||||
| Overall (n = 219) | 132.2 | (120.1,144.3) | 142.7 | (130.4,155.1) | 10.6 | (7.0,14.1) | <0.001 |
| Positive (n = 152) | 130.1 | (116.2,144.0) | 150.2 | (135.4,165.1) | 20.1 | (16.1,24.1) | |
| Negative (n = 62) | 137.6 | (112.1,163.0) | 125.5 | (102.5,148.5) | −12.0 | (−16.3,−7.8) | |
| Saturated Fat (g/portion) | |||||||
| Overall (n = 380) | 1.47 | (1.26,1.67) | 1.54 | (1.34,1.73) | 0.07 | (−0.01,0.15) | 0.095 |
| Positive (n = 212) | 1.08 | (0.84,1.31) | 1.47 | (1.20,1.74) | 0.40 | (0.29,0.50) | |
| Negative (n = 162) | 2.02 | (1.66,2.38) | 1.66 | (1.36,1.96) | −0.36 | (−0.45,−0.27) | |
| Trans fat (g/portion) | |||||||
| Overall (n = 376) | 0.15 | (0.09,0.22) | 0.17 | (0.10,0.24) | 0.02 | (−0.03,0.06) | 0.460 |
| Positive (n = 291) | 0.06 | (0.01,0.11) | 0.15 | (0.07,0.23) | 0.09 | (0.06,0.12) | |
| Negative (n = 41) | 0.95 | (0.55,1.36) | 0.47 | (0.22,0.73) | −0.48 | (−0.76,−0.20) | |
| Sugar (g/portion) | |||||||
| Overall (n = 132) | 7.0 | (5.4,8.7) | 7.1 | (5.5,8.7) | 0.1 | (−0.3,0.5) | 0.599 |
| Positive (n = 64) | 5.6 | (3.7,7.5) | 7.0 | (4.9,9.1) | 1.4 | (0.8,2.0) | |
| Negative (n = 54) | 10.5 | (7.3,13.6) | 9.1 | (6.2,11.9) | −1.4 | (−1.9,−0.9) | |
3.3. Graphical Analysis: Distribution of Differences for Sodium and Calories

3.4. Frequency of “Unsatisfactory” Products by Food Category
| Food Category | Total | Unsatisfactory | ||
|---|---|---|---|---|
| N | % | N | % | |
| Bakery products | 363 | 35.9 | 71 | 19.6 |
| Beverages | 21 | 2.1 | 2 | 9.5 |
| Cereals & other grain products | 70 | 6.9 | 8 | 11.4 |
| Dairy products & substitutes | 58 | 5.7 | 12 | 20.7 |
| Desserts | 16 | 1.6 | 3 | 18.8 |
| Dessert toppings & fillings | 0 | 0.0 | 0 | 0.0 |
| Egg & egg substitutes | 0 | 0.0 | 0 | 0.0 |
| Fats & oils | 48 | 4.8 | 3 | 6.3 |
| Marine & fresh water animals | 12 | 1.2 | 2 | 16.7 |
| Fruit & fruit juices | 26 | 2.6 | 2 | 7.7 |
| Legumes | 9 | 0.9 | 2 | 22.2 |
| Meat, poultry, products, substitutes | 11 | 1.1 | 3 | 27.3 |
| Miscellaneous | 8 | 0.8 | 3 | 37.5 |
| Combination dishes | 21 | 2.1 | 7 | 33.3 |
| Nuts & seeds | 20 | 2.0 | 3 | 15.0 |
| Potatoes, sweet potatoes, & yams | 6 | 0.6 | 4 | 66.7 |
| Salads | 0 | 0.0 | 0 | 0.0 |
| Sauces, dips, gravies, condiments | 45 | 4.5 | 9 | 20.0 |
| Snacks | 102 | 10.1 | 12 | 11.8 |
| Soups | 64 | 6.3 | 9 | 14.1 |
| Sugar & sweets | 95 | 9.4 | 9 | 9.5 |
| Vegetables | 15 | 1.5 | 5 | 33.3 |
| Total | 1010 | 100.0 | 169 | 16.7 |
4. Discussion
5. Conclusions
Author Contributions
Conflicts of Interest
References
- World Health Organization. Non-Communicable Diseases. Available online: http://www.who.int/mediacentre/factsheets/fs355/en/ (accessed on 1 August 2013).
- Alwan, A. Global Status Report on Non-Communicable Diseases 2010; Alwan, A., Ed.; World Health Organization: Geneva, Switzerland, 2011. [Google Scholar]
- Beaglehole, R.; Bonita, R.; Horton, R.; Adams, C.; Alleyne, G.; Asaria, P.; Baugh, V.; Bekedam, H.; Billo, N.; Casswell, S.; et al. Priority actions for the non-communicable disease crisis. Lancet 2011, 377, 1438–1447. [Google Scholar] [CrossRef]
- Borgmeier, I.; Westenhoefer, J. Impact of different food label formats on healthiness evaluation and food choice of consumers: A randomized-controlled study. BMC Public Health 2009, 9. [Google Scholar] [CrossRef]
- World Health Organization. NCD Global Monitoring Framework. Available online: http://www.who.int/nmh/global_monitoring_framework/en/ (accessed on 12 April 2014).
- Health Canada. Food and Nutrition: Educational Tools and Key Messages. Available online: http://www.hc-sc.gc.ca/fn-an/nutrition/sodium/education-messages/index-eng.php#a2 (accessed on 13 April 2014).
- Health Canada. Food and Nutrition: Regulation and Compliance. Available online: http://www.hc-sc.gc.ca/fn-an/label-etiquet/nutrition/reg/index-eng.php (accessed on 7 August 2013).
- Canadian Council of Food and Nutrition. Ethnographic Study: A New Perspective on Canadians Attitudes and Behaviours toward Food and Nutrition. Available online: https://www.cfdr.ca/Downloads/CCFN-docs/CCFN-Ethnographic-Survey-Report---Oct7-10---FULL-R.aspx (accessed on 21 September 2013).
- Post, R.E.; Mainous, A.G.; Diaz, V.A.; Matheson, E.M.; Everett, C.J. Use of the nutrition facts label in chronic disease management: Results from the National Health and Nutrition Examination Survey. J. Am. Diet. Assoc. 2010, 110, 628–632. [Google Scholar]
- Pantazopoulos, P.; Kwong, K.; Lillycrop, W.; Wong, L.; Gao, Y.; Chalouh, S.; Samadhin, M.; Ratnyake, W.M.; Krenosky, S.; Dumais, L.; et al. Trans and saturated fat on food labels in Canada: Fact or fiction? Can. J. Public Health 2011, 102, 313–316. [Google Scholar]
- Schmidt, S. Postmedia News. Available online: http://www.canada.com/health/Canadian+nutrition+label+claims+often+wildly+misleading+tests+show/6493401/story.html (accessed on 6 June 2012).
- Canadian Food Inspection Agency. Guide to Food Labeling and Advertising; Canadian Food Inspection Agency: Ottawa, ON, Canada, 2012.
- Canadian Food Inspection Agency. Nutrition Labeling Compliance Test; Canadian Food Inspection Agency: Ottawa, ON, Canada, 2003.
- Health Canada. Research Synthesis on Nutrition Labelling. Available online: http://www.hc-sc.gc.ca/fn-an/label-etiquet/nutrition/res-rech/synth-eng.php (accessed on 30 October 2013).
- Health Canada. Food and Nutrition: Sodium in Canada. Available online: http://www.hc-sc.gc.ca/fn-an/nutrition/sodium/index-eng.php (accessed on 21 September 2013).
- Health Canada. Guidance for the Food Industry on Reducing Sodium in Processed Foods. Available online: http://www.hc-sc.gc.ca/fn-an/legislation/guide-ld/2012-sodium-reduction-indust-eng.php (accessed on 30 October 2013).
- Food Monitoring Group. Progress with a global branded food composition database. Food Chem. 2013, 140, 451–457. [Google Scholar] [CrossRef]
- Arcand, J.; Au, J.T.C.; Schermel, A.; L’Abbe, M.R. A comprehensive analysis of sodium levels in the Canadian packaged food supply. Am. J. Prev. Med. 2014, 46, 633–642. [Google Scholar] [CrossRef]
- Health Canada. Food and Nutrition: Trans Fat Monitoring Program. Available online: http://www.hc-sc.gc.ca/fn-an/nutrition/gras-trans-fats/tfa-age_tc-tm-eng.php (accessed on 21 September 2013).
© 2014 by the authors; licensee MDPI, Basel, Switzerland. This article is an open access article distributed under the terms and conditions of the Creative Commons Attribution license (http://creativecommons.org/licenses/by/3.0/).
Share and Cite
Fitzpatrick, L.; Arcand, J.; L'Abbe, M.; Deng, M.; Duhaney, T.; Campbell, N. Accuracy of Canadian Food Labels for Sodium Content of Food. Nutrients 2014, 6, 3326-3335. https://doi.org/10.3390/nu6083326
Fitzpatrick L, Arcand J, L'Abbe M, Deng M, Duhaney T, Campbell N. Accuracy of Canadian Food Labels for Sodium Content of Food. Nutrients. 2014; 6(8):3326-3335. https://doi.org/10.3390/nu6083326
Chicago/Turabian StyleFitzpatrick, Laura, JoAnne Arcand, Mary L'Abbe, Mengying Deng, Tara Duhaney, and Norm Campbell. 2014. "Accuracy of Canadian Food Labels for Sodium Content of Food" Nutrients 6, no. 8: 3326-3335. https://doi.org/10.3390/nu6083326
APA StyleFitzpatrick, L., Arcand, J., L'Abbe, M., Deng, M., Duhaney, T., & Campbell, N. (2014). Accuracy of Canadian Food Labels for Sodium Content of Food. Nutrients, 6(8), 3326-3335. https://doi.org/10.3390/nu6083326