A Comparison of Regular Consumption of Fresh Lean Pork, Beef and Chicken on Body Composition: A Randomized Cross-Over Trial


 ,
,  and
and 
Abstract
:1. Introduction
2. Subjects and Methods
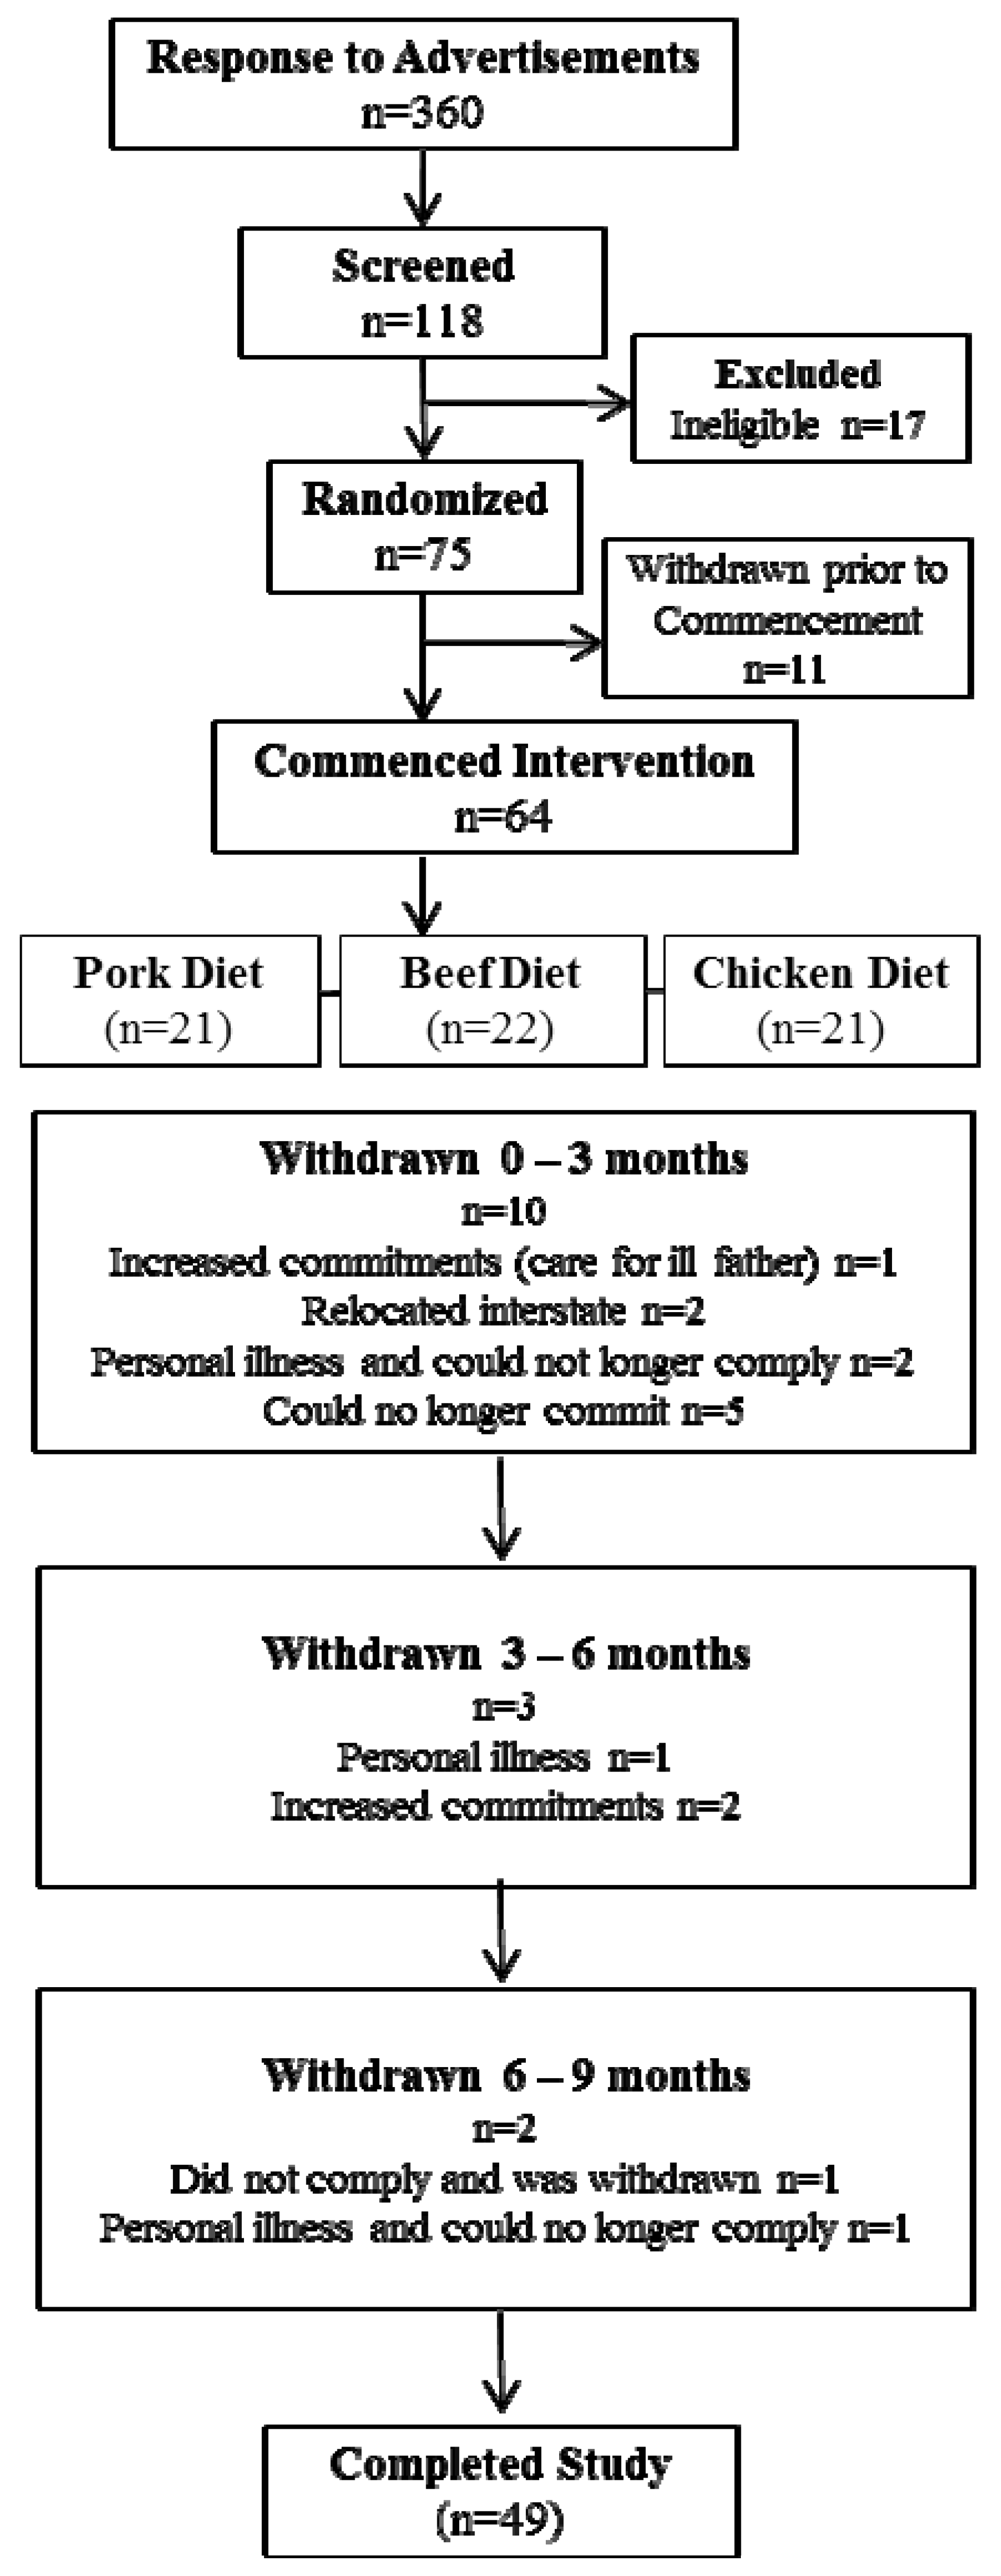
2.1. Participants
2.2. Study Design
2.3. Dietary Intervention
2.4. Dietary Intake
2.5. Physical Activity
2.6. Body Mass Index and Body Composition
2.7. Statistical Analysis
3. Results
3.1. Participant Characteristics

| Mean ± SD | |
|---|---|
| Gender n | 24 M/25 W |
| Age (years) | 50 ± 2 |
| Height (m) | 1.72 ± 0.1 |
| Weight (kg) | 90 ± 14 |
| BMI (kg/m2) | 30.5 ± 3.6 |
| WC (cm) | 102.6 ± 11.3 |
| 108.5 ± 8.2 M/96.9 ± 11.0 W | |
| HC (cm) | 110.3 ± 10.1 |
| 106.7 ± 5.4 M/113.7 ± 12.3 W | |
| WHR | 0.93 ± 0.1 |
| 1.02 ± 0.07 M/0.86 ± 0.07 W | |
| % Body Fat | 49.4 ± 6.3 |
| Fat mass (kg) | 35.3 ± 8.5 |
| Abdominal fat (g) | 3655 ± 1075 |
| Lean mass (kg) | 50.1 ± 9.8 |
| Energy Expenditure | |
| EExp (MJ) | 16.3 ± 3.2 |
| EExp (kcal) | 3889 ± 753 |
| Dietary Intake | |
| Energy (MJ) | 9.3 ± 3.0 |
| Energy (kcal) | 2222 ± 691 |
| Protein (g) | 103 ± 29 |
| %en Protein | 19 ± 3.4 |
| CHO (g) | 227 ± 70 |
| %en CHO | 41 ± 6.2 |
| Fat (g) | 89 ± 38 |
| %en Fat | 34 ± 6.4 |
| SFA (g) | 34 ± 13 |
| %en SFA | 14 ± 3.1 |
| MUFA (g) | 34 ± 17 |
| PUFA (g) | 14 ± 10 |
| Alcohol (g) | 10 ± 13 |
| %en Alcohol | 3 ± 4 |
| Iron (mg) | 13 ± 4 |
| Zinc (mg) | 14 ± 7 |
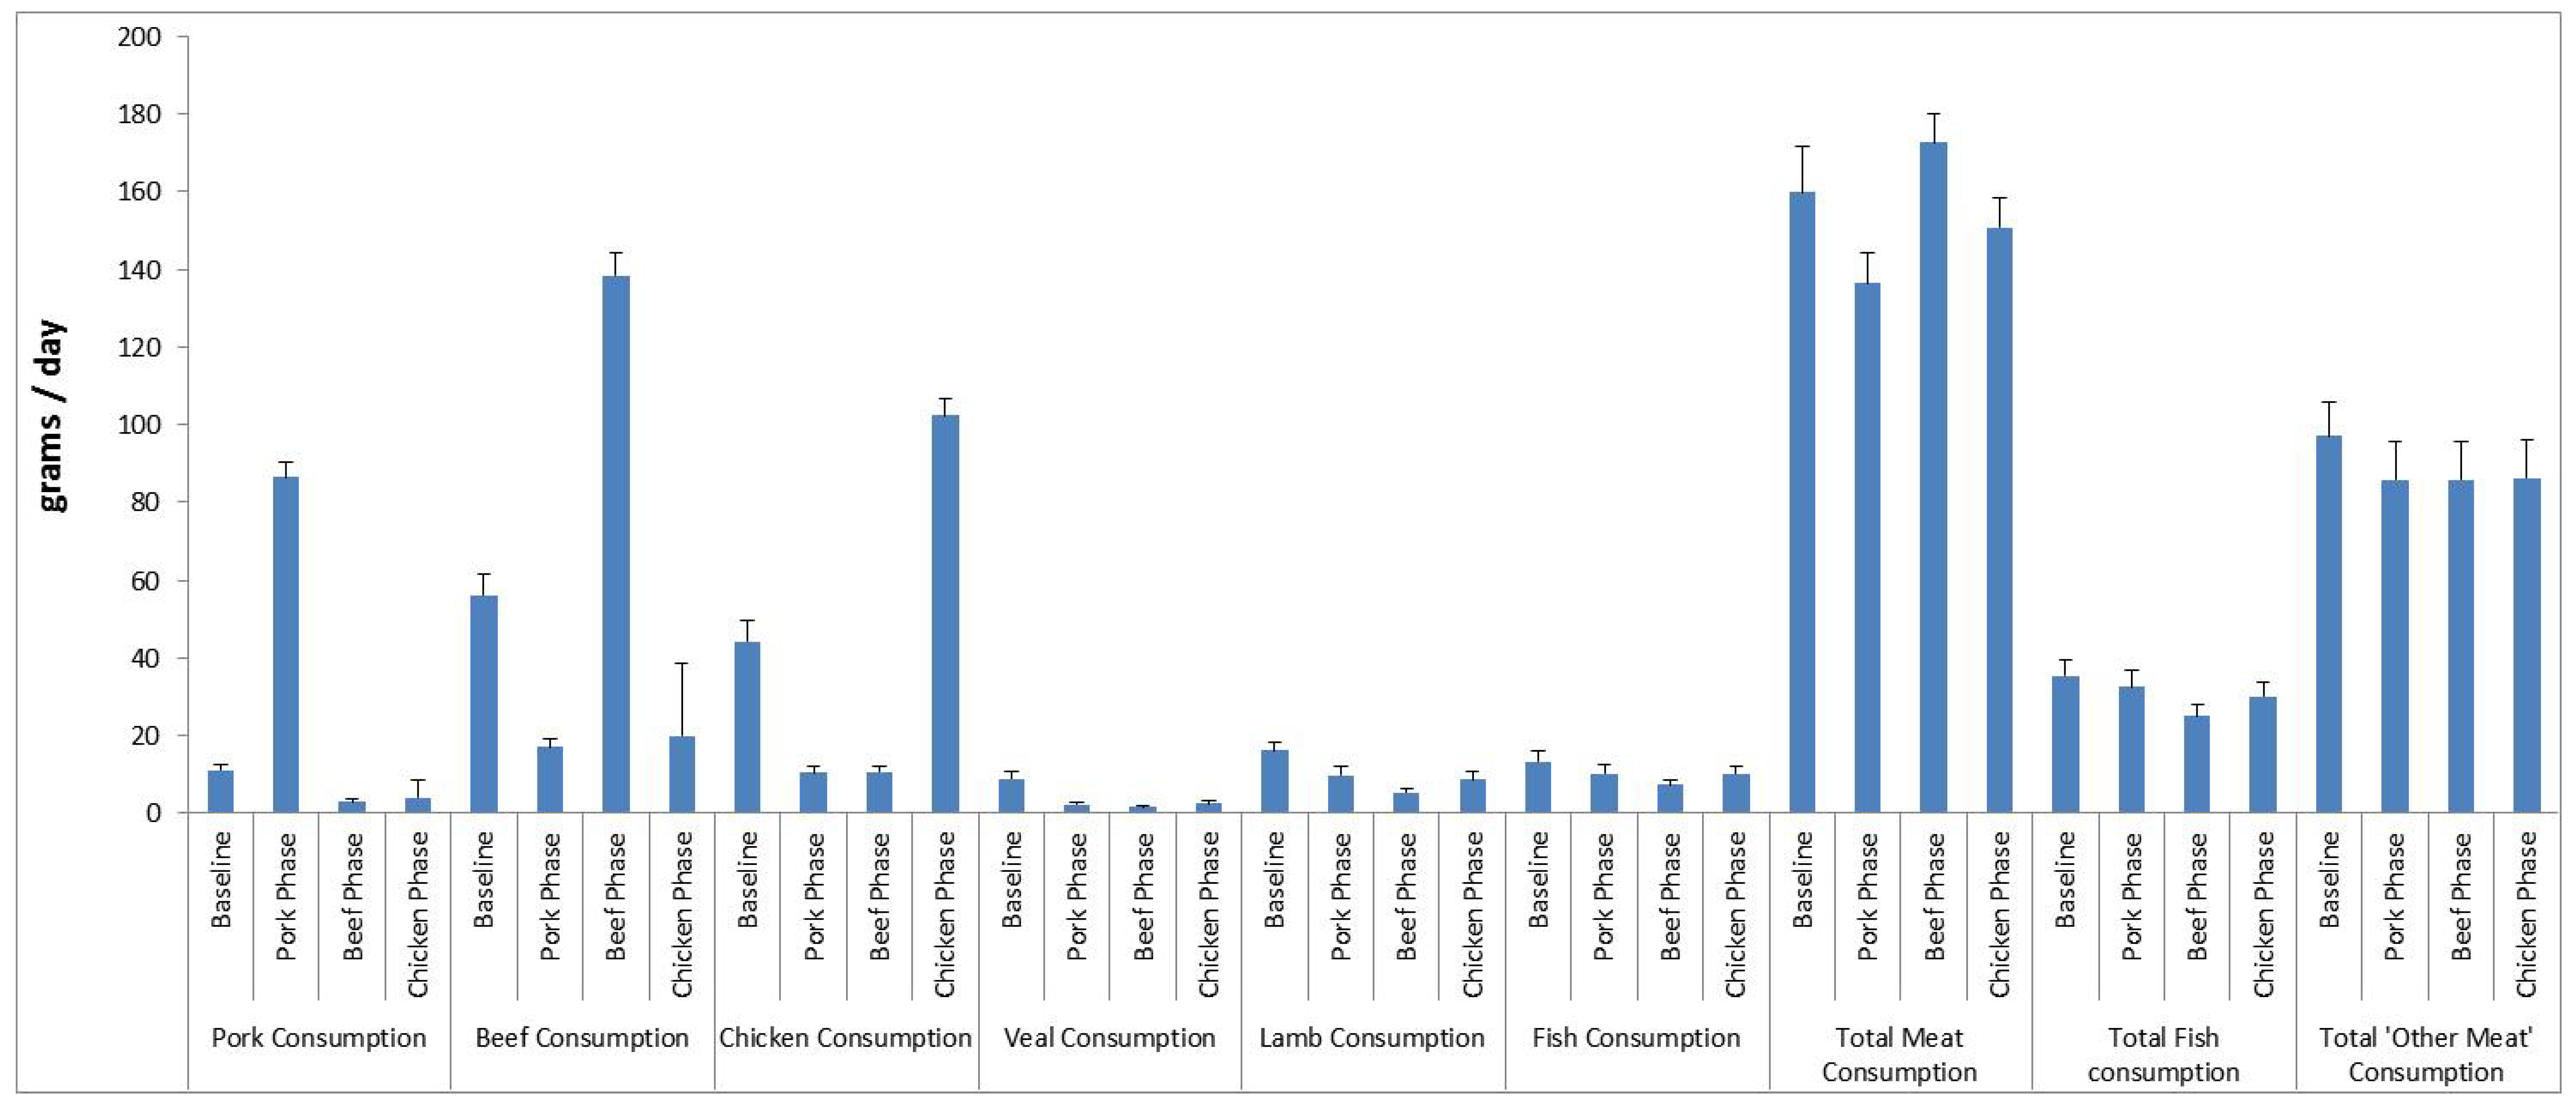
3.2. Pork, Beef and Chicken Consumption

| Pork | Beef | Chicken | ΔBeef-Pork a | P value | ΔChicken-Pork b | p value | |
|---|---|---|---|---|---|---|---|
| Energy (kJ) | 8830 ± 373 | 8414 ± 383 | 8370 ± 392 | −416 (−1119, 286) | 0.245 | −460 (−1162, 242) | 0.199 |
| Energy (kcal) | 2111 ± 89 | 2011 ± 92 | 2001 ± 94 | −100 (−267, 68) | 0.245 | −110 (−278, 58) | 0.199 |
| Protein (g) | 103 ± 4 | 104 ± 4 | 100 ± 5 | 0.8 (−7.2, 8.8) | 0.848 | −2.9 (−10.9, 5.1) | 0.475 |
| %en Protein | 20 ± 0.5 | 21 ± 0.5 | 21 ± 0.5 | 1.2 (0.1, 2.3) | 0.036 | 0.5 (−0.6, 1.7) | 0.343 |
| CHO (g) | 218 ± 10 | 207 ± 12 | 201 ± 10 | −10.8 (−32.2, 10.7) | 0.325 | −16.8 (−38.3, 4.7) | 0.125 |
| %en CHO | 42 ± 1 | 41 ± 1 | 40 ± 1 | −0.8 (−3.1, 1.4) | 0.472 | −1.4 (−3.6, 0.8) | 0.222 |
| Fat (g) | 77 ± 5 | 71 ± 5 | 75 ± 5 | −5.7 (−14.6, 3.2) | 0.207 | −1.2 (−10.1, 7.7) | 0.789 |
| %en Fat | 31 ± 1 | 30 ± 1 | 33 ± 1 | −0.8 (−2.8, 1.3) | 0.458 | 1.5 (−0.6, 3.5) | 0.157 |
| SFA (g) | 30 ± 2 | 27 ± 2 | 29 ± 2 | −3.5 (−8.0, 1.0) | 0.128 | −0.9 (−5.4, 3.6) | 0.689 |
| %en SFA | 12 ± 0.6 | 11 ± 0.5 | 13 ± 0.5 | −0.9 (−2.1, 0.2) | 0.104 | 0.3 (−0.8, 1.5) | 0.573 |
| MUFA (g) | 30 ± 2 | 27 ± 2 | 29 ± 2 | −2.3 (−6.3, 1.8) | 0.272 | −1.0 (−5.1, 3.0) | 0.615 |
| PUFA (g) | 11 ± 1 | 12 ± 1 | 12 ± 1 | 0.3 (−1.3, 1.8) | 0.714 | 1.2 (−0.4, 2.7) | 0.143 |
| Alcohol (g) | 14 ± 3 | 12 ± 2 | 10 ± 3 | −1.7 (−5.4, 2.0) | 0.366 | −3.2 (−6.9, 0.5) | 0.089 |
| %en Alcohol | 4.3 ± 0.8 | 4.5 ± 0.9 | 3.5 ± 0.8 | 0.2 (−0.9, 1.2) | 0.732 | −0.8 (−1.8, 0.3) | 0.139 |
| Iron (mg) | 12.3 ± 0.5 | 14.0 ± 0.7 | 11.9 ± 0.6 | 1.7 (0.5, 2.9) | 0.005 | −0.4 (−1.6, 0.8) | 0.533 |
| Zinc (mg) | 11.6 ± 0.5 | 15.7 ± 0.8 | 11.5 ± 0.8 | 4.1 (2.4, 5.7) | p < 0.0001 | −0.2 (−1.8, 1.5) | 0.844 |
| EExp (MJ) | 16.5 ± 0.5 | 16.2 ± 0.5 | 16.3 ± 0.5 | −0.268 (−0.76, 0.22) | 0.284 | −0.086 (−0.58, 0.41) | 0.734 |
| EExp (kcal) | 3933 ± 116 | 3870 ± 112 | 3903 ± 119 | −64 (−182, 53) | 0.284 | −21 (−139, 98) | 0.734 |
| Pork | Beef | Chicken | Difference betweenPork and Beef a | p value | Difference betweenPork and Chicken b | p value | |
|---|---|---|---|---|---|---|---|
| Weight (kg) | 89 ± 2 | 89 ± 2 | 89 ± 2.0 | −0.003 (−0.609, 0.602) | 0.991 | −0.018 (−0.624, 0.587) | 0.953 |
| BMI (kg/m2) | 30.1 ± 0.5 | 30.1 ± 0.5 | 30.1 ± 0.5 | −0.009 (−0.223,0.205) | 0.934 | −0.006 (−0.220, 0.208) | 0.957 |
| WC (cm) | 101.0 ± 1.6 | 101.3 ± 1.6 | 101.3 ± 1.6 | 0.360 (−0.455, 1.18) | 0.387 | 0.314 (−0.501, 1.13) | 0.450 |
| HC (cm) | 109.8 ± 1.5 | 109.3 ± 1.5 | 109.7 ± 1.4 | −0.475 (−1.064, 0.115) | 0.115 | −0.148 (−0.738, 0.441) | 0.622 |
| WHR | 0.925 ± 0.016 | 0.932 ± 0.016 | 0.929 ± 0.016 | 0.007 (0.0001, 0.014) | 0.046 | 0.004 (−0.003, 0.011) | 0.222 |
| % Body Fat | 49.0 ± 0.9 | 48.9 ± 0.9 | 49.0 ± 0.9 | −0.02 (−0.558, 0.518) | 0.942 | 0.052 (−0.486, 0.590) | 0.850 |
| Fat mass (kg) | 35.3 ± 1.3 | 35.4 ± 1.3 | 35.4 ± 1.3 | 0.098 (−0.418, 0.613) | 0.710 | 0.057 (−0.459, 0.573) | 0.828 |
| Abdominal fat (g) | 3495 ± 149 | 3486 ± 149 | 3500 ± 147 | −8.68 (−82.15, 64.79) | 0.817 | 5.47 (−68.0, 78.94) | 0.884 |
| % Lean Mass | 60.4 ± 1.0 | 60.3 ± 1.0 | 60.4 ± 1.0 | −0.078 (−0.482, 0.327) | 0.707 | −0.008 (−0.413, 0.397) | 0.968 |
| Lean mass (kg) | 53.7 ± 1.5 | 53.6 ± 1.5 | 53.6 ± 1.5 | −0.096 (−0.445, 0.253) | 0.590 | −0.07 (−0.419, 0.280) | 0.696 |
3.3. Dietary Intake and Physical Activity
3.4. Body Composition
4. Discussion
5. Conclusions
Abbreviations
| BMI | body mass index |
| CHD | coronary heart disease |
| CV | cardiovascular |
| DEXA | dual energy xray absorptiometry |
| FFQ | food frequency questionnaire |
| SEM | standard error of mean |
| SD | standard deviation |
| WC | waist circumference |
| WHR | waist to hip ratio |
Author Contributions
Acknowledgments
Conflicts of Interest
References
- Flegal, K.M.; Carroll, M.D.; Ogden, C.L.; Curtin, L.R. Prevalence and trends in obesity among US adults, 1999–2008. JAMA 2010, 303, 235–241. [Google Scholar] [CrossRef]
- Kelly, T.; Yang, W.; Chen, C.S.; Reynolds, K.; He, J. Global burden of obesity in 2005 and projections to 2030. Int. J. Obes. (Lond.) 2008, 32, 1431–1437. [Google Scholar] [CrossRef]
- Popkin, B.M. Recent dynamics suggest selected countries catching up to US obesity. Am. J. Clin. Nutr. 2010, 91, 284S–288S. [Google Scholar] [CrossRef]
- Australian Bureau of Statistics. Australian Health Survey, Profiles of Health, Australia, Cat. No. 4338.0; ABS: Canberra, Australia, 2011–2013. Available online: http://www.abs.gov.au/ausstats/abs@.nsf/mf/4338.0?OpenDocument (accessed on 1 November 2013).
- Alberti, K.G.; Zimmet, P.; Shaw, J. Metabolic syndrome—A new world-wide definition. A consensus statement from the international diabetes federation. Diabet. Med. 2006, 23, 469–480. [Google Scholar] [CrossRef]
- Brinkworth, G.D.; Noakes, M.; Keogh, J.B.; Luscombe, N.D.; Wittert, G.A.; Clifton, P.M. Long-term effects of a high-protein, low-carbohydrate diet on weight control and cardiovascular risk markers in obese hyperinsulinemic subjects. Int. J. Obes. Relat. Metab. Disord. 2004, 28, 661–670. [Google Scholar] [CrossRef]
- Noakes, M.; Clifton, P. Weight loss, diet composition and cardiovascular risk. Curr. Opin. Lipidol. 2004, 15, 31–35. [Google Scholar] [CrossRef]
- Noakes, M.; Keogh, J.B.; Foster, P.R.; Clifton, P.M. Effect of an energy-restricted, high-protein, low-fat diet relative to a conventional high-carbohydrate, low-fat diet on weight loss, body composition, nutritional status, and markers of cardiovascular health in obese women. Am. J. Clin. Nutr. 2005, 81, 1298–1306. [Google Scholar]
- Parker, B.; Noakes, M.; Luscombe, N.; Clifton, P. Effect of a high-protein, high-monounsaturated fat weight loss diet on glycemic control and lipid levels in type 2 diabetes. Diabetes Care 2002, 25, 425–430. [Google Scholar] [CrossRef]
- Resano, H.; Perez-Cueto, F.J.; de Barcellos, M.D.; Veflen-Olsen, N.; Grunert, K.G.; Verbeke, W. Consumer satisfaction with pork meat and derived products in five European countries. Appetite 2011, 56, 167–170. [Google Scholar] [CrossRef]
- Biesalski, H.K. Meat as a component of a healthy diet—Are there any risks or benefits if meat is avoided in the diet? Meat Sci. 2005, 70, 509–524. [Google Scholar] [CrossRef]
- Pereira, P.M.; Vicente, A.F. Meat nutritional composition and nutritive role in the human diet. Meat Sci. 2013, 93, 586–592. [Google Scholar] [CrossRef]
- Murphy, K.J.; Thomson, R.L.; Coates, A.M.; Buckley, J.D.; Howe, P.R. Effects of eating fresh lean pork on cardiometabolic health parameters. Nutrients 2012, 4, 711–723. [Google Scholar] [CrossRef]
- Wycherley, T.P.; Noakes, M.; Clifton, P.M.; Cleanthous, X.; Keogh, J.B.; Brinkworth, G.D. A high-protein diet with resistance exercise training improves weight loss and body composition in overweight and obese patients with type 2 diabetes. Diabetes Care 2010, 33, 969–976. [Google Scholar] [CrossRef]
- Giugliano, D.; Esposito, K. Mediterranean diet and metabolic diseases. Curr. Opin. Lipidol. 2008, 19, 63–68. [Google Scholar]
- Altman, D.G.; Bland, J.M. Standard deviations and standard errors. BMJ 2005, 331, 903. [Google Scholar] [CrossRef]
- Bligh, E.G.; Dyer, W.J. A rapid method of total lipid extraction and purification. Can. J. Biochem. Physiol. 1959, 37, 911–917. [Google Scholar] [CrossRef]
- Giles, G.G.; Ireland, P.D. Dietary Questionnaire for Epidemiological Studies (Version 2); The Cancer Council Victoria: Melbourne, Australia, 1996. [Google Scholar]
- Ambrosini, G.L.; van Roosbroeck, S.A.; Mackerras, D.; Fritschi, L.; de Klerk, N.H.; Musk, A.W. The reliability of ten-year dietary recall: Implications for cancer research. J. Nutr. 2003, 133, 2663–2668. [Google Scholar]
- Hodge, A.; Patterson, A.J.; Brown, W.J.; Ireland, P.; Giles, G. The Anti Cancer Council of Victoria FFQ: Relative validity of nutrient intakes compared with weighed food records in young to middle-aged women in a study of iron supplementation. Aust. N. Z. J. Public Health 2000, 24, 576–583. [Google Scholar] [CrossRef]
- Xinying, P.X.; Noakes, M.; Keogh, J. Can a food frequency questionnaire be used to capture dietary intake data in a 4 week clinical intervention trial? Asia Pac. J. Clin. Nutr. 2004, 13, 318–323. [Google Scholar]
- Bouchard, C.; Tremblay, A.; Leblanc, C.; Lortie, G.; Savard, R.; Theriault, G. A method to assess energy expenditure in children and adults. Am. J. Clin. Nutr. 1983, 37, 461–467. [Google Scholar]
- Norton, K.; Olds, T. Anthropometrica; UNSW Press: Sydney, Australia, 1996. [Google Scholar]
- Australian Government The Measure Up Campaign. Available online: http://www.measureup.gov.au/internet/abhi/publishing.nsf/Content/How+do+I+measure+myself-lp (accessed on 28 June 2013).
- Adam-Perrot, A.; Clifton, P.; Brouns, F. Low-carbohydrate diets: Nutritional and physiological aspects. Obes. Rev. 2006, 7, 49–58. [Google Scholar] [CrossRef]
- Lea, E.; Worsley, A. The cognitive contexts of beliefs about the healthiness of meat. Public Health Nutr. 2002, 5, 37–45. [Google Scholar]
- McLennan, W.P.A. National Nutrition Survey 1995. Available online: http://www.abs.gov.au/ausstats/abs@.nsf/mf/4802.0 (accessed on 1 November 2013).
- Melanson, K.; Gootman, J.; Myrdal, A.; Kline, G.; Rippe, J.M. Weight loss and total lipid profile changes in overweight women consuming beef or chicken as the primary protein source. Nutrition 2003, 19, 409–414. [Google Scholar] [CrossRef]
- Mahon, A.K.; Flynn, M.G.; Stewart, L.K.; McFarlin, B.K.; Iglay, H.B.; Mattes, R.D.; Lyle, R.M.; Considine, R.V.; Campbell, W.W. Protein intake during energy restriction: Effects on body composition and markers of metabolic and cardiovascular health in postmenopausal women. J. Am. Coll. Nutr. 2007, 26, 182–189. [Google Scholar] [CrossRef]
- Davidson, M.H.; Hunninghake, D.; Maki, K.C.; Kwiterovich, P.O., Jr.; Kafonek, S. Comparison of the effects of lean red meat vs lean white meat on serum lipid levels among free-living persons with hypercholesterolemia: A long-term, randomized clinical trial. Arch. Intern. Med. 1999, 159, 1331–1338. [Google Scholar] [CrossRef]
- Coates, A.M.; Sioutis, S.; Buckley, J.D.; Howe, P.R. Regular consumption of n-3 fatty acid-enriched pork modifies cardiovascular risk factors. Br. J. Nutr. 2009, 101, 592–597. [Google Scholar]
- Charlton, K.E.; Tapsell, L.C.; Batterham, M.J.; Thorne, R.; O’Shea, J.; Zhang, Q.; Beck, E.J. Pork, beef and chicken have similar effects on acute satiety and hormonal markers of appetite. Appetite 2011, 56, 1–8. [Google Scholar] [CrossRef]
- Santos-Garcia, D.; Blanco, M.; Castillo, J. The role of flow-mediated dilatation in ischemic stroke: Time for action. Eur. Neurol. J. 2010, 2, 35. [Google Scholar]
- Micha, R.; Wallace, S.K.; Mozaffarian, D. Red and processed meat consumption and risk of incident coronary heart disease, stroke, and diabetes mellitus: A systematic review and meta-analysis. Circulation 2010, 121, 2271–2283. [Google Scholar] [CrossRef]
- Grunert, K.G. Future trends and consumer lifestyles with regard to meat consumption. Meat Sci. 2006, 74, 149–160. [Google Scholar] [CrossRef]
© 2014 by the authors; licensee MDPI, Basel, Switzerland. This article is an open access article distributed under the terms and conditions of the Creative Commons Attribution license (http://creativecommons.org/licenses/by/3.0/).
Share and Cite
Murphy, K.J.; Parker, B.; Dyer, K.A.; Davis, C.R.; Coates, A.M.; Buckley, J.D.; Howe, P.R.C. A Comparison of Regular Consumption of Fresh Lean Pork, Beef and Chicken on Body Composition: A Randomized Cross-Over Trial. Nutrients 2014, 6, 682-696. https://doi.org/10.3390/nu6020682
Murphy KJ, Parker B, Dyer KA, Davis CR, Coates AM, Buckley JD, Howe PRC. A Comparison of Regular Consumption of Fresh Lean Pork, Beef and Chicken on Body Composition: A Randomized Cross-Over Trial. Nutrients. 2014; 6(2):682-696. https://doi.org/10.3390/nu6020682
Chicago/Turabian StyleMurphy, Karen J., Barbara Parker, Kathryn A. Dyer, Courtney R. Davis, Alison M. Coates, Jonathan D. Buckley, and Peter R. C. Howe. 2014. "A Comparison of Regular Consumption of Fresh Lean Pork, Beef and Chicken on Body Composition: A Randomized Cross-Over Trial" Nutrients 6, no. 2: 682-696. https://doi.org/10.3390/nu6020682
APA StyleMurphy, K. J., Parker, B., Dyer, K. A., Davis, C. R., Coates, A. M., Buckley, J. D., & Howe, P. R. C. (2014). A Comparison of Regular Consumption of Fresh Lean Pork, Beef and Chicken on Body Composition: A Randomized Cross-Over Trial. Nutrients, 6(2), 682-696. https://doi.org/10.3390/nu6020682