Urban-Rural Differences Explain the Association between Serum 25-Hydroxyvitamin D Level and Insulin Resistance in Korea

Abstract
:
1. Introduction
2. Experimental Section
2.1. Study Population
2.2. Questionnaire Data
2.3. Physical Examination
2.4. Laboratory Assays
2.5. Statistical Analysis
3. Results

| Variables | Men (n = 505) | Women (n = 1123) | p-value |
|---|---|---|---|
| Age, year | 72.8 ± 4.9 | 71.4 ± 4.7 | <0.001 |
| Height, cm | 164.6 ± 5.4 | 152.2 ± 5.6 | <0.001 |
| Weight, kg | 64.3 ± 8.9 | 56.3 ± 8.0 | <0.001 |
| Body mass index, kg/m2 | 23.7 ± 2.9 | 24.3 ± 3.0 | <0.001 |
| Waist circumference, cm | 85.7 ± 8.6 | 82.7 ± 8.7 | <0.001 |
| Systolic blood pressure, mmHg | 129.5 ± 14.5 | 127.4 ± 15.7 | 0.008 |
| Diastolic blood pressure, mmHg | 74.1 ± 8.8 | 72.7 ± 8.6 | 0.004 |
| Total cholesterol, mmol/L | 4.5 ± 0.8 | 5.0 ± 0.9 | <0.001 |
| HDL cholesterol, mmol/L | 1.2 ± 0.3 | 1.4 ± 0.3 | <0.001 |
| LDL cholesterol, mmol/L | 2.7 ± 0.7 | 2.9 ± 0.8 | <0.001 |
| Triglycerides, mmol/L | 1.3 [0.3–1.7] | 1.3 [1.0–1.8] | 0.040 |
| 25(OH)D, nmol/L | 49.4 [35.4–61.9] | 39.9 [28.2–54.9] | <0.001 |
| Fasting glucose, mmol/L | 5.1 [4.8–5.5] | 5.1 [4.8–5.4] | 0.364 |
| Fasting insulin, pmol/L | 29.4 [19.8–43.8] | 35.4 [24.6–53.4] | <0.001 |
| HOMA-IR, mmol·pmol/L2 | 1.1 [0.7–1.7] | 1.3 [0.9–2.1] | <0.001 |
| HOMA-IR ≥ 2.5, n (%) | 56 (11.1) | 190 (16.9) | 0.003 |
| Impaired fasting glucose, n (%) | 116 (23.0) | 218 (19.4) | 0.115 |
| Hypertension, n (%) | 293 (58.0) | 694 (61.8) | 0.165 |
| Dyslipidemia, n (%) | 243 (48.1) | 627 (55.8) | 0.005 |
| Current smoker, n (%) | 81 (16.0) | 17 (1.5) | <0.001 |
| Regular alcohol drinker, n (%) | 195 (38.6) | 58 (5.2) | <0.001 |
| Regular exercise, n (%) | 282 (55.8) | 663 (59.0) | 0.248 |
| Variables | Men (n = 505) | Women (n = 1123) | ||||||
|---|---|---|---|---|---|---|---|---|
| <50 (n = 264, 52.3%) | 50–75 (n = 184, 36.4%) | ≥75 (n = 57, 11.3%) | p for Trend | <50 (n = 771, 68.7%) | 50–75 (n = 280, 24.9%) | ≥75 (n = 72, 6.4%) | p for Trend | |
| Age, year | 72.7 ± 4.8 | 72.9 ± 4.7 | 72.8 ± 5.7 | 0.937 | 71.5 ± 4.7 | 71.2 ± 4.5 | 71.6 ± 4.9 | 0.907 |
| Height, cm | 164.4 ± 5.4 | 165.0 ± 5.2 | 163.9 ± 6.1 | 0.517 | 152.2 ± 5.6 | 152.2 ± 5.8 | 152.5 ± 4.8 | 0.625 |
| Weight, kg | 64.8 ± 8.4 | 64.4 ± 9.5 | 61.8 ± 9.1 | 0.021 | 56.8 ± 8.2 | 55.4 ± 7.6 | 54.3 ± 7.2 | 0.012 |
| Body mass index, kg/m2 | 24.0 ± 2.8 | 23.6 ± 3.0 | 22.9 ± 2.6 | 0.014 | 24.5 ± 3.1 | 23.9 ± 2.8 | 23.4 ± 2.9 | 0.002 |
| Waist circumference, cm | 86.3 ± 8.4 | 85.5 ± 8.8 | 83.3 ± 8.5 | 0.017 | 83.2 ± 8.8 | 81.9 ± 8.4 | 79.9 ± 7.6 | 0.002 |
| Systolic BP, mmHg | 129.1 ± 15.9 | 130.2 ± 13.1 | 129.2 ± 11.3 | 0.978 | 127.7 ± 16.1 | 127.2 ± 14.6 | 125.7 ± 15.7 | 0.316 |
| Diastolic BP, mmHg | 74.0 ± 9.4 | 74.1 ± 8.1 | 74.3 ± 8.5 | 0.867 | 72.8 ± 9.0 | 72.7 ± 8.1 | 71.8 ± 7.4 | 0.350 |
| Total cholesterol, mmol/L | 4.63 ± 0.83 | 4.48 ± 0.82 | 4.35 ± 0.71 | 0.019 | 5.04 ± 0.92 | 4.82 ± 0.93 | 4.56 ± 0.83 | <0.001 |
| HDL cholesterol, mmol/L | 1.22 ± 0.33 | 1.25 ± 0.29 | 1.32 ± 0.33 | 0.038 | 1.35 ± 0.34 | 1.38 ± 0.33 | 1.34 ± 0.32 | 0.688 |
| LDL cholesterol, mmol/L | 2.72 ± 0.76 | 2.61 ± 0.72 | 2.47 ± 0.66 | 0.019 | 2.99 ± 0.82 | 2.81 ± 0.81 | 2.62 ± 0.71 | <0.001 |
| Triglycerides, mmol/L | 116 [84–161] | 103 [79–152] | 102 [90–123] | 0.021 | 120 [90–165] | 113 [82–152] | 102 [76–140] | 0.014 |
| Fasting glucose, mmol/L | 91 [86–99] | 91 [86–98] | 92 [87–98] | 0.596 | 91 [86–98] | 90 [85–95] | 90 [86–97] | 0.471 |
| Fasting insulin, pmol/L | 5.3 [3.7–7.9] | 4.7 [3.2–7.1] | 3.5 [2.5–5.1] | <0.001 | 6.2 [4.3–9.2] | 5.2 [3.7–8.4] | 5.5 [4.2–7.6] | 0.059 |
| HOMA-IR, mmol·pmol/L2 | 1.20 [0.80–1.88] | 1.04 [0.71–1.66] | 0.83 [0.56–1.30] | <0.001 | 1.41 [0.97–2.16] | 1.20 [0.79–1.93] | 1.24 [0.92–1.80] | 0.060 |
| HOMA-IR ≥ 2.5, n (%) | 36 (13.6) | 19 (10.3) | 1 (1.8) | 0.013 * | 140 (18.2) | 42 (15.0) | 8 (11.1) | 0.070 * |
| Current smoker, n (%) | 44 (16.7) | 29 (15.8) | 8 (14.0) | 0.620 * | 13 (1.7) | 3 (1.1) | 1 (1.4) | 0.565 * |
| Regular alcohol drinker, n (%) | 88 (33.3) | 78 (42.4) | 29 (50.9) | 0.005 * | 49 (6.4) | 8 (2.9) | 1 (1.4) | 0.008 * |
| Regular exercise, n (%) | 166 (62.9) | 91 (49.5) | 25 (43.9) | <0.001 * | 459 (59.5) | 161 (57.5) | 43 (59.7) | 0.738 * |
| Variables | Men (n = 505) | Women (n = 1123) | ||
|---|---|---|---|---|
| Partial Correlation Coefficient † | p-value | Partial Correlation Coefficient † | p-value | |
| Body mass index | −0.152 | 0.005 | −0.126 | <0.001 |
| Waist circumference | −0.117 | 0.009 | −0.107 | <0.001 |
| Fasting glucose * | −0.071 | 0.110 | −0.035 | 0.245 |
| Fasting insulin * | −0.211 | <0.001 | −0.096 | 0.001 |
| HOMA-IR * | −0.207 | <0.001 | −0.095 | 0.001 |
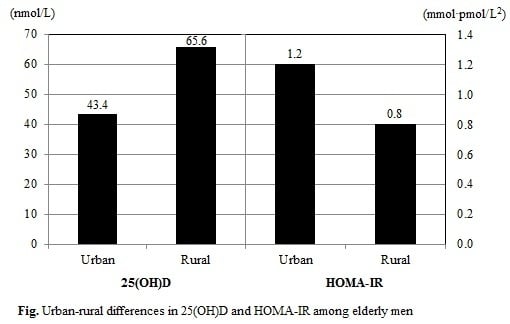
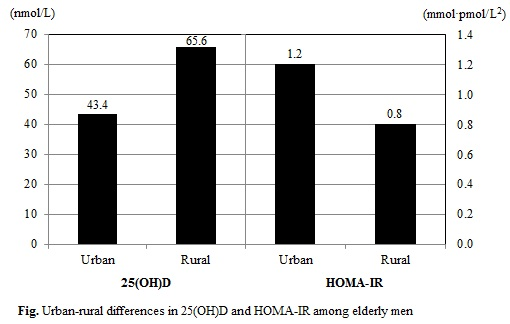
| Region | Men (n = 505) | Region | Women (n = 1123) | ||
|---|---|---|---|---|---|
| 25(OH)D | HOMA-IR | 25(OH)D | HOMA-IR | ||
| Urban (n = 371) | 43.4 [32.7–55.2] | 1.2 [0.8–1.8] | Urban (n = 948) | 38.2 [27.2–51.9] | 1.4 [0.9–2.1] |
| Rural (n = 134) | 65.6 [54.2–76.1] | 0.8 [0.5–1.3] | Rural (n = 175) | 49.9 [36.7–61.7] | 1.2 [0.8–1.8] |
| p-value | <0.001 | <0.001 | p-value | <0.001 | 0.002 |
| Variables | Men (n = 505) | Women (n = 1123) | ||||||||||
|---|---|---|---|---|---|---|---|---|---|---|---|---|
| std. β | p-value | std. β | p-value | std. β | p-value | std. β | p-value | std. β | p-value | std. β | p-value | |
| 25(OH)D, nmol/L | –0.203 | <0.001 | –0.133 | <0.001 | −0.063 | 0.115 | –0.092 | <0.001 | –0.035 | 0.187 | –0.022 | 0.415 |
| Study year, year | 0.057 | 0.193 | 0.054 | 0.148 | 0.067 | 0.067 | 0.057 | 0.055 | 0.074 | 0.007 | 0.076 | 0.006 |
| Age, year | –0.018 | 0.689 | 0.042 | 0.264 | 0.056 | 0.130 | 0.031 | 0.301 | 0.026 | 0.341 | 0.035 | 0.201 |
| Body mass index, kg/m2 | 0.318 | <0.001 | 0.321 | <0.001 | 0.257 | <0.001 | 0.264 | <0.001 | ||||
| Waist circumference, cm | 0.249 | <0.001 | 0.225 | <0.001 | 0.231 | <0.001 | 0.222 | <0.001 | ||||
| Current smoker (vs. others) | –0.074 | 0.045 | –0.071 | 0.049 | –0.006 | 0.825 | –0.008 | 0.751 | ||||
| Regular alcohol drinker (vs. others) | –0.001 | 0.981 | 0.001 | 0.978 | –0.010 | 0.718 | –0.011 | 0.685 | ||||
| Regular exercise (vs. none) | 0.027 | 0.468 | –0.012 | 0.751 | –0.003 | 0.920 | –0.021 | 0.456 | ||||
| Rural (vs. urban) | –0.183 | <0.001 | –0.074 | 0.008 | ||||||||
| Coefficient of determination | adj. R2 = 0.041 | adj. R2 = 0.336 | adj. R2 = 0.360 | adj. R2 = 0.011 | adj. R2 = 0.219 | adj. R2 = 0.223 | ||||||
| Variables | Urban (n = 1319) | Rural (n = 309) | ||||||
|---|---|---|---|---|---|---|---|---|
| Men (n = 371) | Women (n = 948) | Men (n = 134) | Women (n = 175) | |||||
| std. β | p-value | std. β | p-value | std. β | p-value | std. β | p-value | |
| 25(OH)D, nmol/L | −0.052 | 0.263 | −0.008 | 0.785 | −0.084 | 0.217 | −0.084 | 0.224 |
| Study year, year | 0.101 | 0.035 | 0.046 | 0.129 | 0.035 | 0.582 | 0.180 | 0.011 |
| Age, year | 0.141 | 0.003 | 0.060 | 0.044 | −0.120 | 0.090 | −0.084 | 0.236 |
| Body mass index, kg/m2 | 0.281 | <0.001 | 0.304 | <0.001 | 0.422 | 0.002 | 0.116 | 0.308 |
| Waist circumference, cm | 0.224 | 0.003 | 0.178 | <0.001 | 0.221 | 0.094 | 0.369 | 0.001 |
| Current smoker (vs. others) | −0.054 | 0.240 | −0.003 | 0.910 | −0.114 | 0.091 | −0.072 | 0.285 |
| Regular alcohol drinker (vs. others) | 0.037 | 0.433 | −0.021 | 0.464 | −0.105 | 0.120 | 0.080 | 0.231 |
| Regular exercise (vs. none) | −0.033 | 0.480 | −0.010 | 0.747 | 0.007 | 0.918 | −0.018 | 0.790 |
| Coefficient of determination | adj. R2 = 0.241 | adj. R2 = 0.215 | adj. R2 = 0.467 | adj. R2 = 0.250 | ||||
4. Discussion
5. Conclusions
Supplementary Files
Supplementary File 1Acknowledgments
Author Contributions
Conflicts of Interest
References
- Choi, H.S.; Kim, K.A.; Lim, C.Y.; Rhee, S.Y.; Hwang, Y.C.; Kim, K.M.; Kim, K.J.; Rhee, Y.; Lim, S.K. Low serum vitamin D is associated with high risk of diabetes in Korean adults. J. Nutr. 2011, 141, 1524–1528. [Google Scholar] [CrossRef]
- Holick, M.F. Vitamin D deficiency. N. Engl. J. Med. 2007, 357, 266–281. [Google Scholar] [CrossRef]
- Mithal, A.; Wahl, D.A.; Bonjour, J.P.; Burckhardt, P.; Dawson-Hughes, B.; Eisman, J.A.; el-Hajj Fuleihan, G.; Josse, R.G.; Lips, P.; Morales-Torres, J. Global vitamin D status and determinants of hypovitaminosis D. Osteoporos. Int. 2009, 20, 1807–1820. [Google Scholar] [CrossRef]
- Harinarayan, C.V.; Ramalakshmi, T.; Prasad, U.V.; Sudhakar, D.; Srinivasarao, P.V.; Sarma, K.V.; Kumar, E.G. High prevalence of low dietary calcium, high phytate consumption, and vitamin D deficiency in healthy south Indians. Am. J. Clin. Nutr. 2007, 85, 1062–1067. [Google Scholar]
- Islam, M.Z.; Akhtaruzzaman, M.; Lamberg-Allardt, C. Hypovitaminosis D is common in both veiled and nonveiled Bangladeshi women. Asia Pac. J. Clin. Nutr. 2006, 15, 81–87. [Google Scholar]
- Chailurkit, L.O.; Rajatanavin, R.; Teerarungsikul, K.; Ongphiphadhanakul, B.; Puavilai, G. Serum vitamin D, parathyroid hormone and biochemical markers of bone turnover in normal Thai subjects. J. Med. Assoc. Thai. 1996, 79, 499–504. [Google Scholar]
- Lim, S.K.; Kung, A.W.; Sompongse, S.; Soontrapa, S.; Tsai, K.S. Vitamin D inadequacy in postmenopausal women in eastern Asia. Curr. Med. Res. Opin. 2008, 24, 99–106. [Google Scholar] [CrossRef]
- Wat, W.Z.; Leung, J.Y.; Tam, S.; Kung, A.W. Prevalence and impact of vitamin D insufficiency in southern Chinese adults. Ann. Nutr. Metab. 2007, 51, 59–64. [Google Scholar] [CrossRef]
- Nakamura, K. Vitamin D insufficiency in Japanese populations: From the viewpoint of the prevention of osteoporosis. J. Bone Miner. Metab. 2006, 24, 1–6. [Google Scholar] [CrossRef]
- Choi, H.S.; Oh, H.J.; Choi, H.; Choi, W.H.; Kim, J.G.; Kim, K.M.; Kim, K.J.; Rhee, Y.; Lim, S.K. Vitamin D insufficiency in Korea—A greater threat to younger generation: The Korea National Health and Nutrition Examination Survey (KNHANES) 2008. J. Clin. Endocrinol. Metab. 2011, 96, 643–651. [Google Scholar] [CrossRef]
- Pittas, A.G.; Lau, J.; Hu, F.B.; Dawson-Hughes, B. The role of vitamin D and calcium in type 2 diabetes. A systematic review and meta-analysis. J. Clin. Endocrinol. Metab. 2007, 92, 2017–2029. [Google Scholar] [CrossRef]
- Mitri, J.; Muraru, M.D.; Pittas, A.G. Vitamin D and type 2 diabetes: A systematic review. Eur. J. Clin. Nutr. 2011, 65, 1005–1015. [Google Scholar] [CrossRef]
- Chiu, K.C.; Chu, A.; Go, V.L.; Saad, M.F. Hypovitaminosis D is associated with insulin resistance and beta cell dysfunction. Am. J. Clin. Nutr. 2004, 79, 820–825. [Google Scholar]
- Pittas, A.G.; Chung, M.; Trikalinos, T.; Mitri, J.; Brendel, M.; Patel, K.; Lichtenstein, A.H.; Lau, J.; Balk, E.M. Systematic review: Vitamin D and cardiometabolic outcomes. Ann. Int. Med. 2010, 152, 307–314. [Google Scholar] [CrossRef]
- Gorham, E.D.; Garland, C.F.; Burgi, A.A.; Mohr, S.B.; Zeng, K.; Hofflich, H.; Kim, J.J.; Ricordi, C. Lower prediagnostic serum 25-hydroxyvitamin D concentration is associated with higher risk of insulin-requiring diabetes: A nested case-control study. Diabetologia 2012, 55, 3224–3227. [Google Scholar] [CrossRef]
- Rhee, S.Y.; Hwang, Y.C.; Chung, H.Y.; Woo, J.T. Vitamin D and diabetes in Koreans: Analyses based on the Fourth Korea National Health and Nutrition Examination Survey (KNHANES), 2008–2009. Diabet. Med. 2012, 29, 1003–1010. [Google Scholar] [CrossRef]
- Scragg, R.; Sowers, M.; Bell, C. Serum 25-hydroxyvitamin D, diabetes, and ethnicity in the Third National Health and Nutrition Examination Survey. Diabetes Care 2004, 27, 2813–2818. [Google Scholar] [CrossRef]
- Pilz, S.; van den Hurk, K.; Nijpels, G.; Stehouwer, C.D.; van’t Riet, E.; Kienreich, K.; Tomaschitz, A.; Dekker, J.M. Vitamin D status, incident diabetes and prospective changes in glucose metabolism in older subjects: The Hoorn study. Nutr. Metab. Cardiovasc. Dis. 2012, 22, 883–889. [Google Scholar] [CrossRef]
- Del Gobbo, L.C.; Song, Y.; Dannenbaum, D.A.; Dewailly, E.; Egeland, G.M. Serum 25-hydroxyvitamin D is not associated with insulin resistance or beta cell function in Canadian Cree. J. Nutr. 2011, 141, 290–295. [Google Scholar]
- Gulseth, H.L.; Gjelstad, I.M.; Tierney, A.C.; Lovegrove, J.A.; Defoort, C.; Blaak, E.E.; Lopez-Miranda, J.; Kiec-Wilk, B.; Riserus, U.; Roche, H.M.; et al. Serum vitamin D concentration does not predict insulin action or secretion in European subjects with the metabolic syndrome. Diabetes Care 2010, 33, 923–925. [Google Scholar] [CrossRef]
- Erdonmez, D.; Hatun, S.; Cizmecioglu, F.M.; Keser, A. No relationship between vitamin D status and insulin resistance in a group of high school students. J. Clin. Res. Pediatr. Endocrinol. 2011, 3, 198–201. [Google Scholar] [CrossRef]
- Lee, E.Y.; Kim, H.C.; Rhee, Y.; Youm, Y.; Kim, K.M.; Lee, J.M.; Choi, D.P.; Yun, Y.M.; Kim, C.O. The Korean urban rural elderly cohort study: Study design and protocol. BMC Geriatr. 2014, 14, 33. [Google Scholar] [CrossRef]
- National Statistical Office of Korea. Statistics Korea. Available online: http://kssc.kostat.go.kr/ksscNew_web/index.jsp (accessed on 4 December 2014).
- Hollis, B.W. Assessment of vitamin D nutritional and hormonal status: What to measure and how to do it. Calcif. Tissue Int. 1996, 58, 4–5. [Google Scholar] [CrossRef]
- Wagner, D.; Hanwell, H.E.; Vieth, R. An evaluation of automated methods for measurement of serum 25-hydroxyvitamin D. Clin. Biochem. 2009, 42, 1549–1556. [Google Scholar] [CrossRef]
- Matthews, D.R.; Hosker, J.P.; Rudenski, A.S.; Naylor, B.A.; Treacher, D.F.; Turner, R.C. Homeostasis model assessment: Insulin resistance and beta-cell function from fasting plasma glucose and insulin concentrations in man. Diabetologia 1985, 28, 412–419. [Google Scholar] [CrossRef]
- Husemoen, L.L.; Thuesen, B.H.; Fenger, M.; Jorgensen, T.; Glumer, C.; Svensson, J.; Ovesen, L.; Witte, D.R.; Linneberg, A. Serum 25(OH)D and type 2 diabetes association in a general population: A prospective study. Diabetes Care 2012, 35, 1695–1700. [Google Scholar] [CrossRef]
- Chailurkit, L.O.; Aekplakorn, W.; Ongphiphadhanakul, B. The association between vitamin D status and type 2 diabetes in a Thai population, a cross-sectional study. Clin. Endocrinol. (Oxf.) 2012, 77, 658–664. [Google Scholar] [CrossRef]
- Song, B.M.; Kim, H.C.; Choi, D.P.; Oh, S.M.; Suh, I. Association between serum 25-hydroxyvitamin D level and insulin resistance in a rural population. Yonsei Med. J. 2014, 55, 1036–1041. [Google Scholar] [CrossRef]
- Levy, J.C.; Matthews, D.R.; Hermans, M.P. Correct homeostasis model assessment (HOMA) evaluation uses the computer program. Diabetes Care 1998, 21, 2191–2192. [Google Scholar] [CrossRef]
- Moon, H.W.; Cho, J.H.; Hur, M.; Song, J.; Oh, G.Y.; Park, C.M.; Yun, Y.M.; Kim, J.Q. Comparison of four current 25-hydroxyvitamin D assays. Clin. Biochem. 2012, 45, 326–330. [Google Scholar] [CrossRef]
© 2014 by the authors; licensee MDPI, Basel, Switzerland. This article is an open access article distributed under the terms and conditions of the Creative Commons Attribution license (http://creativecommons.org/licenses/by/4.0/).
Share and Cite
Song, B.M.; Rhee, Y.; Kim, C.O.; Youm, Y.; Kim, K.M.; Lee, E.Y.; Lee, J.-M.; Yoon, Y.M.; Kim, H.C. Urban-Rural Differences Explain the Association between Serum 25-Hydroxyvitamin D Level and Insulin Resistance in Korea. Nutrients 2014, 6, 5806-5818. https://doi.org/10.3390/nu6125806
Song BM, Rhee Y, Kim CO, Youm Y, Kim KM, Lee EY, Lee J-M, Yoon YM, Kim HC. Urban-Rural Differences Explain the Association between Serum 25-Hydroxyvitamin D Level and Insulin Resistance in Korea. Nutrients. 2014; 6(12):5806-5818. https://doi.org/10.3390/nu6125806
Chicago/Turabian StyleSong, Bo Mi, Yumie Rhee, Chang Oh Kim, Yoosik Youm, Kyoung Min Kim, Eun Young Lee, Ju-Mi Lee, Young Mi Yoon, and Hyeon Chang Kim. 2014. "Urban-Rural Differences Explain the Association between Serum 25-Hydroxyvitamin D Level and Insulin Resistance in Korea" Nutrients 6, no. 12: 5806-5818. https://doi.org/10.3390/nu6125806
APA StyleSong, B. M., Rhee, Y., Kim, C. O., Youm, Y., Kim, K. M., Lee, E. Y., Lee, J.-M., Yoon, Y. M., & Kim, H. C. (2014). Urban-Rural Differences Explain the Association between Serum 25-Hydroxyvitamin D Level and Insulin Resistance in Korea. Nutrients, 6(12), 5806-5818. https://doi.org/10.3390/nu6125806