Phenolic Composition, Antioxidant Activity and Anti-Adipogenic Effect of Hot Water Extract from Safflower (Carthamus tinctorius L.) Seed


Abstract
:1. Introduction
2. Methods and Materials
2.1. Materials
2.2. Sample Preparation
2.3. Determination of Total Phenolic and Flavonoid Contents
2.4. HPLC Analysis of Phenolic Compounds in CSE
2.5. Determination of in Vitro Antioxidant Capacity
2.6. Cell Culture
2.7. Determination of Lipid Accumulation by Oil Red O Staining
2.8. Statistical Analysis
3. Results
3.1. Total Phenolic and Flavonoid Contents of CSE and Its Phenolic Compounds

| Total Phenolic Content (mg GAE 1/g) | Total Flavonoid Content (mg QE 2/g) | |
|---|---|---|
| CSE 3 | 126.0 ± 2.4 4 | 62.2 ± 1.9 |
| Phenolic Compounds | mg/g, Dry Base |
|---|---|
| 4-Hydroxybenzhydrazide derivative | 18.2 |
| 2-Amino-3,4-dimethylbenzoic acid | 16.8 |
| Chlorogenic acid | 2.4 |
| Syringic acid | 0.2 |
| p-Coumaric acid | 0.5 |
| trans-Ferulic acid | 3.0 |
| Gallocatechin | 17.0 |
| (−)-Epigallocatechin | 109.6 |
| Epigallocatechin gallate | 1.1 |
| Quercetin dehydrate | 2.2 |
| Kaempferol | 0.8 |
| Rutin hydrate | 3.7 |
| Luteolin | 1.6 |
| Naringin | 6.0 |
| trans-Chalcone | 2.1 |
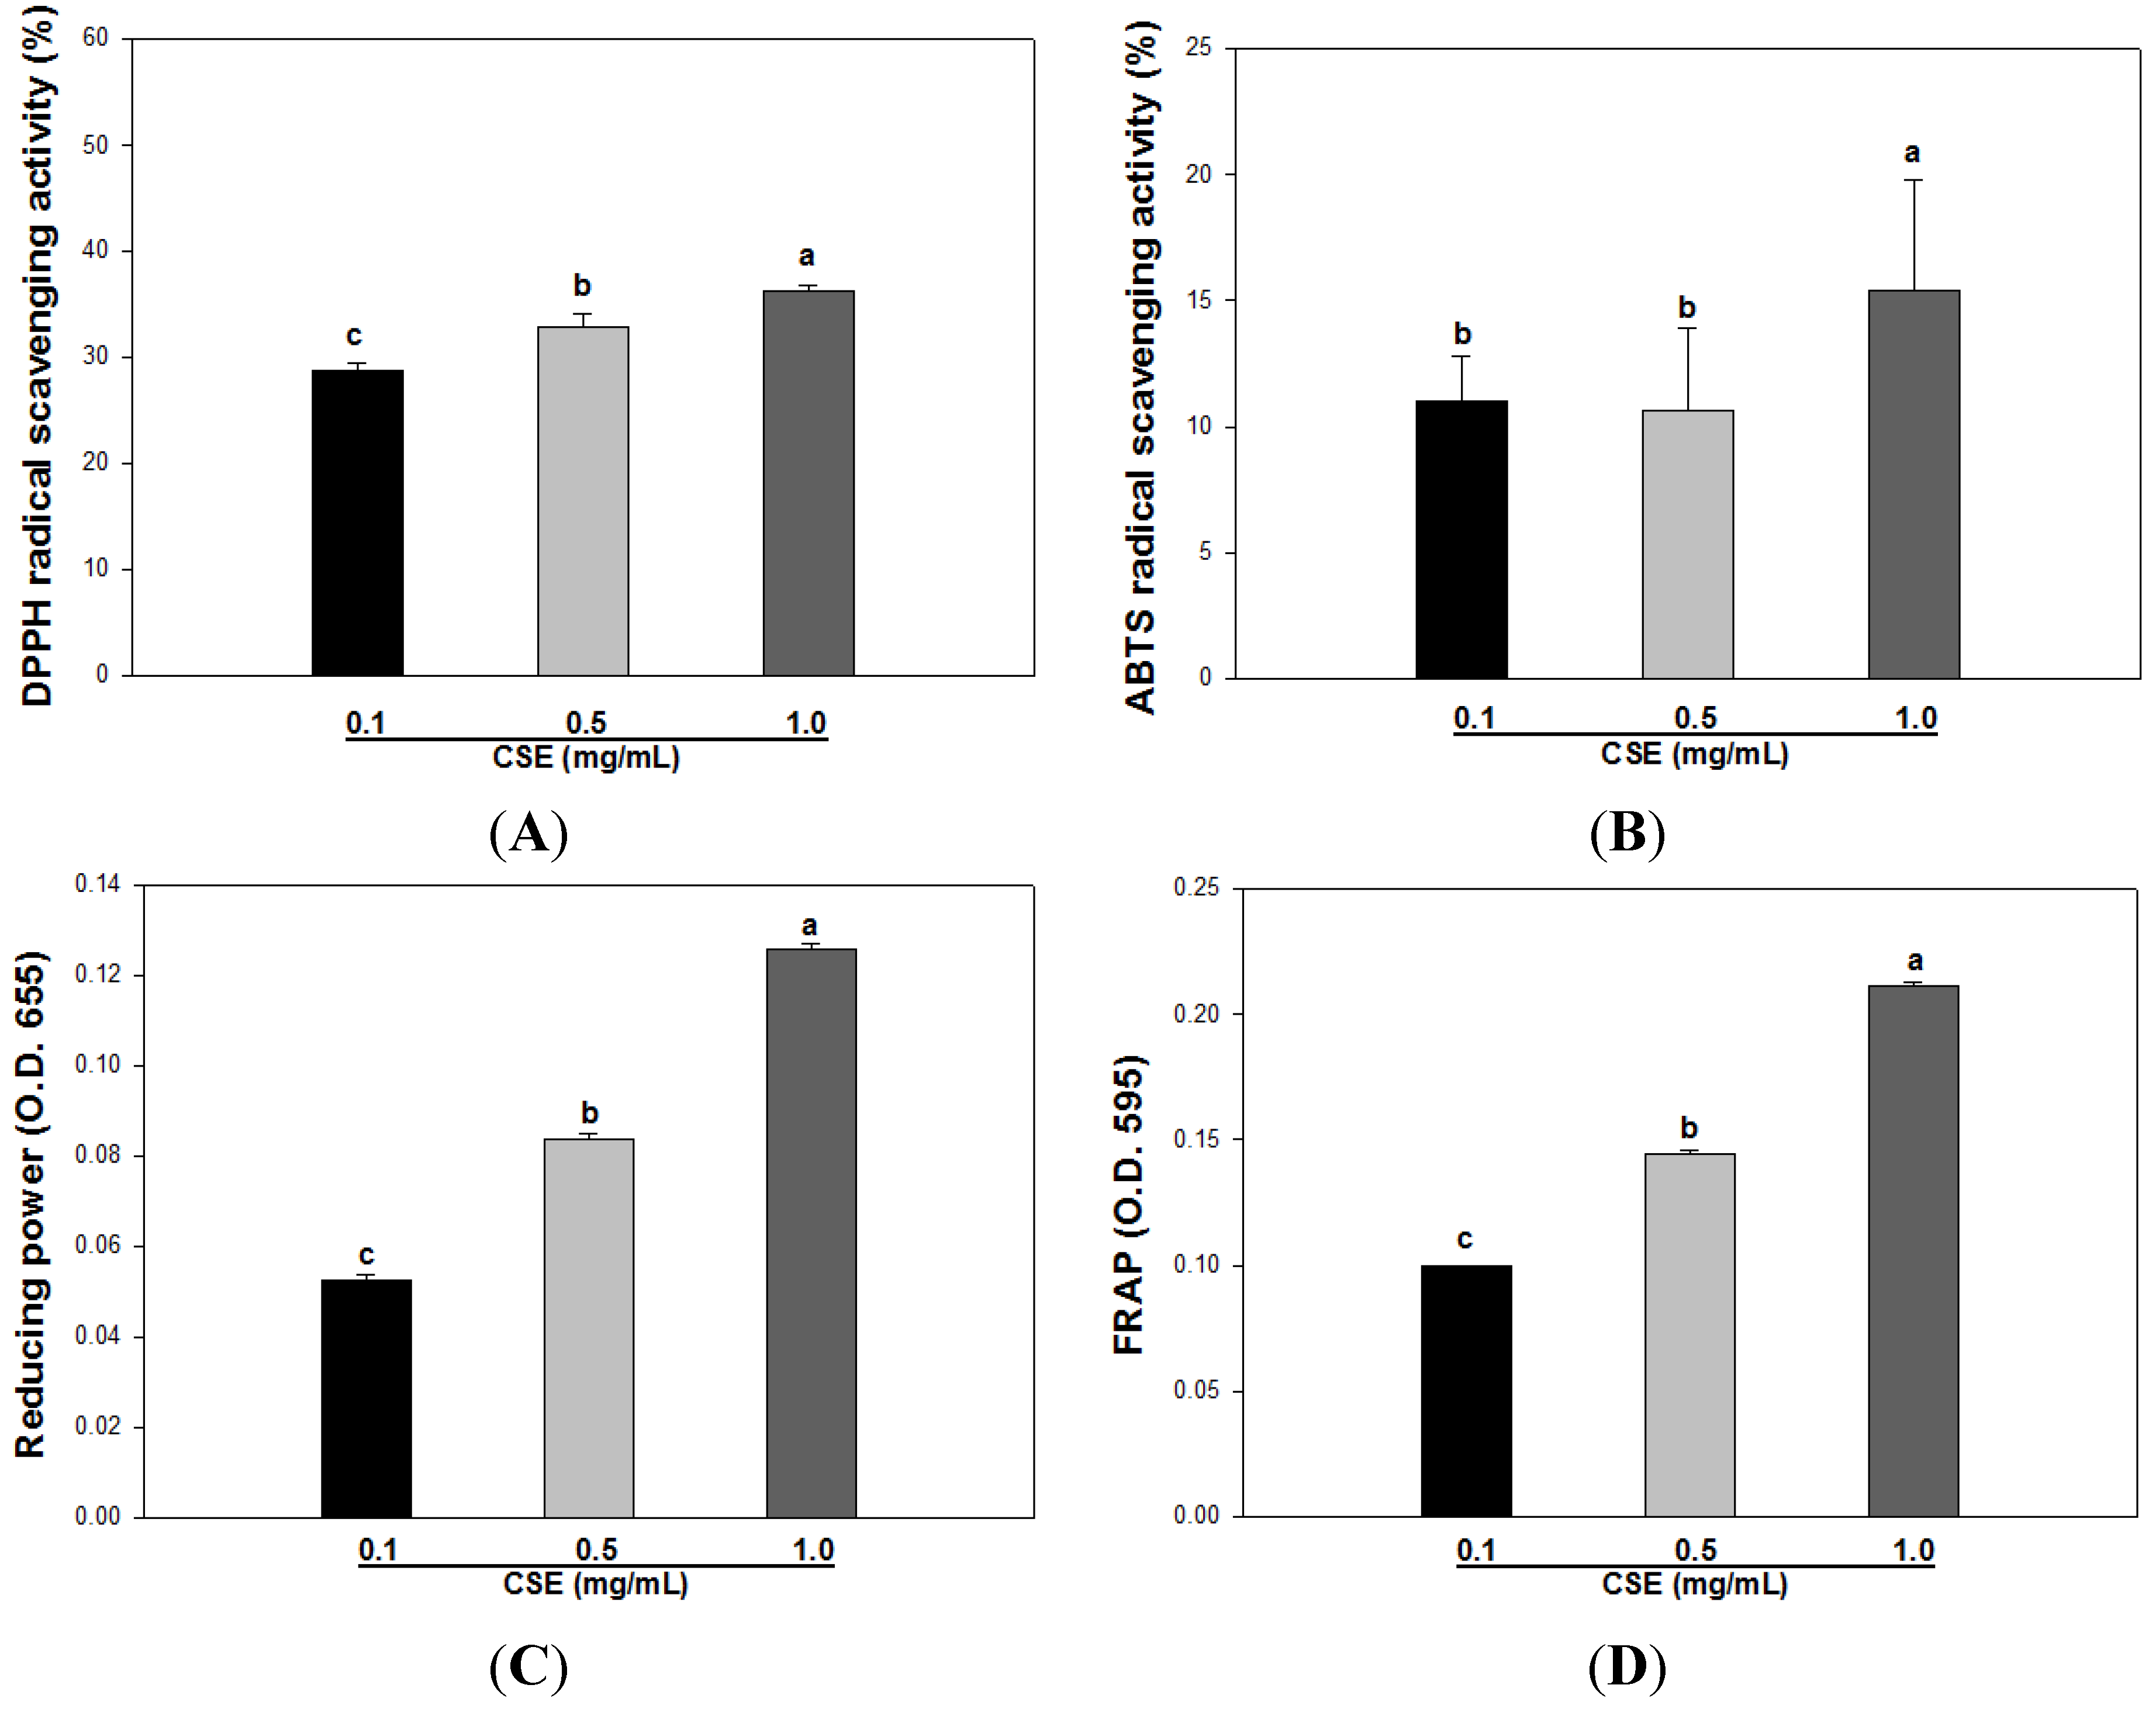
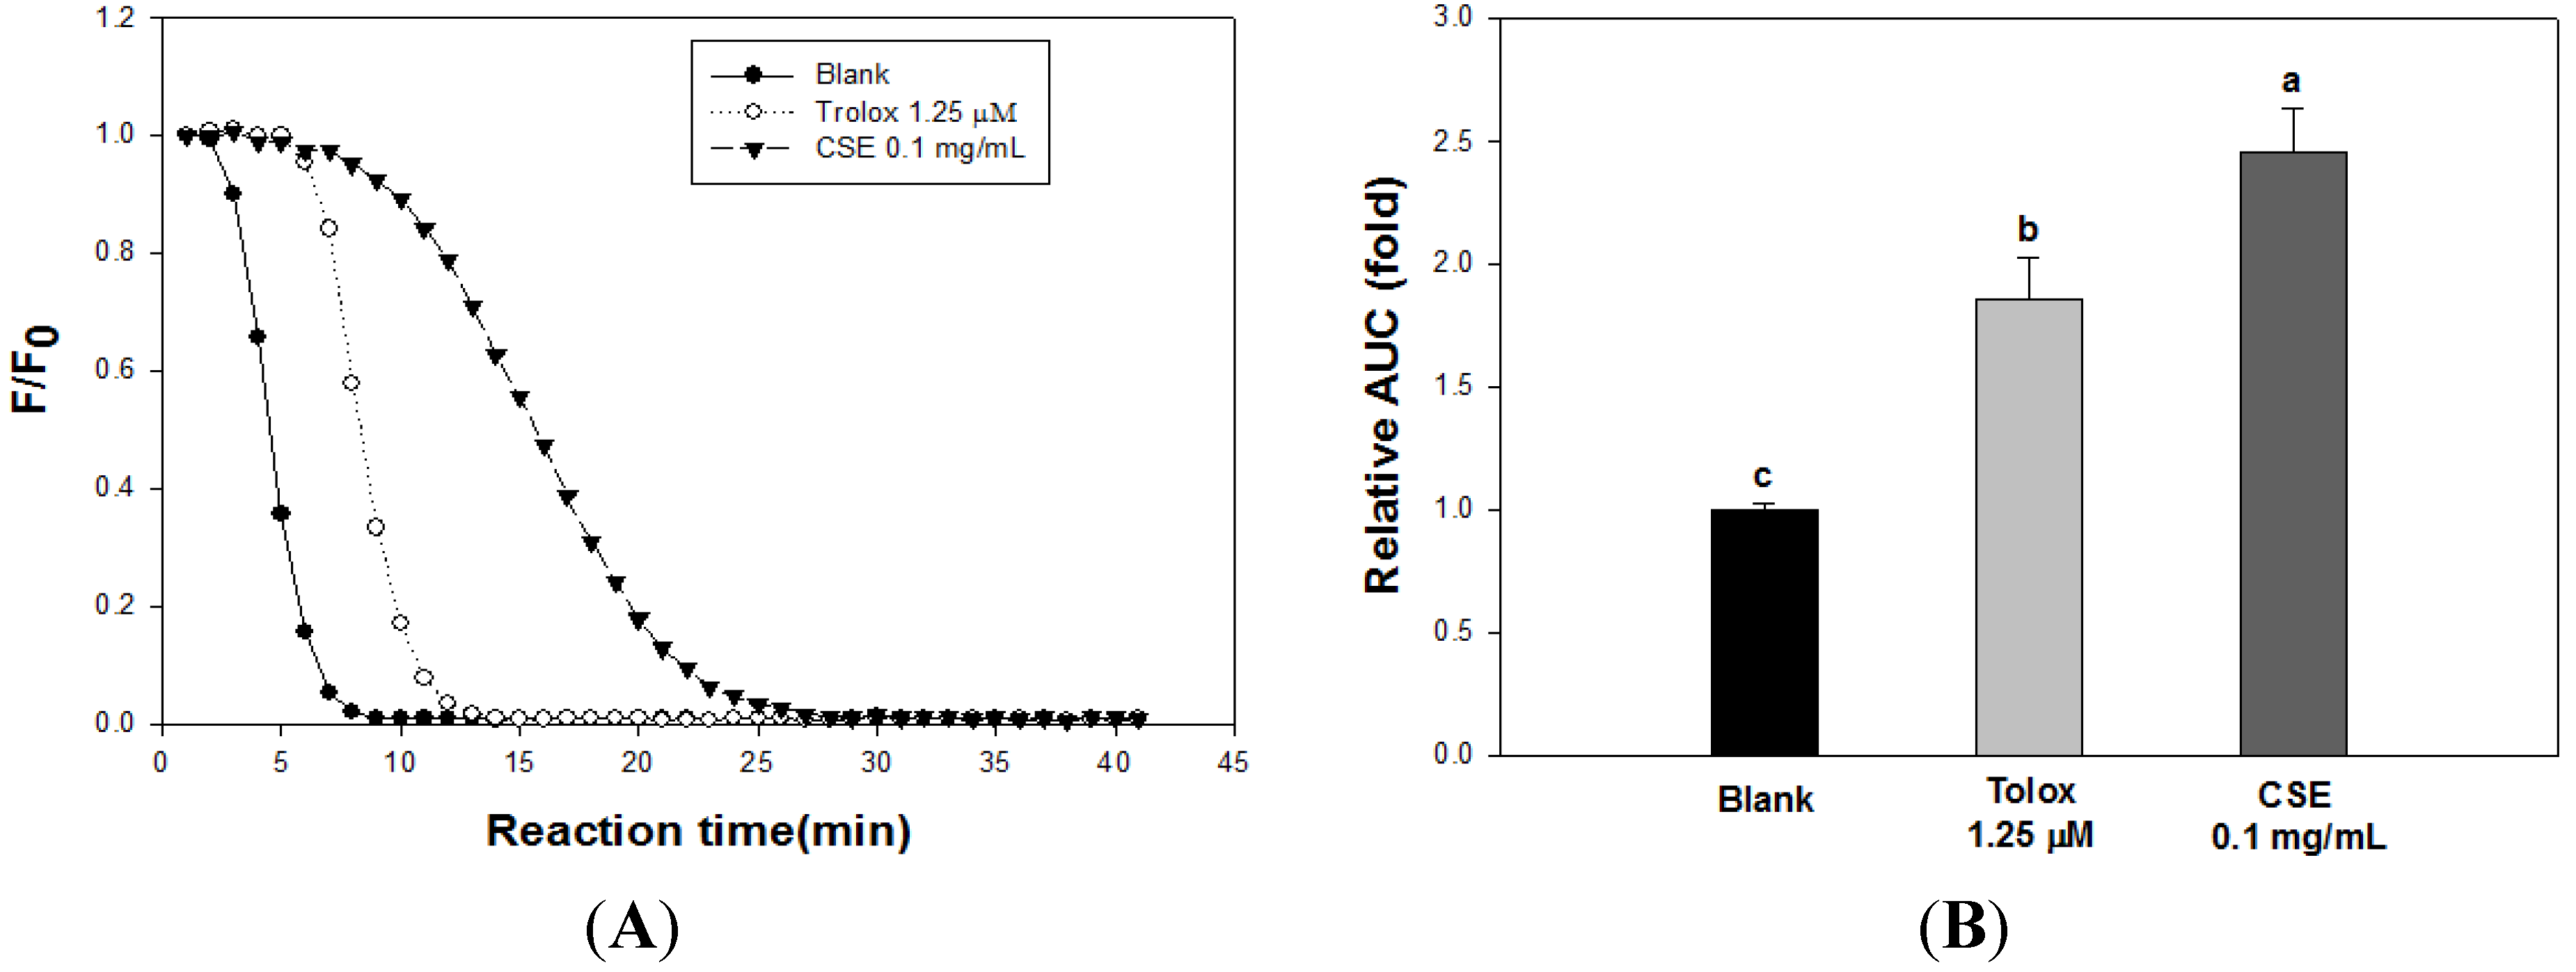
3.2. Effects of CSE on in Vitro Antioxidant Capacity

| DPPH | ABTS | Reducing Power | FRAP | |
|---|---|---|---|---|
| DPPH | - | 0.6139 ** | 0.9752 ** | 0.9679 ** |
| ABTS | 0.6139 ** | - | 0.7597 ** | 0.7782 ** |
| Reducing power | 0.9752 ** | 0.7597 ** | - | 0.9995 * |
| FRAP | 0.9679 ** | 0.7782 ** | 0.9995 * | - |
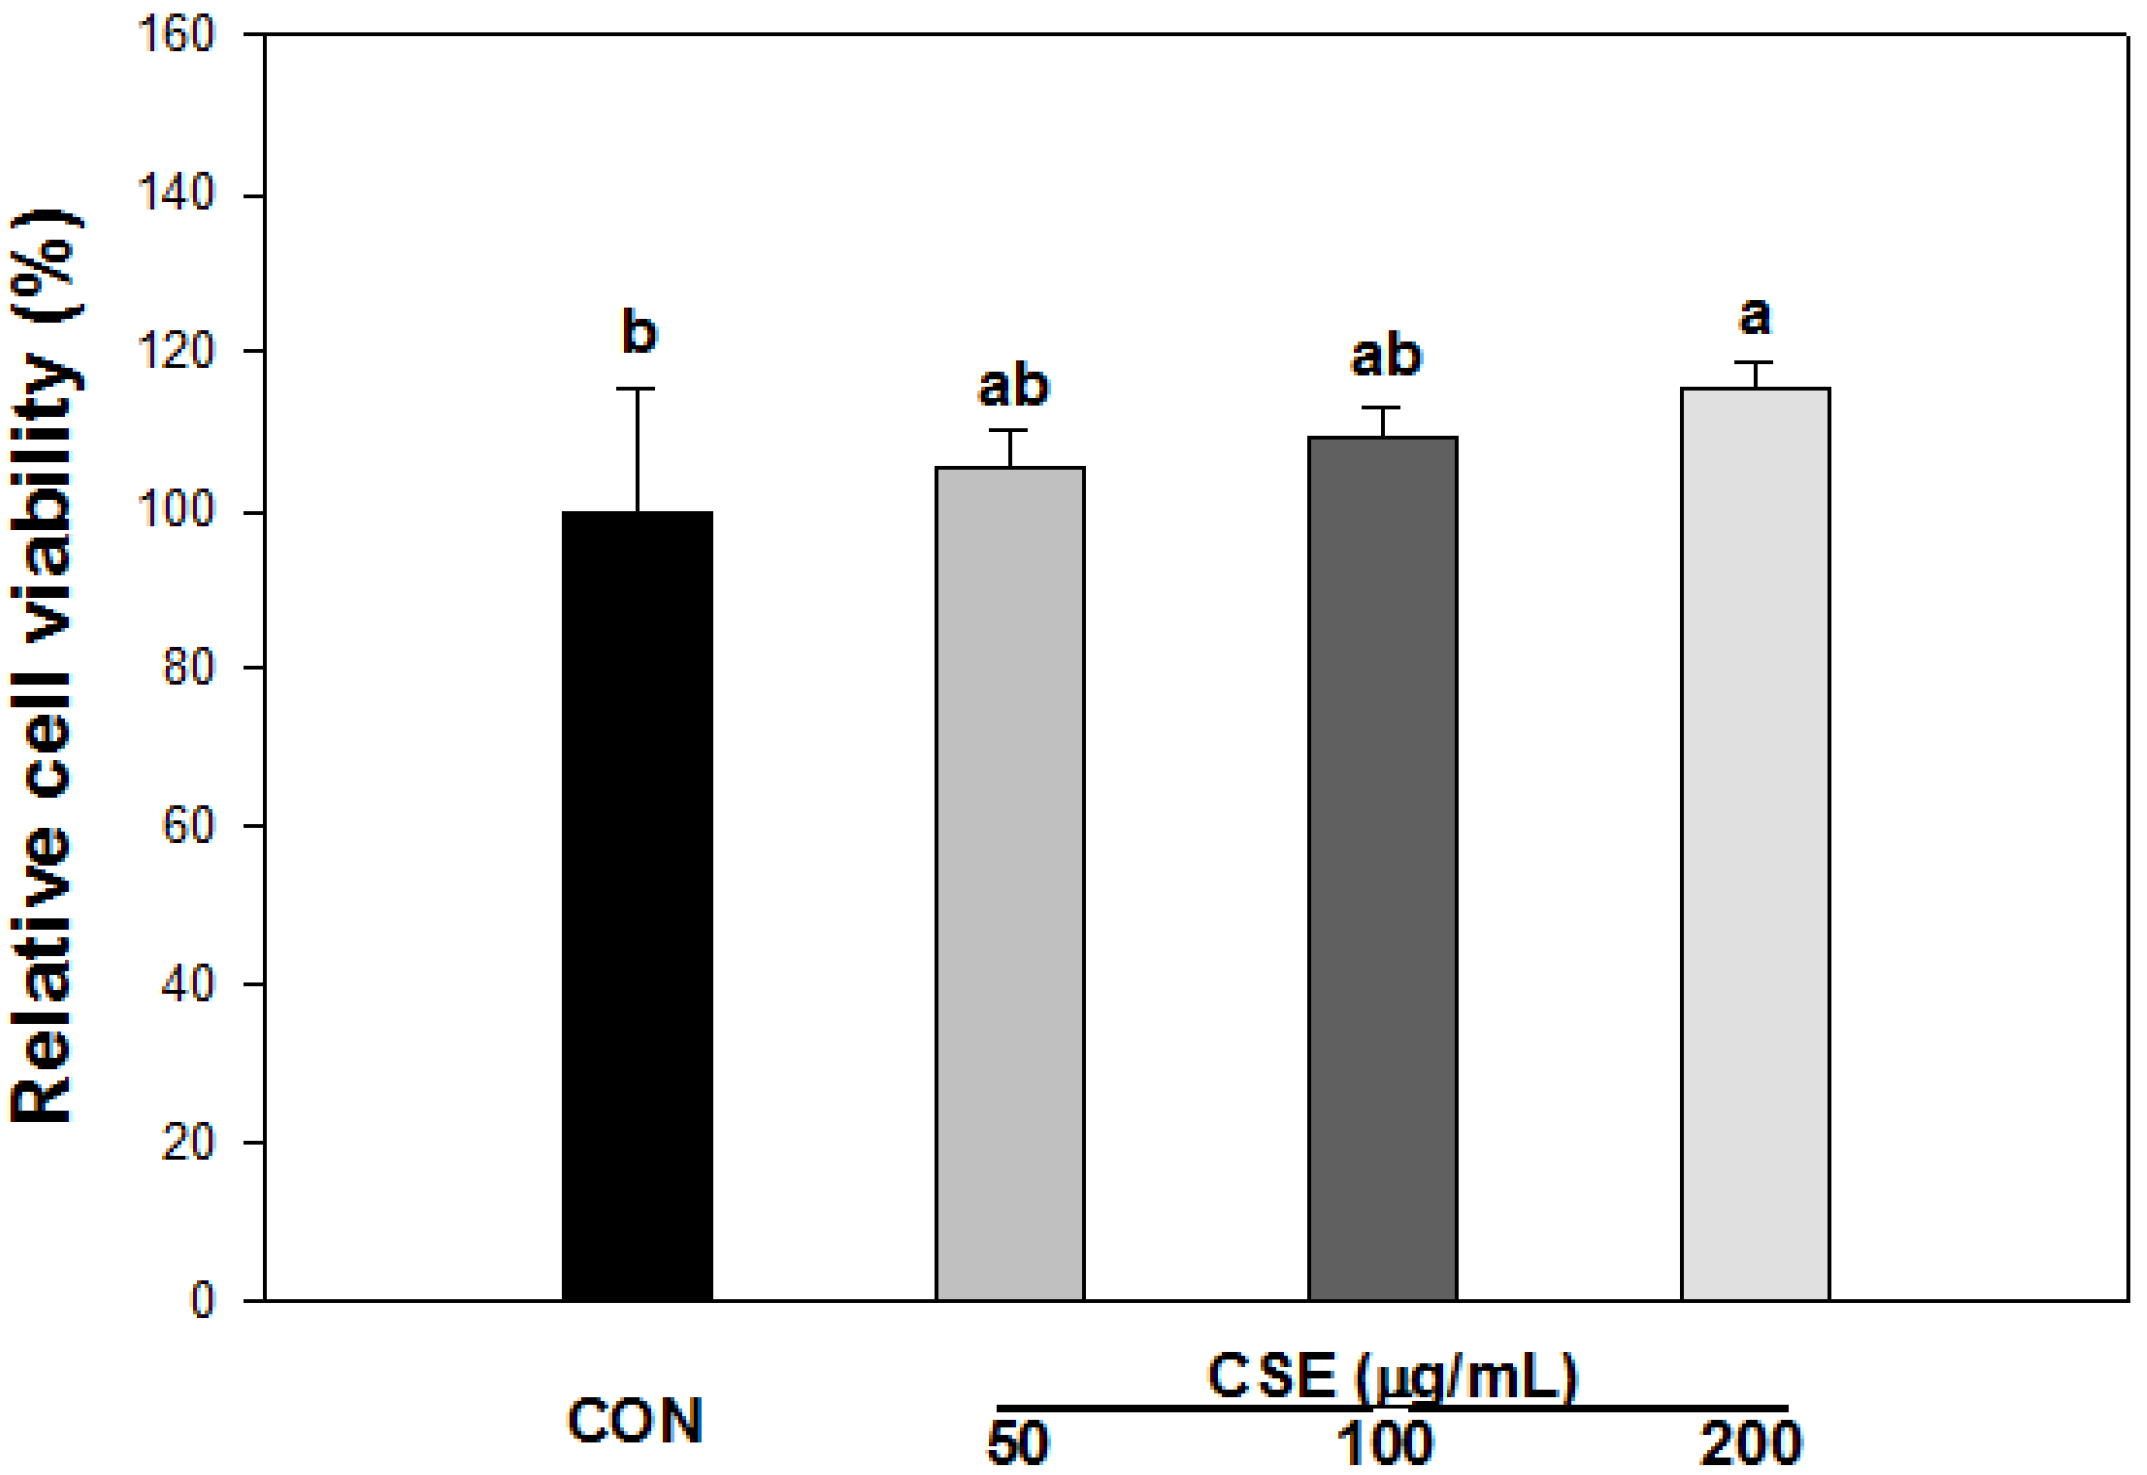
3.3. Cell Viability of CSE in 3T3-L1 Preadipocytes

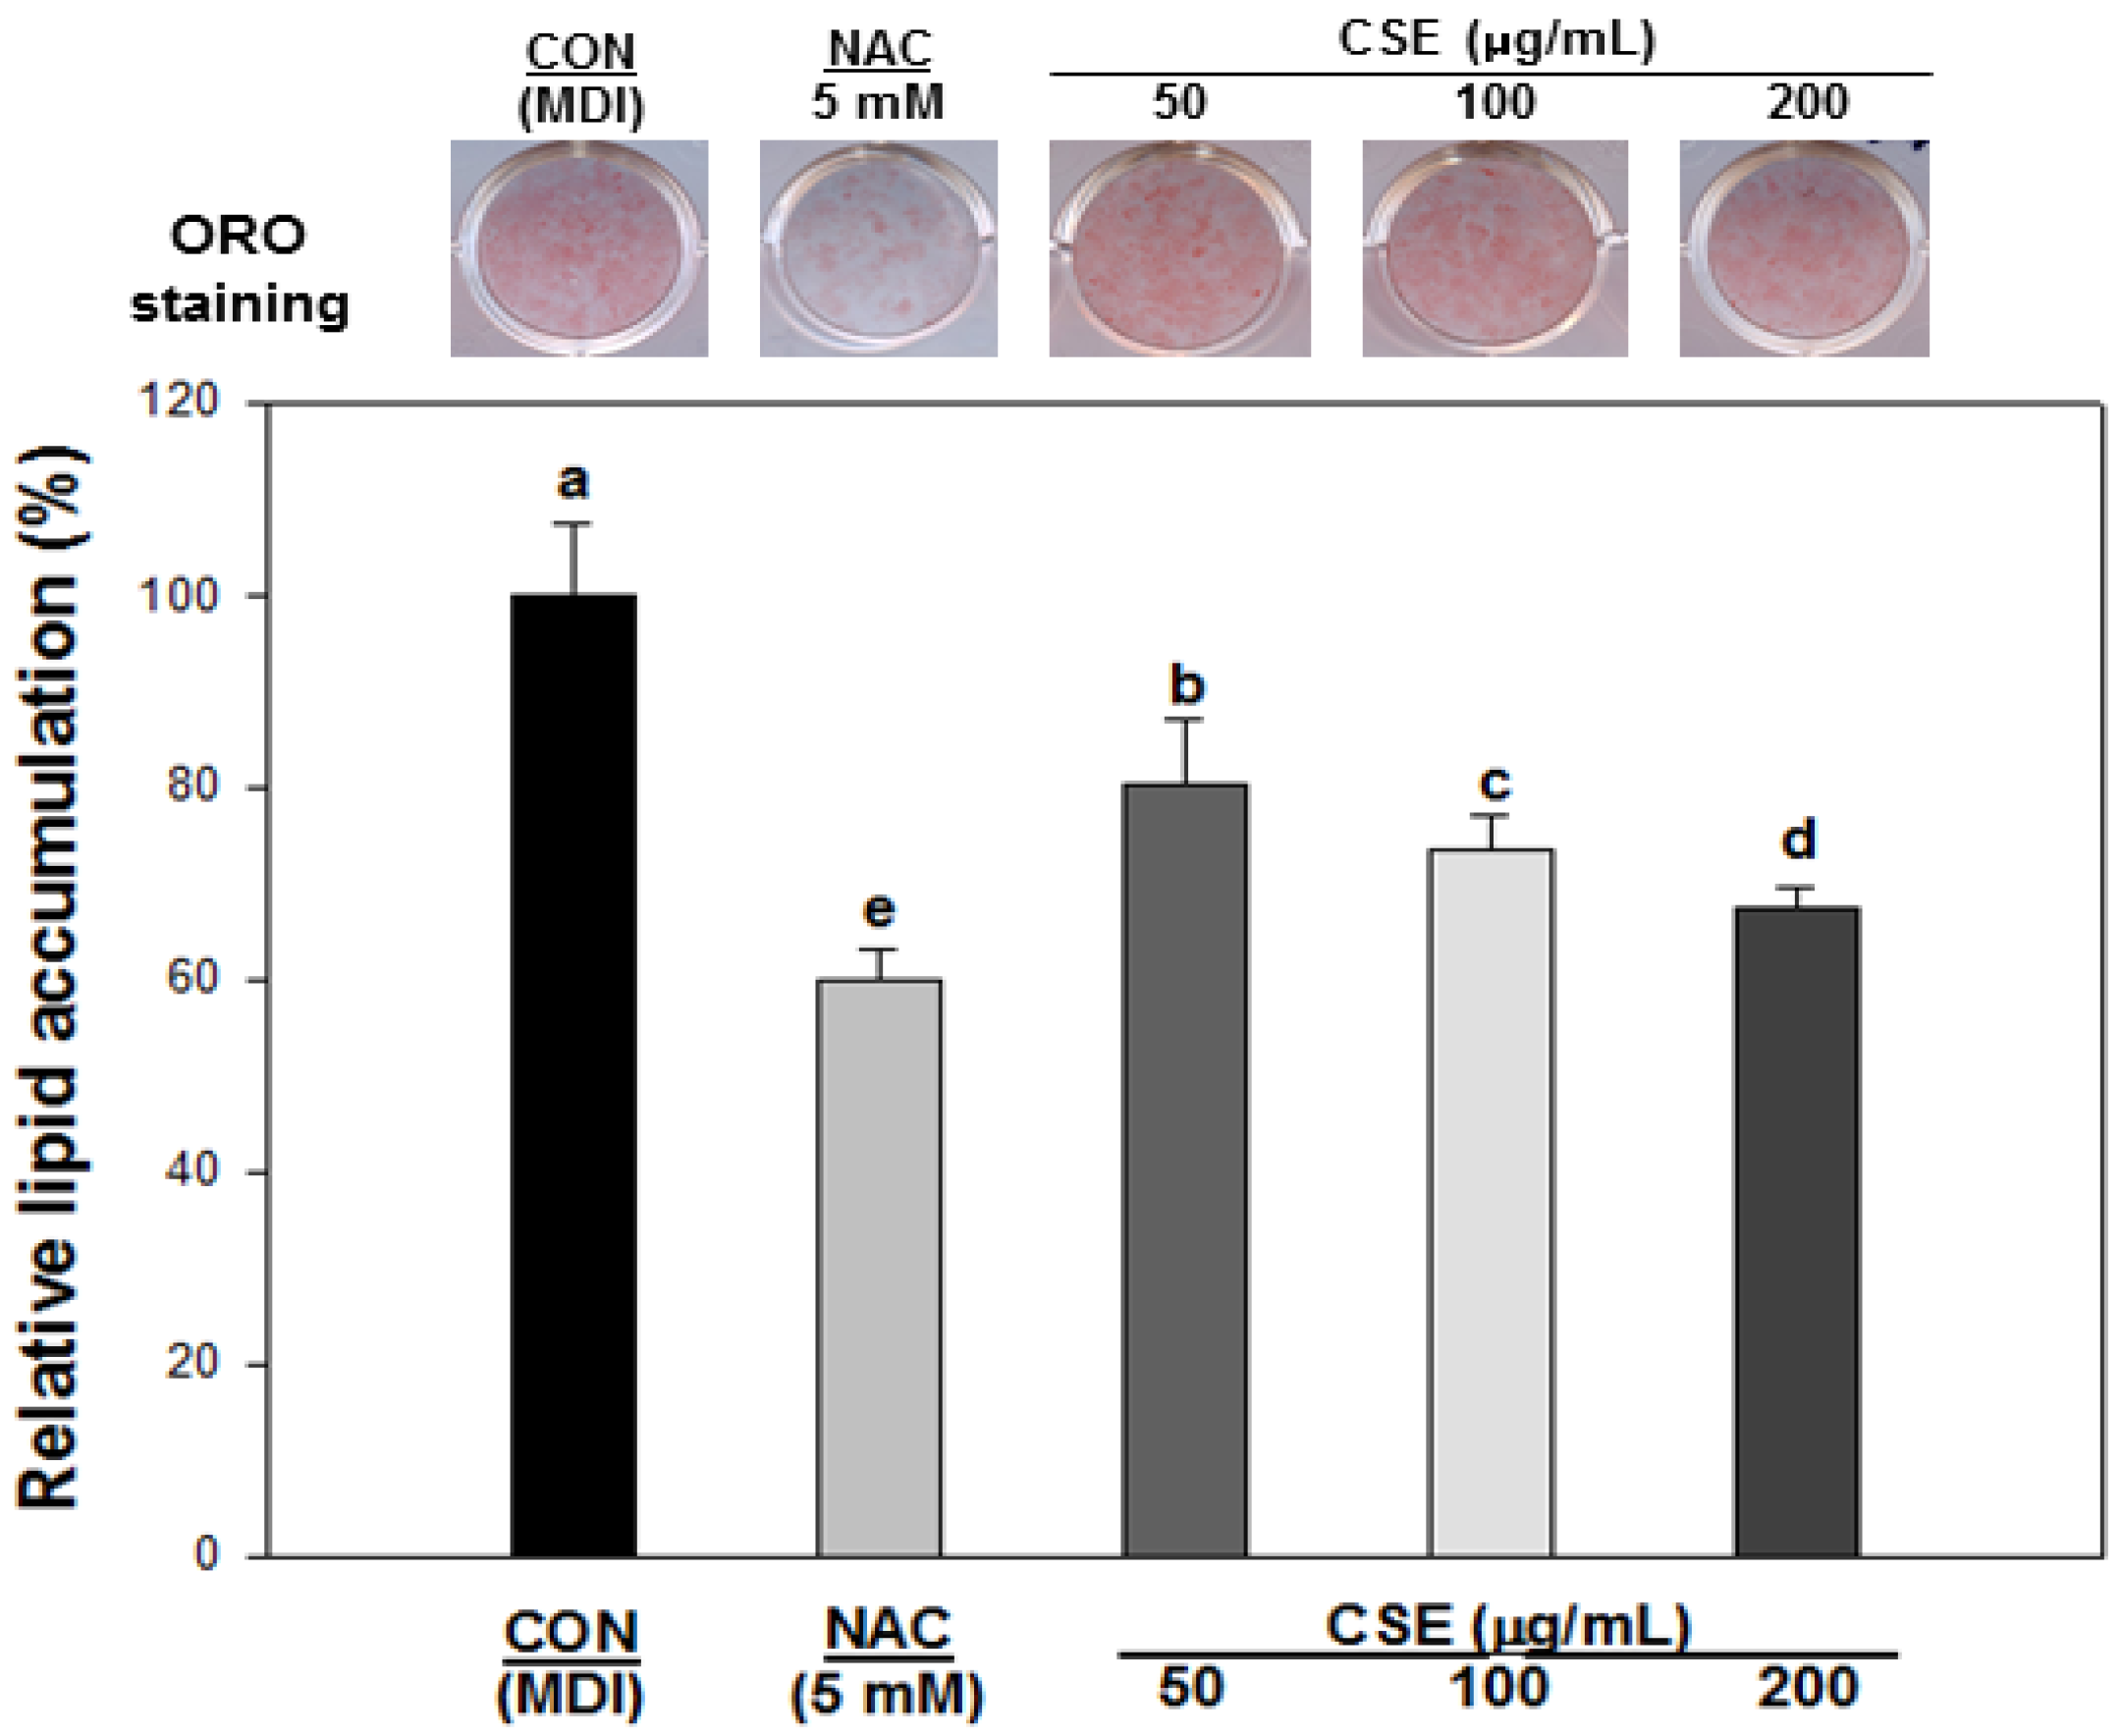
3.4. Effect of CSE on Lipid Accumulation in 3T3-L1 Cells
4. Discussion
5. Conclusions
Conflicts of Interest
References
- Noipa, T.; Srijaranai, S.; Tuntulani, T.; Ngeontae, W. New approach for evaluation of the antioxidant capacity based on scavenging DPPH free radical in micelle systems. Food Res. Int. 2011, 44, 798–806. [Google Scholar]
- Philip Jacob, P.; Madhumitha, G.; Mary Saral, A. Free radical scavenging and reducing power of Lawsonia inermis L. seeds. Asian Pac. J. Trop. Med. 2011, 4, 457–461. [Google Scholar] [CrossRef]
- Jackson, A.L.; Loeb, L.A. The contribution of endogenous sources of DNA damage to the multiple mutations in cancer. Mutat. Res. 2001, 477, 7–21. [Google Scholar] [CrossRef]
- Hensley, K.; Robinson, K.A.; Gabbita, S.P.; Salsman, S.; Floyd, R.A. Reactive oxygen species, cell signaling, and cell injury. Free Radic. Biol. Med. 2000, 28, 1456–1462. [Google Scholar]
- Luximon-Ramma, A.; Bahorun, T.; Soobrattee, M.A.; Aruoma, O.I. Antioxidant activities of phenolic, proanthocyanidin, and flavonoid components in extracts of Cassia fistula. J. Agric. Food Chem. 2002, 50, 5042–5047. [Google Scholar]
- Braca, A.; Sortino, C.; Politi, M.; Morelli, I.; Mendez, J. Antioxidant activity of flavonoids from Licania licaniaeflora. J. Ethnopharm. 2002, 79, 379–381. [Google Scholar] [CrossRef]
- Takahashi, T.; Miyazawa, M. Potent a-glucosidase inhibitors from safflower (Carthamus tinctorius L.) seed. Phytother. Res. 2012, 26, 722–726. [Google Scholar] [CrossRef]
- Bae, S.J.; Shim, S.M.; Park, Y.J.; Lee, J.Y.; Chang, E.J.; Choi, S.W. Cytotoxicity of phenolic compounds isolated from seeds of safflower (Carthamus tinctorius L.) on cancer cell lines. Food Sci. Biotechnol. 2002, 11, 140–146. [Google Scholar]
- Moon, K.D.; Back, S.S.; Kim, J.H.; Jeon, S.M.; Lee, M.K.; Choi, M.S. Safflower seed extract lowers plasma and hepatic lipids in rats fed high-cholesterol diet. Nutr. Res. 2001, 21, 895–904. [Google Scholar]
- Kim, H.J.; Bae, Y.C.; Park, R.W.; Choi, S.W.; Cho, S.H.; Choi, Y.S.; Lee, W.J. Bone-protecing effect of safflower seeds in ovariectomized rats. Calcif. Tissue Int. 2002, 71, 88–94. [Google Scholar] [CrossRef]
- Kim, E.O.; Lee, K.T.; Choi, S.W. Chemical comparison of germinated- and ungerminated-safflower (Carthamus tinctorius) seeds. J. Korean Soc. Food Sci. Nutr. 2008, 37, 1162–1167. [Google Scholar]
- Kim, E.O.; Oh, J.H.; Lee, S.K.; Lee, J.Y.; Choi, S.W. Antioxidant properties and quantification of phenolic compounds from safflower (Carthamus tinctorius L.) seeds. Food Sci. Biotechnol. 2007, 16, 71–77. [Google Scholar]
- Takimoto, T.; Suzuki, K.; Arisaka, H.; Murata, T.; Ozaki, H.; Koyama, N. Effect of N-(p-coumaroyl)serotonin and N-feruloylserotonin, major anti-atherogenic polyphenols in safflower seed, on vasodilation, proliferation and migration of vascular smooth muscle cells. Mol. Nutr. Food Res. 2001, 55, 1561–1571. [Google Scholar]
- Koyama, N.; Kuribayashi, K.; Seki, T.; Kobayashi, K.; Furuhata, Y.; Suzuki, K.; Arisaka, H.; Nakano, T.; Amino, Y.; Ishii, K. Serotonin derivatives, major safflower (Carthamus tinctorius L.) seedantioxidants, inhibit low-density lipoprotein (LDL) oxidation and atherosclerosis in apolipoprotein E-deficient mice. J. Agric. Food Chem. 2006, 54, 4970–4976. [Google Scholar]
- Roh, J.S.; Han, J.Y.; Kim, J.H.; Hwang, J.K. Inhibitory effects of active compounds isolatd from safflower (Carthamus tinctorius L.) seeds for melanogenesis. Biol. Pharm. Bull. 2004, 27, 1976–1978. [Google Scholar]
- Kim, J.H.; Choi, M.S.; Moon, K.D. Quality characteristic of drink and tea-bag processed with safflower seed powder. Korean J. Postharvest. Sci. Technol. 2000, 7, 171–176. [Google Scholar]
- Cho, S.H.; Lee, H.R.; Kim, T.H.; Choi, S.W.; Lee, W.J.; Choi, Y. Effects of defatted safflower seed extract and phenolic compounds in diet on plasma and liver lipid in ovariectomized rats fed high-cholesterol diets. J. Nutr. Sci. Vitaminol. 2004, 50, 32–37. [Google Scholar]
- Hsu, C.L.; Yen, G.C. Effects of flavonoids and phenolic acids on the inhibition of adipogenesis in 3T3-L1 Adipocytes. J. Agric. Food Chem. 2007, 55, 8404–8410. [Google Scholar]
- Hsu, C.L.; Yen, G.C. Induction of cell apoptosis in 3T3-L1 pre-adipocytes by flavonoids is associated with their antioxidant activity. Mol. Nutr. Food Res. 2006, 50, 1072–1079. [Google Scholar]
- Gutfinger, T. Polyphenols in olive oils. J. Am. Oil Chem. Soc. 1981, 58, 966–967. [Google Scholar]
- Moreno, M.I.N.; Isla, M.I.N.; Sampietro, A.R.; Vattuone, M.A. Comparison of the free radical scavenging activity of propolis from several region of Argentina. J. Enthropharmacol. 2000, 71, 109–114. [Google Scholar]
- Kim, J.H.; Park, J.H.; Park, S.D.; Choi, S.Y.; Seong, J.H.; Hoon, K.D. Preparation and antioxidant activity of health drink with extract powders from Safflower (Carthamus tinctorius L.) seed. Korean J. Food Sci. Technol. 2002, 34, 617–624. [Google Scholar]
- Roberta, R.; Nicoletta, P.; Anna, P.; Anath, P.; Min, Y.; Catherine, R.E. Antioxidant activity applying an improved ABTS radical cation decolorization assay. Free Radic. Biol. Med. 1999, 26, 1231–1237. [Google Scholar]
- Benzie, I.; Stranin, J. The ferric reducing ability of plasma (FRAP) as a measure of antioxidant power: The FRAP assay. Anal. Biochem. 1996, 239, 70–76. [Google Scholar]
- Yen, G.C.; Duh, P.D. Antioxidative properties of methanolic extracts from peanut hulls. J. Am. Oil Chem. Soc. 1993, 70, 383–386. [Google Scholar]
- Ou, B.; Hampsch Woodill, M.; Prior, R.L. Development and validation of an improved oxygen radical absorbance capacity assay using fluorescein as the fluorescent probe. J. Agric. Food Chem. 2001, 49, 4619–4626. [Google Scholar]
- Blumberg, J.M.; Tzameli, I.; Astapova, I.; Lam, F.S.; Flier, J.S.; Hollenberg, A. Complex role of the vitamin D receptor and its ligand in adipogenesis in 3T3-L1 cells. J. Biol. Chem. 2006, 28, 11205–11213. [Google Scholar]
- Kim, S.J.; Kim, S.M.; Kang, S.W.; Um, B.H. The rapid detection of antioxidants from safflower seeds (Carthamus tinctorius L.) using hyphenated-HPLC techniques. Korean J. Food Sci. Technol. 2010, 42, 414–419. [Google Scholar]
- Park, K.S.; Choi, Y.J.; Moon, Y.H.; Park, H.S.; Kim, M.J.; Jung, I.C. Physicochemical characteristics of ground pork with safflower seed powder as an animal fat replacer. J. Life Sci. 2012, 22, 928–935. [Google Scholar]
- Zhang, H.L.; Nagatsu, A.; Watanabe, T.; Sakakibara, J.; Okuyama, H. Antioxidative compounds isolated from safflower (Carthamus tinctorious L.) oil cake. Chem. Pharm. Bull. 1997, 45, 1910–1914. [Google Scholar]
- Kawashima, S.; Hayashi, M.; Takii, T.; Kimura, H.; Zhang, H.L.; Nagatsu, A.; Sakakibara, J.; Murata, K.; Oomoto, Y.; Onozaki, K. Serotonin derivative, N-(p-coumaroyl) serotonin, inhibits the production of TNF-α, IL-1α, IL-1β, and IL-6 by endotoxin-stimulated human blood monocytes. J. Interf. Cytokine Res. 1998, 18, 423–428. [Google Scholar]
- Furukawa, S.; Fujita, T.; Shimabukuro, M.; Iwaki, M.; Yamada, Y.; Nakajima, Y.; Nakayama, O.; Makishima, M.; Matsuda, M.; Shimomura, I. Increased oxidative stress in obesity and its impact on metabolic syndrome. J. Clin. Investig. 2004, 114, 1752–1761. [Google Scholar]
- Bursal, E.; Köksalv, E. Evaluation of reducing power and radical scavenging activities of water and ethanol extracts from sumac (Rhus coriaria L.). Food Res. Int. 2011, 44, 2217–2221. [Google Scholar]
- Floegel, A.; Kim, D.O.; Chung, S.J.; Koo, S.I.; Chun, O.K. Comparison of ABTS/DPPH assays to measure antioxidant capacity in popular antioxidant-rich US foods. J. Food Compos. Anal. 2011, 24, 1043–1048. [Google Scholar]
- Dudonné, S.; Vitrac, X.; Coutiere, P.; Woillez, M.; Merillon, J.M. Comparative study of antioxidant properties and total phenolic content of 30 plant extracts of industrial interest using DPPH, ABTS, FRAP, SOD, and ORAC assays. J. Agric. Food Chem. 2009, 57, 1768–1774. [Google Scholar]
- Boxin, O.U.; Huang, D.; Maureen, H.W.; Flanagan, J.A.; Elizabeth, K.D. Analysis of antioxidant activities of common vegetables employing Oxygen Radical Absorbance Capacity (ORAC) and Ferric Reducing Antioxidant Power (FRAP) assays: A comparative study. J. Agric. Food Chem. 2002, 50, 3122–3128. [Google Scholar]
- Kim, K.J.; Lee, O.H.; Lee, B.Y. Fucoidan, a sulfated polysaccharide, inhibits adipogenesis through the mitogen-activated protein kinase pathway in 3T3-L1 preadipocytes. Life Sci. 2010, 86, 791–797. [Google Scholar]
© 2013 by the authors; licensee MDPI, Basel, Switzerland. This article is an open access article distributed under the terms and conditions of the Creative Commons Attribution license (http://creativecommons.org/licenses/by/3.0/).
Share and Cite
Yu, S.-Y.; Lee, Y.-J.; Kim, J.-D.; Kang, S.-N.; Lee, S.-K.; Jang, J.-Y.; Lee, H.-K.; Lim, J.-H.; Lee, O.-H. Phenolic Composition, Antioxidant Activity and Anti-Adipogenic Effect of Hot Water Extract from Safflower (Carthamus tinctorius L.) Seed. Nutrients 2013, 5, 4894-4907. https://doi.org/10.3390/nu5124894
Yu S-Y, Lee Y-J, Kim J-D, Kang S-N, Lee S-K, Jang J-Y, Lee H-K, Lim J-H, Lee O-H. Phenolic Composition, Antioxidant Activity and Anti-Adipogenic Effect of Hot Water Extract from Safflower (Carthamus tinctorius L.) Seed. Nutrients. 2013; 5(12):4894-4907. https://doi.org/10.3390/nu5124894
Chicago/Turabian StyleYu, Seok-Yeong, Young-Jun Lee, Jong-Dai Kim, Suk-Nam Kang, Seong-Kap Lee, Jung-Young Jang, Hyo-Ku Lee, Jeong-Ho Lim, and Ok-Hwan Lee. 2013. "Phenolic Composition, Antioxidant Activity and Anti-Adipogenic Effect of Hot Water Extract from Safflower (Carthamus tinctorius L.) Seed" Nutrients 5, no. 12: 4894-4907. https://doi.org/10.3390/nu5124894
APA StyleYu, S.-Y., Lee, Y.-J., Kim, J.-D., Kang, S.-N., Lee, S.-K., Jang, J.-Y., Lee, H.-K., Lim, J.-H., & Lee, O.-H. (2013). Phenolic Composition, Antioxidant Activity and Anti-Adipogenic Effect of Hot Water Extract from Safflower (Carthamus tinctorius L.) Seed. Nutrients, 5(12), 4894-4907. https://doi.org/10.3390/nu5124894