1. Introduction
Vitamins A and E are fat-soluble micronutrients essential for vision, immune defense, neurological development, and antioxidant protection in children [
1,
2]. The liver is central to their handling: it is the main site of storage and metabolism and synthesizes the transport proteins that determine their bioavailability [
1,
3,
4]. In chronic liver disease (CLD), reduced bile acid secretion and impaired enterohepatic circulation cause fat malabsorption and progressive depletion of fat-soluble vitamin stores. Published pediatric series reported vitamin A deficiency in 67–77% and vitamin E deficiency in 41–91% of children with cholestatic CLD, compared with approximately 37% and 10.5%, respectively, in non-cholestatic CLD [
2,
5,
6].
Among the fat-soluble vitamins, vitamin E (α-tocopherol) is the most vulnerable to depletion in cholestatic conditions, because of its high hydrophobicity and its complete dependence on micellar solubilization for intestinal absorption [
1,
7]. When intraluminal bile acid concentrations fall below the critical micellar concentration, vitamin E absorption is severely impaired, and tissue stores decline [
3,
7]. If untreated, deficiency causes a progressive neuromuscular syndrome with areflexia, cerebellar ataxia, ophthalmoplegia, and, in infants, hemolytic anemia [
8,
9]. Because the neurological consequences are potentially irreversible, early detection is essential.
The interpretation of serum vitamin E is complicated by its lipoprotein dependence. Because α-tocopherol circulates almost entirely within lipoproteins, the hyperlipidemia characteristic of cholestasis can produce apparently normal serum concentrations even when tissue stores are depleted. Sokol and colleagues first demonstrated this discrepancy in children with chronic cholestasis: 3 of 11 patients (27%) with histopathologically confirmed vitamin E deficiency on sural nerve biopsy nonetheless had absolute serum α-tocopherol within the reference range [
7]. These findings led to the development of lipid-adjusted indices, initially the ratio of α-tocopherol to total lipids proposed by Horwitt and Sokol [
7,
10], and subsequently the simpler and more accessible ratios to cholesterol (E:C) and to triglycerides (E:TG), which have been evaluated in adults and children with a range of conditions [
11].
The CALIPER (Canadian Laboratory Initiative on Pediatric Reference Intervals) program established age-specific reference intervals for vitamins A and E in a cohort of 342 healthy children from birth to 19 years, and additionally defined normative ranges for the E:C and E:TG ratios [
12]. These ratios can be calculated from a standard lipid panel and do not require the phospholipid quantification needed for the original Sokol formula. Their application in pediatric CLD, however, has been reported mainly in single-etiology cohorts, most often biliary atresia, which limits the generalisability of prior findings [
5].
Vitamin A status in CLD is governed by partly distinct mechanisms. Dietary retinol requires bile-dependent micellar absorption; thus, cholestasis reduces uptake via the same route as for vitamin E [
2,
3]. In addition, hepatocellular dysfunction impairs the synthesis of retinol-binding protein (RBP4), which is required to mobilize retinol from hepatic stores, and RBP4 is a negative acute-phase reactant whose circulating levels are further suppressed during chronic inflammation [
13]. Serum retinol is homeostatically regulated and remains within range until hepatic stores are markedly depleted, so the WHO threshold of 0.70 µmol/L identifies advanced rather than early deficiency [
14].
A practical limitation of many pediatric centers is that HPLC analysis of retinol and α-tocopherol is not routinely available. Enzyme-linked immunosorbent assays (ELISA) are widely available but have not been systematically evaluated in pediatric CLD. Because the CALIPER reference values were established by HPLC, applying them to ELISA-derived measurements is an exploratory step; its analytical implications are set out in the Methods and the Discussion.
Serum vitamin D has been inversely correlated with liver stiffness measured by shear wave elastography in children after Kasai portoenterostomy [
15], but no equivalent analysis has been reported for vitamins A or E using lipid-adjusted indices in a mixed-etiology pediatric CLD cohort. The relationship between fat-soluble vitamin status and the severity of fibrosis has also not been systematically investigated using these indices.
The primary question of this exploratory study concerns vitamin E; vitamin A was examined as a complementary analysis. The aims were (i) to describe vitamin E status, and complementarily vitamin A status, in a mixed-etiology pediatric CLD cohort using immunoassay-based measurement and age-stratified CALIPER reference intervals; (ii) to quantify the extent to which lipid-adjusted interpretation of vitamin E reclassifies children compared with the absolute vitamin E concentration; (iii) to perform a pre-specified secondary analysis across three clinically meaningful groups (cholestatic CLD, non-cholestatic CLD and post-transplant); and (iv) to examine relationships between vitamin E indices and biochemical markers of disease severity, hepatic fibrosis and serum vitamin D. Because measurement was performed by immunoassay rather than HPLC, the study is framed as exploratory: the primary interpretive question is whether lipid-adjusted indices change how children are classified, not whether the absolute prevalence of deficiency is precisely quantified.
2. Materials and Methods
2.1. Study Design and Population
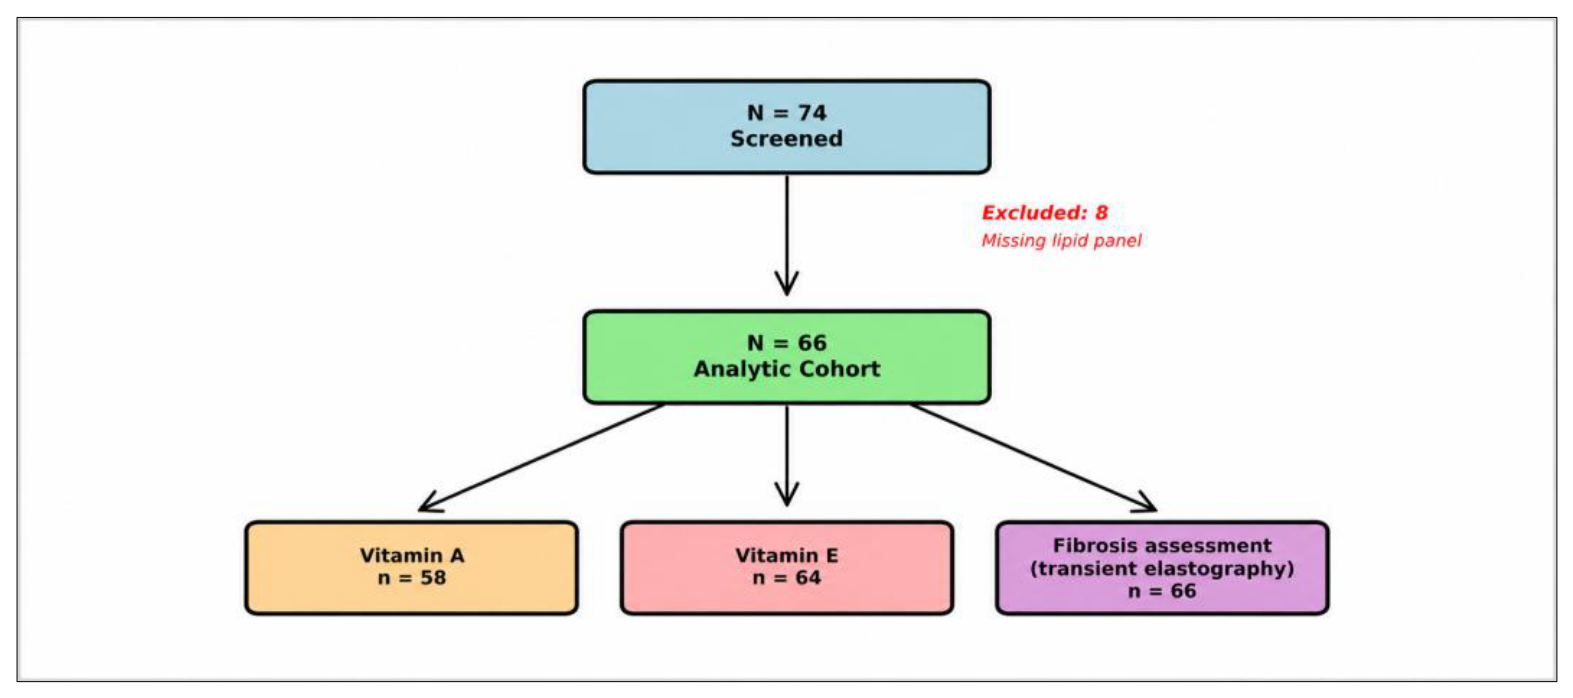
This was an exploratory, single-center, observational cross-sectional study conducted at the 2nd Pediatric Clinic, Emergency Clinical Hospital for Children, Cluj-Napoca, Romania, between January 2023 and November 2024. Children aged 2 months to 18 years with established CLD of any etiology followed at the center during the study period were eligible; the observed age range of the 66 children enrolled was 4 months to 17.9 years. Because the pre-specified indices required a fasting lipid panel, children without contemporaneous total cholesterol and triglycerides were excluded. Transient elastography was required to assess fibrosis. Of 74 children initially screened, 8 were excluded because of an incomplete lipid panel, leaving an analytic cohort of 66 (
Figure 1).
The study was approved by the Ethics Committee of the Emergency Clinical Hospital for Children, Cluj-Napoca (approval number 94/28.07.2023) and was conducted in accordance with the Declaration of Helsinki. Written informed consent was obtained from parents or legal guardians and assent from children aged seven years or older.
2.2. Clinical and Biochemical Assessment
Patients were assessed at a single study visit. Fasting venous blood was drawn after an overnight fast of at least 8 to 12 h into serum separator tubes. Total and direct bilirubin, gamma-glutamyltransferase (GGT), cholinesterase, total cholesterol, and triglycerides were measured by standardized automated methods on a Mindray BS-2800M biochemistry analyzer (Mindray Bio-Medical Electronics, Shenzhen, China). Serum albumin, prothrombin time, and 25-hydroxyvitamin D were measured on a Mindray CL-8000i chemiluminescence immunoassay analyzer at the same visit. All laboratory determinations were performed at the certified laboratory of the Emergency Clinical Hospital for Children, Cluj-Napoca. Liver fibrosis was staged by transient elastography using a FibroScan device (Echosens, Paris, France) with pediatric-appropriate probe selection and quality criteria (at least 10 valid measurements, interquartile range to median ratio below 30%), by an experienced operator, and expressed as METAVIR stage F0 to F4 using etiology-adjusted cutoffs.
Etiological categories were autoimmune hepatitis, cholestatic disease (biliary atresia post-Kasai, Alagille syndrome [
16], progressive familial intrahepatic cholestasis, other chronic cholestatic disorders) [
17], chronic hepatitis B, Wilson disease, metabolic disease, vascular disease, and post-liver transplantation. For the pre-specified secondary analysis, children were grouped into three clinically meaningful categories: (i) biochemical cholestasis, defined per the ESPGHAN/NASPGHAN 2017 criteria as conjugated (direct) bilirubin above 1.0 mg/dL when total bilirubin was below 5.0 mg/dL, or above 20% of total when total was 5.0 mg/dL or higher [
18]; (ii) non-cholestatic CLD; and (iii) post-transplant recipients. In this cohort, the biochemical and the etiological (clinical) definitions of cholestasis identified the same 15 children. This complete overlap is expected given that biochemical cholestasis is, by definition, a feature of the underlying cholestatic disorders included in the etiological category, and no children with non-cholestatic etiologies met the ESPGHAN biochemical criterion at the study visit. The two definitions are not independent constructs in the analysis and are reported together for transparency.
2.3. Vitamin A and Vitamin E Measurement
Serum retinol (vitamin A) was measured using a competitive ELISA (Vitamin A ELISA Kit, Cat. No. E-EL-0135, Elabscience Bionovation Inc., Wuhan, China) according to the manufacturer’s instructions. The assay is based on competitive inhibition with a tetramethylbenzidine (TMB) substrate, and absorbance was read at 450 nm. The analytical measurement range was 15.63 to 1000 ng/mL, with a sensitivity of 9.38 ng/mL and recovery of 80 to 120%; the manufacturer reports no significant cross-reactivity with structural analogs.
Serum vitamin E was measured using a double-antibody sandwich ELISA (Human Vitamin E ELISA Kit, Cat. No. MBS269047, MyBiosource Inc., San Diego, CA, USA) with a monoclonal capture antibody, a biotinylated detection antibody, horseradish peroxidase-avidin conjugation, and TMB detection at 450 nm. The analytical range was 1.56 to 100 µg/mL, with a sensitivity of 0.5 µg/mL, an intra-assay coefficient of variation ≤ 8%, and an inter-assay coefficient of variation ≤12%. This kit quantifies total circulating vitamin E without manufacturer-specified selectivity for individual tocopherol forms, whereas the CALIPER reference intervals were established for α-tocopherol measured by HPLC [
12]. Because α-tocopherol represents approximately 90% of circulating vitamin E in humans [
19], a low total vitamin E value necessarily implies low α-tocopherol; any small overestimation from other tocopherol forms would, if present, lead to underestimation rather than overestimation of the true prevalence of deficiency, which is a conservative bias for the interpretation of the present data. The immunoassay platform used here, and the HPLC platform used for CALIPER are not directly interchangeable; therefore, the CALIPER cutoffs were used as an interpretive framework rather than as a validation reference. Accordingly, the measured variable is reported throughout as total vitamin E, and the absolute, E:C and E:TG classifications are exploratory applications of CALIPER-derived cutoffs to a different analytical method.
Retinol (ng/mL) was converted to µmol/L by dividing by 286.45, the molecular weight of all-trans-retinol. Vitamin E (µg/mL) was converted to µmol/L using the formula µg/mL × 1000 ÷ 430.71, based on the molecular weight of α-tocopherol. Total cholesterol and triglycerides (mg/dL) were converted to mmol/L using conversion factors of 38.67 and 88.57, respectively.
2.4. Classification of Vitamin Status
Vitamin A was classified using the WHO threshold for serum retinol (below 0.70 µmol/L) and the age-stratified CALIPER lower limits (below 0.30 µmol/L for ages 0 to 1 year, below 1.00 for ages 1 to 11 years, below 0.90 for ages 11 to 16 years, and below 1.00 for ages 16 to 19 years) [
12,
14].
Vitamin E status was assessed using three classifications: (i) absolute total vitamin E below age-stratified thresholds (below 5 µmol/L for those under 12 months, below 12 µmol/L for older children); (ii) E:C ratio, calculated as total vitamin E (µmol/L) divided by total cholesterol (mmol/L), with the CALIPER lower reference limit of 3.7; (iii) E:TG ratio, calculated as total vitamin E (µmol/L) divided by triglycerides (mmol/L), with the CALIPER lower reference limit of 8.5. The E:C and E:TG cutoffs derived from CALIPER apply to children aged 1 to 19 years; no CALIPER-derived lipid-adjusted cutoff is available for infants under 12 months of age. The four infants under 12 months in our cohort were included in the E:C and E:TG analyses using the same cutoffs. This extrapolation is exploratory and is flagged as such wherever these children affect a result: no lipid-adjusted cutoff has been derived for this age group, and infant lipid metabolism differs from that of older children, so the lipid-adjusted classification of these four children is not a reference-interval-based determination. They were retained in the primary analysis so that the reported cohort is the cohort seen, and the pre-specified sensitivity analysis in Section Sensitivity Analysis Excluding Infants Under 12 Months repeats every principal result with the four infants excluded. Because measurement was based on immunoassay rather than HPLC, the terminology “vitamin E inadequacy” or “low lipid-adjusted vitamin E index” is used throughout, reserving the term “deficiency” for classifications derived from HPLC-based measurement. Blood samples in this cohort were obtained after fasting, whereas the CALIPER reference intervals were established from non-fasting samples; the implications of this methodological difference are addressed in the Discussion.
2.5. Statistical Analysis
Statistical analyses were conducted in jamovi 2.7.30 (jamovi project; jamovi.org), which runs on R 4.5. Because all vitamin variables deviated from normality (Shapiro–Wilk
p < 0.001), continuous variables were compared with rank-based tests (Kruskal–Wallis across three groups, Mann–Whitney U between two) and associations between continuous variables were assessed with Spearman rank correlation. Categorical variables were compared with Fisher exact test, which was used in preference to the chi-square test because expected cell counts below five arise in every comparison involving the six-child post-transplant group. No formal correction for multiple comparisons was applied: the analyses are exploratory, so
p-values are reported as descriptive quantities alongside effect estimates and confidence intervals rather than as confirmatory tests. Publication-ready figures were generated in Google Colaboratory (Google LLC, Mountain View, CA, USA;
https://colab.research.google.com, accessed on 1 October 2026) using Python 3.9 (matplotlib 3.5, seaborn 0.12, scipy 1.9) for Figures 1, 2 and 4, and Python 3.13 (matplotlib 3.10, scipy 1.16) for Figures 3, 5 and 6, which were regenerated at the proof stage, at 300 dpi.
During the preparation of this manuscript, the authors used Claude (Anthropic) to assist with synthesizing published literature and with improving the language and structure of the text. The tool was not used for study design, patient screening, data collection, statistical analysis, or the generation of data, results, or conclusions. The authors reviewed and edited all output and take full responsibility for the content.
4. Discussion
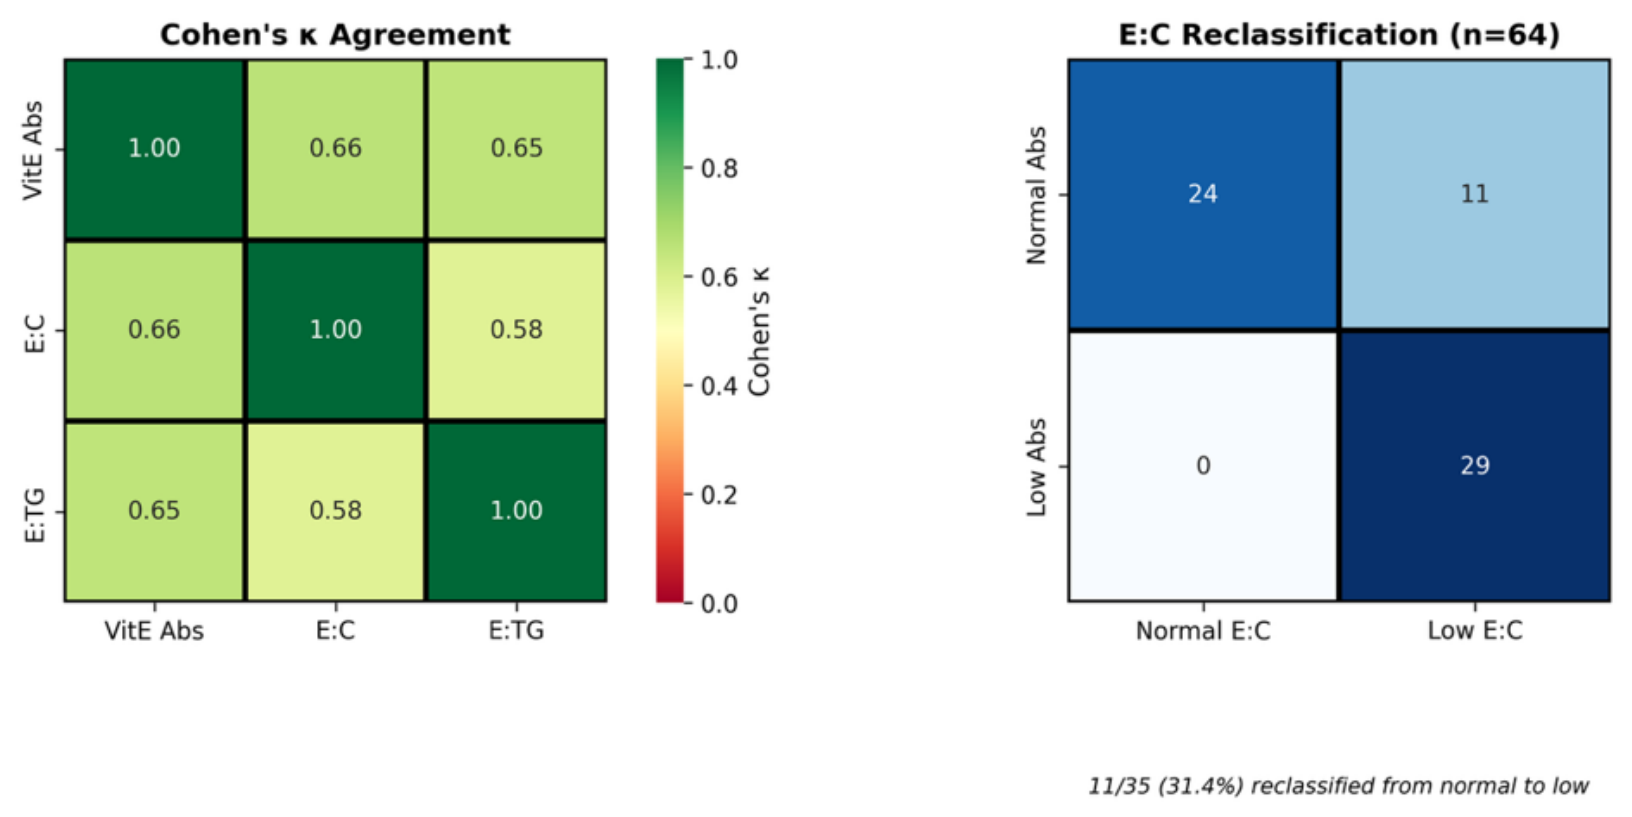
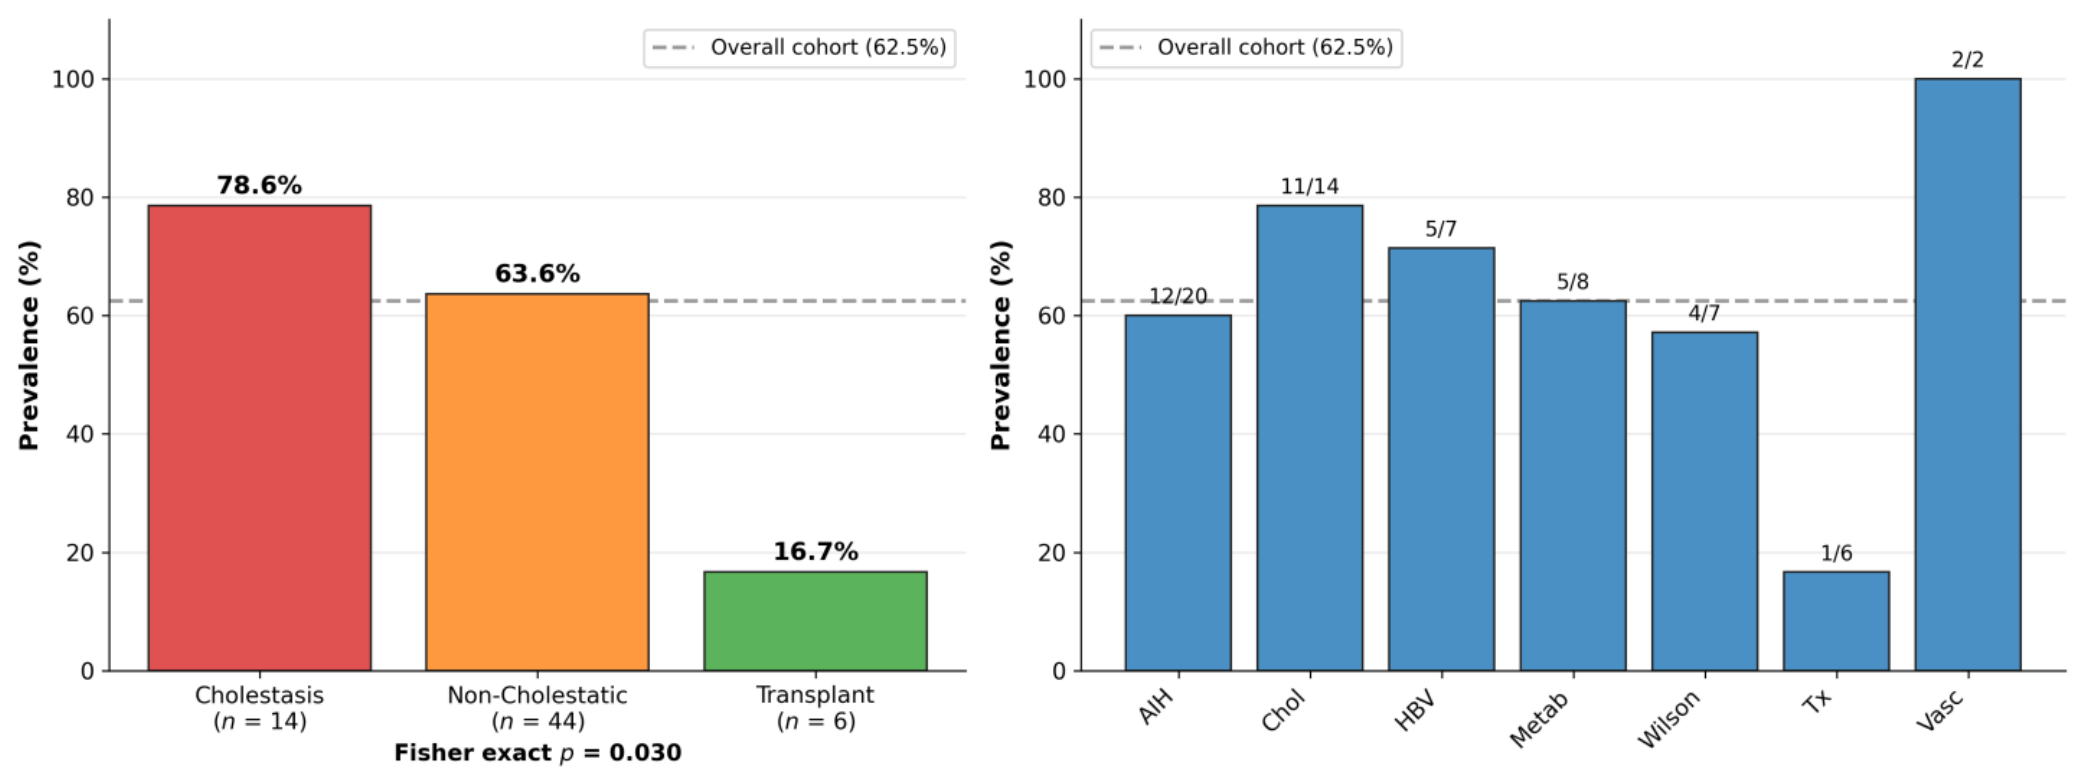
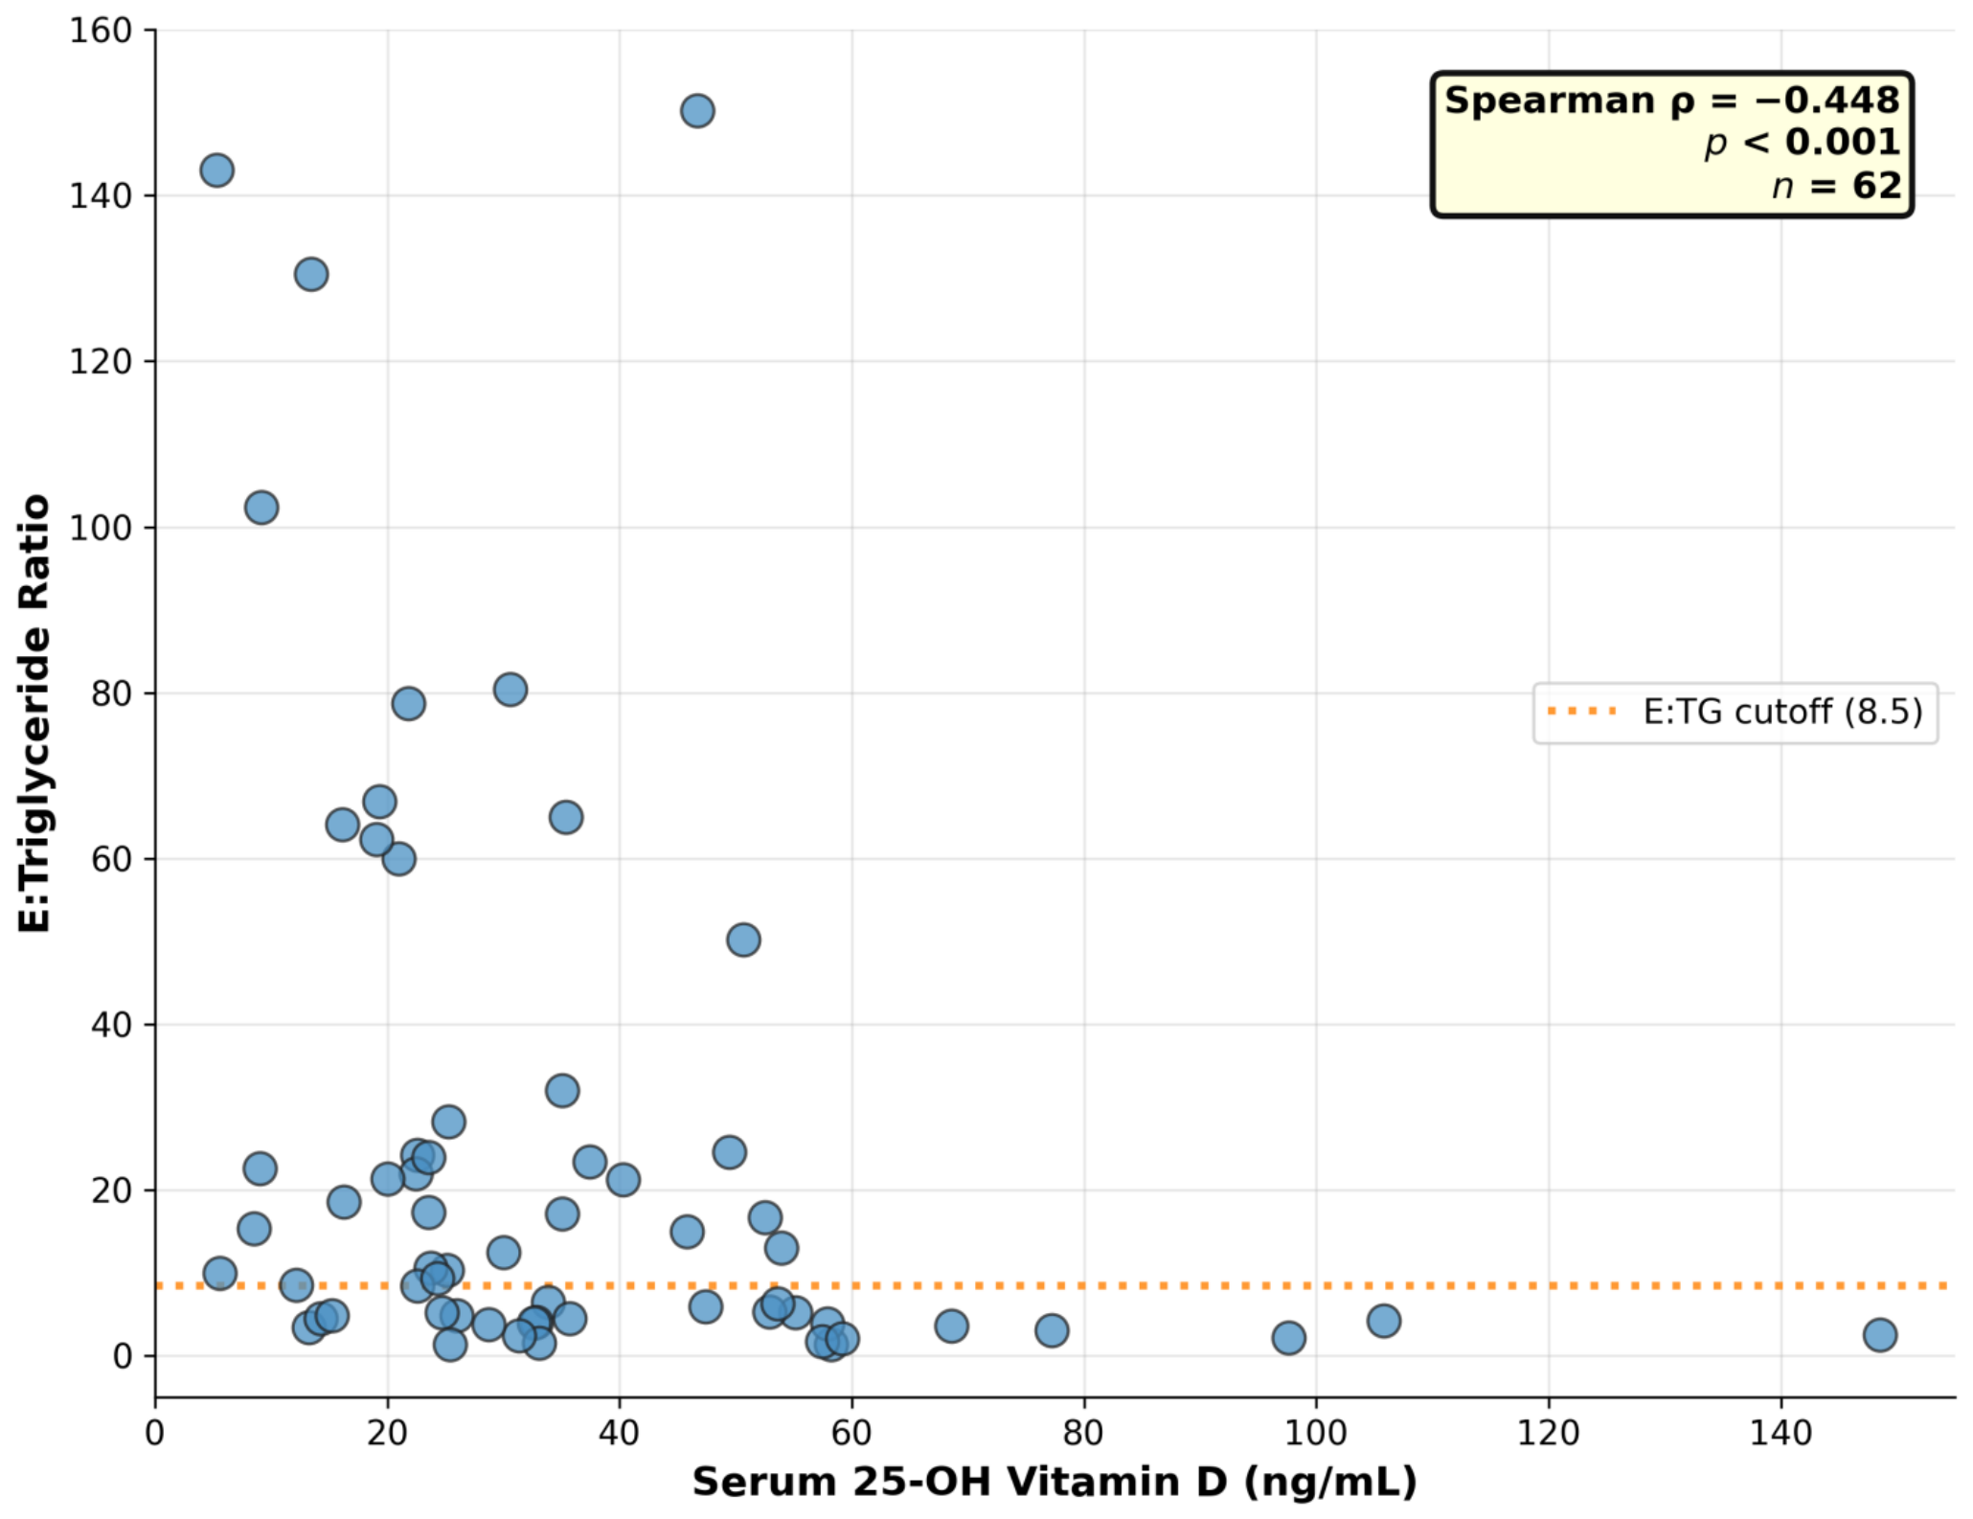
In this exploratory single-center study of 66 children with CLD of mixed etiology, four findings merit emphasis. First, lipid-adjusted interpretation of vitamin E reclassified a substantial proportion of children compared with the absolute vitamin E concentration: approximately one in three children whose absolute value appeared adequate had a low E:C ratio, and the reclassification was unidirectional for the E:C ratio, adding children to rather than removing them from the low-index category. Second, the post-transplant group had the lowest prevalence of a low E:C ratio of the three groups (Fisher exact p = 0.030), a difference resting on six children. Third, an inverse correlation was observed between the E:TG ratio and 25(OH)D (rho = −0.45; p < 0.001). Part of this follows mathematically from the construction of the ratio, since triglycerides are its denominator and were positively correlated with 25(OH)D in this cohort; any further physiological interpretation is hypothesis-generating and is presented as such below. Fourth, vitamin A status was largely preserved in this predominantly compensated cohort.
The reclassification pattern is consistent with the mechanism first demonstrated by Sokol et al. in 1984, in whose series 27% of children with biopsy-confirmed vitamin E deficiency had absolute serum α-tocopherol levels within the reference range [
7]. The unidirectional nature of the reclassification supports the pathophysiological interpretation that hyperlipidemia in CLD elevates the serum α-tocopherol pool without a proportionate increase in tissue availability; the E:C ratio then correctly identifies these children as having an inadequate index. The moderate kappa agreement (0.58 to 0.66) among the three vitamin E classifications confirms that they are not interchangeable and supports parallel reporting.
An important methodological clarification concerns the choice of immunoassay over HPLC. The vitamin E ELISA test used in this study quantifies total circulating vitamin E, whereas the CALIPER reference intervals were established for α-tocopherol measured by HPLC [
12]. Because α-tocopherol accounts for approximately 90% of circulating vitamin E in humans, a low total vitamin E value necessarily implies low α-tocopherol; any small overestimation of total vitamin E by other tocopherol forms (β, γ, δ) would lead to underestimating the true prevalence of low α-tocopherol status, a conservative bias for our conclusions [
20,
21,
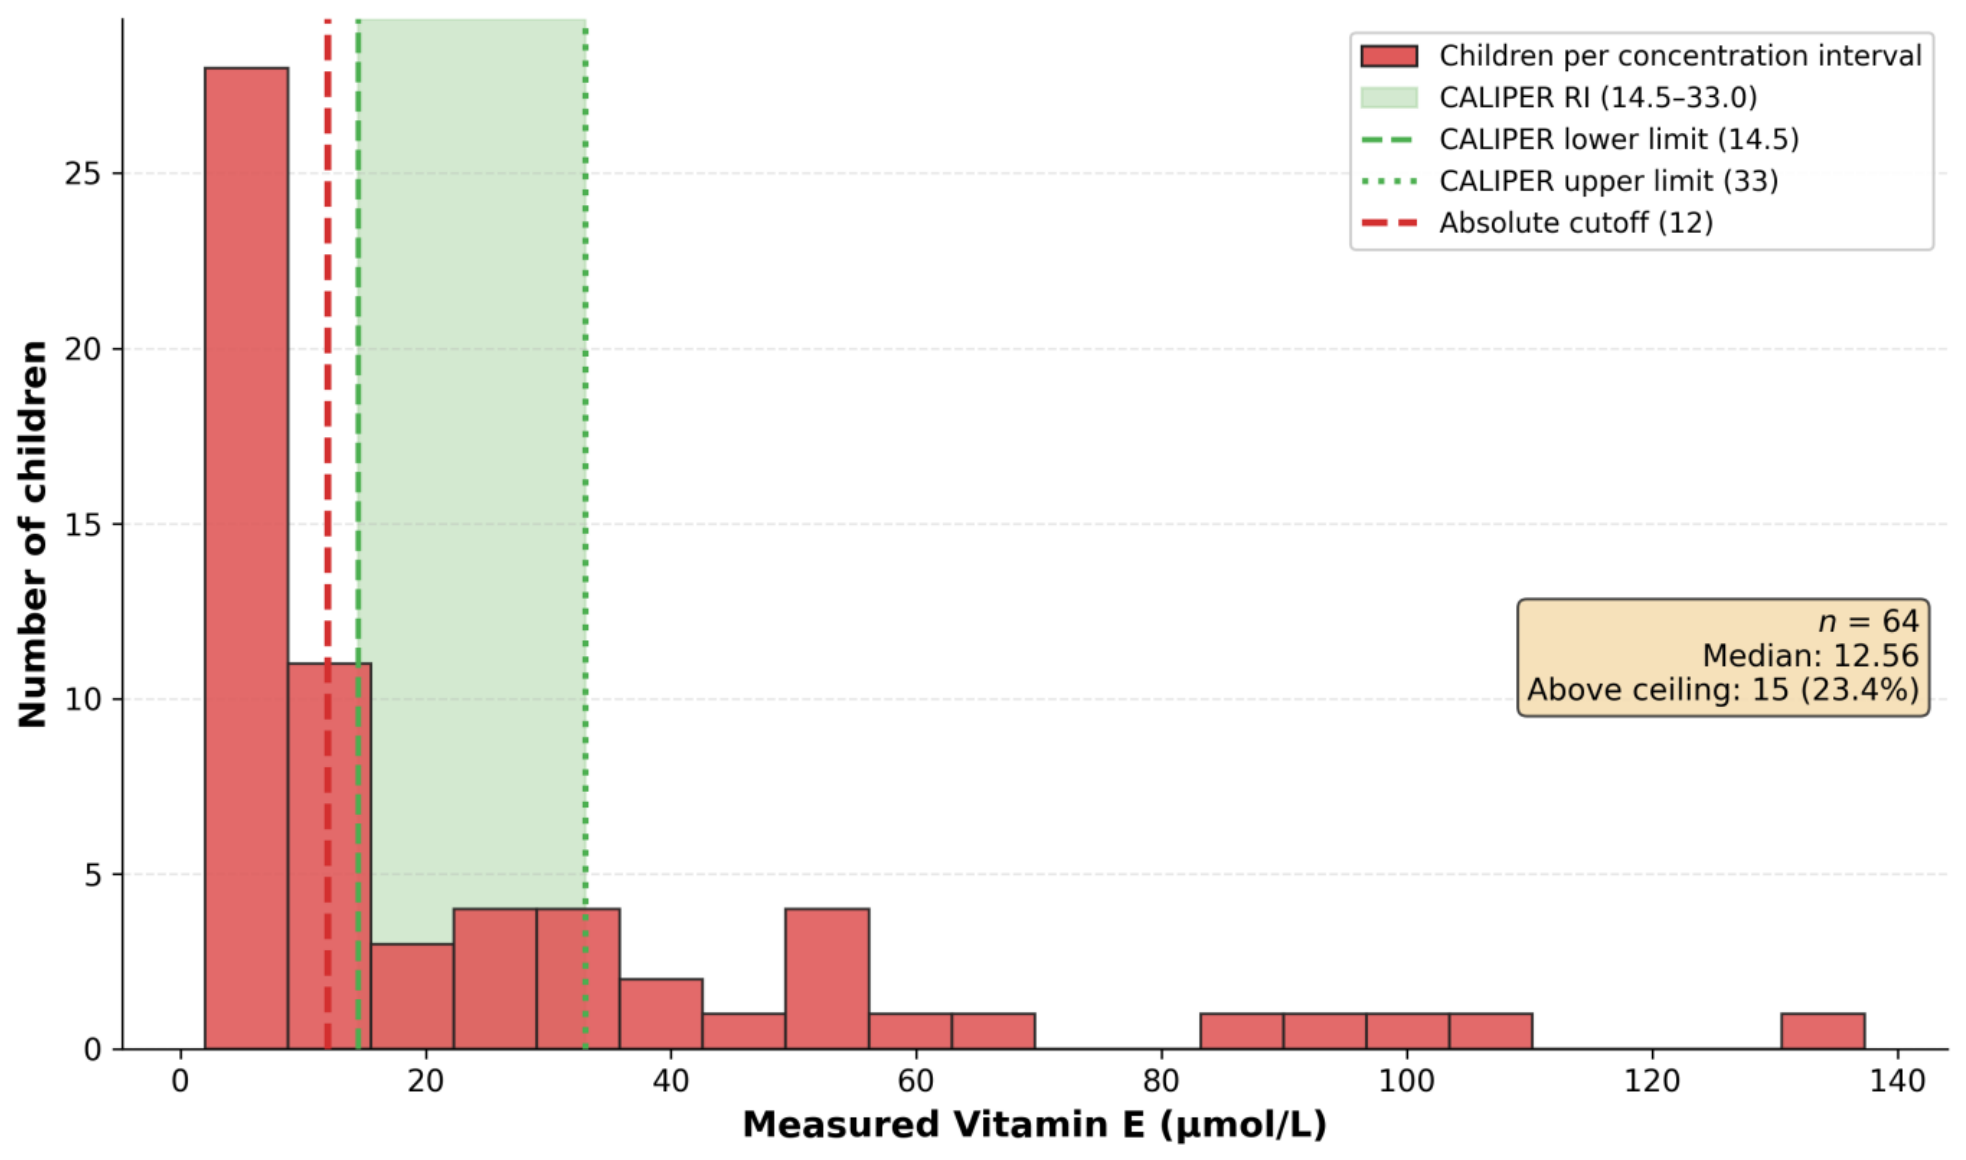
22]. One consideration is specific to the reclassification analysis: both classifications derive from the same vitamin E measurement in the same child, so a systematic bias of the immunoassay shifts both and cannot by itself produce the observed reclassification, which depends on the ratio to cholesterol. This argument concerns the reclassification pattern only; it does not extend to the prevalence estimates, which remain dependent on the platform. That said, the two platforms are not directly interchangeable, and the wide observed range of measured vitamin E in our cohort (2 to 137 µmol/L, with 23% above the CALIPER upper limit) reflects a combination of true lipid-related variation and immunoassay behavior at the extremes. For this reason, we frame the study as exploratory and interpret prevalence estimates as indicative rather than as validated diagnostic thresholds; the interpretive message concerns classification patterns and their clinical implications, not exact prevalence.
Across the three clinical groups, the categorical prevalence of a low E:C ratio increased from post-transplant (17%) to non-cholestatic CLD (64%) to cholestatic disease (79%), and this gradient was statistically significant (Fisher exact p = 0.030). The post-transplant group thus had the lowest prevalence of a low E:C ratio, a signal resting on six children. One interpretation, which this design cannot test, is that restoration of bile flow after transplantation is followed by recovery of vitamin E status; because the comparison is between different children rather than within the same child over time, the data establish an association with post-transplant status and not a change produced by transplantation. At the pre-transplant end of the spectrum, the difference between cholestatic and non-cholestatic groups in this cohort may partly reflect the cholestatic group’s younger age, which the sample size did not allow us to adjust for.
The inverse correlation between the E:TG ratio and serum 25(OH)D is contrary to the direction expected if fat-soluble vitamin depletion co-clustered in this cohort: under joint depletion, both low 25(OH)D and low E:TG would occur together, producing a positive correlation. Instead, children with lower 25(OH)D had a higher (more adequate-appearing) E:TG index.
Two non-mutually exclusive mechanisms are consistent with this pattern. First, in this cohort, 25(OH)D was positively correlated with serum triglycerides (Spearman ρ = +0.36, p = 0.004, n = 64). Because triglycerides are the denominator of the E:TG ratio, higher 25(OH)D tracked with higher triglycerides and, mechanically, produced lower E:TG values, accounting for the observed inverse 25(OH)D–E:TG relationship. This positive intra-cohort 25(OH)D–TG correlation is contrary to the inverse relationship typically reported in general pediatric populations and may reflect the effect of concurrent clinical management (e.g., vitamin D supplementation) or the specific aetiological composition of the cohort; either way, its mathematical consequence for the E:TG denominator is direct. Second, in the cholestatic subgroup, reduced bile flow simultaneously elevates triglycerides (lowering the E:TG denominator) and impairs vitamin D absorption; if 25(OH)D is partly restored by routine clinical supplementation, this dual bile-flow-dependent dysregulation can generate an inverse rather than a positive 25(OH)D–E:TG relationship. Two internal observations support this interpretation: (i) the E:C ratio, which does not carry triglycerides in its denominator, showed a much weaker inverse correlation with 25(OH)D (rho = −0.26; p = 0.041), and (ii) vitamin E absolute concentration was not significantly correlated with 25(OH)D.
This finding does not undermine the reclassification and transplant results, which rely on the E:C ratio; however, it suggests that the E:TG ratio is sensitive to non-CLD determinants of triglycerides and is less suitable as a stand-alone index in a mixed-etiology pediatric cohort. In this exploratory cohort, the E:C ratio showed greater potential than the E:TG ratio for lipid-adjusted interpretation of vitamin E status. Prospective validation against HPLC-based measurements and established functional indices is required before its routine clinical adoption. Because these analyses were exploratory, no finding can be considered confirmed on the basis of this cohort. Of the four principal tests, only the E:TG–25(OH)D correlation (rho = −0.45, p < 0.001) would remain significant under a Bonferroni-corrected threshold (α = 0.0125); the three-group gradient in low E:C prevalence (Fisher exact p = 0.030) would not. We interpret the E:TG–25(OH)D correlation as reflecting triglyceride- and cholestasis-related confounding of the ratio rather than fat-soluble vitamin depletion, so its statistical strength does not by itself identify a clinical signal to pursue. The reclassification captured by the E:C ratio and the lower prevalence of a low E:C ratio in the post-transplant subgroup are the associations of clinical interest; all of these findings would require independent validation in a separate cohort.
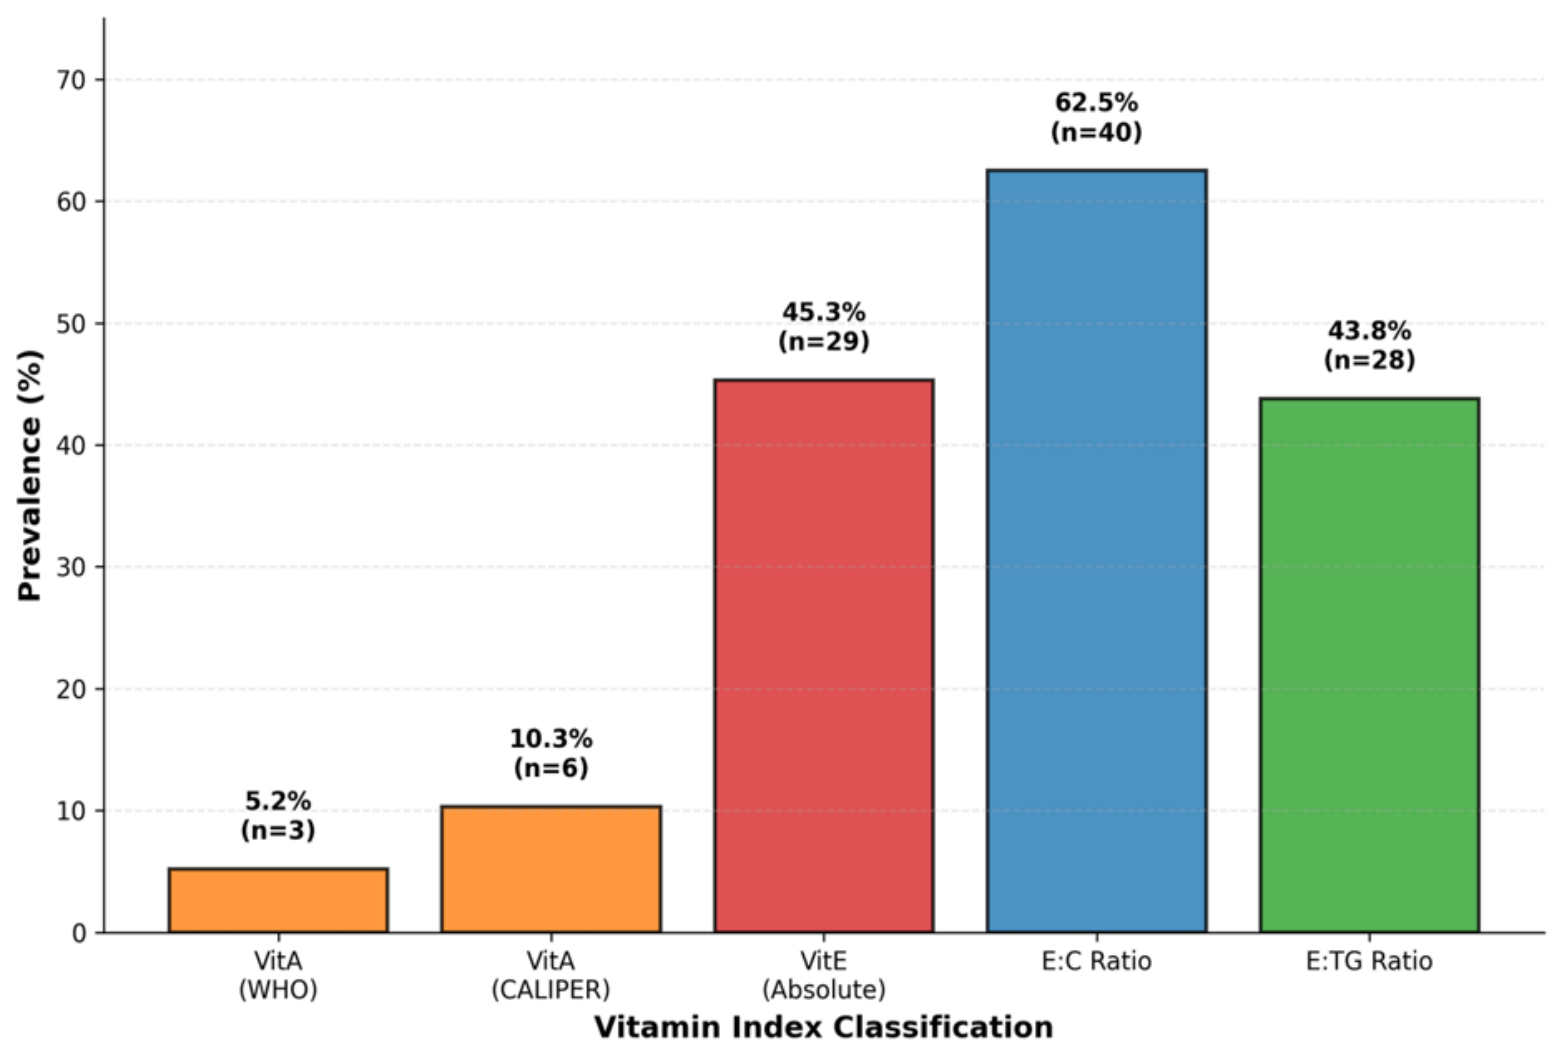
The low prevalence of vitamin A deficiency in our cohort (5.2% by the WHO threshold, 10.3% by CALIPER) contrasts with the 67–77% reported in predominantly cholestatic pediatric series. Two explanations are likely. First, serum retinol is homeostatically buffered and remains within range until hepatic stores are markedly depleted, so absolute serum retinol underestimates depletion; functional indices such as the retinol: RBP4 ratio or the relative dose–response would be expected to reclassify some apparently sufficient children. Second, our cohort was dominated by non-cholestatic disease, and the few children below the WHO threshold belonged to non-cholestatic groups (autoimmune hepatitis and metabolic disease). This pattern is compatible with reduced hepatic synthesis of RBP4 during active inflammation, as RBP4 is a negative acute-phase reactant independent of malabsorption [
13].
The absence of any relationship between vitamin indices and fibrosis stage merits comment. Our cohort was predominantly without significant fibrosis (71% F0 to F1), and the advanced-fibrosis and cirrhotic subgroups were small (14 and 9 children), so the null result reflects limited statistical power rather than definitive evidence of no association. That said, the observation that a low E:C ratio is prevalent even in F0 to F1 (approximately 60%) is consistent with vitamin E status being driven primarily by bile flow rather than by fibrotic remodeling.
It is worth contrasting the pediatric picture with the adult literature. In adults with advanced CLD, vitamin A deficiency is highly prevalent and tracks disease severity and portal hypertension, as recently confirmed in a large series of adults with cirrhosis [
23]. The adult vitamin E literature is more heterogeneous: Sokol et al. documented low serum α-tocopherol and biopsy-confirmed vitamin E deficiency in a series of 60 adults with chronic cholestatic disease [
24], but the epidemiology of vitamin E deficiency in adult mixed-etiology CLD is less well characterized than in the pediatric cholestatic population. Our series shows a pediatric-specific pattern: preserved vitamin A and a frequently low vitamin E index. The most plausible explanations are the cohort’s younger age, the predominance of non-cirrhotic cases, and the etiological composition. Fat-soluble vitamin surveillance in pediatric CLD should therefore not be extrapolated directly from adult recommendations, and existing pediatric guidance from ESPGHAN and NASPGHAN emphasizes regular monitoring and supplementation of fat-soluble vitamins in children with cholestatic and post-transplant CLD [
25]; these recommendations are reaffirmed in the recent Australasian (AuSPEN) consensus on nutrition support in paediatric CLD [
26].
4.1. Limitations
Several limitations apply. First, and most importantly, retinol and vitamin E were measured by ELISA rather than by HPLC. The two platforms are not directly interchangeable, and the CALIPER reference intervals were established by HPLC. Although the direction of any bias from the total vitamin E vs. α-tocopherol issue would be conservative (see
Section 4), the wide distribution of measured values reflects a combination of true lipid-related variation and immunoassay behavior at the extremes. For this reason, the study is framed as exploratory, and prevalence estimates should be regarded as descriptive rather than as validated diagnostic thresholds. A direct HPLC comparison in a subset is warranted.
Second, blood samples were obtained in a fasting state, whereas the CALIPER reference intervals were established using non-fasting samples [
12]. Triglycerides are most affected by prandial status, with fasting values systematically lower than non-fasting values [
27]. The E:TG ratio in our fasting cohort may therefore be systematically higher than in the CALIPER reference population, which could lead to underestimating the proportion of children below the E:TG cutoff. The E:C ratio is less affected because total cholesterol shows minimal prandial variation; this may partly explain why the E:C ratio identified more children with a low index (62.5%) than the E:TG ratio (43.8%).
Another limitation is that the study is cross-sectional and cannot assess changes over time, response to supplementation, or clinical outcomes. The design also does not fix the direction of any association: vitamin E indices and markers of liver disease were measured at the same visit, so reverse causation, in which disease state follows rather than precedes vitamin status, cannot be excluded. We did not measure RBP4 and therefore could not calculate the retinol: RBP4 ratio, the functional index recommended in CLD [
13]. Also, the phospholipid-based Sokol vitamin E to total lipid ratio, considered the gold standard for cholestatic patients by ESPGHAN/NASPGHAN guidelines [
25], could not be calculated because phospholipid measurements were unavailable; the E:C and E:TG ratios from CALIPER were used as accessible alternatives. Subgroup sizes for post-transplant (
n = 6), vascular disease (
n = 2), and advanced fibrosis (F ≥ 3,
n = 14) were small. Two further limitations apply specifically to the transplant comparison: time since transplantation, and immunosuppressive and supplementation regimens were not recorded, so the observed difference cannot be attributed to transplantation rather than to other characteristics of that group. This is a single-center cohort, and generalizability to other populations is limited. Dietary intake and supplementation history were not recorded, which may confound the relationship between clinical group and vitamin status. Finally, because most analyses were exploratory, no formal multiple-testing correction was applied; the reported
p-values should be interpreted accordingly.
4.2. Clinical and Research Implications
Within these constraints, the findings support jointly evaluating the absolute vitamin E concentration and lipid-adjusted indices when assessing vitamin E status in children with CLD, rather than relying on absolute concentration alone. The E:C ratio is simple and readily available from a routine fasting lipid panel, and in our cohort, it identified the largest proportion of children with a low index. In practical terms, the 11 children whose absolute vitamin E concentration suggested adequacy but whose E:C ratio was low are the children a lipid-adjusted index identifies, and an absolute concentration does not. Whether they benefit from closer monitoring or from supplementation is a question for future investigation: this study did not validate the E:C cutoff against HPLC or against any clinical endpoint, so it cannot support a monitoring recommendation. This is consistent with the ESPGHAN/NASPGHAN recommendation that vitamin E surveillance in pediatric cholestatic CLD uses lipid-adjusted indices rather than absolute concentrations. The lower prevalence of a low E:C ratio among post-transplant participants is consistent with the clinical expectation that restoration of bile flow is followed by recovery of fat-soluble vitamin absorption, although six children cannot establish it. The prevalence of a low index in the non-cholestatic group (64%) argues against assuming that a non-cholestatic etiology confers protection. The observation that approximately half of the cohort had suboptimal vitamin D status supports monitoring vitamin D as part of routine fat-soluble vitamin surveillance in pediatric CLD [
28], independently of the methodological E:TG–25(OH)D pattern discussed above.
4.3. Future Perspectives
Four lines of work follow from these results. First, a direct comparison with HPLC-based measurement on a subset of the same samples would establish how far the immunoassay values and the classifications derived from them correspond to α-tocopherol as CALIPER defines it; this is the step on which the interpretation of every prevalence reported here depends. Second, prospective studies with documented supplementation and dietary intake, functional vitamin A testing including the retinol to RBP4 ratio, and larger etiologically homogeneous subgroups are needed to translate these exploratory findings into confirmed clinical thresholds. Third, larger cohorts enriched in advanced disease are needed to test whether fat-soluble vitamin inadequacy tracks with fibrosis progression, which the present sample was underpowered to address. Fourth, whether combined vitamin D and vitamin E supplementation strategies confer additional benefit will require prospective evaluation, as will the question of whether children identified only by a lipid-adjusted index derive clinical benefit from that identification.




 ,
,