Article

Population Heterogeneity in Iron Biomarkers by Age, Sex, Menopausal Status, and Race in Healthy U.S. Adults: A Cross-Sectional Analysis from the All of Us Research Program


1
Department of Physiology and Aging, College of Medicine, University of Florida, Gainesville, FL 32611, USA
2
Department of Health Outcomes and Biomedical Informatics, College of Medicine, University of Florida, Gainesville, FL 32611, USA
3
Department of Surgery, College of Medicine, University of Florida, Gainesville, FL 32611, USA
4
Cancer Institute, University of Florida Health, Gainesville, FL 32611, USA
5
Department of Biostatistics, University of Florida, Gainesville, FL 32611, USA
6
Department of Epidemiology, College of Public Health and Health Professions, University of Florida, Gainesville, FL 32611, USA
7
Department of Medicine and Surgery, LUM University, 70010 Casamassima, Italy
8
Fondazione Policlinico Universitario “Agostino Gemelli” IRCCS, 00168 Rome, Italy
*
Authors to whom correspondence should be addressed.
Nutrients 2026, 18(10), 1522; https://doi.org/10.3390/nu18101522
Submission received: 9 April 2026 / Revised: 4 May 2026 / Accepted: 5 May 2026 / Published: 10 May 2026

Abstract

Background/Objectives: Blood iron biomarkers are commonly interpreted using fixed clinical reference intervals, although iron metabolism varies by age, sex, menopausal status, and race. This study aimed to characterize the distribution of iron biomarkers across demographic subgroups and to examine their distribution relative to commonly used reference intervals. Methods: In this cross-sectional study, 7990 adults (≥18 years) from the All of Us Research Program were classified as premenopausal women, postmenopausal women, men < 53 years, or men > 56 years. Serum iron, ferritin, total iron-binding capacity, unsaturated iron-binding capacity, and transferrin saturation (TSAT) were summarized across groups and compared descriptively with commonly used reference intervals. Results: Iron biomarkers varied across demographic groups. Mean serum iron was 82.3 µg/dL overall, with lower levels in premenopausal women (79.5 ± 36.7 µg/dL) and higher levels in men < 53 years (86.8 ± 41.8 µg/dL). Mean TSAT was 25.6% and generally located toward the lower end of commonly used reference ranges. Ferritin showed substantial variability, with higher mean levels in younger men (258.0 ± 581.0 ng/mL) and lower levels in premenopausal women (102.1 ± 224.9 ng/mL). Premenopausal women had higher iron-binding capacity, whereas older men had lower values. Black participants had lower serum iron and TSAT but higher ferritin compared with White participants. A substantial proportion of participants had values outside commonly used reference intervals, particularly for serum iron and TSAT. Conclusions: Iron biomarker distributions differ across demographic subgroups and may not be fully reflected by commonly used reference intervals. These findings highlight the importance of context-specific interpretation and underscore the need for further studies to evaluate the applicability of current reference intervals across diverse populations.

1. Introduction

Iron is a critical element for oxygen transport, energy production, and multiple metabolic processes [1,2]. Because of its redox activity, iron homeostasis is tightly regulated, as both deficiency and overload may have detrimental health consequences, including anemia, oxidative stress, and organ dysfunction [1,2,3]. Circulating blood biomarkers such as serum iron (indicating circulating iron availability), ferritin (corresponding to body iron storage), total iron-binding capacity (TIBC) and unsaturated iron-binding capacity (UIBC) (reflecting iron-binding capacity), and transferrin saturation (TSAT) (representing the proportion of transferrin saturated with iron), are routinely integrated in clinical practice to evaluate iron deficiency and iron overload [2]. Interpretation of these measures relies on laboratory reference intervals intended to support the distinction between typical and potentially clinically relevant values [4].
However, iron biomarker levels vary systematically according to age, sex, reproductive status, and race/ethnicity [1,2,5,6], and are influenced by hormonal regulation, inflammation, and dietary intake [2,7]. Premenopausal women generally exhibit lower iron stores than postmenopausal women and men, largely due to menstrual blood loss, whereas iron stores tend to increase after menopause and with aging [8,9,10]. Similarly, population-level differences in iron biomarkers have been consistently observed across racial and ethnic groups [11,12,13,14,15]. These sources of variability may complicate the interpretation of iron biomarkers when uniform reference intervals are applied across heterogeneous populations.
Despite these well-recognized sources of variation, clinical interpretation of iron biomarkers commonly relies on fixed reference intervals, which vary across laboratories and are often derived from relatively small and homogeneous samples [16,17,18,19,20]. Emerging evidence has questioned whether current reference intervals adequately reflect variation across diverse populations, and recent reviews have highlighted both methodological heterogeneity in their derivation and limited representation of underrepresented groups in the underlying data [17,19,21]. A clearer understanding of the distribution of iron biomarkers across demographic subgroups in contemporary populations is therefore needed to support more informed interpretation of these measures.
The All of Us Research Program provides a large and demographically diverse U.S. cohort to examine population distributions of iron biomarkers and address gaps in their descriptive epidemiology [22]. In this study, we aimed to (1) characterize differences in the distribution of serum iron, ferritin, TIBC, UIBC, and TSAT across age, sex, menopausal status, and race/ethnicity; (2) evaluate whether these differences persist after adjustment for sociodemographic and health-related factors; and (3) describe the distribution of biomarker values in relation to commonly used clinical reference intervals.

2. Materials and Methods

2.1. Study Design and Population

This cross-sectional study used version 8 Controlled Tier data from the All of Us Research Program, a large, nationwide research initiative supported by the National Institutes of Health that aims to enroll a diverse population across the United States to advance precision medicine. The program integrates electronic health records, survey data, and biospecimens to support research on a wide range of health outcomes [22]. All participants provided written informed consent at enrollment. The study was approved by the Institutional Review Board of the All of Us Research Program (protocol v9, 20 March 2020) [23] and was conducted in accordance with the principles of the Declaration of Helsinki.
For the present analyses, we included participants aged ≥ 18 years with at least one available iron biomarker measurement. Participants with anemia were identified using standardized condition concepts within the All of Us data model, mapped to standard terminologies (e.g., SNOMED) from source vocabularies such as ICD-9-CM and ICD-10-CM, corresponding to clinically relevant diagnostic categories (Table A1). Similarly, participants with gastrointestinal inflammatory diseases (including Crohn’s disease, ulcerative colitis, diverticulitis, and gastroenteritis), pregnancy or lactation, malignancies, hemochromatosis, or other genetic iron-overload disorders were identified using standardized condition concepts and excluded. Individuals reporting use of iron, vitamin B12, or folate supplements during the study period were also excluded. To enhance comparability across participants, laboratory measurements obtained outside a one-year window around study enrollment were excluded. This time window was selected to minimize temporal misclassification between biomarker measurements and baseline covariates, particularly with respect to age-based group definitions. Menopausal status was determined using electronic health record (EHR)-derived clinical information within the All of Us Research Program, based on standardized condition concepts mapped from source vocabularies (including ICD-9 and ICD-10) into a common data model using standardized terminologies indicative of natural or surgical menopause (Table A2). In addition, self-reported menopausal status was captured through participant responses to the survey question “Why did your periods stop?”. Women were classified as postmenopausal if menopause-related clinical records were present and/or if survey responses indicated cessation of menses due to natural or surgical menopause prior to the time of biomarker measurement.
To minimize misclassification, women with evidence of menopausal transition during the study period and those with discordant information across data sources were excluded. In addition, men aged 53–56 years were excluded to create clearly separated age categories based on a predefined cut-off of 55 years, avoiding overlap between groups and reducing potential misclassification around boundary values [24,25]. After applying these criteria, the final analytic cohort included 7990 participants (Figure 1). Participants were classified into four prespecified groups: premenopausal women, postmenopausal women, men younger than 53 years, and men older than 56 years. Analyses of iron biomarkers by race were restricted to White and Black or African American participants due to heterogeneity and small sample sizes in other racial categories.

2.2. Iron Biomarkers and Reference Intervals

We analyzed serum iron (µg/dL), ferritin (ng/mL), total iron-binding capacity (TIBC, µg/dL), unsaturated iron-binding capacity (UIBC, µg/dL), and transferrin saturation (TSAT, %), as obtained from the All of Us Research Program dataset. Reference intervals were not used for classification but are provided in Table A3 as descriptive benchmarks for contextual interpretation, based on commonly reported ranges in U.S. clinical laboratories, including those from the National Board of Medical Examiners (https://www.nbme.org/) accessed on 6 April 2026.

2.3. Statistical Analysis

Participant characteristics were summarized using descriptive statistics. Continuous variables are presented as mean ± standard deviation, and categorical variables as counts and percentages. Differences between groups were assessed using analysis of variance (ANOVA) for continuous variables and the chi-squared test for categorical variables. Biomarker values were evaluated in relation to their corresponding reference intervals, and the proportions of values below, within, or above these intervals were calculated for descriptive purposes. Associations between study group and each iron biomarker were examined using linear regression models, with men aged > 56 years as the reference group. Models were adjusted for race, ethnicity, highest educational attainment, annual household income, health insurance status, alcohol use, smoking status, and self-reported general health. Regression coefficients (β) with 95% confidence intervals (CIs) were reported. All analyses were conducted using R software (version 4.5.0; R Foundation for Statistical Computing, Vienna, Austria). All statistical tests were two-sided, and p-values < 0.05 were considered statistically significant.

3. Results

3.1. General Characteristics of the Sample

Demographic characteristics differed across the four study groups, including race/ethnicity, educational attainment, income, insurance status, smoking, alcohol use, and self-rated health (all p < 0.001). Overall, the study population was predominantly White, with a high level of educational attainment and health insurance coverage. Women were more represented than men, particularly in the younger group. Complete demographic data are provided in Table 1.

3.2. Iron Biomarker Differences by Age and Sex

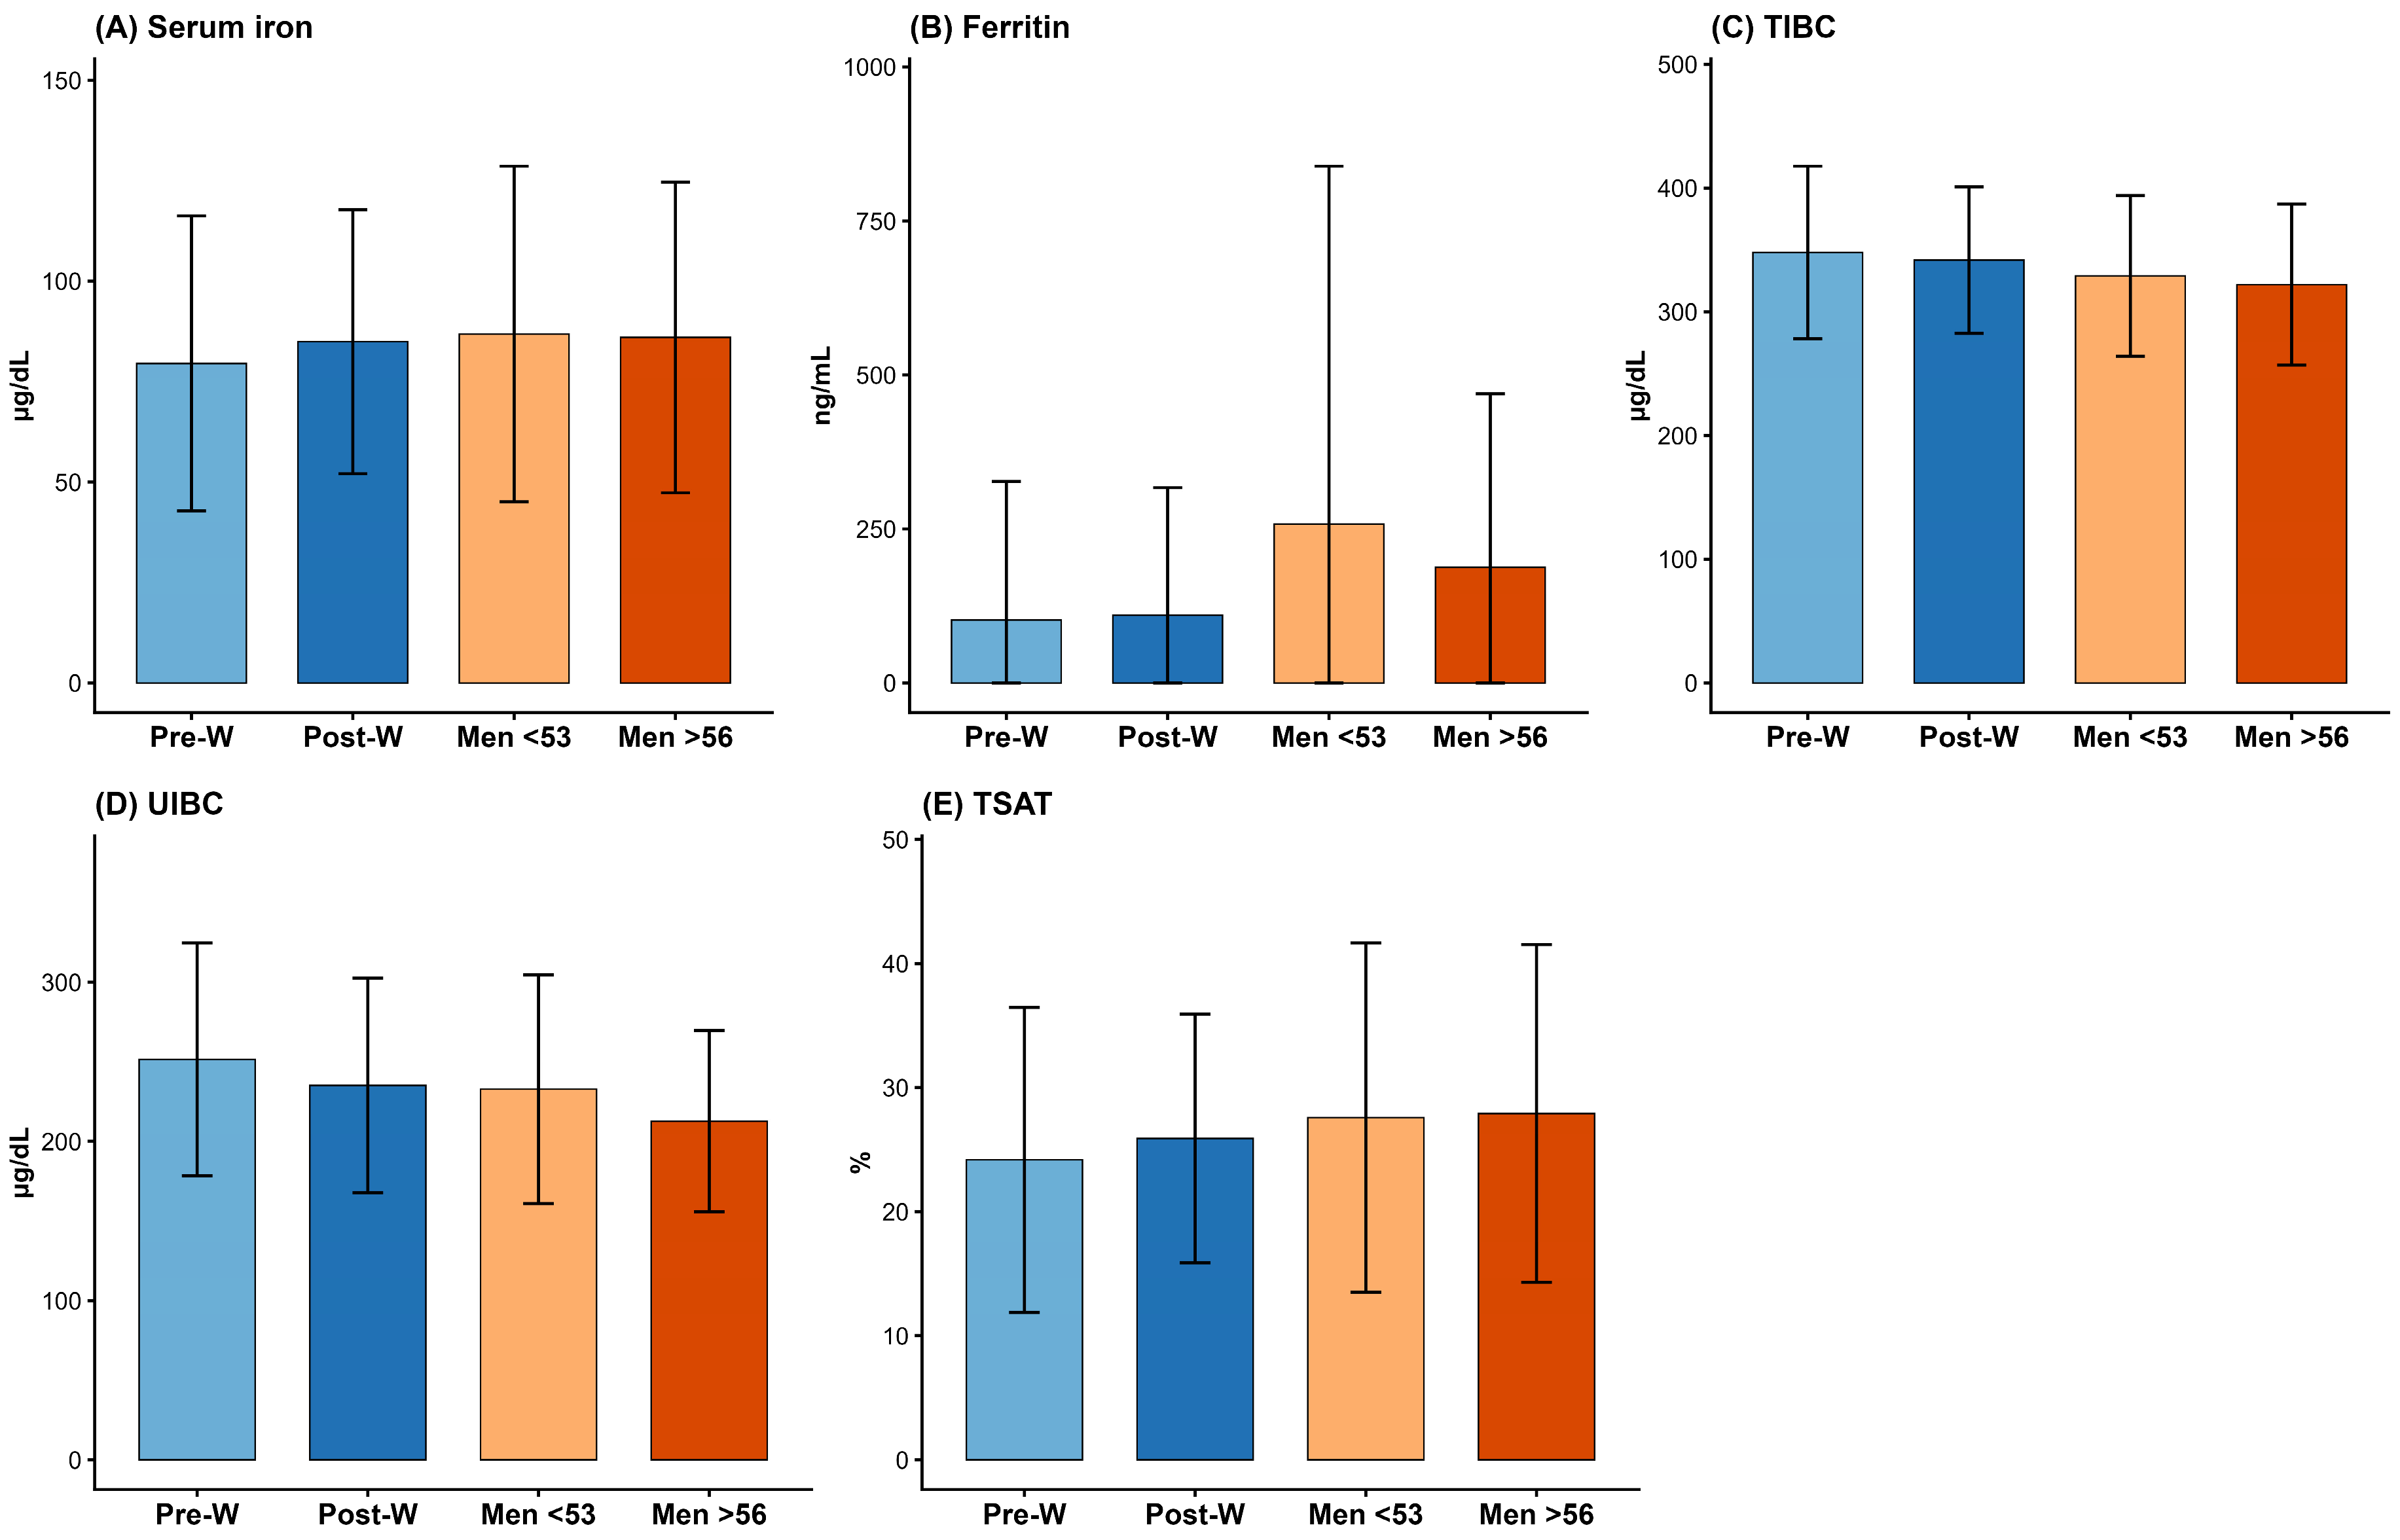
Mean levels of iron biomarkers across study groups are illustrated in Figure 2. Serum iron levels were slightly lower in premenopausal women (79.5 ± 36.7 µg/dL) compared with postmenopausal women (85.0 ± 32.9 µg/dL) and men, whose values were similar across age groups (86.8 ± 41.8 µg/dL in men < 53 years and 86.0 ± 38.7 µg/dL in men > 56 years). Ferritin levels showed more pronounced differences across groups, with substantially lower values in women (102.3 ± 224.9 ng/mL in premenopausal and 110.1 ± 207.0 ng/mL in postmenopausal women) compared with men, particularly younger men (258.0 ± 581.0 ng/mL), while older men had intermediate values (187.7 ± 281.6 ng/mL). TIBC and UIBC were consistently higher in premenopausal women (347.9 ± 69.8 µg/dL and 251.5 ± 73.1 µg/dL, respectively) and decreased across postmenopausal women and men, with the lowest values observed in older men. TSAT was lower in women (24.2 ± 12.3% in premenopausal and 25.9 ± 10.0% in postmenopausal women) and higher in men, with similar values in younger and older groups (27.6 ± 14.1% and 27.9 ± 13.6%, respectively).
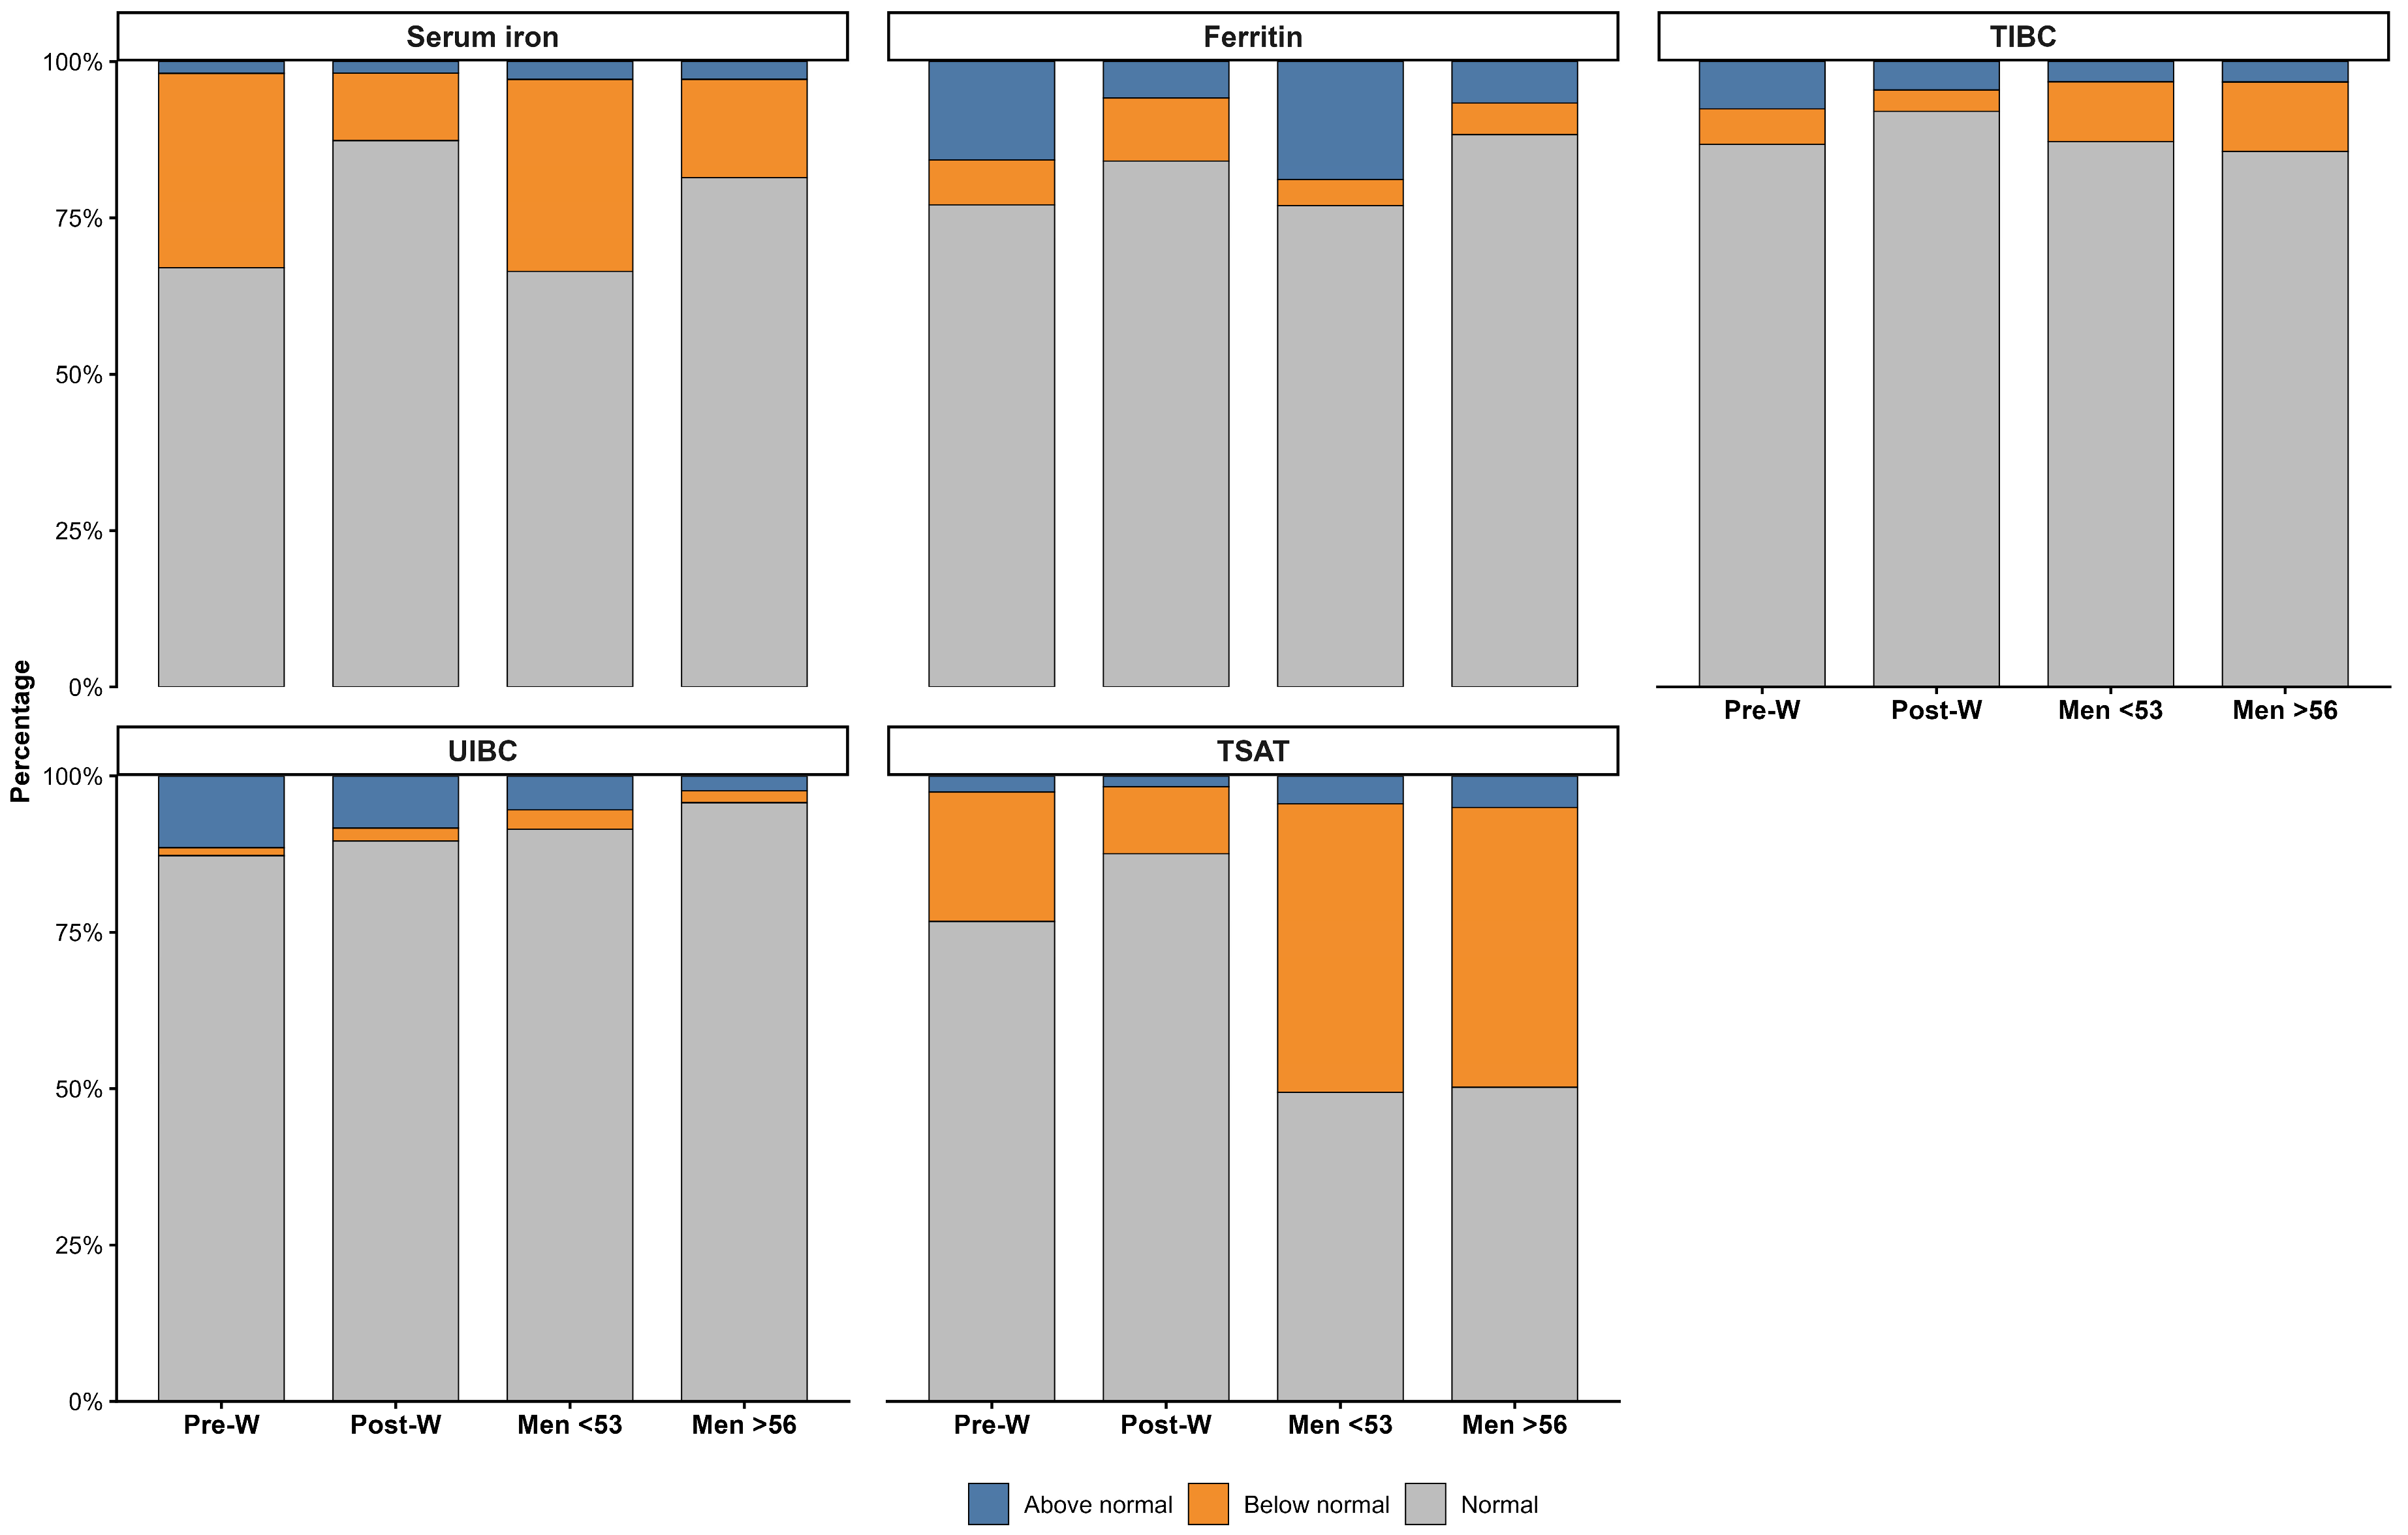
The distribution of biomarker categories across groups is shown in Figure 3. For serum iron, values below the reference interval were observed in 31.1% of premenopausal women and 30.7% of men < 53 years, compared with 10.8% of postmenopausal women and 15.7% of men > 56 years. Values above the reference interval were infrequent across all groups (≤2.8%). For ferritin, values above the reference interval were present in 15.7% of premenopausal women and 18.9% of men < 53 years, compared with 5.8% of postmenopausal women and 6.6% of men > 56 years. Values below the reference interval ranged from 4.2% in men < 53 years to 10.1% in postmenopausal women. For TIBC, values above the reference interval were observed in 7.5% of premenopausal women, 4.5% of postmenopausal women, 3.2% of men < 53 years, and 3.3% of men > 56 years. Values below the reference interval were reported in 5.7%, 3.4%, 9.5%, and 11.1% of these groups, respectively. For UIBC, most values were within the reference interval across all groups (>87%). Values above the reference interval were observed in 11.5% of premenopausal women, 8.3% of postmenopausal women, 5.4% of men < 53 years, and 2.4% of men > 56 years. For TSAT, values below the reference interval were observed in 20.7% of premenopausal women, 10.7% of postmenopausal women, 46.1% of men < 53 years, and 44.8% of men > 56 years. Values above the reference interval were present in ≤5.0% across groups.

3.3. Iron Biomarker Differences by Race

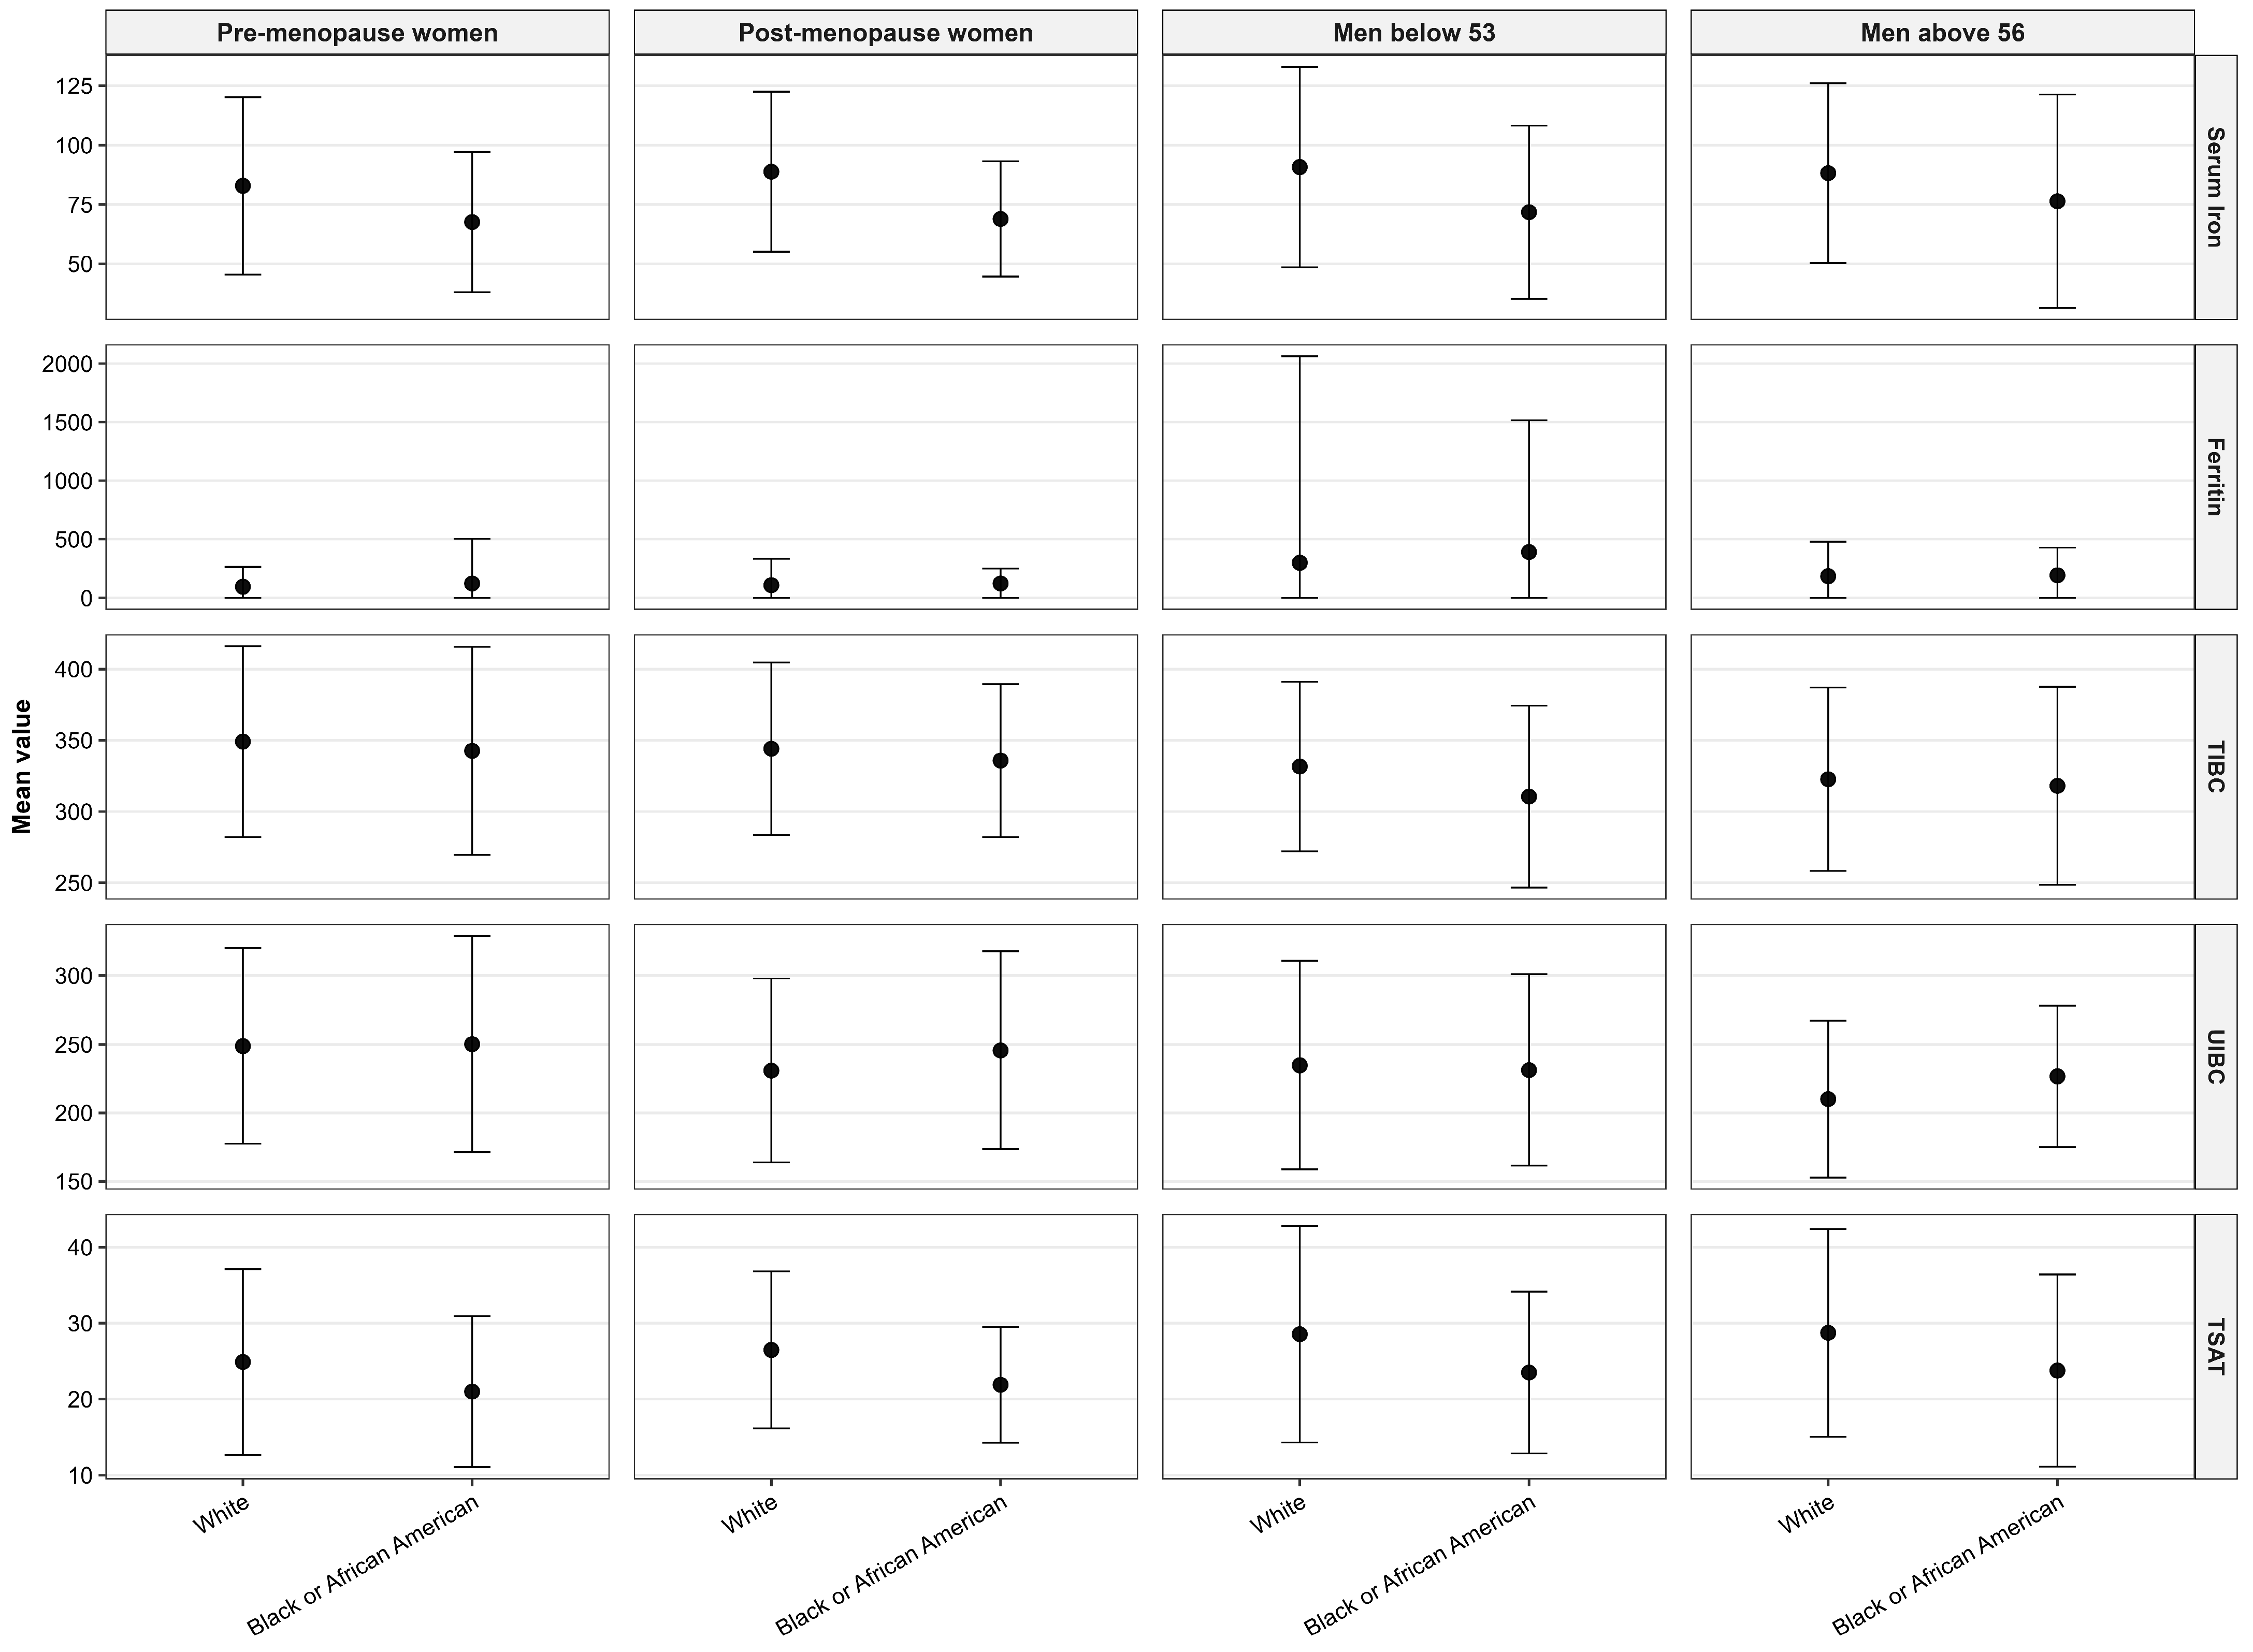
Differences in iron biomarkers were observed across racial groups (Figure 4). Compared with White participants, Black individuals had lower serum iron levels across all subgroups, with values of 67.6 vs. 82.9 µg/dL in pre-menopausal women, 68.9 vs. 88.8 µg/dL in post-menopausal women, 71.8 vs. 90.7 µg/dL in men aged < 53 years, and 76.3 vs. 88.2 µg/dL in men aged > 56 years (all p < 0.001). A similar pattern was observed for transferrin saturation (TSAT), which was lower in Black participants across all subgroups (e.g., 21.0% vs. 24.9% in pre-menopausal women; p < 0.001). Ferritin concentrations were higher in Black participants compared with White participants, with substantial dispersion across groups. TIBC values were generally lower in Black participants across most subgroups (e.g., 342.6 vs. 349.1 µg/dL in pre-menopausal women and 310.5 vs. 331.6 µg/dL in men aged < 53 years), while UIBC values were broadly similar between groups, with modest differences across subgroups.

3.4. Associations with Demographic and Clinical Characteristics

In multivariable linear regression models adjusting for demographic and clinical factors (Table 2), associations between study groups and iron biomarkers were observed. Compared with men aged > 56 years (reference group), pre-menopausal women had lower serum iron (β −5.66 µg/dL, 95% CI −8.15 to −3.17; p < 0.001), whereas no significant differences were observed in post-menopausal women or younger men. For ferritin, pre-menopausal and post-menopausal women showed lower levels compared with the reference group (β −87.38 ng/mL, 95% CI −103.98 to −70.78; p < 0.001 and β −76.96 ng/mL, 95% CI −102.99 to −50.93; p = 0.005, respectively), while younger men had higher ferritin levels (β 47.96 ng/mL, 95% CI 24.26 to 71.66; p < 0.001). TIBC was higher in women, particularly in pre-menopausal individuals (25.25 µg/dL, 95% CI 20.27 to 30.23; p < 0.001), with smaller and borderline differences in younger men. A similar pattern was observed for UIBC, which was significantly higher in pre-menopausal women (β 38.84 µg/dL, 95% CI 27.65 to 50.03; p < 0.001) and in younger men (19.31 µg/dL, 95% CI 3.49 to 35.13; p = 0.017). Finally, TSAT was lower in both pre-menopausal and post-menopausal women (β −3.61%, 95% CI −4.47 to −2.75; p < 0.001 and −2.19%, 95% CI −3.60 to −0.78; p = 0.002, respectively), while no significant differences were observed in younger men.

4. Discussion

In this large, contemporary U.S. cohort, iron biomarkers showed substantial heterogeneity across age, sex, menopausal status, and race/ethnicity that was not fully reflected by existing clinical reference intervals. Although mean biomarker values generally fell within conventional ranges, a considerable proportion of participants had values outside commonly used reference intervals, particularly for serum iron and transferrin saturation. These findings highlight incomplete differences between population-level distributions and current reference standards.
Patterns observed across demographic groups were consistent with known biological and life-course differences in iron metabolism as follows. Premenopausal women exhibited lower ferritin, serum iron, and TSAT and higher iron-binding capacity compared with men, whereas postmenopausal women showed intermediate profiles. Among men, ferritin and UIBC differed between younger and older groups, while other biomarkers were relatively stable. These differences persisted after adjustment for sociodemographic and health-related factors, supporting the presence of systematic variation across demographic subgroups. Our findings are consistent with prior studies showing higher ferritin and lower TIBC in postmenopausal women and older men, reflecting changes in iron balance across the life course [9,10,26,27].
Historically, many reference intervals have been derived using statistical approaches based on the central distribution of selected populations, such as mean ± 2 standard deviations or percentile-based cutoffs [28,29]. As a result, commonly used ranges, including ferritin levels of 15–80 ng/mL and TSAT values of approximately 20–50%, have been incorporated into clinical practice [19,21,30]. However, these intervals were often established in relatively small or homogeneous samples and without systematic consideration of key demographic factors such as age, sex, or race/ethnicity, or of relevant biological modifiers such as inflammation [17]. More recent studies have proposed refined intervals based on larger datasets [31,32,33], yet substantial variability remains in how reference values are defined and applied. In this context, fixed cutoffs may not fully reflect the diversity of iron biomarker distributions observed across contemporary populations. Taken together, these observations highlight a persisting gap in the evidence base underlying reference interval definition and suggest the need for further research to better characterize iron biomarker variability across diverse groups.
Beyond age- and sex-related differences, distinct patterns emerged across racial and ethnic groups, although analyses were limited to White and Black or African American participants due to heterogeneity and small sample sizes in other groups. Black participants had lower serum iron and TSAT but higher ferritin compared with White participants. These findings are consistent with previous analyses, including those from the National Health and Nutrition Examination Survey, although the present data do not allow mechanistic interpretation [11,12,34]. A similar pattern has been described in prior studies showing that African American populations may exhibit higher ferritin levels despite a higher prevalence of iron deficiency [35]. Potential explanations have been proposed in the literature, including chronic low-grade inflammation, comorbidity burden, and differences in healthcare access, although these factors could not be directly assessed in the present study [36]. Accordingly, the observed patterns should be interpreted descriptively. In this context, race and ethnicity should be interpreted as proxies for a range of exposures, including dietary patterns, access to care, comorbidity burden, and inflammatory status, rather than as markers of inherent biological differences [35,37]. Differences in dietary habits across sex and racial groups may also contribute to the observed variability in iron biomarkers. Prior studies have shown that men tend to consume higher amounts of red and processed meat, whereas women more frequently report higher intake of plant-based foods and dietary fiber, which may influence iron bioavailability [38,39]. Similarly, racial differences in dietary quality, micronutrient intake, and food access have been documented, potentially affecting both iron intake and absorption [40]. These factors, together with known differences in eating behaviors and food environments, may partly underlie the heterogeneity observed in circulating iron indices and further emphasize the importance of contextual interpretation of iron biomarkers.
From a clinical and nutritional perspective, these findings underscore the need for cautious interpretation of iron biomarkers across diverse populations. Early identification of altered iron status remains clinically relevant, although its interpretation should be contextualized within individual and population characteristics [41]. Similar biomarker values may reflect different underlying contexts depending on demographic characteristics, and reliance on uniform thresholds may not fully capture this variability. However, the present study is descriptive, and the clinical significance of values outside conventional reference intervals cannot be determined without longitudinal data or outcome-based validation. Future studies linking biomarker distributions to incident anemia, functional outcomes, and disease-specific endpoints will be essential to clarify their clinical relevance.
Within this broader clinical context, these findings suggest the importance of context-aware interpretation of blood iron biomarkers, taking into account age, sex, reproductive status, and race/ethnicity. This perspective is consistent with recent calls to re-examine how clinical decision limits are applied across diverse populations [42,43,44]. Ferritin results warrant particular caution. As both a marker of iron stores and an acute-phase reactant, ferritin may be influenced by inflammation, liver disease, and metabolic factors, especially in older adults. In the absence of systematically available inflammatory markers, we were unable to distinguish elevated ferritin related to iron status from that associated with other processes [27,45]. Accordingly, ferritin should be interpreted within its broader biological and clinical context, and its variability across populations represents an important area for further investigation.
Several limitations should be considered when interpreting these findings. First, the cross-sectional design precludes causal inference and does not allow assessment of within-person changes over time. Second, variability in laboratory assays across collection sites may have introduced measurement heterogeneity. Third, inflammatory markers such as C-reactive protein were not uniformly available, limiting the interpretation of ferritin levels. Given that ferritin is influenced by inflammation, liver function, and metabolic status, its values should be interpreted with caution, particularly in the absence of systematically measured inflammatory markers. Fourth, menopausal status was derived from a combination of EHR-based clinical information and self-reported survey data. Although this approach likely improved classification accuracy compared with the use of a single data source, residual misclassification may still have attenuated differences between premenopausal and postmenopausal groups. Fifth, although exclusion criteria were applied to reduce the influence of conditions known to affect iron metabolism, residual confounding cannot be excluded, as unmeasured or subclinical factors may still have influenced biomarker levels. Sixth, although the cohort is diverse, certain groups may be over- or underrepresented, potentially affecting generalizability. Seventh, iron biomarkers were assessed at a single time point, which may not fully capture intra-individual variability over time. Finally, the absence of longitudinal outcome data limits our ability to assess the clinical relevance of biomarker distributions or to determine whether values outside reference intervals are associated with meaningful health outcomes.
Despite these limitations, the strengths of this study lie in the large, demographically diverse cohort and the integration of laboratory and sociodemographic data, which enabled detailed characterization of iron biomarker distributions across multiple population subgroups. By leveraging real-world data, this work provides insight into variability beyond conventional reference thresholds and suggests the importance of evaluating reference intervals in contemporary, demographically representative cohorts. Greater harmonization of laboratory practices, together with consideration of demographic and physiological factors, may contribute to improved understanding of iron biomarker variability across populations [24,46,47].

5. Conclusions

Iron biomarker distributions vary substantially across demographic subgroups and are not fully captured by commonly used reference intervals. These findings highlight the importance of considering demographic and clinical context when interpreting iron biomarkers and suggest the need for further research to evaluate their clinical relevance and inform future refinement of reference standards.

Author Contributions

Conceptualization, R.S.Z.; methodology, R.S.Z.; validation, J.J.Y., E.C., A.M.M., A.P., S.D.A. and S.C.; formal analysis, R.H.; writing—original draft preparation, R.S.Z.; writing—review and editing, J.J.Y., E.C., R.H., A.M.M., A.P., S.D.A. and S.C.; visualization, R.S.Z. and S.C.; supervision, S.D.A.; funding acquisition, R.S.Z. and S.D.A. All authors have read and agreed to the published version of the manuscript.

Funding

R.S.Z. is supported by a training grant from the National Institute on Aging (T32 AG062728), and S.D.A. is supported by an R01 grant from the National Institute on Aging (R01AG075136). Additional support for analytical services was provided through voucher funding from the University of Florida Clinical and Translational Science Institute for R.S.Z. Both R.S.Z. and S.D.A. were also supported by the RC1 Core of the Claude D. Pepper Older Americans Independence Center at the University of Florida (P30 AG028740). S.C. acknowledges the support of the Ermenegildo Zegna Founder’s Scholarship.

Institutional Review Board Statement

This study presents a secondary analysis of the All of Us Research Program, a National Institutes of Health (NIH) program, which was approved by the Institutional Review Board of the All of Us Research Program (protocol v9, 20 March 2020) [23] and conducted in accordance with the Declaration of Helsinki.

Informed Consent Statement

Informed consent was obtained from all subjects involved in the study.

Data Availability Statement

Data are available through the All of Us Research Program Researcher Workbench, subject to registration, training, and project approval. Access to individual-level data is restricted due to privacy and ethical considerations. Researchers may request access at https://www.researchallofus.org/.

Acknowledgments

The All of Us Research Program is supported by the National Institutes of Health, Office of the Director: Regional Medical Centers: 1 OT2 OD026549; 1 OT2 OD026554; 1 OT2 OD026557; 1 OT2 OD026556; 1 OT2 OD026550; 1 OT2 OD 026552; 1 OT2 OD026553; 1 OT2 OD026548; 1 OT2 OD026551; 1 OT2 OD026555; IAA #: AOD 16037; Federally Qualified Health Centers: HHSN 263201600085U; Data and Research Center: 5 U2C OD023196; Biobank: 1 U24 OD023121; The Participant Center: U24 OD023176; Participant Technology Systems Center: 1 U24 OD023163; Communications and Engagement: 3 OT2 OD023205; 3 OT2 OD023206; and Community Partners: 1 OT2 OD025277; 3 OT2 OD025315; 1 OT2 OD025337; 1 OT2 OD025276. In addition, the All of Us Research Program would not be possible without the partnership of its participants. Lastly, we would like to thank Natalie Bohmke for her feedback.

Conflicts of Interest

The authors declare no conflicts of interest. The funders had no role in the design of the study; in the collection, analyses, or interpretation of data; in the writing of the manuscript; or in the decision to publish the results.

Appendix A

Table A1. Clinical categories of anemia based on ICD-9-CM and ICD-10-CM definitions, mapped to standardized condition concepts in the All of Us data model.
ICD-9-CM CodeDescriptionICD-10-CM CodeDescription
280.0–280.9Iron deficiency anemiaD50.0–D50.9Iron deficiency anemia (dietary, chronic blood loss, unspecified)
285.1Acute posthemorrhagic anemiaD62Acute anemia due to recent blood loss
285.2Anemia of chronic diseaseD63.0–D63.8Anemia in chronic disease (including neoplastic disease, chronic kidney disease and other chronic diseases)
285.9Anemia, unspecifiedD64.0–D64.9Other and unspecified anemia
281.0–281.9Other nutritional anemiasD51–D53Vitamin B12, folate, and other nutritional anemias
282.0–282.9, 283Hemolytic anemiasD55–D59Hereditary and acquired hemolytic anemias
284.0–284.9Aplastic anemiaD61Aplastic and other bone marrow failure syndromes
238.7Neoplasm of uncertain behavior of other lymphatic and hematopoietic tissuesD46Myelodysplastic syndromes
Table A2. Clinical categories of menopausal status based on ICD-9-CM and ICD-10-CM definitions, mapped to standardized condition concepts in the All of Us data model.
ICD-9-CM CodeDescriptionICD-10-CM CodeDescription
627.2Symptomatic menopausal or female climacteric statesN95.1Menopausal and female climacteric states
627.3Postmenopausal atrophic vaginitisN95.2Postmenopausal atrophic vaginitis
627.8Other specified menopausal disordersN95.8Other specified menopausal and perimenopausal disorders
627.9Unspecified menopausal disorderN95.9Unspecified menopausal and perimenopausal disorder
Z78.0Asymptomatic menopausal state
Table A3. Iron biomarkers commonly used U.S. clinical laboratories’ reference intervals across age and sex according to the National Board of Medical Examiners.
MenWomen
BiomarkerUnit<55 Years>55 YearsPre-MenopausePost-Menopause
Serum ironµg/dL65–17650–17060–17050–170
Ferritinng/mL20–30020–50012–15020–300
TSAT%20–5020–5015–5015–50
TIBCµg/dL250–450250–450250–450240–450
UIBCµg/dL111–343111–343111–343111–343
Abbreviations: TIBC, total iron-binding capacity; TSAT, transferrin saturation; UIBC, unsaturated iron-binding capacity.

References

  1. Zeidan, R.S.; Han, S.M.; Leeuwenburgh, C.; Xiao, R. Iron homeostasis and organismal aging. Ageing Res. Rev. 2021, 72, 101510. [Google Scholar] [CrossRef]
  2. Zeidan, R.S.; Martenson, M.; Tamargo, J.A.; McLaren, C.; Ezzati, A.; Lin, Y.; Yang, J.J.; Yoon, H.S.; McElroy, T.; Collins, J.F.; et al. Iron homeostasis in older adults: Balancing nutritional requirements and health risks. J. Nutr. Health Aging 2024, 28, 100212. [Google Scholar] [CrossRef]
  3. Zeidan, R.S.; Yoon, H.S.; Yang, J.J.; Sobh, A.; Braithwaite, D.; Mankowski, R.; Leeuwenburgh, C.; Anton, S. Iron and cancer: Overview of the evidence from population-based studies. Front. Oncol. 2024, 14, 1393195. [Google Scholar] [CrossRef] [PubMed]
  4. Placzkowska, S.; Terpinska, M.; Piwowar, A. The Importance of Establishing Reference Intervals—Is it still a Current Problem for Laboratory and Doctors? Clin. Lab. 2020, 66, 1429–1438. [Google Scholar] [CrossRef]
  5. Lim, E.; Miyamura, J.; Chen, J.J. Racial/Ethnic-Specific Reference Intervals for Common Laboratory Tests: A Comparison among Asians, Blacks, Hispanics, and White. Hawaii J. Med. Public Health 2015, 74, 302–310. [Google Scholar]
  6. Rappoport, N.; Paik, H.; Oskotsky, B.; Tor, R.; Ziv, E.; Zaitlen, N.; Butte, A.J. Comparing Ethnicity-Specific Reference Intervals for Clinical Laboratory Tests from EHR Data. J. Appl. Lab. Med. 2018, 3, 366–377. [Google Scholar] [CrossRef]
  7. Cappellini, M.D.; Comin-Colet, J.; de Francisco, A.; Dignass, A.; Doehner, W.; Lam, C.S.; Macdougall, I.C.; Rogler, G.; Camaschella, C.; Kadir, R.; et al. Iron deficiency across chronic inflammatory conditions: International expert opinion on definition, diagnosis, and management. Am. J. Hematol. 2017, 92, 1068–1078. [Google Scholar] [CrossRef] [PubMed]
  8. Jian, J.; Pelle, E.; Huang, X. Iron and menopause: Does increased iron affect the health of postmenopausal women? Antioxid. Redox Signal 2009, 11, 2939–2943. [Google Scholar] [CrossRef]
  9. Fairweather-Tait, S.J.; Wawer, A.A.; Gillings, R.; Jennings, A.; Myint, P.K. Iron status in the elderly. Mech. Ageing Dev. 2014, 136–137, 22–28. [Google Scholar] [CrossRef]
  10. Mangan, D. Iron: An underrated factor in aging. Aging 2021, 13, 23407–23415. [Google Scholar] [CrossRef] [PubMed]
  11. Kang, W.; Barad, A.; Clark, A.G.; Wang, Y.; Lin, X.; Gu, Z.; O’Brien, K.O. Ethnic Differences in Iron Status. Adv. Nutr. 2021, 12, 1838–1853. [Google Scholar] [CrossRef]
  12. Pfeiffer, C.M.; Sternberg, M.R.; Caldwell, K.L.; Pan, Y. Race-ethnicity is related to biomarkers of iron and iodine status after adjusting for sociodemographic and lifestyle variables in NHANES 2003-2006. J. Nutr. 2013, 143, 977S–985S. [Google Scholar] [CrossRef] [PubMed]
  13. Akgun, Y. Association Between Race and Blood Ferritin Level of Whole Blood Donors. Cureus 2025, 17, e82926. [Google Scholar] [CrossRef]
  14. Harris, E.L.; McLaren, C.E.; Reboussin, D.M.; Gordeuk, V.R.; Barton, J.C.; Acton, R.T.; McLaren, G.D.; Vogt, T.M.; Snively, B.M.; Leiendecker-Foster, C.; et al. Serum ferritin and transferrin saturation in Asians and Pacific Islanders. Arch. Intern. Med. 2007, 167, 722–726. [Google Scholar] [CrossRef]
  15. Barton, J.C.; Wiener, H.H.; Acton, R.T.; Adams, P.C.; Eckfeldt, J.H.; Gordeuk, V.R.; Harris, E.L.; McLaren, C.E.; Harrison, H.; McLaren, G.D.; et al. Prevalence of iron deficiency in 62,685 women of seven race/ethnicity groups: The HEIRS Study. PLoS ONE 2020, 15, e0232125. [Google Scholar] [CrossRef]
  16. Dorizzi, R.M.; Fortunato, A.; Marchi, G.; Scattolo, N. Reference interval of ferritin in premenopausal women calculated in four laboratories using three different analyzers. Clin. Biochem. 2000, 33, 75–77. [Google Scholar] [CrossRef]
  17. DePalma, R.G.; Hayes, V.W.; O’Leary, T.J. Optimal serum ferritin level range: Iron status measure and inflammatory biomarker. Metallomics 2021, 13, mfab030. [Google Scholar] [CrossRef]
  18. Fertrin, K.Y. Diagnosis and management of iron deficiency in chronic inflammatory conditions (CIC): Is too little iron making your patient sick? Hematology 2020, 2020, 478–486. [Google Scholar] [CrossRef] [PubMed]
  19. Truong, J.; Naveed, K.; Beriault, D.; Lightfoot, D.; Fralick, M.; Sholzberg, M. The origin of ferritin reference intervals: A systematic review. Lancet Haematol. 2024, 11, e530–e539. [Google Scholar] [CrossRef] [PubMed]
  20. Cook, J.D.; Lipschitz, D.A.; Miles, L.E.; Finch, C.A. Serum ferritin as a measure of iron stores in normal subjects. Am. J. Clin. Nutr. 1974, 27, 681–687. [Google Scholar] [CrossRef]
  21. Munoz, M.; Gomez-Ramirez, S.; Besser, M.; Pavia, J.; Gomollon, F.; Liumbruno, G.M.; Bhandari, S.; Cladellas, M.; Shander, A.; Auerbach, M. Current misconceptions in diagnosis and management of iron deficiency. Blood Transfus. 2017, 15, 422–437. [Google Scholar] [CrossRef] [PubMed]
  22. All of Us Research Program Investigators; Denny, J.C.; Rutter, J.L.; Goldstein, D.B.; Philippakis, A.; Smoller, J.W.; Jenkins, G.; Dishman, E. The “All of Us” Research Program. N. Engl. J. Med. 2019, 381, 668–676. [Google Scholar] [CrossRef]
  23. Institutional Review Board (IRB) of the All of Us Research Program. Available online: https://allofus.nih.gov/about/who-we-are/institutional-review-board-irb-of-all-of-us-research-program (accessed on 24 November 2025).
  24. Ozarda, Y.; Higgins, V.; Adeli, K. Verification of reference intervals in routine clinical laboratories: Practical challenges and recommendations. Clin. Chem. Lab. Med. 2018, 57, 30–37. [Google Scholar] [CrossRef]
  25. Hoq, M.; Canterford, L.; Matthews, S.; Khanom, G.; Ignjatovic, V.; Monagle, P.; Donath, S.; Carlin, J.; HAPPI Kids Study Team. Statistical methods used in the estimation of age-specific paediatric reference intervals for laboratory blood tests: A systematic review. Clin. Biochem. 2020, 85, 12–19. [Google Scholar] [CrossRef] [PubMed]
  26. Zacharski, L.R.; Ornstein, D.L.; Woloshin, S.; Schwartz, L.M. Association of age, sex, and race with body iron stores in adults: Analysis of NHANES III data. Am. Heart J. 2000, 140, 98–104. [Google Scholar] [CrossRef]
  27. Merlo, F.; Groothof, D.; Khatami, F.; Ahanchi, N.S.; Wehrli, F.; Bakker, S.J.L.; Eisenga, M.F.; Muka, T. Changes in Iron Status Biomarkers with Advancing Age According to Sex and Menopause: A Population-Based Study. J. Clin. Med. 2023, 12, 5338. [Google Scholar] [CrossRef]
  28. Boyd, J.C. Defining laboratory reference values and decision limits: Populations, intervals, and interpretations. Asian J. Androl. 2010, 12, 83–90. [Google Scholar] [CrossRef]
  29. Linnet, K. Two-stage transformation systems for normalization of reference distributions evaluated. Clin. Chem. 1987, 33, 381–386. [Google Scholar] [CrossRef] [PubMed]
  30. Ritchie, R.F.; Palomaki, G.E.; Neveux, L.M.; Navolotskaia, O.; Ledue, T.B.; Craig, W.Y. Reference distributions for serum iron and transferrin saturation: A comparison of a large cohort to the world’s literature. J. Clin. Lab. Anal. 2002, 16, 246–252. [Google Scholar] [CrossRef]
  31. Troike, K.M.; McShane, A.J. Re-evaluating ferritin thresholds to diagnose iron deficiency. Clin. Biochem. 2025, 140, 111020. [Google Scholar] [CrossRef] [PubMed]
  32. Rodgers, S.; Woolley, T.; Smith, J.; Prinsloo, P.; Fernando, N. Updated adult ferritin reference intervals based on a large, healthy UK sample, measured on Roche Cobas series analysers. Ann. Clin. Biochem. 2024, 61, 365–371. [Google Scholar] [CrossRef]
  33. Xu, Y.; Wu, X.; Zhang, J.; Niu, Q.; Cai, B.; Miao, Q. Establishment and Validation of Serum Ferritin Reference Intervals Based on Real-World Big Data and Multi-Strategy Partitioning Algorithms. J. Clin. Med. 2026, 15, 976. [Google Scholar] [CrossRef] [PubMed]
  34. Pan, Y.; Jackson, R.T. Ethnic difference in the relationship between acute inflammation and serum ferritin in US adult males. Epidemiol. Infect. 2008, 136, 421–431. [Google Scholar] [CrossRef]
  35. Gordeuk, V.R.; Brannon, P.M. Ethnic and genetic factors of iron status in women of reproductive age. Am. J. Clin. Nutr. 2017, 106, 1594S–1599S. [Google Scholar] [CrossRef]
  36. Pan, Y.; Jackson, R.T. Insights into the ethnic differences in serum ferritin between black and white US adult men. Am. J. Hum. Biol. 2008, 20, 406–416. [Google Scholar] [CrossRef]
  37. Tahmasebi, H.; Trajcevski, K.; Higgins, V.; Adeli, K. Influence of ethnicity on population reference values for biochemical markers. Crit. Rev. Clin. Lab. Sci. 2018, 55, 359–375. [Google Scholar] [CrossRef]
  38. Feraco, A.; Armani, A.; Amoah, I.; Guseva, E.; Camajani, E.; Gorini, S.; Strollo, R.; Padua, E.; Caprio, M.; Lombardo, M. Assessing gender differences in food preferences and physical activity: A population-based survey. Front. Nutr. 2024, 11, 1348456. [Google Scholar] [CrossRef]
  39. Feraco, A.; Armani, A.; Gorini, S.; Camajani, E.; Quattrini, C.; Filardi, T.; Karav, S.; Strollo, R.; Caprio, M.; Lombardo, M. Gender Differences in Dietary Patterns and Eating Behaviours in Individuals with Obesity. Nutrients 2024, 16, 4226. [Google Scholar] [CrossRef] [PubMed]
  40. Li, W.; Youssef, G.; Procter-Gray, E.; Olendzki, B.; Cornish, T.; Hayes, R.; Churchill, L.; Kane, K.; Brown, K.; Magee, M.F. Racial Differences in Eating Patterns and Food Purchasing Behaviors among Urban Older Women. J. Nutr. Health Aging 2017, 21, 1190–1199. [Google Scholar] [CrossRef] [PubMed]
  41. Pasricha, S.R.; Tye-Din, J.; Muckenthaler, M.U.; Swinkels, D.W. Iron deficiency. Lancet 2021, 397, 233–248. [Google Scholar] [CrossRef]
  42. Martens, K.; DeLoughery, T.G. Sex, lies, and iron deficiency: A call to change ferritin reference ranges. Hematology 2023, 2023, 617–621. [Google Scholar] [CrossRef]
  43. Rusch, J.A.; van der Westhuizen, D.J.; Gill, R.S.; Louw, V.J. Diagnosing iron deficiency: Controversies and novel metrics. Best Pract. Res. Clin. Anaesthesiol. 2023, 37, 451–467. [Google Scholar] [CrossRef] [PubMed]
  44. Cancado, R.D.; Leite, L.A.C.; Munoz, M. Defining Global Thresholds for Serum Ferritin: A Challenging Mission in Establishing the Iron Deficiency Diagnosis in This Era of Striving for Health Equity. Diagnostics 2025, 15, 289. [Google Scholar] [CrossRef] [PubMed]
  45. Rushton, D.H.; Barth, J.H. What is the evidence for gender differences in ferritin and haemoglobin? Crit. Rev. Oncol. Hematol. 2010, 73, 1–9. [Google Scholar] [CrossRef]
  46. Ichihara, K.; Ozarda, Y.; Barth, J.H.; Klee, G.; Qiu, L.; Erasmus, R.; Borai, A.; Evgina, S.; Ashavaid, T.; Khan, D.; et al. A global multicenter study on reference values: 1. Assessment of methods for derivation and comparison of reference intervals. Clin. Chim. Acta 2017, 467, 70–82. [Google Scholar] [CrossRef]
  47. Ozarda, Y. Reference intervals: Current status, recent developments and future considerations. Biochem. Med. 2016, 26, 5–16. [Google Scholar] [CrossRef] [PubMed]
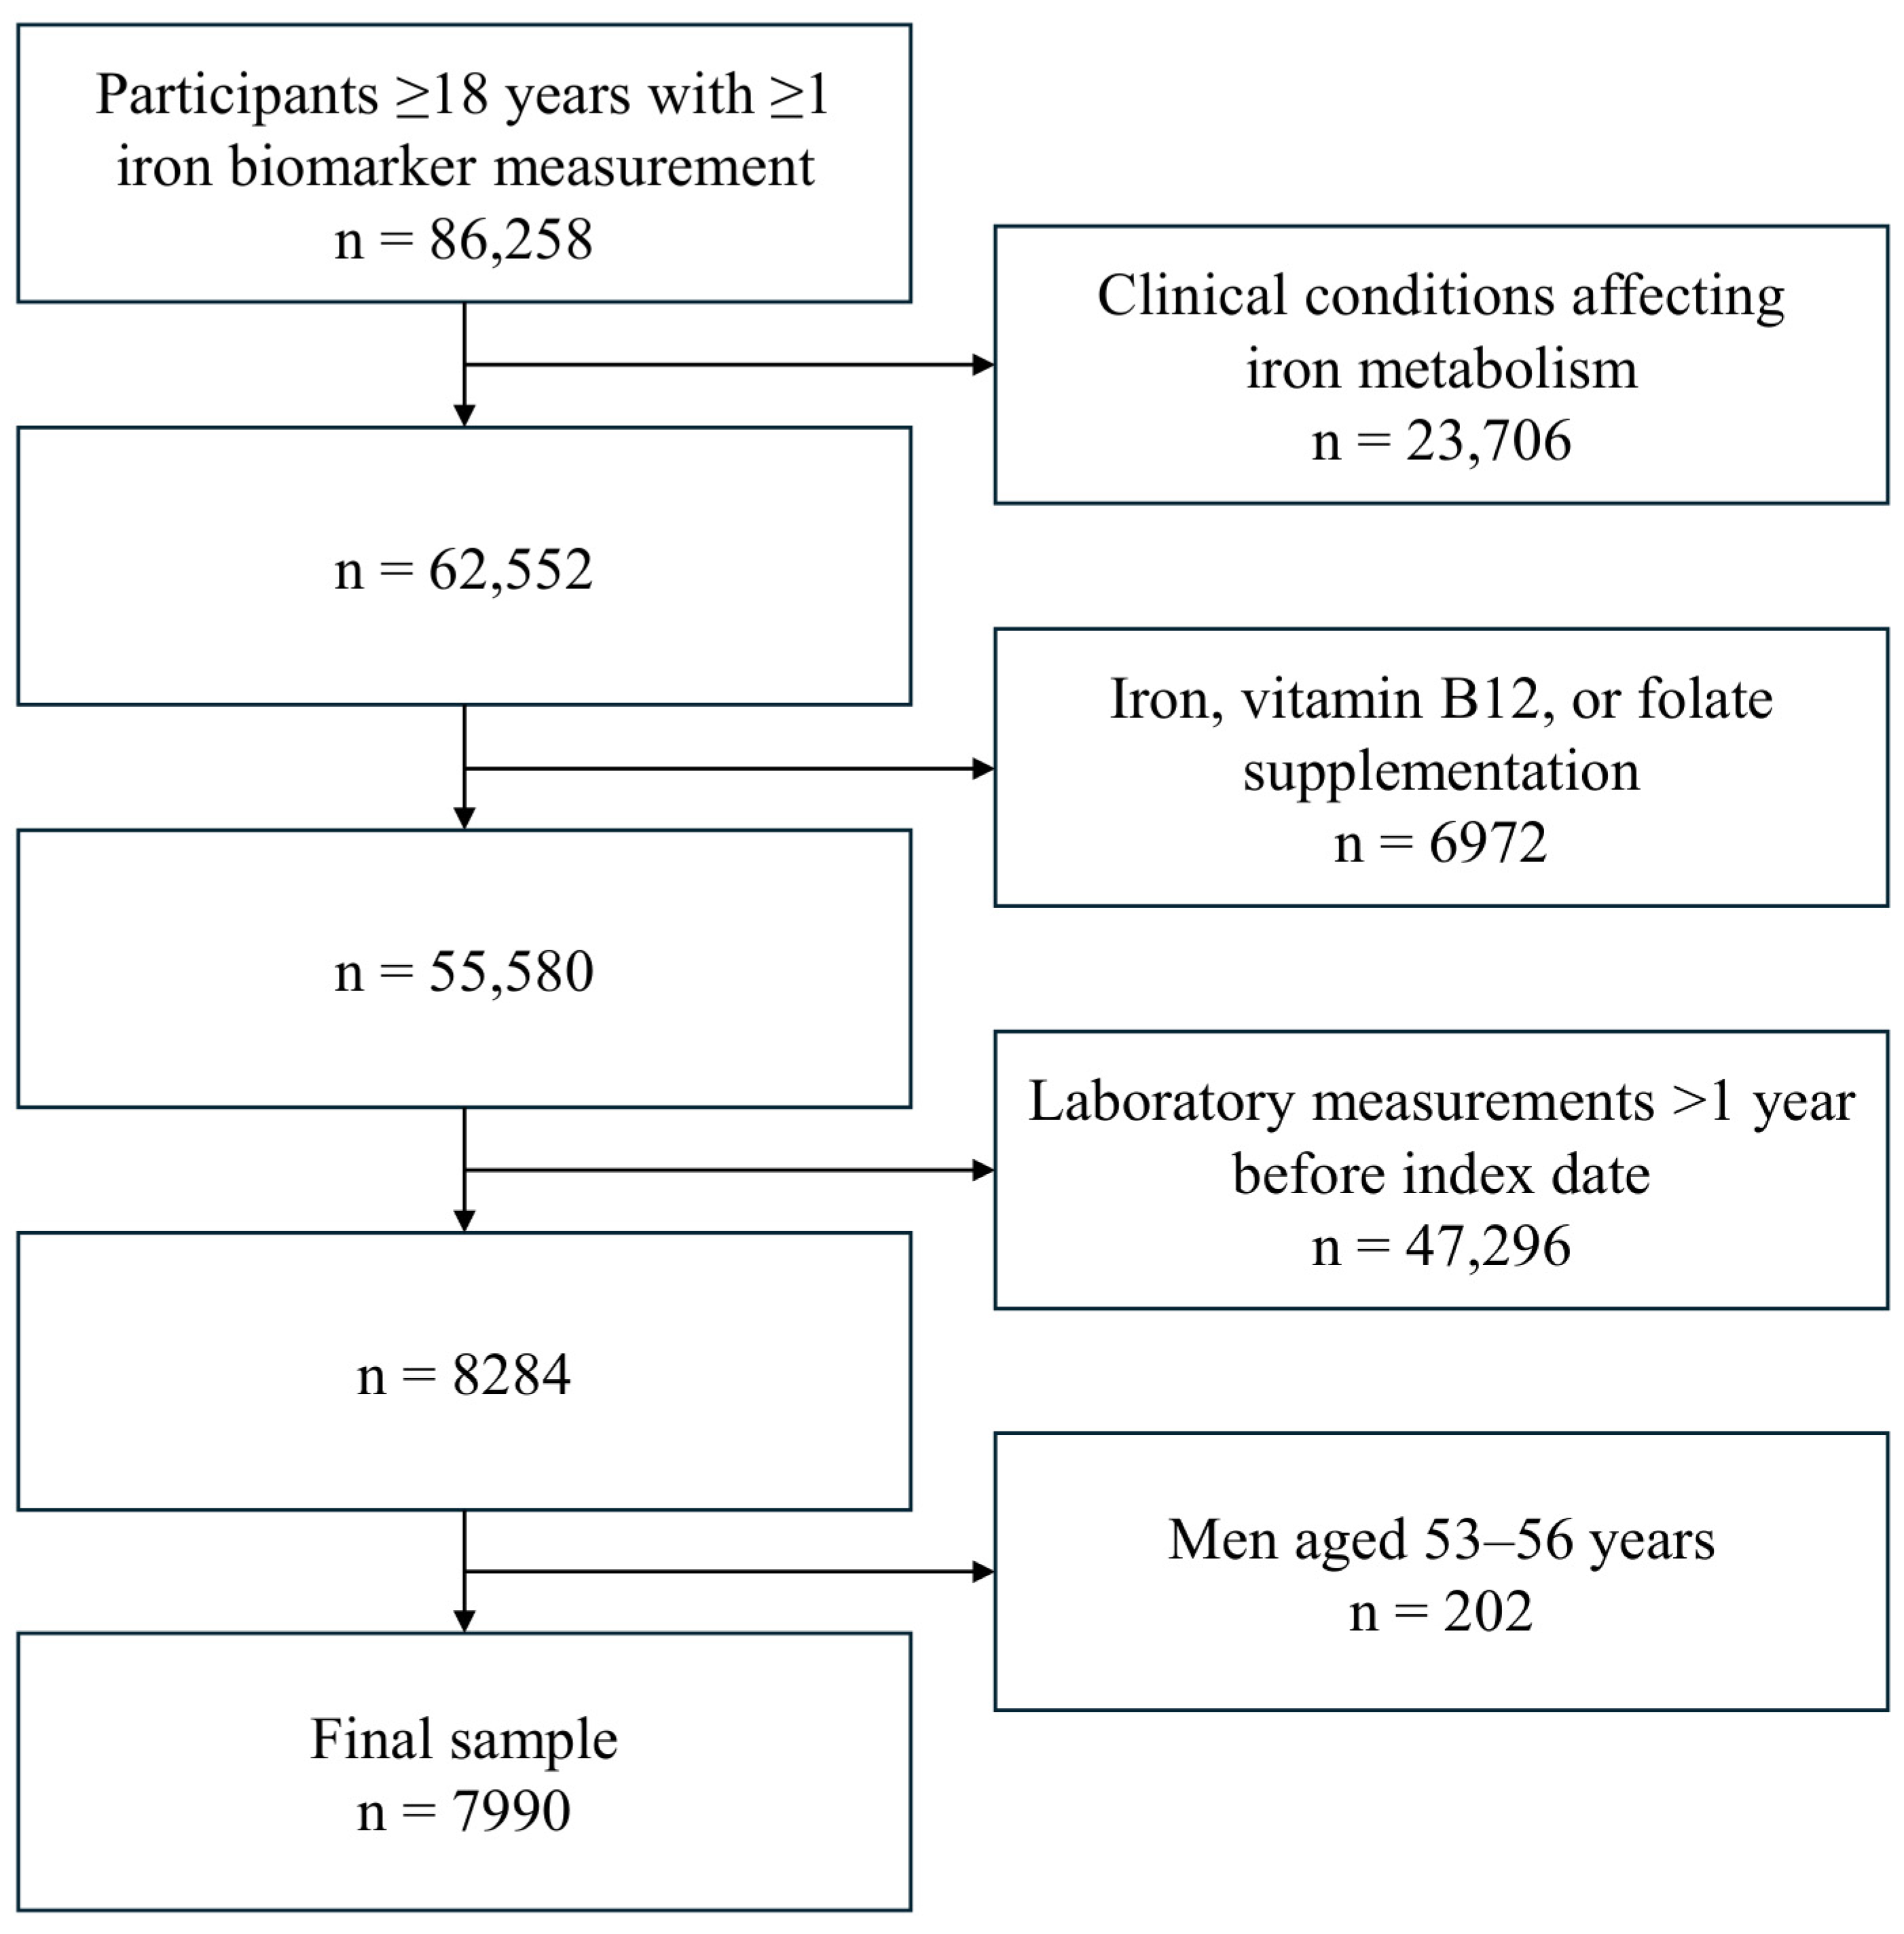
Figure 1. Flowchart of sample selection. Clinical conditions affecting iron metabolism include anemia, inflammatory diseases, pregnancy/lactation, malignancies, and iron-overload disorders.
Nutrients 18 01522 g001
Figure 2. Sex- and age-related differences in circulating iron biomarkers. Bar graphs show mean ± standard deviation values for (A) serum iron, (B) ferritin, (C) total iron-binding capacity, (D) unsaturated iron-binding capacity, and (E) transferrin saturation across four groups: premenopausal women, postmenopausal women, men < 53 years, and men > 56 years. Abbreviations: Pre-W, premenopausal women; Post-W, postmenopausal women; TIBC, total iron-binding capacity; TSAT, transferrin saturation; UIBC, unsaturated iron-binding capacity.
Nutrients 18 01522 g002
Figure 3. Distribution of iron biomarker categories across age and sex groups. Stacked bar plots show the proportion of values above normal (blue), below normal (orange), and within the reference interval (grey) for serum iron, ferritin, total iron-binding capacity, unsaturated iron-binding capacity, and transferrin saturation across four groups: premenopausal women, postmenopausal women, men < 53 years, and men > 56 years. Abbreviations: Pre-W, premenopausal women; Post-W, postmenopausal women; TIBC, total iron-binding capacity; TSAT, transferrin saturation; UIBC, unsaturated iron-binding capacity.
Nutrients 18 01522 g003
Figure 4. Iron biomarkers stratified by race, sex, and age group. Mean values with standard deviations are shown for serum iron, ferritin, total iron-binding capacity, unsaturated iron-binding capacity, and transferrin saturation across racial groups (White and Black or African American) and stratified by sex and age categories (pre-menopause women, post-menopause women, men aged < 53 years, and men aged > 56 years). Abbreviations: TIBC, total iron-binding capacity; TSAT, transferrin saturation; UIBC, unsaturated iron-binding capacity.
Nutrients 18 01522 g004
Table 1. Baseline characteristics of the study population by age and sex groups, presented as counts and percentage (%).
CharacteristicsTotal Sample
n = 7990
Women
n = 5356
Men
n = 2634
Pre-Menopause
n = 4654
Post-Menopause
n = 702
Men < 53 Years
n = 926
Men > 56 Years
n = 1708
Race
Black or African American1198 (15%)751 (16.1%)90 (12.8%)135 (14.6%)222 (13%)
White5809 (72.7%)3285 (70.6%)563 (80.2%)605 (65.3%)1356 (79.4%)
Others983 (12.3%)618 (13.3%)49 (7%)186 (20.1%)130 (7.6%)
Ethnicity
Hispanic or Latino315 (3.9%)211 (4.5%)12 (1.7%)61 (6.6%)31 (1.8%)
Not Hispanic or Latino7675 (96.1%)4443 (95.5%)690 (98.3%)865 (93.4%)1677 (98.2%)
Highest educational attainment
Less than high school246 (3.1%)126 (2.7%)21 (3%)36 (3.9%)63 (3.7%)
High school or GED1085 (13.6%)588 (12.6%)87 (12.4%)176 (19%)234 (13.7%)
Some college2286 (28.6%)1423 (30.6%)197 (28.1%)240 (25.9%)426 (24.9%)
College degree2182 (27.3%)1296 (27.8%)181 (25.8%)252 (27.2%)453 (26.5%)
Advanced degree2077 (26%)1164 (25%)199 (28.3%)207 (22.4%)507 (29.7%)
Annual household income
<25,000$1412 (17.7%)879 (18.9%)108 (15.4%)186 (20.1%)239 (14%)
25,000–50,000$1267 (15.9%)743 (16%)120 (17.1%)128 (13.8%)276 (16.2%)
50,000–75,000$1010 (12.6%)619 (13.3%)83 (11.8%)103 (11.1%)205 (12%)
75,000–100,000$846 (10.6%)500 (10.7%)81 (11.5%)94 (10.2%)171 (10%)
100,000–150,000$1101 (13.8%)642 (13.8%)92 (13.1%)124 (13.4%)243 (14.2%)
>150,000$1178 (14.7%)642 (13.8%)107 (15.2%)164 (17.7%)265 (15.5%)
Not reported/not available1177 (14.7%)630 (13.5%)111 (15.8%)127 (13.7%)309 (18.1%)
Health insurance status
Yes7684 (96.2%)4492 (96.5%)689 (98.1%)872 (94.2%)1631 (95.5%)
No195 (2.4%)95 (2%)6 (0.9%)38 (4.1%)56 (3.3%)
Not reported/not available112 (1.4%)68 (1.5%)7 (1.0%)16 (1.7%)21 (1.2%)
Alcohol use
Any5683 (71.1%)3367 (72.3%)517 (73.6%)652 (70.4%)1147 (67.2%)
None1506 (18.8%)782 (16.8%)131 (18.7%)163 (17.6%)430 (25.2%)
Not reported/not available802 (10.0%) *506 (10.9%)54 (7.7%)111 (12.0%)131 (7.7%) *
Smoking status
Current smoker3114 (39%)1652 (35.5%)263 (37.5%)354 (38.2%)845 (49.5%)
Non smoker4649 (58.2%)2894 (62.2%)406 (57.8%)551 (59.5%)798 (46.7%)
Former smoker227 (2.8%)108 (2.3%)33 (4.7%)21 (2.3%)65 (3.8%)
Self-reported general health
Excellent 544 (6.8%)296 (6.4%)50 (7.1%)56 (6%)142 (8.3%)
Very good 2159 (27%)1243 (26.7%)233 (33.2%)211 (22.8%)472 (27.6%)
Good2796 (35%)1621 (34.8%)264 (37.6%)320 (34.6%)591 (34.6%)
Fair 1740 (21.8%)1039 (22.3%)120 (17.1%)223 (24.1%)358 (21%)
Poor 509 (6.4%)306 (6.6%)20 (2.8%)84 (9.1%)99 (5.8%)
* Percentages may not sum to exactly 100.0% because of rounding. Alcohol use was categorized as a binary variable and did not capture quantity or frequency of consumption, which may limit the interpretation of its association with iron biomarkers. All comparisons across groups were statistically significant (p < 0.001).
Table 2. Unadjusted and adjusted linear regression models for iron biomarkers across study groups.
OutcomeTermUnadjusted β (95% CI)p-ValueAdjusted β (95% CI) *p-Value
Serum ironPre-menopause women−6.47 (−8.98 to −3.96)<0.001−5.66 (−8.15 to −3.17)<0.001
Post-menopause women−1.04 (−5.37 to 3.29)0.637−1.39 (−5.62 to 2.84)0.521
Men < 53 years0.83 (−2.80 to 4.46)0.6532.28 (−1.31 to 5.87)0.213
Men > 56 yearsReferenceReference
FerritinPre-menopause women−85.44 (−101.83 to −69.05)<0.001−87.38 (−103.98 to −70.78)<0.001
Post-menopause women−77.58 (−103.69 to −51.47)0.006−76.96 (−102.99 to −50.93)0.005
Men < 53 years55.89 (32.39 to 79.39)<0.00147.96 (24.26 to 71.66)<0.001
Men > 56 yearsReferenceReference
TIBCPre-menopause women25.89 (21.01 to 30.77)<0.00125.25 (20.27 to 30.23)<0.001
Post-menopause women19.79 (11.60 to 27.98)<0.00118.68 (10.47 to 26.89)<0.001
Men < 53 years7.01 (−0.10 to 14.12)0.0547.03 (−0.22 to 14.28)0.057
Men > 56 yearsReferenceReference
UIBCPre-menopause women38.84 (27.96 to 49.72)<0.00138.84 (27.65 to 50.03)<0.001
Post-menopause women22.50 (0.67 to 44.33)0.04420.28 (−1.89 to 42.45)0.073
Men < 53 years20.09 (4.82 to 35.36)0.01019.31 (3.49 to 35.13)0.017
Men > 56 yearsReferenceReference
TSATPre-menopause women−3.72 (−4.58 to −2.86)<0.001−3.61 (−4.47 to −2.75)<0.001
Post-menopause women−2.01 (−3.44 to −0.58)0.006−2.19 (−3.60 to −0.78)0.002
Men < 53 years−0.32 (−1.57 to 0.93)0.612−0.07 (−1.32 to 1.18)0.915
Men > 56 yearsReferenceReference
* Adjusted for sex, race, ethnicity, household income, insurance status, educational attainment, self-reported health, alcohol consumption, and smoking status. Abbreviations: TIBC, total iron-binding capacity; TSAT, transferrin saturation; UIBC, unsaturated iron-binding capacity.
Disclaimer/Publisher’s Note: The statements, opinions and data contained in all publications are solely those of the individual author(s) and contributor(s) and not of MDPI and/or the editor(s). MDPI and/or the editor(s) disclaim responsibility for any injury to people or property resulting from any ideas, methods, instructions or products referred to in the content.