
Time-Restricted Eating Versus Daily Calorie Restriction: Effects on Inflammatory Markers over 12 Months in Adults with Obesity

 , , ,
, , ,  , ,
, ,
Abstract
1. Introduction
2. Materials and Methods
2.1. Study Population
2.2. Experimental Design
2.3. Outcome Measurements
2.3.1. Body Weight and Body Composition
2.3.2. Dietary Intake and Physical Activity
2.3.3. Inflammatory Markers
2.4. Quantification and Statistical Analysis
2.4.1. Power and Sample Size
2.4.2. Randomization
2.4.3. Statistical Analyses
3. Results
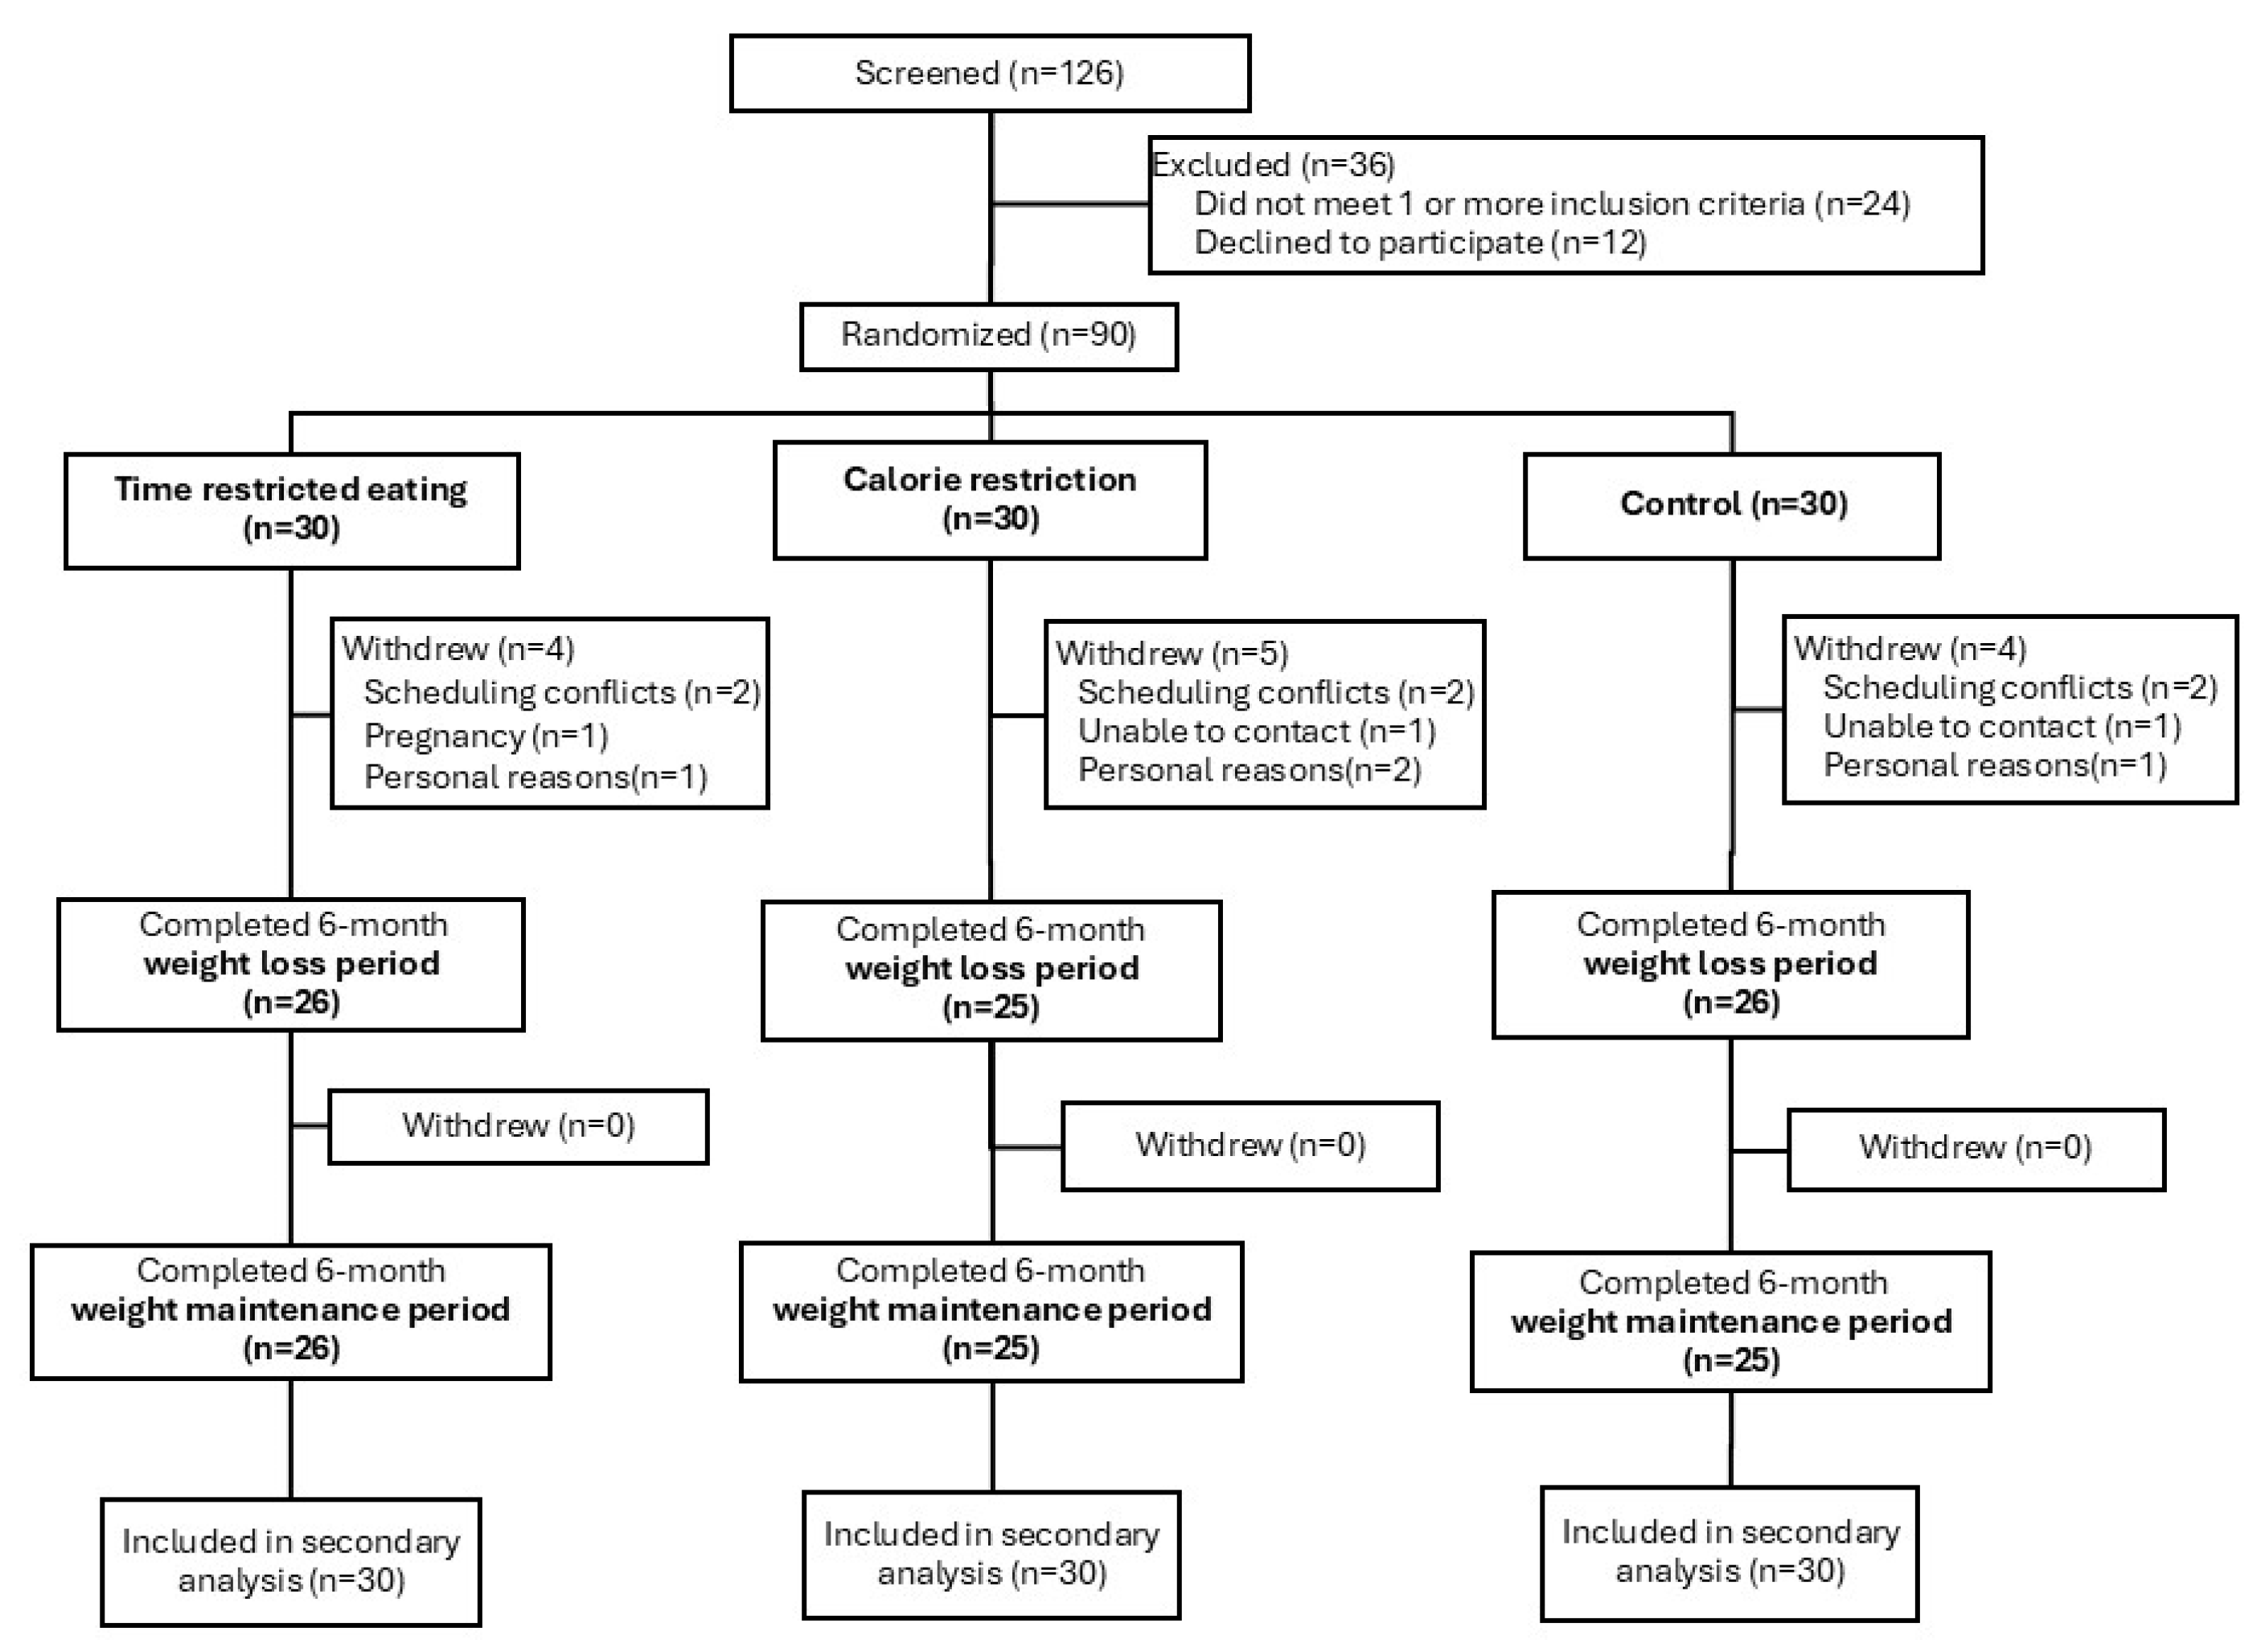
3.1. Participants
3.2. TRE and CR Led to Similar Changes in Body Weight Versus Controls
3.3. TRE and CR Produced Comparable Energy Restriction and Diet Adherence Versus Controls
3.4. Inflammatory Markers Did Not Change in TRE or CR Groups Versus Controls over 12 Months
3.5. Reductions in CRP Were Related to Decreases in Body Weight, Visceral Fat Mass, and Insulin Resistance
4. Discussion
5. Conclusions
Author Contributions
Funding
Institutional Review Board Statement
Informed Consent Statement
Data Availability Statement
Conflicts of Interest
References
- Wu, H.; Ballantyne, C.M. Metabolic Inflammation and Insulin Resistance in Obesity. Circ. Res. 2020, 126, 1549–1564. [Google Scholar] [CrossRef] [PubMed]
- Rohm, T.V.; Meier, D.T.; Olefsky, J.M.; Donath, M.Y. Inflammation in obesity, diabetes, and related disorders. Immunity 2022, 55, 31–55. [Google Scholar] [CrossRef]
- Sarin, H.V.; Lee, J.H.; Jauhiainen, M.; Joensuu, A.; Borodulin, K.; Mannisto, S.; Jin, Z.; Terwilliger, J.D.; Isola, V.; Ahtiainen, J.P.; et al. Substantial fat mass loss reduces low-grade inflammation and induces positive alteration in cardiometabolic factors in normal-weight individuals. Sci. Rep. 2019, 9, 3450. [Google Scholar] [CrossRef]
- Jensen, M.D.; Ryan, D.H.; Apovian, C.M.; Ard, J.D.; Comuzzie, A.G.; Donato, K.A.; Hu, F.B.; Hubbard, V.S.; Jakicic, J.M.; Kushner, R.F.; et al. 2013 AHA/ACC/TOS guideline for the management of overweight and obesity in adults: A report of the American College of Cardiology/American Heart Association Task Force on Practice Guidelines and The Obesity Society. Circulation 2014, 129, S102–S138. [Google Scholar] [CrossRef]
- Chae, J.S.; Paik, J.K.; Kang, R.; Kim, M.; Choi, Y.; Lee, S.H.; Lee, J.H. Mild weight loss reduces inflammatory cytokines, leukocyte count, and oxidative stress in overweight and moderately obese participants treated for 3 years with dietary modification. Nutr. Res. 2013, 33, 195–203. [Google Scholar] [CrossRef] [PubMed]
- Meydani, S.N.; Das, S.K.; Pieper, C.F.; Lewis, M.R.; Klein, S.; Dixit, V.D.; Gupta, A.K.; Villareal, D.T.; Bhapkar, M.; Huang, M.; et al. Long-term moderate calorie restriction inhibits inflammation without impairing cell-mediated immunity: A randomized controlled trial in non-obese humans. Aging 2016, 8, 1416–1431. [Google Scholar] [CrossRef]
- Varady, K.A.; Cienfuegos, S.; Ezpeleta, M.; Gabel, K. Cardiometabolic Benefits of Intermittent Fasting. Annu. Rev. Nutr. 2021, 41, 333–361. [Google Scholar] [CrossRef]
- Varady, K.A.; Cienfuegos, S.; Ezpeleta, M.; Gabel, K. Clinical application of intermittent fasting for weight loss: Progress and future directions. Nat. Rev. Endocrinol. 2022, 18, 309–321. [Google Scholar] [CrossRef]
- Manoogian, E.N.C.; Chow, L.S.; Taub, P.R.; Laferrere, B.; Panda, S. Time-restricted Eating for the Prevention and Management of Metabolic Diseases. Endocr. Rev. 2022, 43, 405–436. [Google Scholar] [CrossRef]
- Mulas, A.; Cienfuegos, S.; Ezpeleta, M.; Lin, S.; Pavlou, V.; Varady, K.A. Effect of intermittent fasting on circulating inflammatory markers in obesity: A review of human trials. Front. Nutr. 2023, 10, 1146924. [Google Scholar] [CrossRef]
- Moro, T.; Tinsley, G.; Longo, G.; Grigoletto, D.; Bianco, A.; Ferraris, C.; Guglielmetti, M.; Veneto, A.; Tagliabue, A.; Marcolin, G.; et al. Time-restricted eating effects on performance, immune function, and body composition in elite cyclists: A randomized controlled trial. J. Int. Soc. Sports Nutr. 2020, 17, 65. [Google Scholar] [CrossRef] [PubMed]
- Kord-Varkaneh, H.; Salehi-Sahlabadi, A.; Tinsley, G.M.; Santos, H.O.; Hekmatdoost, A. Effects of time-restricted feeding (16/8) combined with a low-sugar diet on the management of non-alcoholic fatty liver disease: A randomized controlled trial. Nutrition 2023, 105, 111847. [Google Scholar] [CrossRef]
- Turner, L.; Charrouf, R.; Martinez-Vizcaino, V.; Hutchison, A.; Heilbronn, L.K.; Fernandez-Rodriguez, R. The effects of time-restricted eating versus habitual diet on inflammatory cytokines and adipokines in the general adult population: A systematic review with meta-analysis. Am. J. Clin. Nutr. 2024, 119, 206–220. [Google Scholar] [CrossRef]
- Lin, S.H.; Cienfuegos, S.; Ezpeleta, M.; Gabel, K.; Pavlou, V.; Mulas, A.; Chakos, K.; McStay, M.; Wu, J.C.; Tussing-Humphreys, L.; et al. Time-Restricted Eating Without Calorie Counting for Weight Loss in a Racially Diverse Population A Randomized Controlled Trial. Ann. Intern. Med. 2023, 176, 885–895. [Google Scholar] [CrossRef]
- Mifflin, M.D.; St Jeor, S.T.; Hill, L.A.; Scott, B.J.; Daugherty, S.A.; Koh, Y.O. A new predictive equation for resting energy expenditure in healthy individuals. Am. J. Clin. Nutr. 1990, 51, 241–247. [Google Scholar] [CrossRef]
- Park, Y.; Dodd, K.W.; Kipnis, V.; Thompson, F.E.; Potischman, N.; Schoeller, D.A.; Baer, D.J.; Midthune, D.; Troiano, R.P.; Bowles, H.; et al. Comparison of self-reported dietary intakes from the Automated Self-Administered 24-h recall, 4-d food records, and food-frequency questionnaires against recovery biomarkers. Am. J. Clin. Nutr. 2018, 107, 80–93. [Google Scholar] [CrossRef]
- Kern, L.; Mittenbuhler, M.J.; Vesting, A.J.; Ostermann, A.L.; Wunderlich, C.M.; Wunderlich, F.T. Obesity-Induced TNFalpha and IL-6 Signaling: The Missing Link between Obesity and Inflammation-Driven Liver and Colorectal Cancers. Cancers 2018, 11, 24. [Google Scholar] [CrossRef]
- Mohallem, R.; Aryal, U.K. Regulators of TNFalpha mediated insulin resistance elucidated by quantitative proteomics. Sci. Rep. 2020, 10, 20878. [Google Scholar] [CrossRef]
- Plomgaard, P.; Bouzakri, K.; Krogh-Madsen, R.; Mittendorfer, B.; Zierath, J.R.; Pedersen, B.K. Tumor necrosis factor-alpha induces skeletal muscle insulin resistance in healthy human subjects via inhibition of Akt substrate 160 phosphorylation. Diabetes 2005, 54, 2939–2945. [Google Scholar] [CrossRef]
- Kokten, T.; Hansmannel, F.; Ndiaye, N.C.; Heba, A.C.; Quilliot, D.; Dreumont, N.; Arnone, D.; Peyrin-Biroulet, L. Calorie Restriction as a New Treatment of Inflammatory Diseases. Adv. Nutr. 2021, 12, 1558–1570. [Google Scholar] [CrossRef]
- Montefusco, L.; D’Addio, F.; Loretelli, C.; Ben Nasr, M.; Garziano, M.; Rossi, A.; Pastore, I.; Plebani, L.; Lunati, M.E.; Bolla, A.M.; et al. Anti-inflammatory effects of diet and caloric restriction in metabolic syndrome. J. Endocrinol. Investig. 2021, 44, 2407–2415. [Google Scholar] [CrossRef]
- Olson, T.P.; Dengel, D.R.; Leon, A.S.; Schmitz, K.H. Changes in inflammatory biomarkers following one-year of moderate resistance training in overweight women. Int. J. Obes. 2007, 31, 996–1003. [Google Scholar] [CrossRef]
- Bowker, N.; Shah, R.L.; Sharp, S.J.; Luan, J.; Stewart, I.D.; Wheeler, E.; Ferreira, M.A.R.; Baras, A.; Wareham, N.J.; Langenberg, C.; et al. Meta-analysis investigating the role of interleukin-6 mediated inflammation in type 2 diabetes. EBioMedicine 2020, 61, 103062. [Google Scholar] [CrossRef]
- Rotter, V.; Nagaev, I.; Smith, U. Interleukin-6 (IL-6) induces insulin resistance in 3T3-L1 adipocytes and is, like IL-8 and tumor necrosis factor-alpha, overexpressed in human fat cells from insulin-resistant subjects. J. Biol. Chem. 2003, 278, 45777–45784. [Google Scholar] [CrossRef]
- Bastard, J.P.; Maachi, M.; Van Nhieu, J.T.; Jardel, C.; Bruckert, E.; Grimaldi, A.; Robert, J.J.; Capeau, J.; Hainque, B. Adipose tissue IL-6 content correlates with resistance to insulin activation of glucose uptake both in vivo and in vitro. J. Clin. Endocrinol. Metab. 2002, 87, 2084–2089. [Google Scholar] [CrossRef] [PubMed]
- Nehring, S.M.; Goyal, A.; Patel, B.C. C Reactive Protein; StatPearls: Treasure Island, FL, USA, 2024. [Google Scholar]
- Choi, J.; Joseph, L.; Pilote, L. Obesity and C-reactive protein in various populations: A systematic review and meta-analysis. Obes. Rev. 2013, 14, 232–244. [Google Scholar] [CrossRef]
- Kanmani, S.; Kwon, M.; Shin, M.K.; Kim, M.K. Association of C-Reactive Protein with Risk of Developing Type 2 Diabetes Mellitus, and Role of Obesity and Hypertension: A Large Population-Based Korean Cohort Study. Sci. Rep. 2019, 9, 4573. [Google Scholar] [CrossRef]
- Selvin, E.; Paynter, N.P.; Erlinger, T.P. The effect of weight loss on C-reactive protein: A systematic review. Arch. Intern. Med. 2007, 167, 31–39. [Google Scholar] [CrossRef]
- Forsythe, L.K.; Wallace, J.M.; Livingstone, M.B. Obesity and inflammation: The effects of weight loss. Nutr. Res. Rev. 2008, 21, 117–133. [Google Scholar] [CrossRef]
- Li, C.; Xing, C.; Zhang, J.; Zhao, H.; Shi, W.; He, B. Eight-hour time-restricted feeding improves endocrine and metabolic profiles in women with anovulatory polycystic ovary syndrome. J. Transl. Med. 2021, 19, 148. [Google Scholar] [CrossRef]
- McAllister, M.J.; Gonzalez, A.E.; Waldman, H.S. Time Restricted Feeding Reduces Inflammation and Cortisol Response to a Firegrounds Test in Professional Firefighters. J. Occup. Environ. Med. 2021, 63, 441–447. [Google Scholar] [CrossRef] [PubMed]
- McAllister, M.J.; Pigg, B.L.; Renteria, L.I.; Waldman, H.S. Time-restricted feeding improves markers of cardiometabolic health in physically active college-age men: A 4-week randomized pre-post pilot study. Nutr. Res. 2020, 75, 32–43. [Google Scholar] [CrossRef] [PubMed]
- Elisia, I.; Yeung, M.; Kowalski, S.; Wong, J.; Rafiei, H.; Dyer, R.A.; Atkar-Khattra, S.; Lam, S.; Krystal, G. Omega 3 supplementation reduces C-reactive protein, prostaglandin E2 and the granulocyte/lymphocyte ratio in heavy smokers: An open-label randomized crossover trial. Front. Nutr. 2022, 9, 1051418. [Google Scholar] [CrossRef]
- Krajewska, M.; Witkowska-Sedek, E.; Ruminska, M.; Stelmaszczyk-Emmel, A.; Sobol, M.; Majcher, A.; Pyrzak, B. Vitamin D Effects on Selected Anti-Inflammatory and Pro-Inflammatory Markers of Obesity-Related Chronic Inflammation. Front. Endocrinol. 2022, 13, 920340. [Google Scholar] [CrossRef]


| Time-Restricted Eating | Calorie Restriction | Control | |
|---|---|---|---|
| n | 30 | 30 | 30 |
| Age (y) | 44 ± 12 | 44 ± 9 | 44 ± 13 |
| Sex, no. (%) | |||
| Female | 25 (83%) | 24 (80%) | 25 (83%) |
| Male | 5 (17%) | 6 (20%) | 5 (17%) |
| Race or ethnic group, no. (%) | |||
| Black | 11 (37%) | 9 (30%) | 10 (33%) |
| Asian | 3 (10%) | 3 (10%) | 0 (0%) |
| Hispanic | 13 (43%) | 11 (37%) | 17 (57%) |
| White | 3 (10%) | 7 (23%) | 3 (10%) |
| Body weight and composition | |||
| Body weight (kg) | 100 ± 17 | 102 ± 18 | 102 ± 17 |
| Fat mass (kg) | 46 ± 11 | 47 ± 11 | 47 ± 10 |
| Lean mass (kg) | 50 ± 10 | 50 ± 9 | 51 ± 8 |
| Visceral fat mass (kg) | 1.6 ± 0.6 | 1.6 ± 0.8 | 1.7 ± 0.8 |
| Waist circumference (cm) | 109 ± 13 | 110 ± 14 | 110 ± 13 |
| Height (cm) | 164 ± 9 | 166 ± 9 | 165 ± 7 |
| BMI (kg/m2) | 37 ± 6 | 37 ± 5 | 38 ± 5 |
| Inflammatory markers | |||
| IL-6 (pg/mL) | 4.1 ± 3.0 | 4.3 ± 5.2 | 3.2 ± 2.8 |
| TNF-alpha (pg/mL) | 9.7 ± 5.0 | 8.7 ± 3.8 | 13.7 ± 11.6 |
| CRP (mg/L) | 3.5 ± 1.4 | 3.3 ± 1.6 | 3.6 ± 1.8 |
| Blood pressure, heart rate | |||
| Systolic BP (mm Hg) | 124 ± 16 | 125 ± 14 | 126 ± 14 |
| Diastolic BP (mm Hg) | 84 ± 10 | 83 ± 9 | 85 ± 10 |
| Heart rate (bpm) | 75 ± 12 | 75 ± 13 | 74 ± 13 |
| Plasma lipids | |||
| Total cholesterol (mg/dL) | 185 ± 31 | 182 ± 37 | 178 ± 32 |
| LDL cholesterol (mg/dL) | 107 ± 27 | 110 ± 33 | 102 ± 28 |
| HDL cholesterol (mg/dL) | 55 ± 14 | 55 ± 11 | 49 ± 13 |
| Triglycerides (mg/dL) | 115 ± 47 | 88 ± 32 | 141 ± 75 |
| Glucoregulatory factors | |||
| Fasting glucose (mg/dL) | 89 ± 12 | 88 ± 13 | 87 ± 12 |
| Fasting insulin (μIU/mL) | 17 ± 11 | 11 ± 6 | 17 ± 10 |
| Insulin resistance (HOMA-IR) | 3.6 ± 2.8 | 2.6 ± 1.4 | 3.6 ± 2.6 |
| Insulin sensitivity (QUICKI) | 0.33 ± 0.03 | 0.34 ± 0.03 | 0.33 ± 0.03 |
| HbA1c (%) | 5.5 ± 0.5 | 5.4 ± 0.5 | 5.5 ± 0.4 |
| Variables | Change from Baseline to Month 12 (95% CI) | Difference Between Groups by Month 12 (95% CI) | ||||
|---|---|---|---|---|---|---|
| Time-Restricted Eating (TRE) | Daily Calorie Restriction (CR) | Control (CON) | TRE vs. CR | TRE vs. CON | CR vs. CON | |
| Body weight and composition | ||||||
| Body weight (kg) | −3.49 (−5.65, −1.32) | −4.30 (−7.63, −0.96) | 1.12 (−0.69, 2.94) | 0.81 (−3.07, 4.69) | −4.61 (−7.37, −1.85) | −5.42 (−9.13, −1.71) |
| Body weight (%) | −3.76 (−5.89, −1.64) | −4.20 (−7.59, −0.80) | 1.11 (−0.72, 2.94) | 0.43 (−3.48, 4.34) | −4.87 (−7.61, −2.13) | −5.30 (−9.06, −1.54) |
| Fat mass (kg) | −2.20 (−3.88, −0.52) | −2.61 (−5.97, 0.74) | 0.57 (−1.14, 2.27) | 0.42 (−3.24, 4.07) | −2.77 (−5.10, −0.43) | −3.18 (−6.85, 0.49) |
| Lean mass (kg) | −0.41 (−0.91, 0.08) | −0.74 (−1.44, −0.03) | 0.39 (−0.51, 1.29) | 0.32 (−0.52, 1.16) | −0.81 (−1.81, 0.20) | −1.13 (−2.24, −0.01) |
| Visceral fat mass (kg) | −0.14 (−0.23, −0.04) | −0.12 (−0.29, 0.06) | −0.03 (−0.16, 0.10) | −0.02 (−0.22, 0.17) | −0.11 (−0.27, 0.06) | −0.08 (−0.30, 0.13) |
| Waist circumference (cm) | −6.44 (−8.65, −4.24) | −3.77 (−7.46, −0.08) | −1.46 (−3.77, 0.84) | −2.67 (−6.86, 1.52) | −4.98 (−8.09, −1.87) | −2.30 (−6.55, 1.94) |
| Inflammatory markers | ||||||
| IL-6 (pg/mL) | −1.18 (−2.29, −0.06) | −0.63 (−2.10, 0.84) | 0.90 (−1.38, 3.18) | −0.55 (−2.34, 1.25) | −2.07 (−4.55, 0.40) | −1.53 (−4.17, 1.12) |
| TNF-alpha (pg/mL) | −0.63 (−1.95, 0.70) | 1.08 (−1.20, 3.36) | −0.15 (−2.93, 2.63) | −1.71 (−4.27, 0.85) | −0.48 (−3.47, 2.52) | 1.23 (−2.27, 4.72) |
| CRP (mg/L) | 0.11 (−0.63, 0.84) | −0.13 (−0.74, 0.47) | 0.22 (−0.31, 0.75) | 0.24 (−0.69, 1.17) | −0.11 (−1.00, 0.77) | −0.35 (−1.14, 0.43) |
| Blood pressure, heart rate | ||||||
| Systolic BP (mm Hg) | −1.78 (−6.80, 3.24) | −4.62 (−8.92, −0.31) | 0.06 (−4.52, 4.64) | 2.84 (−3.62, 9.29) | −1.84 (−8.47, 4.79) | −4.68 (−10.81, 1.46) |
| Diastolic BP (mm Hg) | −0.82 (−4.70, 3.05) | 0.99 (−2.13, 4.10) | 2.85 (0.10, 5.59) | −1.81 (−6.66, 3.04) | −3.67 (−8.30, 0.97) | −1.86 (−5.91, 2.18) |
| Heart rate (bpm) | −3.83 (−8.31, 0.64) | 1.63 (−3.32, 6.59) | −2.74 (−7.06, 1.59) | −5.47 (−11.98, 1.05) | −1.10 (−7.17, 4.98) | 4.37 (−2.05, 10.79) |
| Plasma lipids | ||||||
| Total cholesterol (mg/dL) | −1.69 (−9.73, 6.36) | −1.64 (−9.80, 6.52) | −0.67 (−7.37, 6.03) | −0.05 (−11.21, 11.11) | −1.02 (−11.22, 9.18) | −0.97 (−11.25, 9.31) |
| LDL cholesterol (mg/dL) | −0.86 (−9.14, 7.42) | −1.33 (−7.47, 4.81) | 2.37 (−4.51, 9.24) | 0.47 (−9.57, 10.52) | −3.22 (−13.71, 7.26) | −3.70 (−12.67, 5.28) |
| HDL cholesterol (mg/dL) | −1.78 (−5.04, 1.48) | 1.01 (−3.17, 5.19) | −0.76 (−2.76, 1.23) | −2.79 (−7.96, 2.38) | −1.02 (−4.74, 2.71) | 1.77 (−2.74, 6.29) |
| Triglycerides (mg/dL) | 3.60 (−10.22, 17.42) | −0.02 (−12.85, 12.81) | −0.08 (−17.95, 17.78) | 3.62 (−14.76, 21.99) | 3.68 (−18.33, 25.69) | 0.07 (−21.36, 21.49) |
| Glucoregulatory factors | ||||||
| Fasting glucose (mg/dL) | 2.82 (−1.15, 6.79) | 5.83 (1.25, 10.40) | 6.26 (1.63, 10.90) | −3.01 (−8.91, 2.90) | −3.44 (−9.39, 2.51) | −0.43 (−6.78, 5.91) |
| Fasting insulin (μIU/mL) | −2.83 (−5.34, −0.33) | −0.12 (−2.22, 1.97) | 1.44 (−2.32, 5.21) | −2.71 (−5.89, 0.48) | −4.27 (−8.68, 0.13) | −1.57 (−5.77, 2.63) |
| Insulin resistance (HOMA-IR) | −0.49 (−1.23, 0.24) | 0.07 (−0.47, 0.61) | 0.54 (−0.33, 1.41) | −0.56 (−1.45, 0.32) | −1.03 (−2.14, 0.07) | −0.47 (−1.46, 0.53) |
| Insulin sensitivity (QUICKI) | 0.01 (0.00, 0.02) | 0.00 (−0.02, 0.01) | −0.01 (−0.02, 0.00) | 0.01 (0.00, 0.03) | 0.02 (0.01, 0.04) | 0.01 (−0.01, 0.02) |
| HbA1c (%) | 0.00 (−0.15, 0.14) | 0.05 (−0.07, 0.18) | 0.07 (−0.03, 0.18) | −0.06 (−0.25, 0.13) | −0.08 (−0.25, 0.10) | −0.02 (−0.18, 0.14) |
Disclaimer/Publisher’s Note: The statements, opinions and data contained in all publications are solely those of the individual author(s) and contributor(s) and not of MDPI and/or the editor(s). MDPI and/or the editor(s) disclaim responsibility for any injury to people or property resulting from any ideas, methods, instructions or products referred to in the content. |
© 2025 by the authors. Licensee MDPI, Basel, Switzerland. This article is an open access article distributed under the terms and conditions of the Creative Commons Attribution (CC BY) license (https://creativecommons.org/licenses/by/4.0/).
Share and Cite
Lin, S.; Cienfuegos, S.; Ezpeleta, M.; Pavlou, V.; Corapi, S.; Runchey, M.-C.; Alexandria, S.J.; Tussing-Humphreys, L.; Varady, K.A. Time-Restricted Eating Versus Daily Calorie Restriction: Effects on Inflammatory Markers over 12 Months in Adults with Obesity. Nutrients 2025, 17, 1130. https://doi.org/10.3390/nu17071130
Lin S, Cienfuegos S, Ezpeleta M, Pavlou V, Corapi S, Runchey M-C, Alexandria SJ, Tussing-Humphreys L, Varady KA. Time-Restricted Eating Versus Daily Calorie Restriction: Effects on Inflammatory Markers over 12 Months in Adults with Obesity. Nutrients. 2025; 17(7):1130. https://doi.org/10.3390/nu17071130
Chicago/Turabian StyleLin, Shuhao, Sofia Cienfuegos, Mark Ezpeleta, Vasiliki Pavlou, Sarah Corapi, Mary-Claire Runchey, Shaina J. Alexandria, Lisa Tussing-Humphreys, and Krista A. Varady. 2025. "Time-Restricted Eating Versus Daily Calorie Restriction: Effects on Inflammatory Markers over 12 Months in Adults with Obesity" Nutrients 17, no. 7: 1130. https://doi.org/10.3390/nu17071130
APA StyleLin, S., Cienfuegos, S., Ezpeleta, M., Pavlou, V., Corapi, S., Runchey, M.-C., Alexandria, S. J., Tussing-Humphreys, L., & Varady, K. A. (2025). Time-Restricted Eating Versus Daily Calorie Restriction: Effects on Inflammatory Markers over 12 Months in Adults with Obesity. Nutrients, 17(7), 1130. https://doi.org/10.3390/nu17071130