
Development of the Australian Dietary Guidelines Adherence Tool (ADG-AT): A Food Matching Protocol


Abstract
1. Introduction
2. Materials and Methods
2.1. The Dietary Questionnaire for Epidemiological Studies Version 2
2.2. The Australian Dietary Guidelines Database
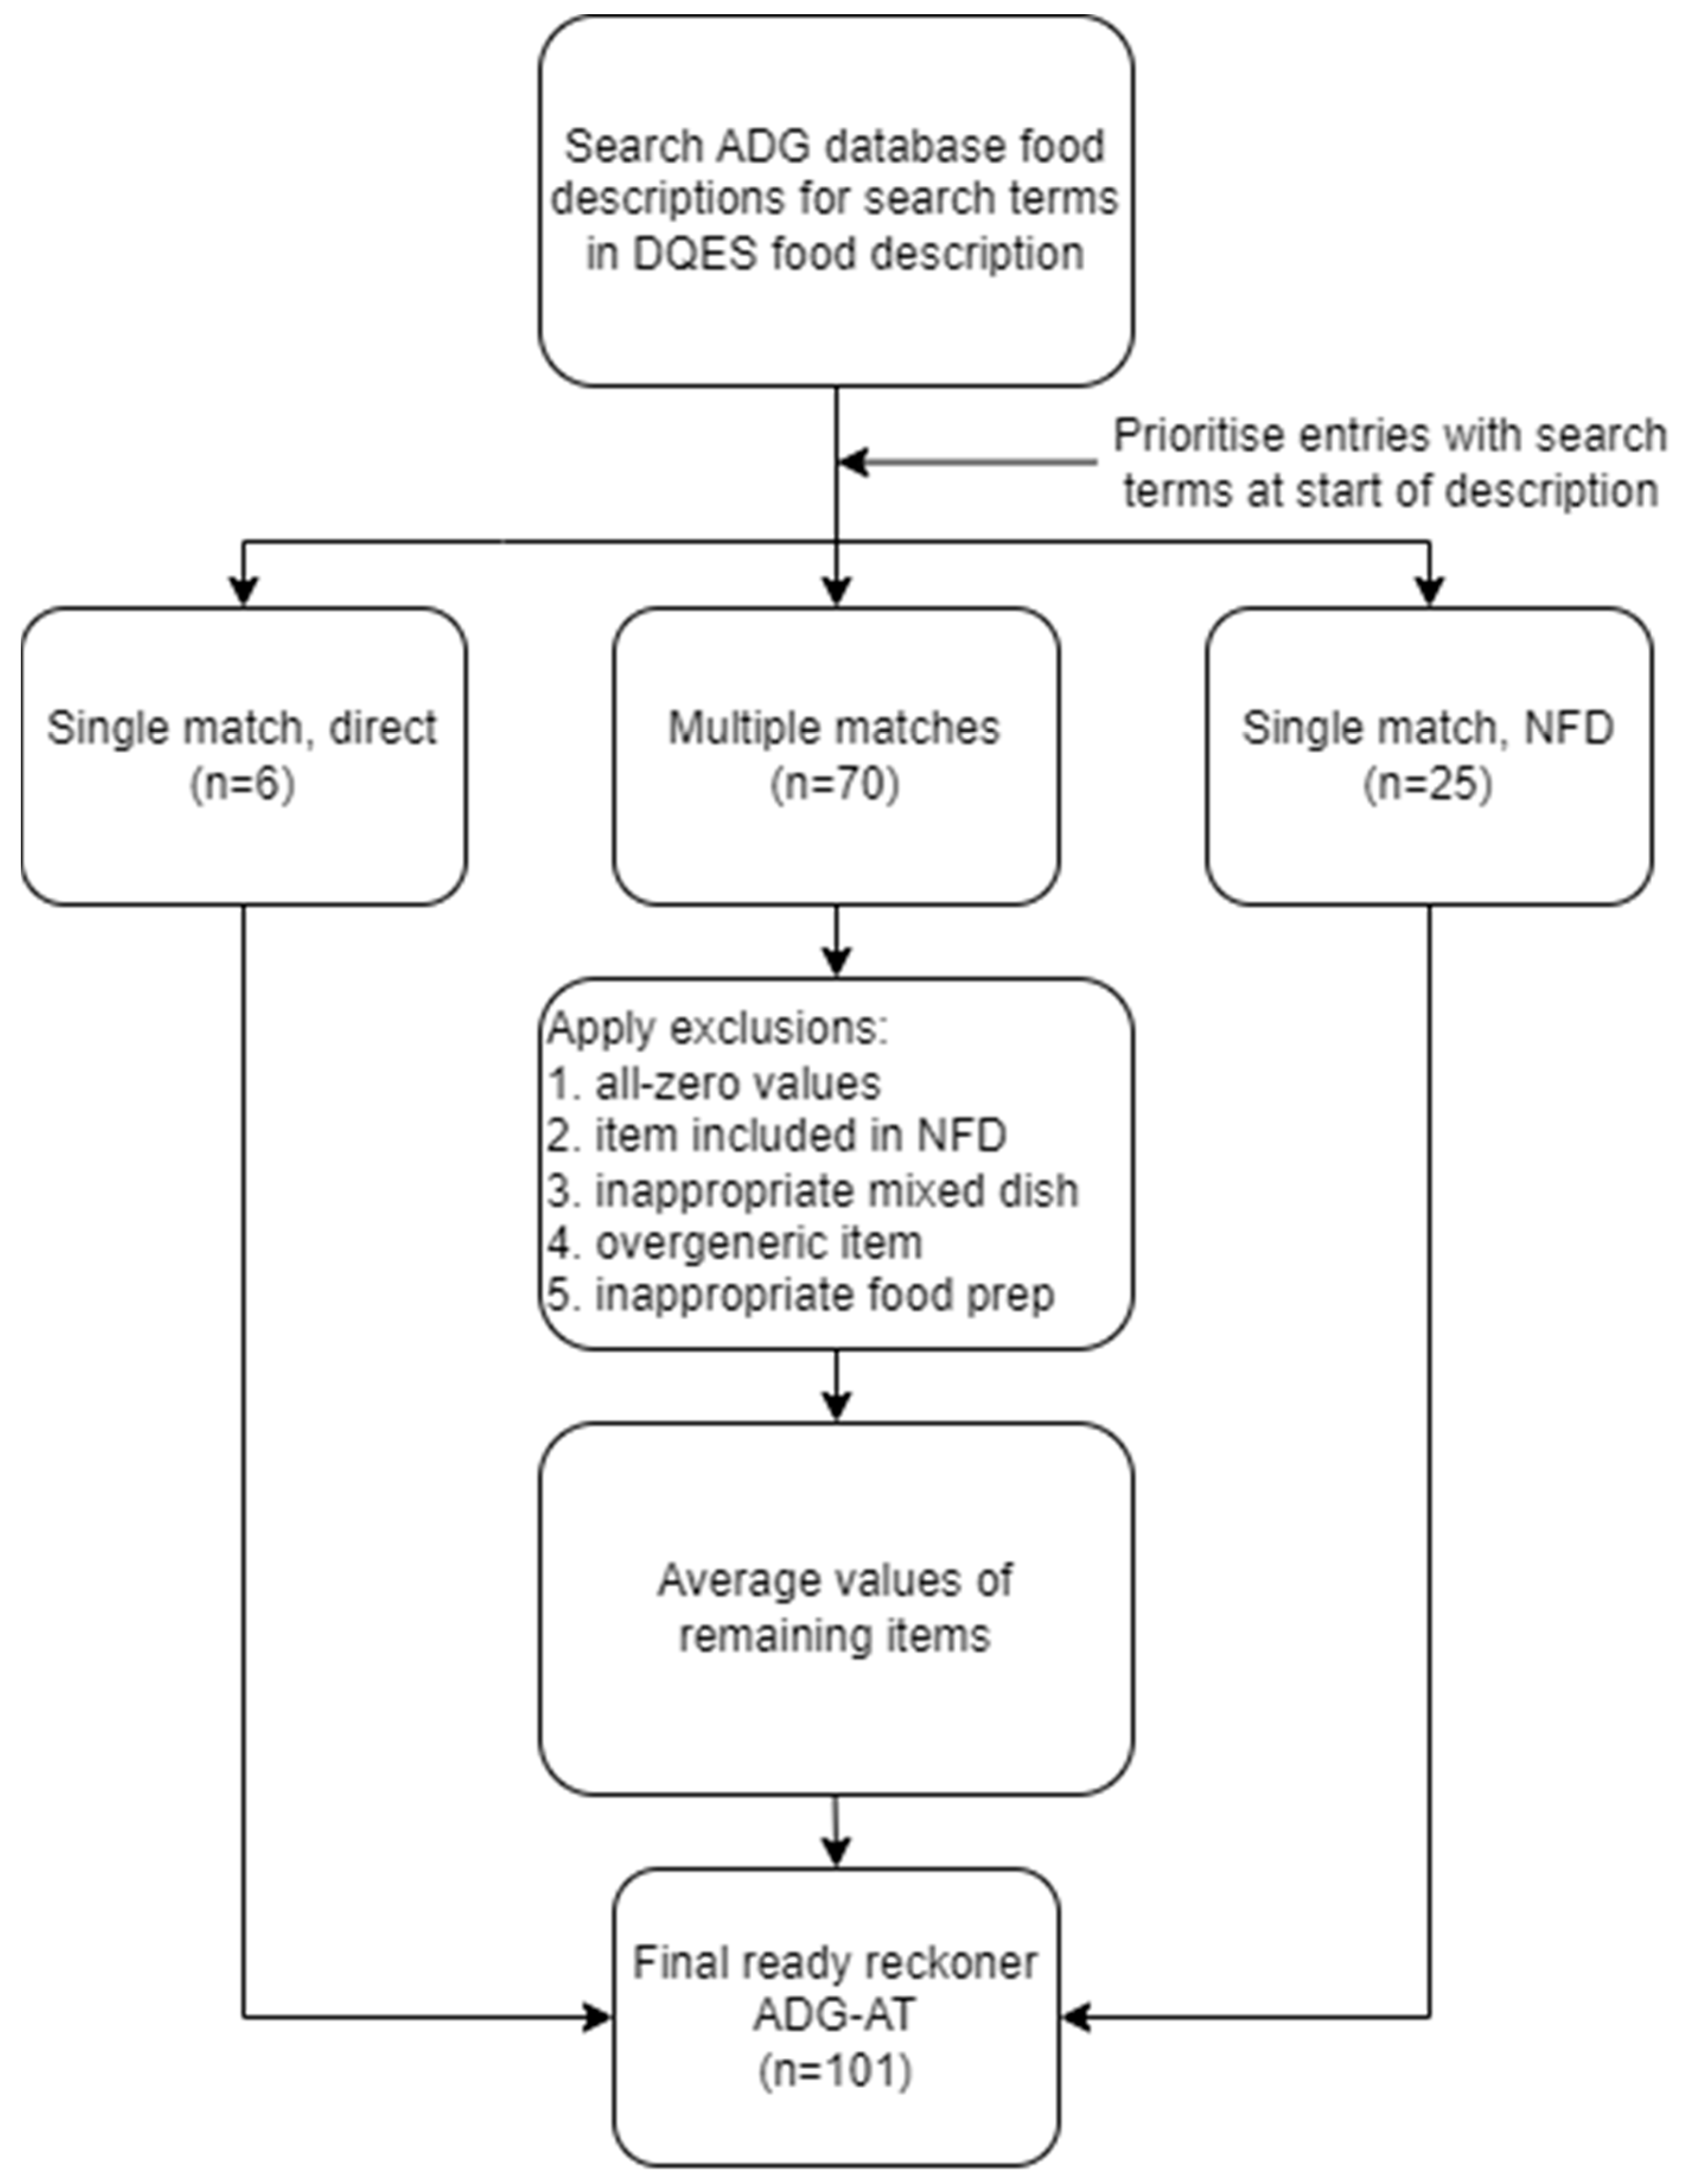
2.3. The Food Matching Method
2.4. Identification and Quantification of Discretionary Foods
3. Results
4. Discussion
5. Conclusions
Supplementary Materials
Author Contributions
Funding
Institutional Review Board Statement
Informed Consent Statement
Data Availability Statement
Conflicts of Interest
References
- Leme, A.C.B.; Hou, S.; Fisberg, R.M.; Fisberg, M.; Haines, J. Adherence to food-based dietary guidelines: A systemic review of high-income and low-and middle-income countries. Nutrients 2021, 13, 1038. [Google Scholar] [CrossRef] [PubMed]
- Shikany, J.M.; White, G.L. Dietary guidelines for chronic disease prevention. South. Med. J. 2000, 93, 1138–1151. [Google Scholar] [CrossRef] [PubMed]
- Australian Bureau of Statistics. Dietary Behaviour; Australian Bureau of Statistics: Canberra, Australia, 2023. Available online: https://www.abs.gov.au/statistics/health/health-conditions-and-risks/dietary-behaviour/2022 (accessed on 12 November 2024).
- Australian Bureau of Statistics. Australian Health Survey: Consumption of Food Groups from the Australian Dietary Guidelines, 2011–2012; Australian Bureau of Statistics: Canberra, Australia, 2018. Available online: https://www.abs.gov.au/ausstats/abs@.nsf/mf/4364.0.55.012 (accessed on 12 November 2024).
- Australian Institute of Health and Welfare. Australian Burden of Disease Study 2022; Australian Institute of Health and Welfare: Bruce, Australia, 2022. Available online: https://www.aihw.gov.au/reports/burden-of-disease/australian-burden-of-disease-study-2022/contents/summary (accessed on 12 November 2024).
- World Health Organisation. Noncommunicable Diseases; World Health Organisation: Geneva, Switzerland, 2023; Available online: https://www.who.int/news-room/fact-sheets/detail/noncommunicable-diseases (accessed on 12 November 2024).
- Grosso, G. Impact of nutritional risk factors on chronic non-communicable diseases. Eur. J. Public Health 2019, 29 (Suppl. S4), ckz185.197. [Google Scholar] [CrossRef]
- National Health and Medical Research Council. Australian Dietary Guidelines; National Health and Medical Research Council: Canberra, Australia, 2013.
- Livingstone, K.M.; Milte, C.M.; Torres, S.J.; Hart, M.J.; Dingle, S.E.; Shaw, J.E.; Magliano, D.J.; McNaughton, S.A. Nineteen-Year Associations between Three Diet Quality Indices and All-Cause and Cardiovascular Disease Mortality: The Australian Diabetes, Obesity, and Lifestyle Study. J. Nutr. 2022, 152, 805–815. [Google Scholar] [CrossRef] [PubMed]
- Nishimura, T.; Murakami, K.; Livingstone, M.B.E.; Sasaki, S.; Uenishi, K. Adherence to the food-based Japanese dietary guidelines in relation to metabolic risk factors in young Japanese women. Br. J. Nutr. 2015, 114, 645–653. [Google Scholar] [CrossRef] [PubMed]
- Yu, D.; Zhang, X.; Xiang, Y.-B.; Yang, G.; Li, H.; Gao, Y.-T.; Zheng, W.; Shu, X.-O. Adherence to dietary guidelines and mortality: A report from prospective cohort studies of 134,000 Chinese adults in urban Shanghai. Am. J. Clin. Nutr. 2014, 100, 693–700. [Google Scholar] [CrossRef] [PubMed]
- Opie, R.S.; Ball, K.; Abbott, G.; Crawford, D.; Teychenne, M.; McNaughton, S.A. Adherence to the Australian dietary guidelines and development of depressive symptoms at 5 years follow-up amongst women in the READI cohort study. Nutr. J. 2020, 19, 30. [Google Scholar] [CrossRef] [PubMed]
- Australian Bureau of Statistics. Australian Health Survey: Users’ Guide, 2011–2013; Australian Bureau of Statistics: Canberra, Australia, 2015. Available online: https://www.abs.gov.au/ausstats/abs@.nsf/lookup/4363.0.55.001chapter65062011-13 (accessed on 12 November 2024).
- Fayet-Moore, F.; Pearson, S. Interpreting the Australian dietary guideline to “limit” into practical and personalised advice. Nutrients 2015, 7, 2026–2043. [Google Scholar] [CrossRef] [PubMed]
- Hlaing-hlaing, H.; Pezdirc, K.; Tavener, M.; James, E.L.; Hure, A. Diet quality indices used in australian and new zealand adults: A systematic review and critical appraisal. Nutrients 2020, 12, 3777. [Google Scholar] [CrossRef] [PubMed]
- Food and Agriculture Organization of the United Nations. Standards and Guidelines; Food and Agriculture Organization of the United Nations: Rome, Italy, 2022; Available online: https://www.fao.org/infoods/infoods/standards-guidelines/en/ (accessed on 12 November 2024).
- Food Standards Australia New Zealand. Assessing the 2011-13 AHS Against the Australian Dietary Guidelines; Food Standards Australia New Zealand: Majura Park, Australia, 2024. Available online: https://www.foodstandards.gov.au/science-data/monitoring-nutrients/ahs-aus-dietary-guidelines (accessed on 12 November 2024).
- Zoszak, K.; Neale, E.; Tapsell, L.; Probst, Y. Exploring dietary changes in an interdisciplinary intervention trial: Application of a dietary guidelines food composition database. J. Hum. Nutr. Diet. 2021, 34, 265–272. [Google Scholar] [CrossRef] [PubMed]
- Australian Nutrient Tables (AUSNUT) 2011-13; Food Standards Australia New Zealand: Majura Park, Australia, 2024. Available online: https://www.foodstandards.gov.au/science-data/food-composition-databases/ausnut (accessed on 12 November 2024).
- Cancer Council Victoria. Dietary Questionnaires—DQES v2. Available online: https://www.cancervic.org.au/research/epidemiology/nutritional_assessment_services1 (accessed on 12 November 2024).
- Ireland, P.; Jolley, D.; Giles, G.; O’Dea, K.; Powles, J.; Rutishauser, I.; Wahlqvist, M.L.; Williams, J. Development of the Melbourne FFQ: A food frequency questionnaire for use in an Australian prospective study involving an ethnically diverse cohort. Asia Pac. J. Clin. Nutr. 1994, 3, 19–31. [Google Scholar] [PubMed]
- Cancer Council Victoria. Dietary Questionnaire for Epidemiological Studies Version 2 (DQES v2)—User Guide; Cancer Council Victoria: Melbourne, Australia, 2017. [Google Scholar]
- Hebden, L.; Kostan, E.; O’Leary, F.; Hodge, A.; Allman-Farinelli, M.; Kirk, M. Validity and Reproducibility of a Food Frequency Questionnaire as a Measure of Recent Dietary Intake in Young Adults. PLoS ONE 2013, 8, e75156. [Google Scholar] [CrossRef] [PubMed]
- Hodge, A.; Patterson, A.J.; Brown, W.J.; Ireland, P.; Giles, G. The Anti Cancer Council of Victoria FFQ: Relative validity of nutrient intakes compared with weighed food records in young to middle-aged women in a study of iron supplementation. Aust. N. Z. J. Public Health 2000, 24, 576–583. [Google Scholar] [CrossRef] [PubMed]
- Food and Agriculture Organization of the United States. FAO/INFOODS Guidelines for Food Matching; Food and Agriculture Organization of the United Nations: Rome, Italy, 2012. [Google Scholar]
- Australian Nutrient Tables (AUSNUT) 2011-13; Food Retention Factor File. Food Standards Australia New Zealand: Majura Park, Australia, 2014. Available online: https://www.foodstandards.gov.au/science-data/food-composition-databases/ausnut/ausnutdatafiles/foodretention (accessed on 27 February 2025).
- Neale, E.P.; Probst, Y.C.; Tapsell, L.C. Development of a matching file of Australian food composition databases (AUSNUT 2007 to 2011–13). J. Food Compos. Anal. 2016, 50, 30–35. [Google Scholar] [CrossRef]
- Gopinath, B.P.; Russell, J.M.P.H.; Flood, V.M.P.M.P.H.; Burlutsky, G.M.; Mitchell, P.M.D.P. Adherence to Dietary Guidelines Positively Affects Quality of Life and Functional Status of Older Adults. J. Acad. Nutr. Diet. 2014, 114, 220–229. [Google Scholar] [CrossRef] [PubMed]
- Saul, A.; Taylor, B.V.; Blizzard, L.; Simpson-Yap, S.; Oddy, W.H.; Probst, Y.C.; Black, L.J.; Ponsonby, A.L.; Broadley, S.A.; Lechner-Scott, J.; et al. Associations between diet quality and depression, anxiety, and fatigue in multiple sclerosis. Mult. Scler. Relat. Disord. 2022, 63, 103910. [Google Scholar] [CrossRef] [PubMed]
- Australian Institute of Health and Welfare. Diet; Australian Australian Institute of Health and Welfare: Bruce, Australia, 2024. Available online: https://www.aihw.gov.au/reports/australias-health/diet (accessed on 12 November 2024).
- U.S. Department of Agriculture. Dietary Guidelines for Americans 2020–2025; U.S. Department of Agriculture: Washington, DC, USA, 2020.
- Liese, A.D.; Neuhouser, M.; Boushey, C.J. Comparisons of Four Diet Quality Indexes to Define Single Meal Healthfulness. J. Acad. Nutr. Diet. 2022, 122, 2013. [Google Scholar] [CrossRef] [PubMed]
- Shinozaki, N.; Yuan, X.; Murakami, K.; Sasaki, S. Development, validation and utilisation of dish-based dietary assessment tools: A scoping review. Public Health Nutr. 2021, 24, 223–242. [Google Scholar] [CrossRef] [PubMed]

| Guideline 1 | To achieve and maintain a healthy weight, be physically active and choose amounts of nutritious food and drinks to meet your energy needs. |
| Guideline 2 | Enjoy a wide variety of nutritious foods from these five food groups every day:
|
| Guideline 3 | Limit intake of foods containing saturated fat, added salt, added sugars and alcohol. |
| Guideline 4 | Encourage support and promote breastfeeding. |
| Guideline 5 | Care for your food; prepare and store it safely. |
| Exclusion Criteria | DQES Example |
|---|---|
| Food items with all values equal to zero | “Beef, all cuts, separable fat, grilled or roasted without fat” |
| Food items not in their ‘typically consumed’ form | “Chicken, breast, flesh, raw” |
| Food items in mixed dishes where a single food is implied by DQES e.g., “Capsicum” | “Capsicum, stuffed with meat & rice” |
| Food items with general descriptions when the DQES description is specific e.g., “Wholemeal bread” | “Bread, commercial, fresh, not further defined” |
| Inappropriate food form | Raw animal proteins and starchy vegetables |
| Recommendation | DQES Foods |
|---|---|
| Limit saturated fat | Bacon, biscuits, butter, cakes, chips, chocolate, crisps, deli meats, hamburgers, ice cream, pies, pizza, sausages |
| Limit added salt | Bacon, chips, crisps, deli meats, pies, pizza, sausages, Vegemite |
| Limit added sugar | Biscuits, cakes/pastries, chocolate, ice cream, jam, sugar |
| Limit alcohol | Beer, fortified wine, liqueurs, spirits, wine |
| Servings/100 g | ||||||||
|---|---|---|---|---|---|---|---|---|
| DQES Food Name | Form | Method | Grains | Vegetables/Legumes | Fruit | Dairy/ Alternatives | Meat/ Alternatives | Discretionary |
| All Bran | processed | not further defined | 3.3 | 0.0 | 0.0 | 0.0 | 0.0 | 0.0 |
| Apples | raw | not further defined | 0.0 | 0.0 | 0.7 | 0.0 | 0.0 | 0.0 |
| Apricots | raw | single | 0.0 | 0.0 | 0.7 | 0.0 | 0.0 | 0.0 |
| Avocado | raw | average | 0.0 | 1.3 | 0.0 | 0.0 | 0.0 | 0.0 |
| Bacon | cooked | average | 0.0 | 0.0 | 0.0 | 0.0 | 1.4 | 1.9 |
| Baked beans | processed | not further defined | 0.0 | 1.3 | 0.0 | 0.0 | 0.7 | 0.0 |
| Bananas | raw | average | 0.0 | 0.0 | 0.7 | 0.0 | 0.0 | 0.0 |
| Bean sprouts, alfalfa sprouts | raw/cooked | average | 0.0 | 1.4 | 0.0 | 0.0 | 0.0 | 0.0 |
| Beef | cooked | average | 0.0 | 0.0 | 0.0 | 0.0 | 1.5 | 0.0 |
| Beer—full strength | processed | average | 0.0 | 0.0 | 0.0 | 0.0 | 0.0 | 0.3 |
| Beer—low alcohol | processed | average | 0.0 | 0.0 | 0.0 | 0.0 | 0.0 | 0.2 |
| Beetroot | raw/cooked | average | 0.0 | 1.2 | 0.0 | 0.0 | 0.0 | 0.0 |
| Bread—high fibre white | processed | average | 2.7 | 0.0 | 0.0 | 0.0 | 0.0 | 0.0 |
| Bread—multi-grain | processed | average | 2.7 | 0.0 | 0.0 | 0.0 | 0.0 | 0.0 |
| Bread—rye | processed | average | 2.7 | 0.0 | 0.0 | 0.0 | 0.0 | 0.0 |
| Bread—white | processed | average | 2.7 | 0.0 | 0.0 | 0.0 | 0.0 | 0.0 |
| Bread—wholemeal | processed | average | 2.7 | 0.0 | 0.0 | 0.0 | 0.0 | 0.0 |
| Broccoli | raw/cooked | average | 0.0 | 1.3 | 0.0 | 0.0 | 0.0 | 0.0 |
| Butter | processed | not further defined | 0.0 | 0.0 | 0.0 | 0.0 | 0.0 | 5.0 |
| Cabbage, Brussels sprouts | raw/cooked | average | 0.0 | 1.3 | 0.0 | 0.0 | 0.0 | 0.0 |
| Cakes, sweet pies, tarts, other sweet pastries | cooked | average | 0.9 | 0.0 | 0.2 | 0.1 | 0.1 | 2.3 |
| Carrots | raw/cooked | average | 0.0 | 1.3 | 0.0 | 0.0 | 0.0 | 0.0 |
| Cauliflower | raw/cooked | average | 0.0 | 1.2 | 0.0 | 0.0 | 0.0 | 0.0 |
| Celery | raw/cooked | average | 0.0 | 1.2 | 0.0 | 0.0 | 0.0 | 0.0 |
| Cheese—cream | processed | not further defined | 0.0 | 0.0 | 0.0 | 2.5 | 0.0 | 0.0 |
| Cheese—firm (cheddar, edam) | processed | average | 0.0 | 0.0 | 0.0 | 2.5 | 0.0 | 0.0 |
| Cheese—hard (parmesan, romano) | processed | average | 0.0 | 0.0 | 0.0 | 2.5 | 0.0 | 0.0 |
| Cheese—low fat | processed | single | 0.0 | 0.0 | 0.0 | 2.5 | 0.0 | 0.0 |
| Cheese—ricotta, cottage | processed | average | 0.0 | 0.0 | 0.0 | 0.8 | 0.0 | 0.0 |
| Cheese—soft (camembert, brie) | processed | not further defined | 0.0 | 0.0 | 0.0 | 2.5 | 0.0 | 0.0 |
| Chicken | cooked | average | 0.2 | 0.0 | 0.0 | 0.0 | 1.1 | 0.0 |
| Chocolate | processed | not further defined | 0.0 | 0.0 | 0.0 | 0.8 | 0.0 | 3.5 |
| Corn chips, potato crisps, Twisties | processed | average | 2.2 | 0.7 | 0.0 | 0.1 | 0.0 | 3.5 |
| Corned beef, luncheon meats, salami | processed | average | 0.0 | 0.0 | 0.0 | 0.0 | 1.4 | 1.5 |
| Cornflakes, Nutrigrain, Special K | processed | average | 3.3 | 0.0 | 0.0 | 0.0 | 0.0 | 0.0 |
| Crackers, crispbreads, dry biscuits | processed | not further defined | 2.9 | 0.0 | 0.0 | 0.0 | 0.0 | 0.0 |
| Cucumber | raw/cooked | average | 0.0 | 1.3 | 0.0 | 0.0 | 0.0 | 0.0 |
| Eggs | cooked | average | 0.0 | 0.0 | 0.0 | 0.0 | 0.8 | 0.0 |
| Fish—fried (including take-away) | cooked | average | 0.0 | 0.0 | 0.0 | 0.0 | 1.0 | 0.0 |
| Fish—steamed, grilled, baked | cooked | average | 0.0 | 0.0 | 0.0 | 0.0 | 1.0 | 0.0 |
| Fish—tinned (salmon, tuna, sardines) | processed | average | 0.0 | 0.0 | 0.0 | 0.0 | 0.9 | 0.0 |
| Flavoured milk drink (cocoa, Milo) | processed | average | 0.0 | 0.0 | 0.0 | 0.3 | 0.0 | 0.0 |
| Fortified wines (port, sherry) | processed | average | 0.0 | 0.0 | 0.0 | 0.0 | 0.0 | 0.9 |
| Fruit—tinned, frozen | processed | average | 0.0 | 0.0 | 0.6 | 0.0 | 0.0 | 0.0 |
| Fruit juice | processed | not further defined | 0.0 | 0.0 | 0.8 | 0.0 | 0.0 | 0.0 |
| Garlic | raw/cooked | average | 0.0 | 1.5 | 0.0 | 0.0 | 0.0 | 0.0 |
| Green beans | raw/cooked | average | 0.0 | 1.3 | 0.0 | 0.0 | 0.0 | 0.0 |
| Ham | processed | average | 0.0 | 0.0 | 0.0 | 0.0 | 1.5 | 0.8 |
| Hamburger with bun | mixed | average | 0.9 | 0.2 | 0.0 | 0.2 | 0.5 | 1.7 |
| Ice cream | processed | not further defined | 0.0 | 0.0 | 0.0 | 0.5 | 0.0 | 1.3 |
| Jam, marmalade, honey, syrups | processed | average | 0.0 | 0.0 | 0.2 | 0.0 | 0.0 | 1.6 |
| Lamb | cooked | average | 0.0 | 0.0 | 0.0 | 0.0 | 1.5 | 0.0 |
| Lettuce, endive, other salad greens | raw/cooked | average | 0.0 | 1.5 | 0.0 | 0.0 | 0.0 | 0.0 |
| Mango, paw paw | raw | single | 0.0 | 0.0 | 0.7 | 0.0 | 0.0 | 0.0 |
| Meat pies, pasties, quiche, other savoury pastries | cooked | average | 0.7 | 0.3 | 0.0 | 0.1 | 0.3 | 1.7 |
| Milk—full cream | processed | not further defined | 0.0 | 0.0 | 0.0 | 0.4 | 0.0 | 0.0 |
| Milk—reduced fat | processed | not further defined | 0.0 | 0.0 | 0.0 | 0.4 | 0.0 | 0.0 |
| Milk—skim | processed | not further defined | 0.0 | 0.0 | 0.0 | 0.4 | 0.0 | 0.0 |
| Milk—soya | processed | not further defined | 0.0 | 0.0 | 0.0 | 0.4 | 0.0 | 0.0 |
| Muesli | processed | average | 2.3 | 0.0 | 0.5 | 0.0 | 0.4 | 0.0 |
| Mushrooms | raw/cooked | average | 0.0 | 1.2 | 0.0 | 0.0 | 0.0 | 0.0 |
| Nuts | processed | average | 0.0 | 0.0 | 0.0 | 0.0 | 3.3 | 0.0 |
| Onion, leeks | raw/cooked | average | 0.0 | 1.1 | 0.0 | 0.0 | 0.0 | 0.0 |
| Oranges, other citrus | raw | average | 0.0 | 0.0 | 0.7 | 0.0 | 0.0 | 0.0 |
| Other beans (chick peas, lentils) | cooked | average | 0.0 | 1.3 | 0.0 | 0.0 | 0.6 | 0.0 |
| Pasta or noodles (including lasagne) | cooked | average | 1.3 | 0.0 | 0.0 | 0.0 | 0.0 | 0.0 |
| Peaches, nectarines | raw | average | 0.0 | 0.0 | 0.7 | 0.0 | 0.0 | 0.0 |
| Peanut butter, peanut paste | processed | not further defined | 0.0 | 0.0 | 0.0 | 0.0 | 2.9 | 0.0 |
| Pears | Raw | not further defined | 0.0 | 0.0 | 0.7 | 0.0 | 0.0 | 0.0 |
| Peas | cooked | average | 0.0 | 1.3 | 0.0 | 0.0 | 0.1 | 0.0 |
| Peppers (capsicum) | raw/cooked | average | 0.0 | 1.3 | 0.0 | 0.0 | 0.0 | 0.0 |
| Pineapple | raw | single | 0.0 | 0.0 | 0.7 | 0.0 | 0.0 | 0.0 |
| Pizza | cooked | average | 1.4 | 0.3 | 0.0 | 0.5 | 0.2 | 1.8 |
| Pork | cooked | average | 0.0 | 0.0 | 0.0 | 0.0 | 1.5 | 0.0 |
| Porridge | cooked | average | 0.8 | 0.0 | 0.0 | 0.3 | 0.0 | 0.0 |
| Potatoes—cooked without fat | cooked | average | 0.0 | 1.3 | 0.0 | 0.0 | 0.0 | 0.0 |
| Potatoes—roasted, fried (including hot chips) | cooked | average | 0.1 | 1.3 | 0.0 | 0.0 | 0.0 | 1.6 |
| Pumpkin | cooked | average | 0.0 | 1.3 | 0.0 | 0.0 | 0.0 | 0.0 |
| Red wine | processed | single | 0.0 | 0.0 | 0.0 | 0.0 | 0.0 | 0.5 |
| Rice | cooked | average | 1.4 | 0.0 | 0.0 | 0.0 | 0.0 | 0.0 |
| Sausages, frankfurters | cooked | average | 0.0 | 0.0 | 0.0 | 0.0 | 1.2 | 1.6 |
| Silverbeet, spinach | raw/cooked | average | 0.0 | 1.3 | 0.0 | 0.0 | 0.0 | 0.0 |
| Soy beans, soy bean curd, tofu | processed | average | 0.0 | 0.3 | 0.0 | 0.0 | 0.5 | 0.0 |
| Spirits, liqueurs | processed | average | 0.0 | 0.0 | 0.0 | 0.1 | 0.0 | 1.8 |
| Spread—butter and margarine blend | processed | not further defined | 0.0 | 0.0 | 0.0 | 0.0 | 0.0 | 4.4 |
| Spread—margarine | processed | average | 0.0 | 0.0 | 0.0 | 0.0 | 0.0 | 0.0 |
| Spread—monounsaturated margarine | processed | not further defined | 0.0 | 0.0 | 0.0 | 0.0 | 0.0 | 0.0 |
| Spread—polyunsaturated margarine | processed | not further defined | 0.0 | 0.0 | 0.0 | 0.0 | 0.0 | 0.0 |
| Strawberries | raw | single | 0.0 | 0.0 | 0.7 | 0.0 | 0.0 | 0.0 |
| Sugar | processed | average | 0.0 | 0.0 | 0.0 | 0.0 | 0.0 | 2.7 |
| Sultana Bran, FibrePlus, Branflakes | processed | average | 2.6 | 0.0 | 0.3 | 0.0 | 0.1 | 0.0 |
| Sweet biscuits | processed | not further defined | 1.6 | 0.0 | 0.0 | 0.1 | 0.0 | 3.3 |
| Tomato sauce, tomato paste, dried tomatoes | processed | average | 0.0 | 2.3 | 0.0 | 0.0 | 0.0 | 0.0 |
| Tomatoes—fresh, tinned | raw/cooked | average | 0.0 | 1.4 | 0.0 | 0.0 | 0.0 | 0.0 |
| Veal | cooked | average | 0.1 | 0.0 | 0.0 | 0.0 | 1.5 | 0.0 |
| Vegemite, Marmite, Promite | processed | not further defined | 0.0 | 0.0 | 0.0 | 0.0 | 0.0 | 1.1 |
| Watermelon, rockmelon (cantaloupe), honeydew | raw | not further defined | 0.0 | 0.0 | 0.7 | 0.0 | 0.0 | 0.0 |
| Weet Bix, Vita Brits, Weeties | processed | not further defined | 3.3 | 0.0 | 0.0 | 0.0 | 0.0 | 0.0 |
| White wine (including sparkling) | processed | not further defined | 0.0 | 0.0 | 0.0 | 0.0 | 0.0 | 0.5 |
| Yoghurt | processed | not further defined | 0.0 | 0.0 | 0.0 | 0.5 | 0.0 | 0.0 |
| Zucchini | raw/cooked | average | 0.0 | 1.2 | 0.0 | 0.0 | 0.0 | 0.0 |
Disclaimer/Publisher’s Note: The statements, opinions and data contained in all publications are solely those of the individual author(s) and contributor(s) and not of MDPI and/or the editor(s). MDPI and/or the editor(s) disclaim responsibility for any injury to people or property resulting from any ideas, methods, instructions or products referred to in the content. |
© 2025 by the authors. Licensee MDPI, Basel, Switzerland. This article is an open access article distributed under the terms and conditions of the Creative Commons Attribution (CC BY) license (https://creativecommons.org/licenses/by/4.0/).
Share and Cite
Piscioneri, R.; Zoszak, K.; Probst, Y. Development of the Australian Dietary Guidelines Adherence Tool (ADG-AT): A Food Matching Protocol. Nutrients 2025, 17, 1071. https://doi.org/10.3390/nu17061071
Piscioneri R, Zoszak K, Probst Y. Development of the Australian Dietary Guidelines Adherence Tool (ADG-AT): A Food Matching Protocol. Nutrients. 2025; 17(6):1071. https://doi.org/10.3390/nu17061071
Chicago/Turabian StylePiscioneri, Rosa, Karen Zoszak, and Yasmine Probst. 2025. "Development of the Australian Dietary Guidelines Adherence Tool (ADG-AT): A Food Matching Protocol" Nutrients 17, no. 6: 1071. https://doi.org/10.3390/nu17061071
APA StylePiscioneri, R., Zoszak, K., & Probst, Y. (2025). Development of the Australian Dietary Guidelines Adherence Tool (ADG-AT): A Food Matching Protocol. Nutrients, 17(6), 1071. https://doi.org/10.3390/nu17061071