
The Double Burden of Malnutrition in the Brazilian Legal Amazon: Spatial Distributions and Temporal Trends (2013–2023)

 , , , ,
Abstract
1. Introduction
2. Materials and Methods
3. Results
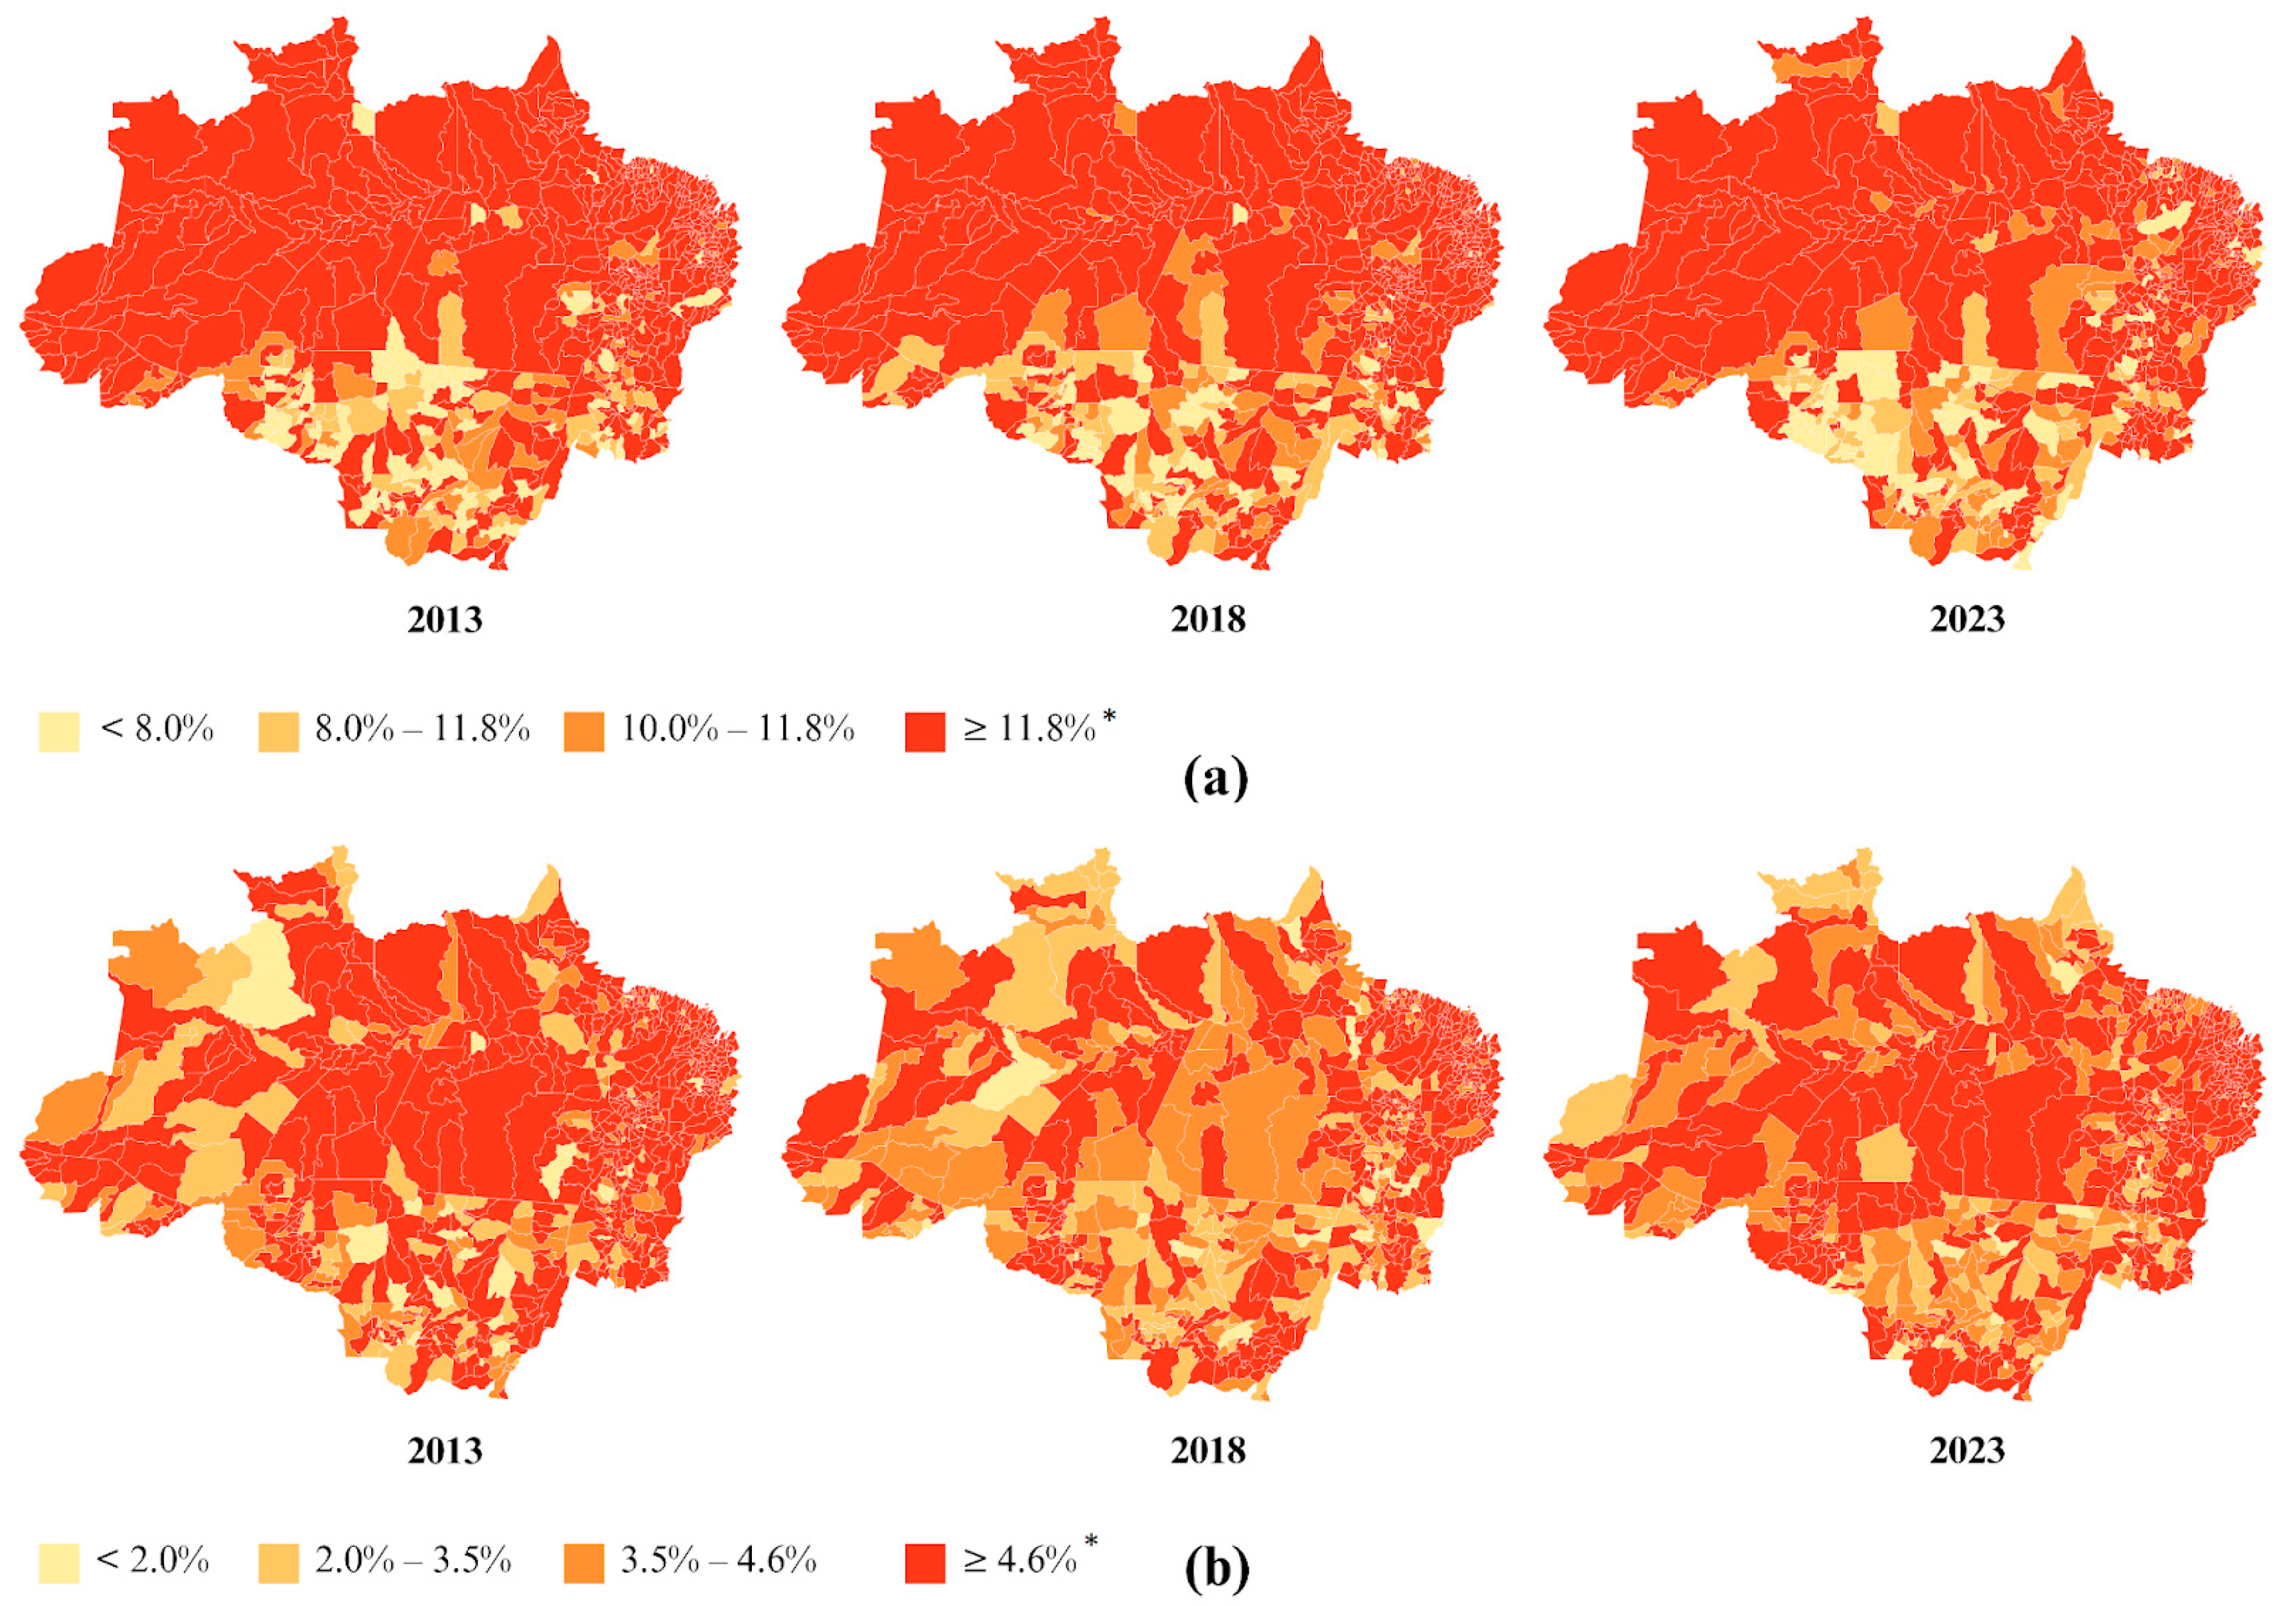
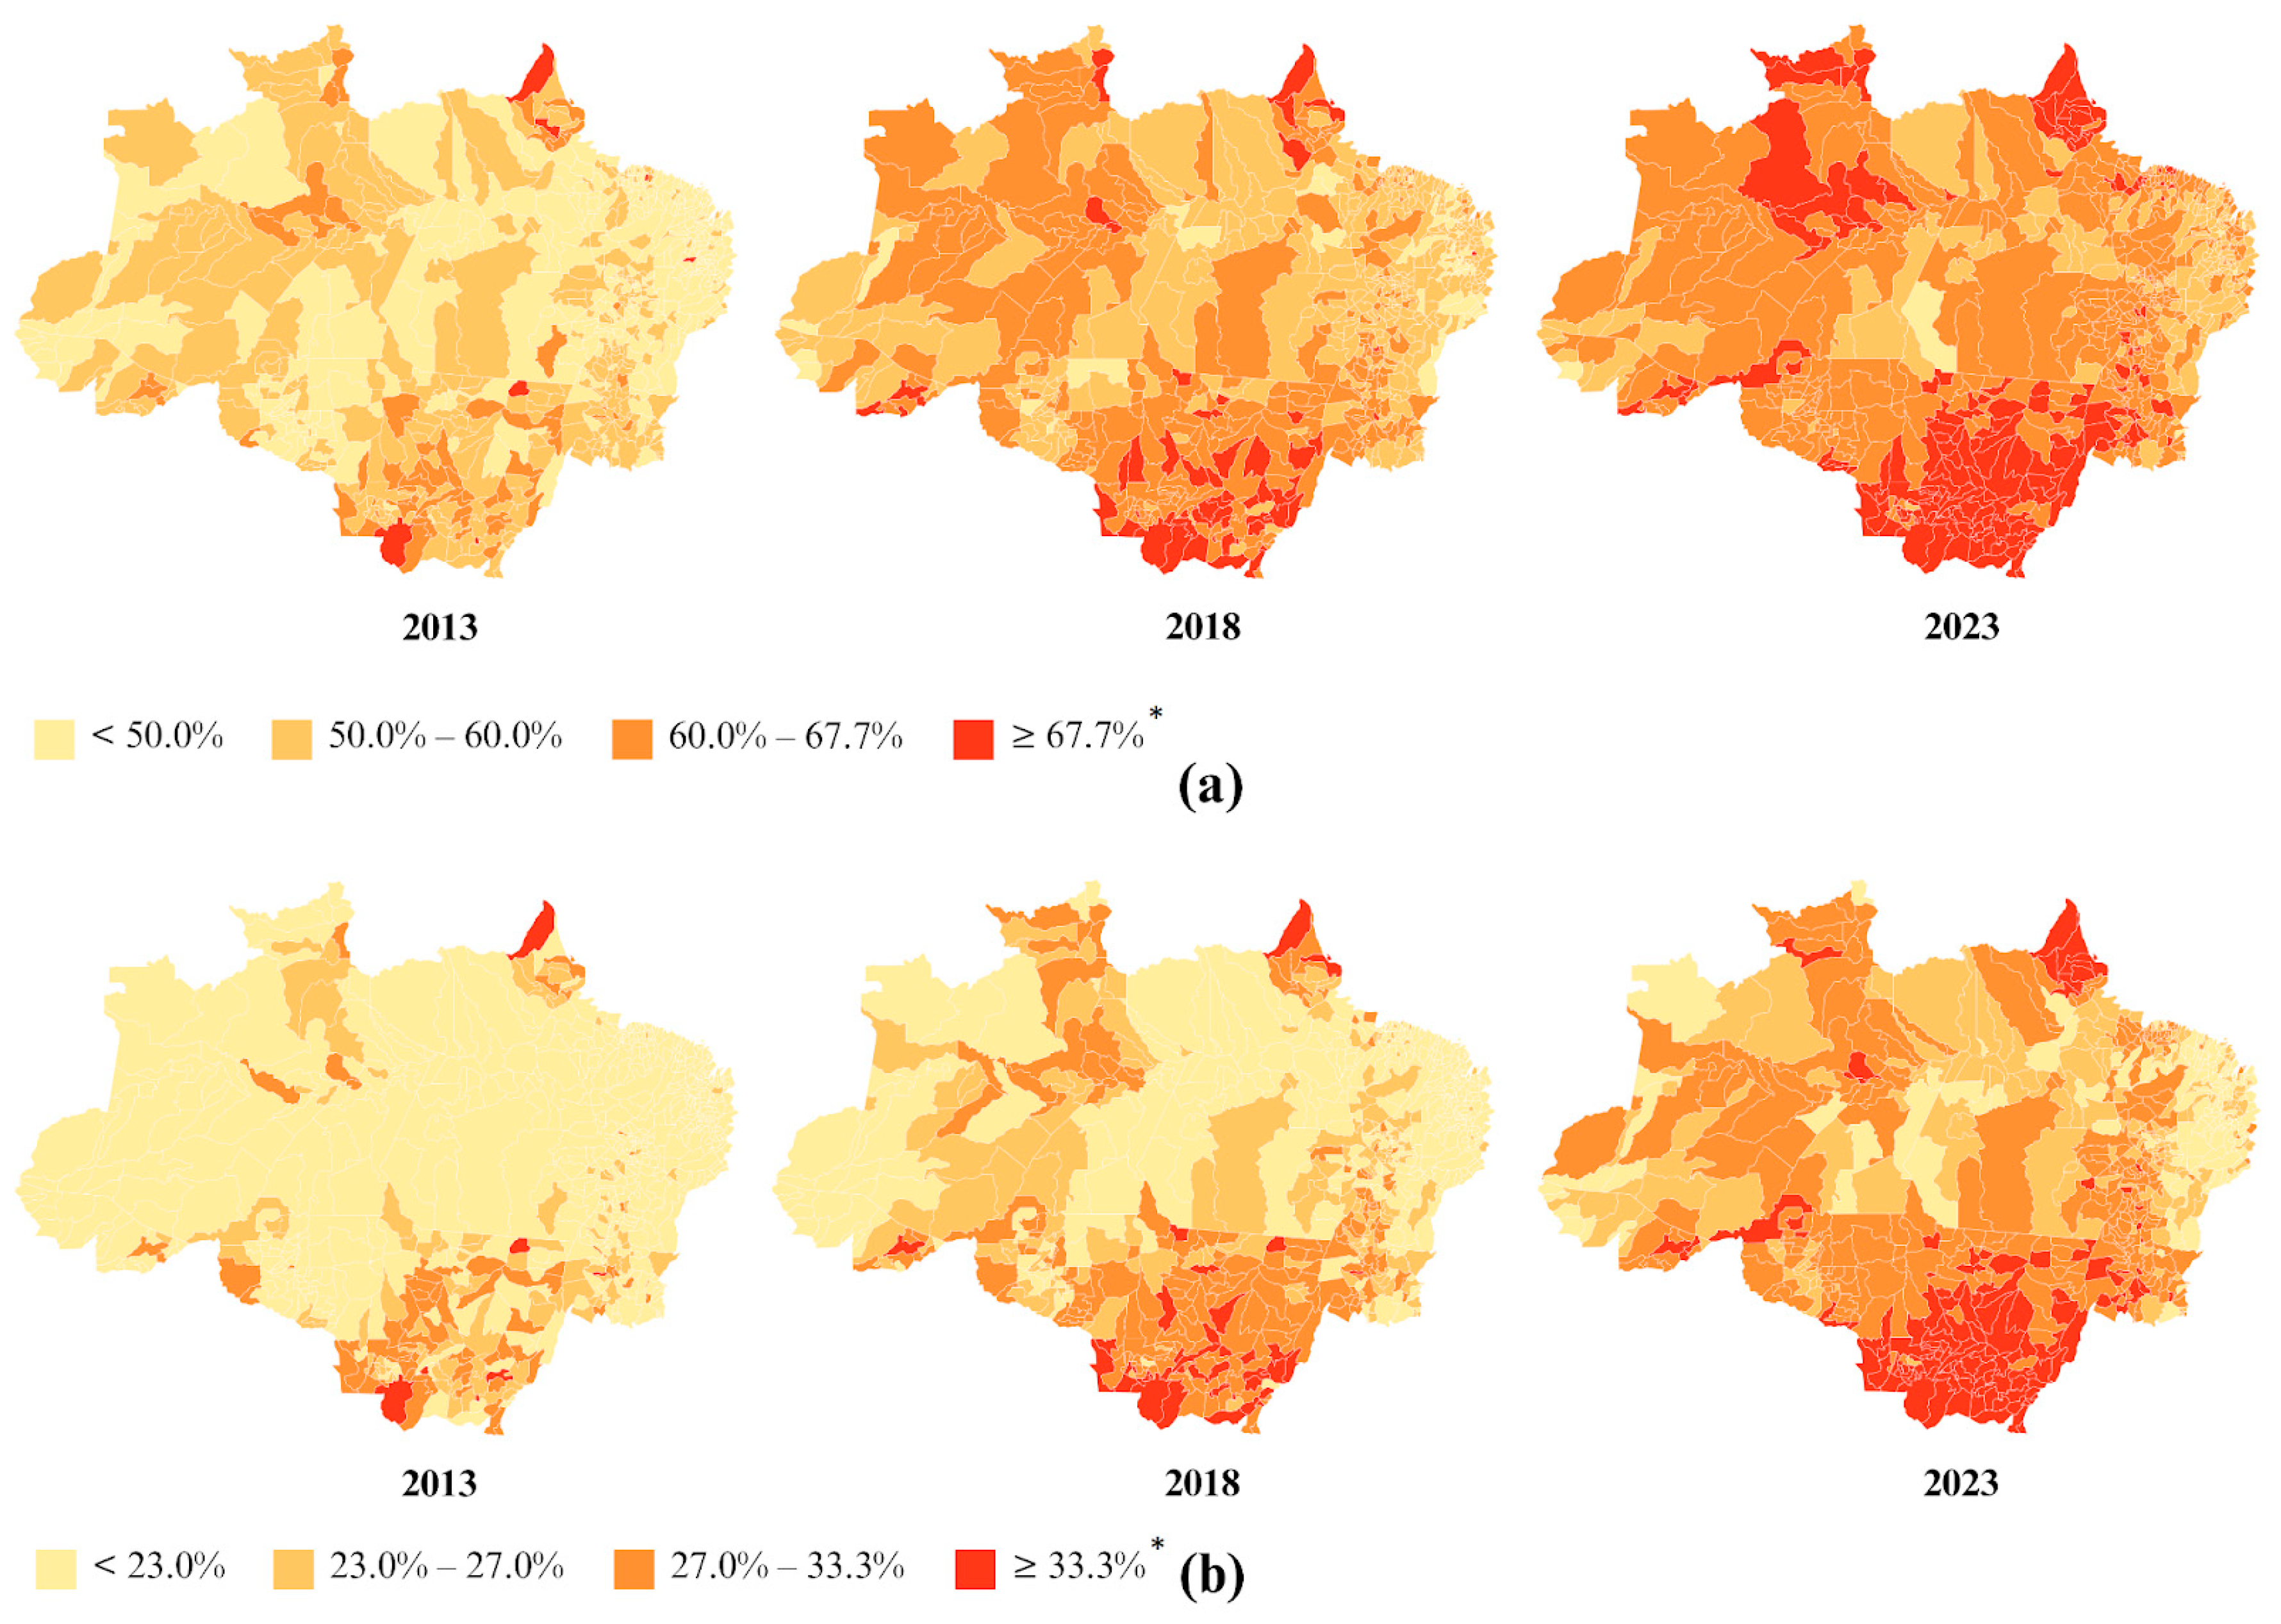
3.1. Children Under Five Years of Age
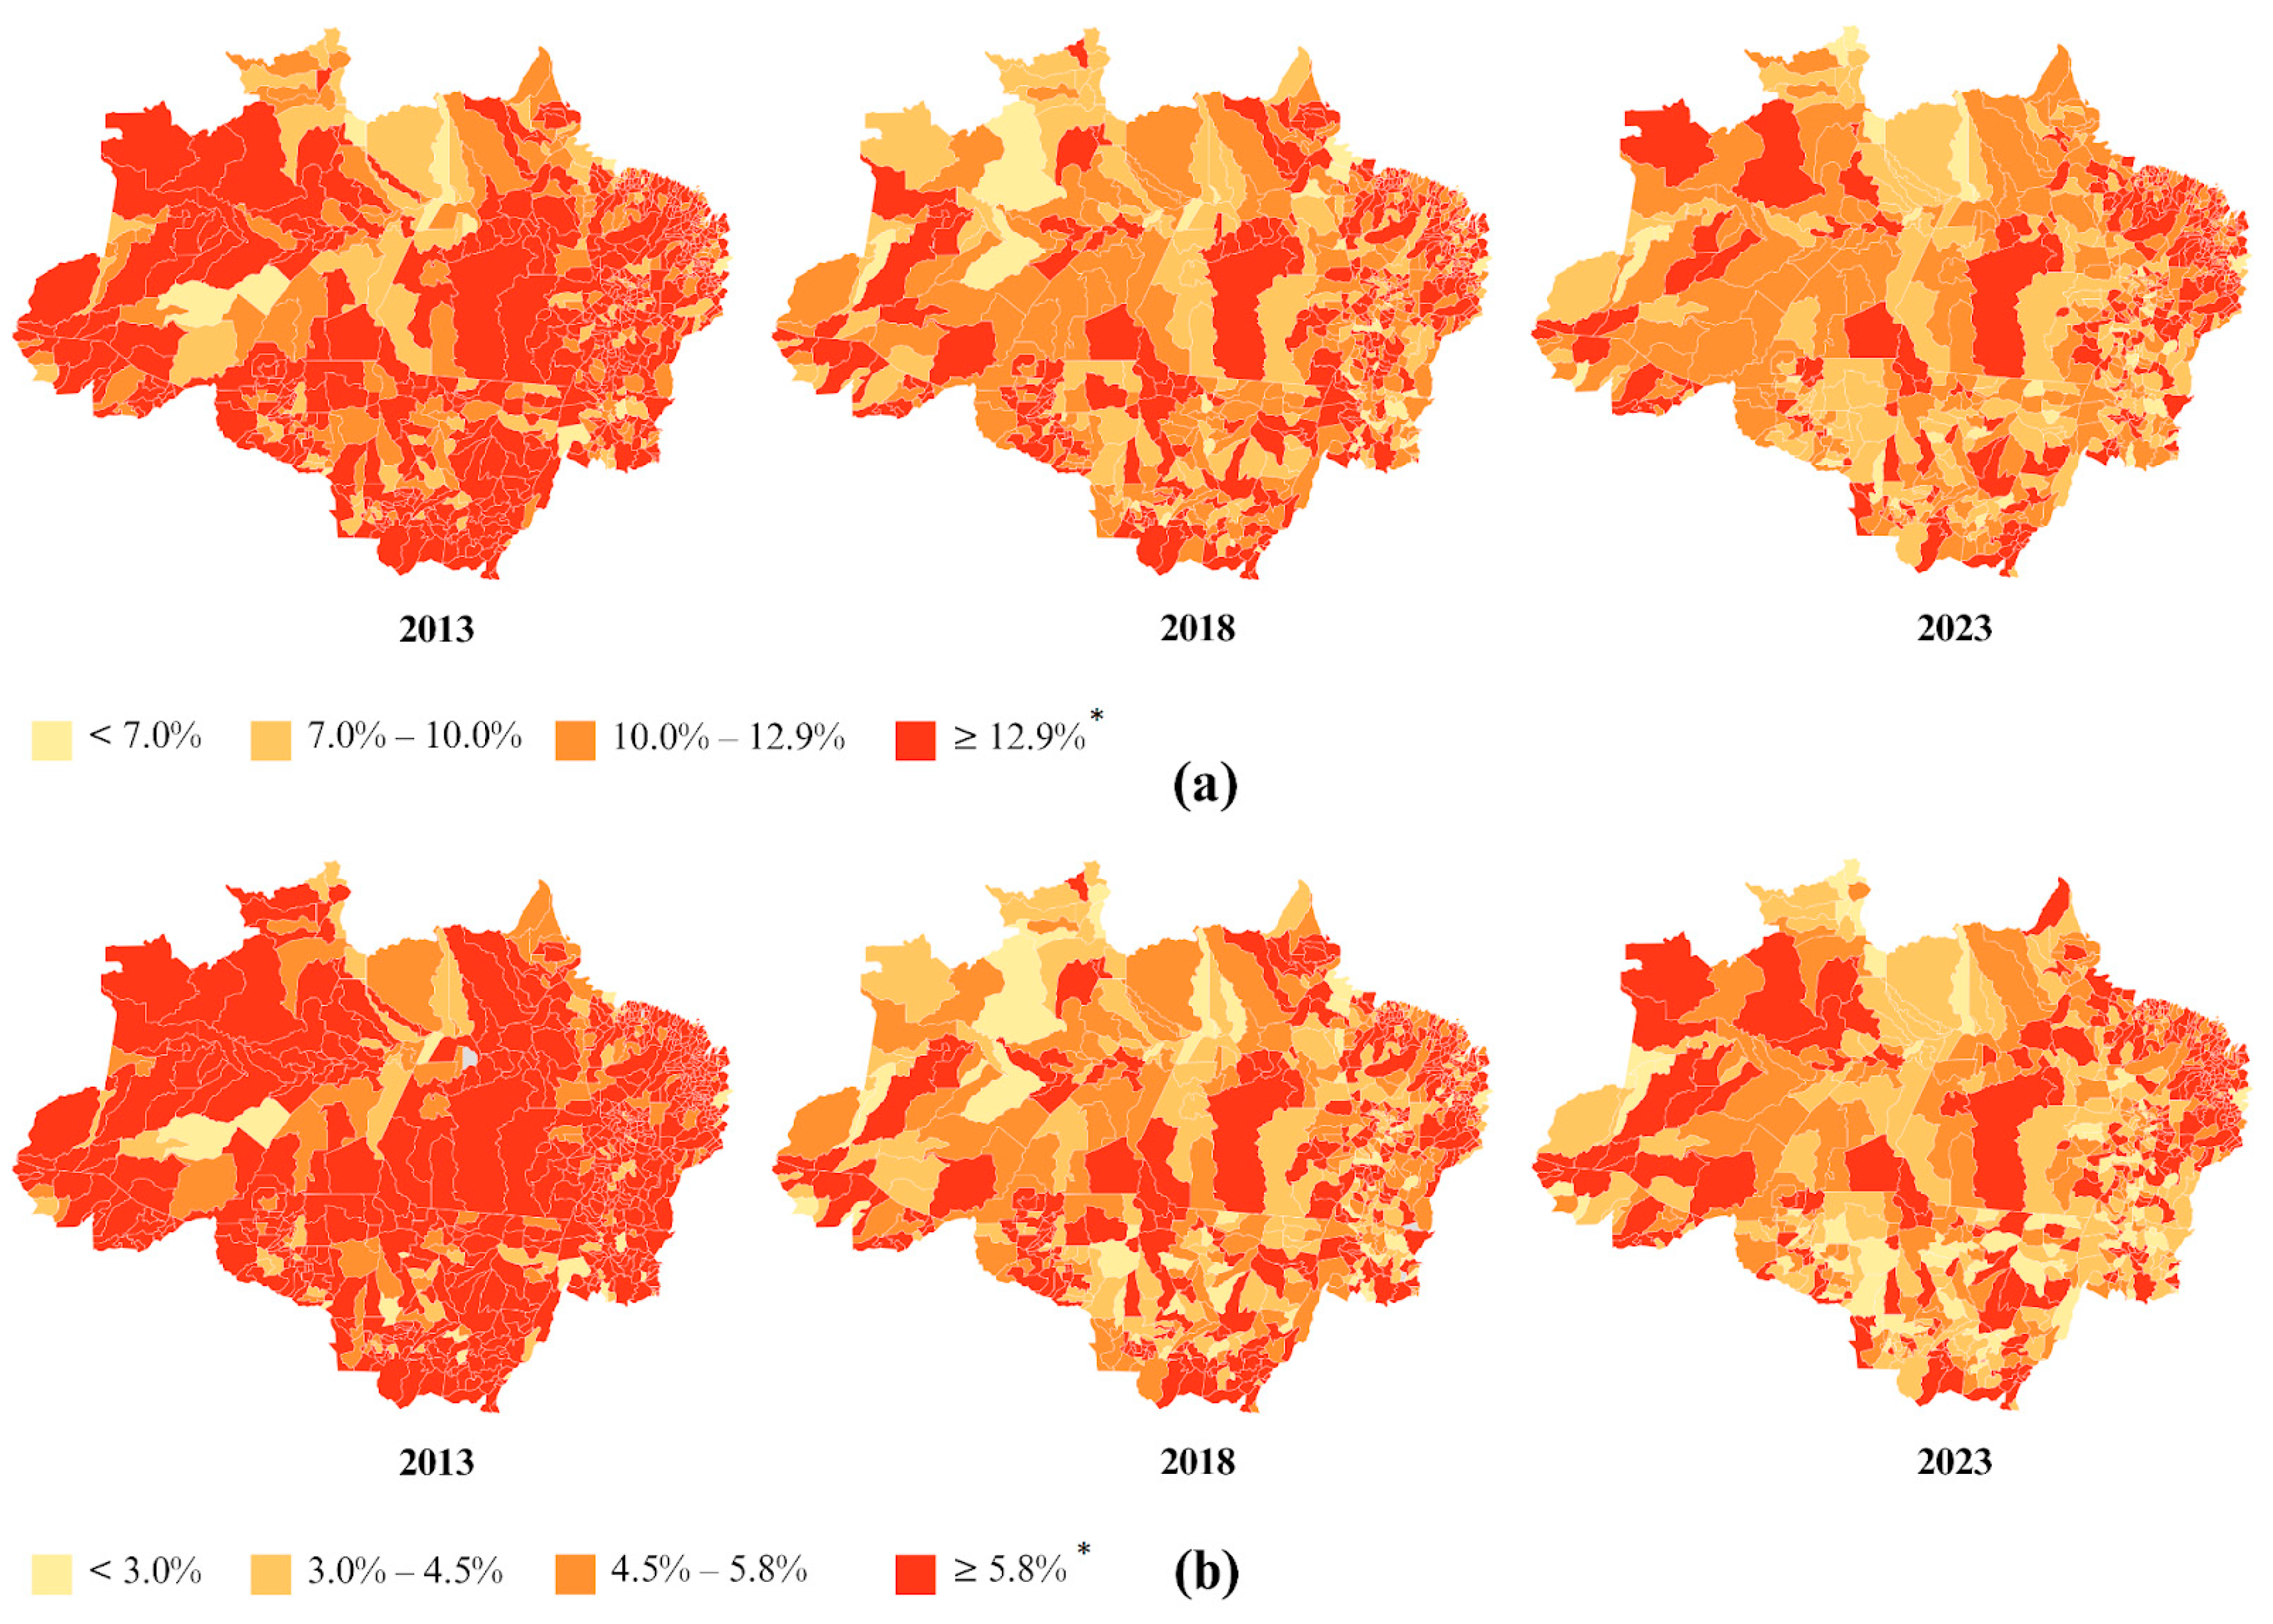
3.2. Adults
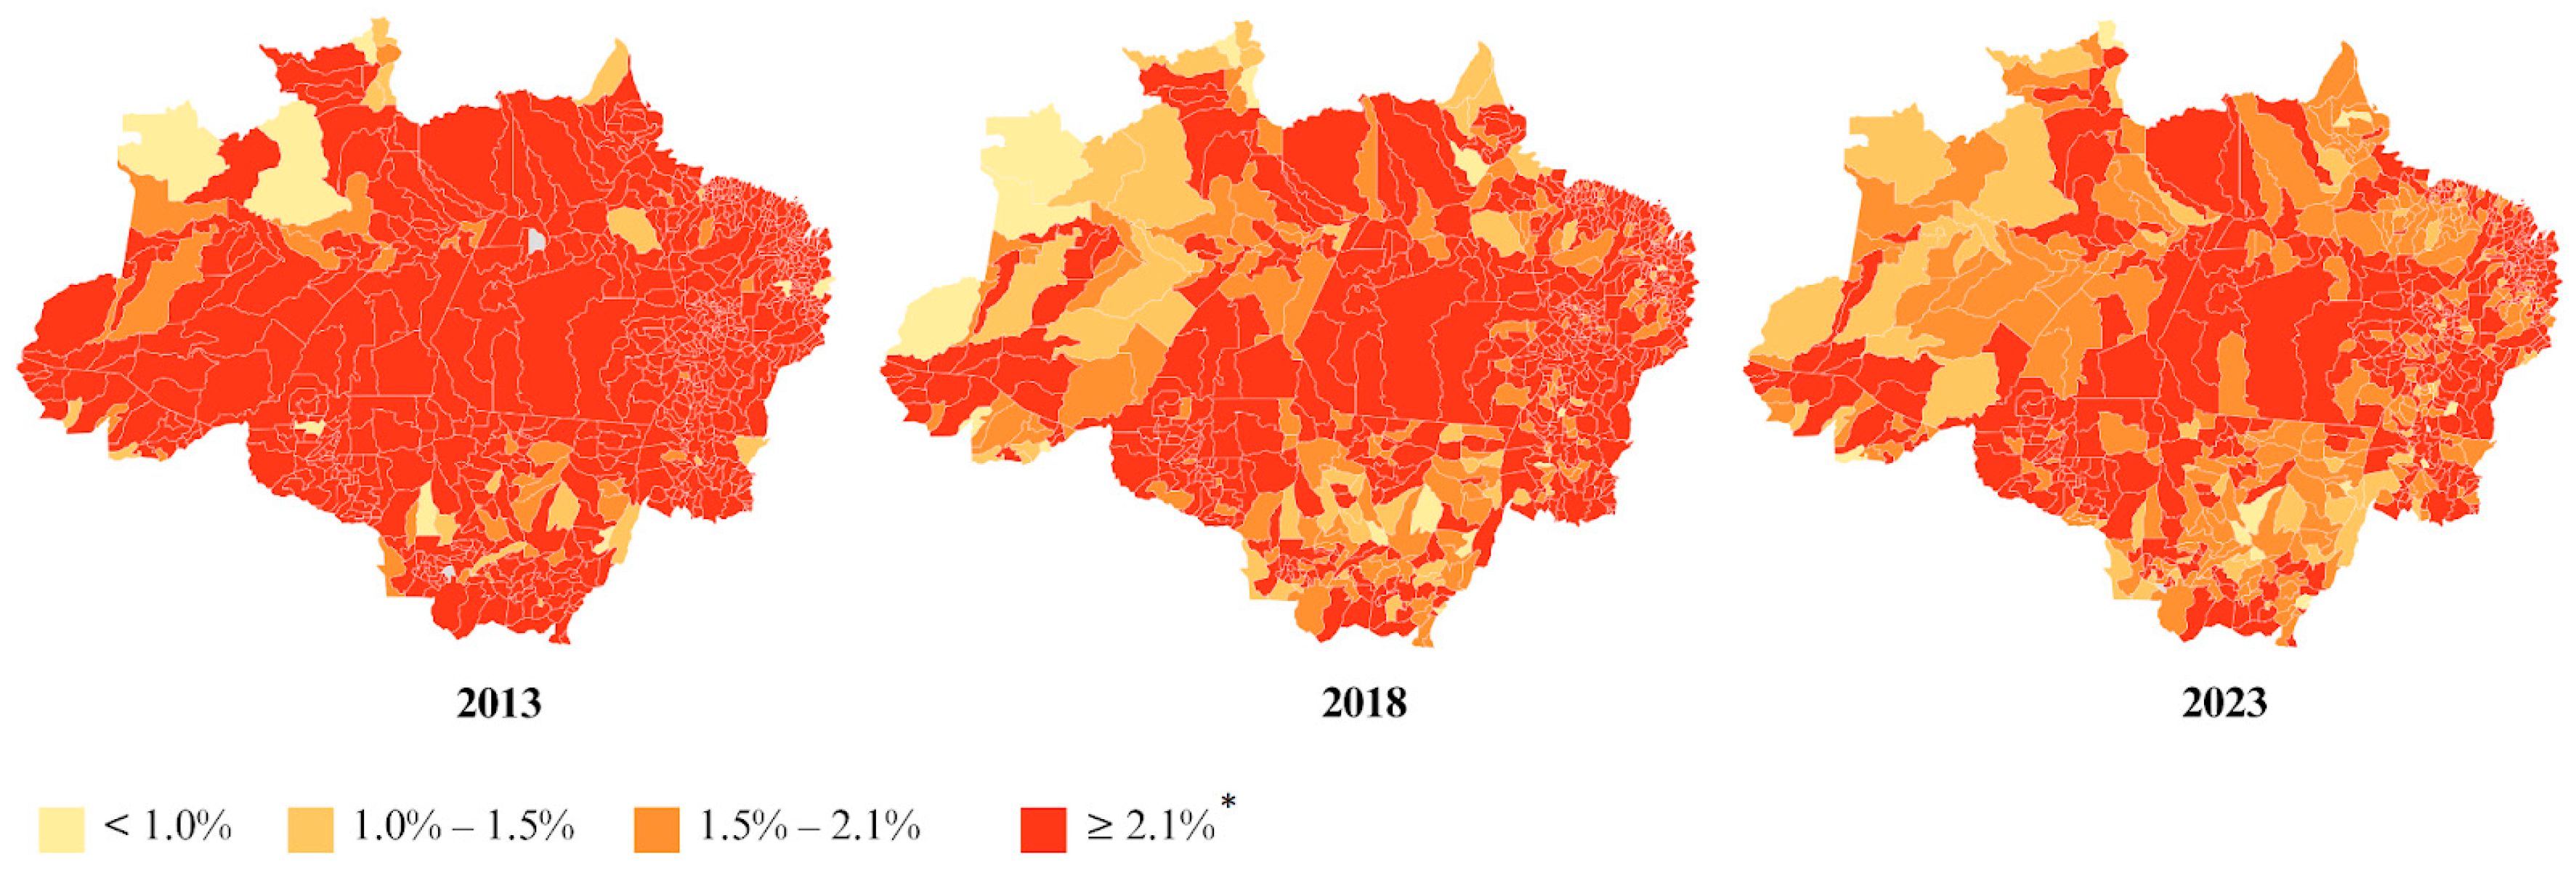
3.3. Elderly
4. Discussion
5. Conclusions
Supplementary Materials
Author Contributions
Funding
Institutional Review Board Statement
Informed Consent Statement
Data Availability Statement
Conflicts of Interest
References
- World Health Organization. Fact Sheets: Malnutrition. 2021. Available online: https://www.who.int/news-room/fact-sheets/detail/malnutrition (accessed on 17 August 2024).
- Popkin, B.M.; Reardon, T. Obesity and the food system transformation in Latin America. Obes. Rev. 2018, 19, 1028–1064. [Google Scholar] [CrossRef] [PubMed]
- World Health Organization. Malnutrition. 2024. Available online: https://www.who.int/news-room/questions-and-answers/item/malnutrition (accessed on 7 August 2024).
- Agência Brasil. Desnutrição no Brasil é Maior Entre Meninos Negros, Aponta Pesquisa. Available online: https://agenciabrasil.ebc.com.br/saude/noticia/2022-07/desnutricao-no-brasil-e-maior-entre-meninos-negros-aponta-pesquisa (accessed on 19 February 2025).
- Ministério da Saúde. Pesquisa do IBGE Mostra Aumento da Obesidade Entre Adultos. Available online: https://www.gov.br/pt-br/noticias/saude-e-vigilancia-sanitaria/2020/10/pesquisa-do-ibge-mostra-aumento-da-obesidade-entre-adultos (accessed on 19 February 2025).
- Malta, D.C.; Gomes, C.S.; Veloso, G.A.; Souza, J.B.d.; Oliveira, P.P.V.d.; Ferreira, A.V.L.; Nagavi, M.; Ferrinho, P.; Freitas, P.C.d.; Ribeiro, A.L.P. Carga Das Doenças Crônicas Não Transmissíveis Nos Países De Língua Portuguesa. Ciência Saúde Coletiva 2023, 28, 1549–1562. [Google Scholar] [CrossRef]
- Rivera, J.A.; Pedraza, L.S.; Martorell, R.; Gil, A. Introduction to the double burden of undernutrition and excess weight in Latin America. Am. J. Clin. Nutr. 2014, 100, 1613S–1616S. [Google Scholar] [CrossRef]
- Meller, F.O.; Schäfer, A.A.; Santos, L.P.; Quadra, M.R.; Miranda, V.I.A. Double Burden of Malnutrition and Inequalities in the Nutritional Status of Adults: A Population-Based Study in Brazil, 2019. Int. J. Public Health 2021, 28, 609179. [Google Scholar] [CrossRef] [PubMed]
- Conde, W.L.; Silva, I.V.d.; Ferraz, F.R. Tendências de desnutrição e obesidade em adultos brasileiros de 1975 a 2019 e seus fatores associados. Cad. Saude Publica 2022, 38, e00149721. [Google Scholar] [CrossRef]
- Guerra, L.D.d.S.; Vieira Passos, E. A fome como arma de extermínio: O genocídio alimentar e nutricional dos povos indígenas Xavante na Amazônia Legal Brasileira. J. Manag. Prim. Health Care 2023, 15, e031. [Google Scholar] [CrossRef]
- Malta, D.C.; Gomes, C.S.; Felisbino-Mendes, M.S.; Veloso, G.A.; Machado, I.E.; Cardoso, L.d.O.; Azeredo, R.T.; Jaime, P.C.; de Vasconcelos, L.L.C.; Naghavi, M.; et al. Undernutrition, and overweight and obesity: The two faces of malnutrition in Brazil, analysis of the Global Burden of Disease, 1990 to 2019. Public Health 2024, 229, 176–184. [Google Scholar] [CrossRef] [PubMed]
- Popkin, B.M.; Corvalan, C.; Grummer-Strawn, L.M. Dynamics of the double burden of malnutrition and the changing nutrition reality. Lancet 2020, 395, 65–74. [Google Scholar] [CrossRef]
- Nugent, R.; Levin, C.; Hale, J.; Hutchinson, B. Economic effects of the double burden of malnutrition. Lancet 2020, 395, 156–164. [Google Scholar] [CrossRef]
- Dias, F.S.B.; Silva, T.F.D.; Lima, Y.d.M.M.; Farias, L.S.D.; Gadelha, J.G.; Ramalho, A.A. Temporal Trend of Severe Obesity in Brazilian State Capitals (2006–2021). Obesities 2023, 3, 119–131. [Google Scholar] [CrossRef]
- Instituto Brasileiro de Geografia e Estatística. Cadastro de Municípios Localizados na Amazônia Legal. 2022. Available online: https://www.ibge.gov.br/geociencias/informacoes-ambientais/vegetacao/15819-amazonia-legal.html?t=o-que-e (accessed on 26 August 2024).
- World Health Organization. Who Child Growth Standards: Length/Height-for-Age, Weight-for-Age, Weightfor-Length, Weight-for-Height and Body Massindex-for-Age: Methods and Development; World Health Organization: Geneva, Switzerland, 2006; p. 312. [Google Scholar]
- World Health Organization. Obesity: Preventing and Managing the Global Epidemic: Report of a WHO Consultation; WHO Technical Report Series, 894; World Health Organization: Geneva, Switzerland, 2000; p. 252. [Google Scholar]
- Lipschitz, D.A. Screening for nutritional status in the elderly. Prim. Care 1994, 21, 55–67. [Google Scholar] [CrossRef]
- World Health Organization. Physical Status: The Use and Interpretation of Anthropometry; WHO Technical Report Series, No. 854; World Health Organization: Geneva, Switzerland, 1995. [Google Scholar]
- Kim, H.J.; Fay, M.P.; Feuer, E.J.; Midthune, D.N. Permutation Tests for Joinpoint Regression with Applications to Cancer Rates. Stat. Med. 2000, 19, 335–351. [Google Scholar] [CrossRef]
- World Health Organization. The Double Burden of Malnutrition: Policy Brief; World Health Organization: Geneva, Switzerland, 2016; p. 10. [Google Scholar]
- Swinburn, B.A.; Kraak, V.I.; Allender, S.; Atkins, V.J.; Baker, P.I.; Bogard, J.R.; Dietz, W.H. The global syndemic of obesity, undernutrition, and climate change: The Lancet Commission report. Lancet 2019, 393, 791–846. [Google Scholar] [CrossRef] [PubMed]
- Dukhi, N. Global prevalence of malnutrition: Evidence from literature. Malnutrition 2020, 1, 1–16. [Google Scholar] [CrossRef]
- World Health Organization. Obesity and Overweight. 2020. Available online: https://www.who.int/news-room/fact-sheets/detail/obesity-and-overweight (accessed on 17 August 2024).
- Ribeiro-Silva, R.d.C.; Silva, N.d.J.; Felisbino-Mendes, M.S.; Falcão, I.R.; de Andrade, R.d.C.S.; Silva, S.A. Time trends and social inequalities in child malnutrition: Nationwide estimates from Brazil’s food and nutrition surveillance system, 2009–2017. Public Health Nutr. 2022, 25, 3366–3376. [Google Scholar] [CrossRef] [PubMed]
- Stopa, S.R.; Malta, D.C.; Monteiro, C.N.; Szwarcwald, C.L.; Goldbaum, M.; Cesar, C.L.G. Acesso e uso de serviços de saúde pela população brasileira, Pesquisa Nacional de Saúde 2013. Rev. Saude Publica 2017, 51, 3s. [Google Scholar] [CrossRef]
- Palmeira, N.C.; Moro, J.P.; Getulino, F.A.; Vieira, Y.P.; Junior, A.O.S.; Saes, M.O. Análise do acesso a serviços de saúde no Brasil segundo perfil sociodemográfico: Pesquisa Nacional de Saúde, 2019. Epidemiol. Serv. Saúde 2022, 31, e2022966. [Google Scholar] [CrossRef]
- Bortolini, G.A.; Pereira, T.N.; Nilson, E.A.F.; Pires, A.C.L.; Moratori, M.F.; Ramos, M.K.P. Evolution of nutrition actions in primary health care along the 20-year history of the Brazilian National Food and Nutrition Policy. Cad. Saúde Pública 2021, 37, e00152620. [Google Scholar] [CrossRef]
- Alves, K.P.S. Enfrentamento das carências de micronutrientes no Brasil: Reflexões sobre as estratégiaS no âmbito da Atenção Básica. In Alimentação e Nutrição na Atenção Básica: Reflexões Cotidianas e Contribuições para Prática do Cuidado; EDUERJ: Rio de Janeiro, Brasil, 2021; pp. 149–170. ISBN 978-65-87949-11-6. [Google Scholar] [CrossRef]
- Bortolini, G.A.; Oliveira, T.F.V.; Silva, S.A.; Santin, R.C.; Medeiros, O.L.; Spaniol, A.M. Ações de alimentação e nutrição na atenção primária à saúde no Brasil. Rev. Panam. Salud Publica 2020, 44, e39. [Google Scholar] [CrossRef]
- Souza, A.A.d.; Heller, L. Bolsa Família Program and environmental health: A systematic review of the effects on diarrhea and malnutrition. Ciência Saúde Coletiva 2021, 26, 3087–3098. [Google Scholar] [CrossRef]
- Moriguchi, W.L.; Bernardes, P.D.H.; Pinhel, A.S.M.; Noronha, N.Y.; Diani, M.L.; Cintra, P.A.L.; Ferreira, N.C.; Barbosa, N.C. Políticas Públicas de Alimentação e Nutrição no Brasil: Da Desnutrição à Obesidade. Nutrientes 2022, 14, 2472. [Google Scholar] [CrossRef]
- Castro, M.C.; Massuda, A.; Almeida, G.; Menezes-Filho, N.A.; Andrade, M.V.; Souza Noronha, K.V.M.; Rocha, R.; Macinko, J.; Hone, T.; Tasca, R.; et al. Brazil’s unified health system: The first 30 years and prospects for the future. Lancet 2019, 394, 345–356. [Google Scholar] [CrossRef]
- Carneiro, V.C.C.B.; Ribeiro, d.O.P.T.; Rassy, C.S.; Cardoso, M.M.; Pedroso, J.D.S. Impact of expansion of primary care in child health: A population-based panel study in municipalities in the Brazilian Amazon. BMJ Open 2022, 12, e048897. [Google Scholar] [CrossRef] [PubMed]
- Coube, M.; Nikoloski, Z.; Mrejen, M.; Mossialos, E. Persistent inequalities in health care services utilisation in Brazil (1998–2019). Int. J. Equity Health 2023, 22, 25. [Google Scholar] [CrossRef]
- Viacava, F.; Oliveira, R.A.D.D.; Carvalho, C.D.C.; Laguardia, J.; Bellido, J.G. SUS: Supply, access to and use of health services over the last 30 years. Ciência Saúde Coletiva 2018, 23, 1751–1762. [Google Scholar] [CrossRef]
- Canella, D.S.; Bandeira, L.; Oliveira, M.L.; Castro, S.; Pereira, A.D.S.; Bandoni, D.H.; Castro, I.R.R. Update of the acquisition parameters of the Brazilian National School Feeding Program based on the Dietary Guidelines for the Brazilian Population. Cad. Saude Publica 2022, 37, e00151420. [Google Scholar] [CrossRef]
- Tuliende, M.I.E.D.; Martinelli, S.S.; Soares, P.; Fabri, R.K.; Bianchini, V.U.; Cavalli, S.B. Benefits and Difficulties of Implementing Family-Farming Food Purchases in the Brazilian National School Feeding Program. Int. J. Public Health 2024, 12, 1605870. [Google Scholar] [CrossRef] [PubMed]
- Nero, D.d.S.M.; Garcia, R.P.M.; Almassy Junior, A.A. O Programa Nacional de Alimentação Escolar (Pnae) a partir da sua gestão de descentralização. Ens. Avaliação Políticas Públicas Educ. 2023, 31, e0233056. [Google Scholar]
- Claro, R.M.; Maia, E.G.; Costa, B.V.; Diniz, D.P. Preço dos alimentos no Brasil: Prefira preparações culinárias a alimentos ultraprocessados. Cad. Saude Publica 2016, 29, e00104715. [Google Scholar] [CrossRef]
- Da Silva Oliveira, E.K.; Vieira, T.D.S.; de Souza, O.F.; Bezerra, I.M.P.; Cavalcanti, M.P.E.; de Abreu, L.C.; Riera, A.R.P. Consumption of Ultra-Processed Foods in the Brazilian Amazon during COVID-19. Nutrients 2024, 2, 2117. [Google Scholar] [CrossRef]
- Passos, C.M.D.; Maia, E.G.; Levy, R.B.; Martins, A.P.B.; Claro, R.M. Association between the price of ultra-processed foods and obesity in Brazil. Nutr. Metab. Cardiovasc. Dis. 2020, 30, 589–598. [Google Scholar] [CrossRef] [PubMed]
- Carvalho, C.M.P.; Johns, P.; Albiero, M.; Martins, A.P.B.; Mais, L.A.; Ralston, R.; Collin, J. “Private and personal”: Corporate political activity, informal governance, and the undermining of marketing regulation in Brazil. Glob. Public Health 2022, 17, 1902–1912. [Google Scholar] [CrossRef] [PubMed]
- Popkin, B.M.; Shu, W. The nutrition transition to a stage of high obesity and noncommunicable disease prevalence dominated by ultra-processed foods is not inevitable. Obes. Rev. 2022, 23, e13366. [Google Scholar] [CrossRef]
- Food and Agriculture Organization of the United Nations. The State of Food Security and Nutrition in the World 2024—Financing to End Hunger, Food Insecurity and Malnutrition in All Its Forms; Food and Agriculture Organization of the United Nations: Rome, Italy, 2024; p. 284. [Google Scholar]
- Rodrigues, L.C.; Canella, D.S.; Claro, R.M. Time trend of overweight and obesity prevalence among older people in Brazilian State Capitals and the Federal District from 2006 to 2019. Eur. J. Ageing 2021, 19, 555–565. [Google Scholar] [CrossRef]
- Liu, C.; Wong, P.Y.; Chung, Y.L.; Chow, S.K.-H.; Cheung, W.H.; Law, S.W.; Chan, J.C.N.; Wong, R.M.Y. Deciphering the “obesity paradox” in the elderly: A systematic review and meta-analysis of sarcopenic obesity. Obes. Rev. 2023, 24, e13534. [Google Scholar] [CrossRef] [PubMed]
- Baker, P.; Machado, P.; Santos, T.; Sievert, K.; Backholer, K.; Hadjikakou, M.; Russell, C.; Huse, O.; Bell, C.; Scrinis, G.; et al. Ultra-processed foods and the nutrition transition: Global, regional and national trends, food systems transformations and political economy drivers. Obes. Rev. 2020, 21, e13126. [Google Scholar] [CrossRef]
- Levy, R.B.; Barata, M.F.; Leite, M.A.; Andrade, G.C. How and why ultra-processed foods harm human health. Proc. Nutr. Soc. 2024, 83, 1–8. [Google Scholar] [CrossRef]
- Nguyen, P.H.; Scott, S.; Headey, D.; Singh, N.; Tran, L.M. The double burden of malnutrition in India: Trends and inequalities (2006–2016). PLoS ONE 2021, 16, e0247856. [Google Scholar] [CrossRef]
- NCD Risk Factor Collaboration (NCD-RisC). Worldwide trends in underweight and obesity from 1990 to 2022: A pooled analysis of 3663 population-representative studies with 222 million children, adolescents, and adults. Lancet 2024, 403, 1027–1050. [Google Scholar] [CrossRef]
- Lopes, S.O.; Abrantes, L.C.S.; Azevedo, F.M.; Morais, N.d.S.; Morais, D.d.C.; Gonçalves, V.S.S.; Fontes, E.A.F.; Franceschini, S.d.C.C.; Priore, S.E. Insegurança alimentar e deficiência de micronutrientes em adultos: Uma revisão sistemática e meta-análise. Nutrients 2023, 15, 1074. [Google Scholar] [CrossRef]
- Temponi, H.R.; Velasquez-Melendez, G. Prevalence of double burden on malnutrition at household level in four Latin America countries. Rev. Bras. Saúde Matern. Infant. 2020, 20, 27–35. [Google Scholar] [CrossRef]
- Salles-Costa, R.; Segall-Corrêa, A.M.; Alexandre-Weiss, V.P.; Pasquim, E.M.; Paula, N.M.d.; Lignani, J.d.B.; Grossi, M.E.D.; Zimmermann, S.A.; Medeiros, M.A.T.d.; Santos, S.M.C.d.; et al. Rise and fall of household food security in Brazil, 2004 to 2022. Cad. Saúde Pública 2023, 39, e00191122. [Google Scholar] [CrossRef] [PubMed]
- Kasperson, J.X.; Kasperson, R.E.; Turner, B.L.; Hsieh, W.; Schiller, A. Vulnerability to global environmental change. In The Social Contours of Risk; Routledge: London, UK, 2022; Volume II, pp. 245–285. [Google Scholar] [CrossRef]
- Brandão, A.L.; Casemiro, J.P.; Peres, F. Insegurança Alimentar e Emergência Climática: Sindemia Global e um Desafio de Saúde Pública na América Latina, 1st ed.; Editora Rede Unida: Porto Alegre, Brazil, 2024; 306p. [Google Scholar] [CrossRef]
- Brandão, A.L.; Casemiro, J.P.; dos Reis, E.C.; Vitorino, S.A.S.; de Oliveira, A.D.S.B.; Bortolini, G.A. Recomendações para o fortalecimento da atenção nutricional na atenção primária à saúde brasileira. Rev. Panam. Salud Publica 2022, 46, e119. [Google Scholar] [CrossRef]
- Taillie, L.S.; Busey, E.; Stoltze, F.M.; Dillman Carpentier, F.R. Governmental policies to reduce unhealthy food marketing to children. Nutr. Rev. 2019, 77, 787–816. [Google Scholar] [CrossRef] [PubMed]
- World Health Organization. Policies to Protect Children from the Harmful Impact of Food Marketing: WHO Guideline; World Health Organization: Geneva, Switzerland, 2023; p. 88. [Google Scholar]
- Pereira, T.N.; Bortolini, G.A.; Campos, R.d.F. Barriers and Facilitators Related to the Adoption of Policies to Reduce Ultra-Processed Foods Consumption: A Scoping Review. Int. J. Environ. Res. Public Health 2023, 20, 4729. [Google Scholar] [CrossRef]
- Smith, E.; Scarborough, P.; Rayner, M.; Briggs, A.D.M. Should we tax unhealthy food and drink? Proc. Nutr. Soc. 2018, 77, 314–320. [Google Scholar] [CrossRef] [PubMed]
- Popkin, B.M.; Barquera, S.; Corvalan, C.; Hofman, K.J.; Monteiro, C.; Ng, S.W.; Swart, E.C.; Taillie, L.S. Towards unified and impactful policies to reduce ultra-processed food consumption and promote healthier eating. Lancet Diabetes Endocrinol. 2021, 9, 462–470. [Google Scholar] [CrossRef]
- World Health Organization. Decade of Healthy Ageing: Baseline Report. 2021. Available online: https://www.who.int/publications/i/item/9789240017900 (accessed on 25 August 2024).
- Keating, N. A research framework for the United Nations Decade of Healthy Ageing (2021–2030). Eur. J. Ageing 2022, 19, 775–787. [Google Scholar] [CrossRef]
- Silva, R.P.C.; Vergara, C.M.A.C.; Sampaio, H.A.C.; Vasconcelos Filho, J.E.; Strozberg, F.; Ferreira Neto, J.F.R.; Mafra, M.L.P.; Garcia Filho, C.; Carioca Filho, A.A.F. Food and Nutrition Surveillance System: Temporal trend of coverage and nutritional status of adults registered on the system, Brazil, 2008-2019. Epidemiol. Serv. Saude 2022, 31, e2021605. [Google Scholar] [CrossRef]
- Silva, N.d.J.; Mello e Silva, J.F.d.; Carrilho, T.R.B.; Pinto, E.d.J.; Andrade, R.d.C.S.d.; Silva, S.A.; Pedroso, J.; Spaniol, A.M.; Bortolini, G.A.; Fagundes, A.; et al. Quality of child anthropometric data from SISVAN, Brazil, 2008–2017. Rev. Saúde Pública 2023, 57, 62. [Google Scholar] [CrossRef]
- Barbosa, B.B.; Baltar, V.T.; Horta, R.L.; Lobato, J.C.P.; Vieira, L.J.E.S.; Gallo, C.O.; Carioca, A.A.F. Food and Nutrition Surveillance System (SISVAN) coverage, nutritional status of older adults and its relationship with social inequalities in Brazil, 2008-2019: An ecological time-series study. Epidemiol. Serv. Saude 2023, 32, e2022595. [Google Scholar] [CrossRef] [PubMed]
- Alves, I.C.R.; Souza, T.F.d.; Leite, M.T.S.; Pinho, L.d. Limites e possibilidades do Sistema de Vigilância Alimentar e Nutricional na Atenção Primária à Saúde: Relatos de profissionais de enfermagem. DEMETRA Aliment. Nutr. Saúde 2018, 13, 69–81. [Google Scholar] [CrossRef]
- Rolim, M.D.; Lima, S.M.L.; Barros, D.C.d.; Andrade, C.L.T.d. Avaliação Do SISVAN Na Gestão De Ações De Alimentação E Nutrição Em Minas Gerais, Brasil. Ciência Saúde Coletiva 2015, 20, 2359–2369. [Google Scholar] [CrossRef]
- Nascimento, F.A. A vigilância alimentar e nutricional brasileira na produção científica e nos serviços de saúde. Master’s Thesis, Faculdade de Saúde Pública da Universidade de São Paulo, São Paulo, Brazil, 2016. [Google Scholar]
- Ferreira, C.S.; Souza, A.M.; Nascimento, F.A.; Silva, R.F. O sistema de vigilância alimentar e nutricional como instrumento de monitoramento da Estratégia Nacional para Alimentação Complementar Saudável. Rev. Bras. Saúde Mater. Infant. 2013, 13, 167–177. [Google Scholar] [CrossRef]
- Pantoja, L.N.; Narazé, L.A.; Santos, D.F.; Costa, M.M. Cobertura do Sistema de Vigilância Alimentar e Nutricional Indígena (SISVAN-I) e prevalência de desvios nutricionais em crianças Yanomami menores de 60 meses, Amazônia, Brasil. Rev. Bras. Saúde Mater. Infant. 2014, 14, 53–63. [Google Scholar] [CrossRef]
- Enes, C.C.; Ferreira, A.M.; Lima, J.S.; Pires, M.C.; Santos, F.; Morais, A.; Freitas, A.M. Cobertura populacional do Sistema de Vigilância Alimentar e Nutricional no Estado de São Paulo, Brasil. Ciência Saúde Coletiva 2014, 19, 1543–1551. [Google Scholar] [CrossRef] [PubMed]
- Jung, N.M.; Oliveira, M.R.; Pinto, R.M.; Silva, D.P.; Lima, C.S. Utilização e cobertura do Sistema de Vigilância Alimentar e Nutricional no Estado do Rio Grande do Sul, Brasil. Ciência Saúde Coletiva 2014, 19, 1379–1388. [Google Scholar] [CrossRef]
- Perez, A.I.; Cruz, A.I.; Costa, N.M.; Silva, J.B.; Barbosa, F.M. Monitoramento do estado nutricional de usuários de Unidades Básicas de Saúde no Estado de São Paulo por meio do Sistema de Vigilância Alimentar e Nutricional (SISVAN). BEPA Bol. Epidemiológico Paul. 2013, 10, 1–13. [Google Scholar]
- Lima, J.F.; Schmidt, D.B. Sistema de Vigilância Alimentar e Nutricional: Utilização e Cobertura na Atenção Primária. In Atenção Primária à Saúde no Brasil: Avanços, Retrocessos e Práticas em Pesquisa; Silva, P.F., Ed.; Editora Científica Digital: São Paulo, Brazil, 2022; Volume 2, pp. 150–160. [Google Scholar] [CrossRef]
- Ministério da Saúde. Secretaria de Atenção à Saúde. Departamento de Atenção Básica. Marco de referência da vigilância alimentar e nutricional na atenção básica; Ministério da Saúde: Brasília, Brazil, 2015; p. 56. ISBN 978-85-334-2250-6. [Google Scholar]
- Barros, D.C.; Silva, D.O.; Gugelmin, S.Â. (Eds.) Vigilância Alimentar e Nutricional para a Saúde Indígena; Editora FIOCRUZ: Rio de Janeiro, Brazil, 2007; Volume 2, p. 254. ISBN 978-85-7541-589-4. [Google Scholar] [CrossRef]
- Ministério da Saúde. Manual Operacional para Uso do Sistema de Vigilância Alimentar e Nutricional SISVAN—Versão 3.0; Secretaria de Atenção à Saúde, Departamento de Atenção Básica: Brasília, Brazil, 2017. Available online: https://sisaps.saude.gov.br/sisvan/public/file/ManualDoSisvan.pdf (accessed on 26 February 2025).
- Ministério da Saúde. Manual Orientador para Aquisição de Equipamentos Antropométricos; Portaria No 2.975, de 14 de Dezembro de 2011; Ministério da Saúde: Brasília, Brazil, 2012. [Google Scholar]
- Ministério da Saúde. Guia para a Organização da Vigilância Alimentar e Nutricional na Atenção Primária à Saúde; Ministério da Saúde: Brasília, Brazil, 2022. Available online: http://bvsms.saude.gov.br/bvs/publicacoes/guia_organizacao_vigilancia_alimentar_nutricional.pdf (accessed on 26 February 2025).
- Marengo, J.A.; Souza, C., Jr. Mudanças Climáticas: Impactos e Cenários para a Amazônia; São Paulo, Brasil. 2018. Available online: https://prioridadeabsoluta.org.br/wp-content/uploads/2019/05/relatorio_mudancas_climaticas-amazonia.pdf (accessed on 26 February 2025).


| Nutritional Status | 2013 | 2014 | 2015 | 2016 | 2017 | 2018 | 2019 | 2020 | 2021 | 2022 | 2023 | APC | 95% CI | Period |
|---|---|---|---|---|---|---|---|---|---|---|---|---|---|---|
| Stunting (height-for-age index: Z-score < −2) | ||||||||||||||
| Total | 20.45 | 20.03 | 17.82 | 17.93 | 18.1 | 17.99 | 18.56 | 17.07 | 15.79 | 15.13 | 15.3 | −2.7 * | −3.7; −1.6 | 2013–2023 |
| Male | 21.6 | 21.74 | 19.19 | 19.19 | 19.4 | 19.29 | 20.01 | 18.41 | 17.05 | 16.45 | 16.6 | −2.5 * | −3.6; −1.4 | 2013–2023 |
| Female | 19.51 | 18.52 | 16.49 | 16.62 | 16.75 | 16.63 | 17.04 | 15.66 | 14.47 | 13.74 | 13.92 | −3.0 * | −4.2; −1.8 | 2013–2023 |
| Wasting (weight-for-height index: Z-score < −2) | ||||||||||||||
| Total | 6.86 | 6.35 | 6.26 | 6.45 | 6.45 | 5.46 | 5.95 | 6.32 | 6.87 | 6.44 | 5.84 | −0.5 | −1.9; 0.9 | 2013–2023 |
| Male | 6.86 | 6.42 | 6.36 | 6.47 | 6.53 | 5.6 | 6.04 | 6.41 | 7.03 | 6.55 | 5.94 | −0.3 | −1.8; 1.08 | 2013–2023 |
| Female | 6.89 | 6.3 | 6.15 | 6.42 | 6.37 | 5.31 | 5.96 | 6.24 | 6.71 | 6.33 | 5.74 | −0.60 | −1.9; 0.80 | 2013–2023 |
| Overweight (weight-for-height index: Z-score > +2) | ||||||||||||||
| Total | 15.23 | 16.3 | 13.6 | 14.89 | 13.07 | 12.42 | 13.23 | 13.97 | 14.01 | 12.81 | 11.8 | −4.7 * | −6.6; −3.7 | 2013–2018 |
| 4.0 * | 1.2; 5.8 | 2018–2021 | ||||||||||||
| −9.4 * | −13.6; −5.1 | 2021–2023 | ||||||||||||
| Male | 16.13 | 16.96 | 14.29 | 15.57 | 13.77 | 13.1 | 13.91 | 14.75 | 14.69 | 13.54 | 12.48 | −4.5 * | −6.4; −3.5 | 2013–2018 |
| 3.9 * | 1.2; 5.7 | 2018–2021 | ||||||||||||
| −9.1 * | −13.2; −4.8 | 2021–2023 | ||||||||||||
| Female | 14.53 | 15.21 | 12.91 | 14.19 | 12.34 | 11.72 | 12.51 | 13.15 | 13.29 | 12.04 | 11.09 | −4.6 * | −6.4; −3.7 | 2013–2018 |
| 3.9 * | 1.2; 5.7 | 2018–2021 | ||||||||||||
| −9.6 * | −13.5; −5.7 | 2021–2023 | ||||||||||||
| Obesity (weight-for-height index: Z-score > +3) | ||||||||||||||
| Total | 9.04 | 9.72 | 7.15 | 8.47 | 6.62 | 5.77 | 6.63 | 6.76 | 7.2 | 6.19 | 5.42 | −9.0 * | −11.6; −7.7 | 2013–2018 |
| 5.5 * | 1.2; 8.9 | 2018–2021 | ||||||||||||
| −13.4 * | −19.2; −7.0 | 2021–2023 | ||||||||||||
| Male | 9.65 | 10.28 | 7.5 | 8.9 | 7.08 | 6.19 | 7.14 | 7.28 | 7.69 | 6.7 | 5.83 | −8.7 * | −10.4; −7.7 | 2013–2018 |
| 5.7 * | 1.8; 8.6 | 2018–2021 | ||||||||||||
| −13.2 * | −17.8; −8.1 | 2021–2023 | ||||||||||||
| Female | 8.55 | 9.23 | 6.81 | 8.02 | 6.14 | 5.33 | 6.1 | 6.21 | 6.69 | 5.64 | 4.99 | −9.6 * | −11.5; −8.6 | 2013–2018 |
| 5.4 * | 1.2; 8.5 | 2018–2021 | ||||||||||||
| −13.6 * | −18.6; −7.9 | 2021–2023 | ||||||||||||
| Nutritional Status | 2013 | 2014 | 2015 | 2016 | 2017 | 2018 | 2019 | 2020 | 2021 | 2022 | 2023 | APC | 95% CI | Period |
|---|---|---|---|---|---|---|---|---|---|---|---|---|---|---|
| Underweight (BMI < 18.5 kg/m2) | ||||||||||||||
| Total | 3.87 | 3.66 | 2.86 | 2.99 | 2.64 | 2.48 | 2.63 | 2.23 | 2.17 | 2.27 | 2.26 | −13.5 * | −15.8; −9.4 | 2013–2015 |
| −5.2 * | −6.7; −3.9 | 2015–2021 | ||||||||||||
| 2.2 | −2.9; 5.2 | 2021–2023 | ||||||||||||
| Male | 3.77 | 3.65 | 2.09 | 2.05 | 1.85 | 1.77 | 1.76 | 1.74 | 1.76 | 1.96 | 2.01 | −22.8 * | −29.8; −19.1 | 2013–2016 |
| −2.4 | −9.7; 2.0 | 2016–2020 | ||||||||||||
| 5.9 * | 1.5; 13.4 | 2020–2023 | ||||||||||||
| Female | 3.87 | 3.66 | 2.92 | 3.09 | 2.71 | 2.55 | 2.74 | 2.36 | 2.29 | 2.38 | 2.35 | −12.4 * | −14.7; −8.7 | 2013–2015 |
| −4.6 * | −5.9; −3.5 | 2015–2021 | ||||||||||||
| 1.4 | −2.9; 4.3 | 2021–2023 | ||||||||||||
| Overweight (BMI ≥ 25.0 kg/m2) | ||||||||||||||
| Total | 48.85 | 51.1 | 55.04 | 55,00 | 56.33 | 58.69 | 59.75 | 62.88 | 63.87 | 63.56 | 64.64 | 5.1 * | 3.2; 7.1 | 2013–2015 |
| 2.8 * | 2.1; 3.5 | 2015–2021 | ||||||||||||
| 0.4 | −1.5; 2.3 | 2021–2023 | ||||||||||||
| Male | 49.1 | 50.1 | 57.51 | 57.71 | 58.16 | 58.85 | 58.33 | 60.62 | 61.53 | 60.42 | 60.68 | 9.5 * | 5.8; 12.1 | 2013–2015 |
| 1.0 * | 0.4; 1.3 | 2015–2023 | ||||||||||||
| Female | 48.84 | 51.11 | 54.87 | 54.7 | 56.17 | 58.68 | 59.93 | 63.49 | 64.56 | 64.68 | 66.17 | 3.1 * | 2.7; 3.3 | 2013–2023 |
| Obesity (BMI ≥ 30.0 kg/m2) | ||||||||||||||
| Total | 17.1 | 18.4 | 20.67 | 20.88 | 21.61 | 23.06 | 24.05 | 26.27 | 27.32 | 27.34 | 28.49 | 9.2 * | 7.0; 11.9 | 2013–2015 |
| 3.9 * | 2.7; 5.2 | 2015–2018 | ||||||||||||
| 6.5 * | 5.2; 7.7 | 2018–2021 | ||||||||||||
| 1.1 | −1.3; 3.1 | 2021–2023 | ||||||||||||
| Male | 14.47 | 14.64 | 19.66 | 19.73 | 20,00 | 20.29 | 19.9 | 21.78 | 23.08 | 22.41 | 23.02 | 18.3 * | 8.3; 28.1 | 2013–2015 |
| 2.6 * | 0.5; 3.6 | 2015–2023 | ||||||||||||
| Female | 17.13 | 18.44 | 20.74 | 21 | 21.76 | 23.33 | 24.58 | 27.48 | 28.57 | 29.09 | 30.61 | 5.9 * | 5.3; 6.6 | 2013–2023 |
| Nutritional Status | 2013 | 2014 | 2015 | 2016 | 2017 | 2018 | 2019 | 2020 | 2021 | 2022 | 2023 | APC | 95% CI | Period |
|---|---|---|---|---|---|---|---|---|---|---|---|---|---|---|
| Underweight (BMI < 22.0 kg/m2) | ||||||||||||||
| Total | 17.47 | 17.93 | 14.68 | 14.63 | 13.93 | 13.05 | 12.95 | 12.95 | 12.69 | 12.9 | 13.04 | −6.3 * | −8.3; −5.2 | 2013–2018 |
| −0.0 | −1.5; 2.3 | 2018–2023 | ||||||||||||
| Male | 19.3 | 19.32 | 14.98 | 15.12 | 14.53 | 13.73 | 13.63 | 13.45 | 13.15 | 13.45 | 13.76 | −10.8 * | −16.8; −6.8 | 2013–2016 |
| −1.3 | −2.5; 0.8 | 2016–2023 | ||||||||||||
| Female | 16.26 | 17.72 | 14.52 | 14.31 | 13.55 | 12.62 | 12.52 | 12.55 | 12.34 | 12.45 | 12.47 | −6.3 * | −7.7; −5.3 | 2013–2018 |
| −0.3 | −1.5; 1.5 | 2018–2023 | ||||||||||||
| Overweight (BMI ≥ 27.0 kg/m2) | ||||||||||||||
| Total | 42.35 | 41.96 | 45.78 | 45.84 | 46.92 | 48.31 | 48.23 | 47.48 | 47.75 | 47.97 | 48.22 | 3.4 * | 2.5; 5.1 | 2013–2017 |
| 0.1 | −0.7; 0.6 | 2017–2023 | ||||||||||||
| Male | 36.03 | 35.74 | 41.23 | 40.9 | 41.79 | 42.7 | 42.6 | 42.65 | 42.79 | 43.03 | 43.13 | 6.1 * | 4.7; 8.2 | 2013–2016 |
| 0.5 * | 0.1; 0.8 | 2016–2023 | ||||||||||||
| Female | 46.51 | 42.88 | 48.23 | 48.99 | 50.15 | 51.83 | 51.82 | 51.26 | 51.61 | 51.89 | 52.31 | 3.2 * | 2.3; 5.1 | 2013–2018 |
| 0, 0 | −1.8; 0.9 | 2018–2023 | ||||||||||||
Disclaimer/Publisher’s Note: The statements, opinions and data contained in all publications are solely those of the individual author(s) and contributor(s) and not of MDPI and/or the editor(s). MDPI and/or the editor(s) disclaim responsibility for any injury to people or property resulting from any ideas, methods, instructions or products referred to in the content. |
© 2025 by the authors. Licensee MDPI, Basel, Switzerland. This article is an open access article distributed under the terms and conditions of the Creative Commons Attribution (CC BY) license (https://creativecommons.org/licenses/by/4.0/).
Share and Cite
Ramalho, A.A.; da Silva, T.M.; Lima, Y.d.M.M.; da Silva, T.F.; de Oliveira, M.A.; da Silva, S.C.E.V.; Anute, M.E.A.; Barbosa, E.B.; Nogueira, D.T.d.A.F.; Dias, F.S.B. The Double Burden of Malnutrition in the Brazilian Legal Amazon: Spatial Distributions and Temporal Trends (2013–2023). Nutrients 2025, 17, 1054. https://doi.org/10.3390/nu17061054
Ramalho AA, da Silva TM, Lima YdMM, da Silva TF, de Oliveira MA, da Silva SCEV, Anute MEA, Barbosa EB, Nogueira DTdAF, Dias FSB. The Double Burden of Malnutrition in the Brazilian Legal Amazon: Spatial Distributions and Temporal Trends (2013–2023). Nutrients. 2025; 17(6):1054. https://doi.org/10.3390/nu17061054
Chicago/Turabian StyleRamalho, Alanderson Alves, Tamires Mota da Silva, Yara de Moura Magalhães Lima, Tiago Feitosa da Silva, Michelle Adler de Oliveira, Suellen Cristina Enes Valentim da Silva, Maria Eduarda Alves Anute, Eduardo Batista Barbosa, Danila Torres de Araujo Frade Nogueira, and Flávia Santos Batista Dias. 2025. "The Double Burden of Malnutrition in the Brazilian Legal Amazon: Spatial Distributions and Temporal Trends (2013–2023)" Nutrients 17, no. 6: 1054. https://doi.org/10.3390/nu17061054
APA StyleRamalho, A. A., da Silva, T. M., Lima, Y. d. M. M., da Silva, T. F., de Oliveira, M. A., da Silva, S. C. E. V., Anute, M. E. A., Barbosa, E. B., Nogueira, D. T. d. A. F., & Dias, F. S. B. (2025). The Double Burden of Malnutrition in the Brazilian Legal Amazon: Spatial Distributions and Temporal Trends (2013–2023). Nutrients, 17(6), 1054. https://doi.org/10.3390/nu17061054