Article

Effect of Salt Reduction Interventions in Lowering Blood Pressure and Salt Intake in Zhejiang Province, China, 2017–2021: A Randomized Controlled Trial

1
Key Laboratory of Environment and Health, Ministry of Education & Ministry of Environmental Protection, and State Key Laboratory of Environmental Health, School of Public Health, Tongji Medical College, Huazhong University of Science and Technology, Wuhan 430030, China
2
Department of Chronic Disease Prevention and Control, Zhejiang Provincial Center for Disease Control and Prevention, Hangzhou 310051, China
3
Jiashan County Center for Disease Control and Prevention, Jiaxing 314199, China
4
Department of Epidemiology, School of Public Health, Zhejiang Chinese Medical University, Hangzhou 310053, China
*
Authors to whom correspondence should be addressed.
These authors contributed equally to this work.
Nutrients 2025, 17(5), 893; https://doi.org/10.3390/nu17050893
Submission received: 10 February 2025 / Revised: 27 February 2025 / Accepted: 27 February 2025 / Published: 3 March 2025
(This article belongs to the Section Nutrition and Public Health)

Abstract

:
Background: Addressing high-salt diets in China through interventions can significantly reduce blood pressure (BP) and the associated health risks. Objective: This study aims to evaluate the effectiveness of a comprehensive salt reduction intervention implemented across counties in Zhejiang Province, focusing on system establishment, extensive publicity, and targeted population interventions. Methods: The Salt Reduction and Hypertension Prevention Project was initiated in Zhejiang Province. Cross-sectional surveys were conducted before the intervention and after. The research commenced in 2017 with a baseline survey involving 7512 participants from five counties. Four counties were randomly selected for the intervention, implementing a multifaceted salt reduction strategy, while one county served as a reference without any intervention. The primary outcomes measured were changes in BP and 24 h urinary sodium and potassium excretion. Results: Following the intervention, 24 h urinary potassium excretion experienced a significant increase, rising from 1441.3 (SD 681.9) to 1676.9 (SD 931.4) mg per day, p < 0.001. Utilizing a linear mixed-effects model, the adjusted net difference in urinary sodium changes was calculated to be 394.1 mg per day (95% CI, 133.2 to 655.0) (p = 0.003). There was a notable reduction in systolic blood pressure (SBP) from 131.2 (SD 19.2) to 129.8 mmHg (SD 18.0), and diastolic blood pressure (DBP) also decreased from 80.8 (SD 10.8) to 78.9 mmHg (SD 10.2), p < 0.001. The adjusted net differences for SBP and DBP between the intervention and reference groups were 1.3 (95%CI, 0.5 to 2.1) and 1.4 mmHg (95%CI, 0.9 to 2.0), respectively, p < 0.001. Conclusions: The findings indicate that a multi-sectoral approach, combined with extensive public awareness initiatives and precisely targeted interventions, can significantly increase urinary potassium excretion and reduce sodium and blood pressure.

1. Background

Hypertension stands as one of the leading preventable global risk factors contributing to cardiovascular disease and premature mortality [1]. In China, hypertension and prehypertension are highly prevalent and rising. A national survey (2012–2015) found 292 million adults (27.8% of the population) had hypertension, and 435.3 million had prehypertension [2]. The causality and the linear relationship between sodium intake and the risks of elevated blood pressure (BP) and cardiovascular disease have been firmly established. The Global Burden of Disease Study estimated that dietary sodium intake contributed to approximately 1.8 million deaths globally in 2019, primarily due to cardiovascular diseases. Reducing sodium intake is not only crucial for managing hypertension, but also for reducing the incidence and prevalence of cardiovascular diseases, thereby lowering mortality and improving overall population health. With an average daily salt intake of 9.3 g, the Chinese population consumes nearly double the amount recommended (less than 5 g per day) by the World Health Organization (WHO), highlighting the pressing need for significant dietary changes to reduce hypertension risk. Each nation has developed its own strategies for sodium reduction [3]. In 2013, the WHO set an ambitious global target aimed at achieving a 30% reduction in the mean population sodium intake by 2025. Subsequently, in 2017, the State Council of China pledged to reduce residents’ salt intake by 20% by the year 2030. In China, where salt consumption is among the highest globally, altering individuals’ dietary habits poses a significant challenge, making the reduction in salt intake a formidable task [4]. There is a close relationship between salt intake and 24 h urinary sodium excretion. The 24 h urinary sodium excretion is considered the “gold standard” for assessing salt intake, as it directly reflects the actual absorption and excretion of sodium in the body. The entrenched long-term preference for high-salt food among residents, coupled with the unsustainable approaches to salt reduction employed by various organizations, has resulted in only modest progress in curbing sodium intake.
Since 2017, the Salt Reduction and Hypertension Prevention Project (SRHPP) in Zhejiang Province, China, has been designing and executing a suite of initiatives under the auspices of the China Center for Disease Control and Prevention (CDC). These include public health education, a salt reduction campaign with extensive media outreach, community-based initiatives targeting hypertensive patients and high-risk groups, and pilot programs in schools, institutions, and food service settings. These intervention strategies are exclusively rolled out in the designated intervention counties and districts, with a reference district/county set up for comparison. Consequently, the SRHPP’s research is focused on establishing a county-level randomized controlled trial that develops systematic intervention measures and protocols for salt reduction. These are intended to leverage existing operational models and platforms, with the potential for national or even global dissemination. Both baseline and follow-up surveys are being conducted within the project areas with the goal of assessing the impact of the salt reduction measures. This study seeks to determine whether the implemented interventions correlate with a reduction in both sodium intake and BP among the populace.

2. Methods

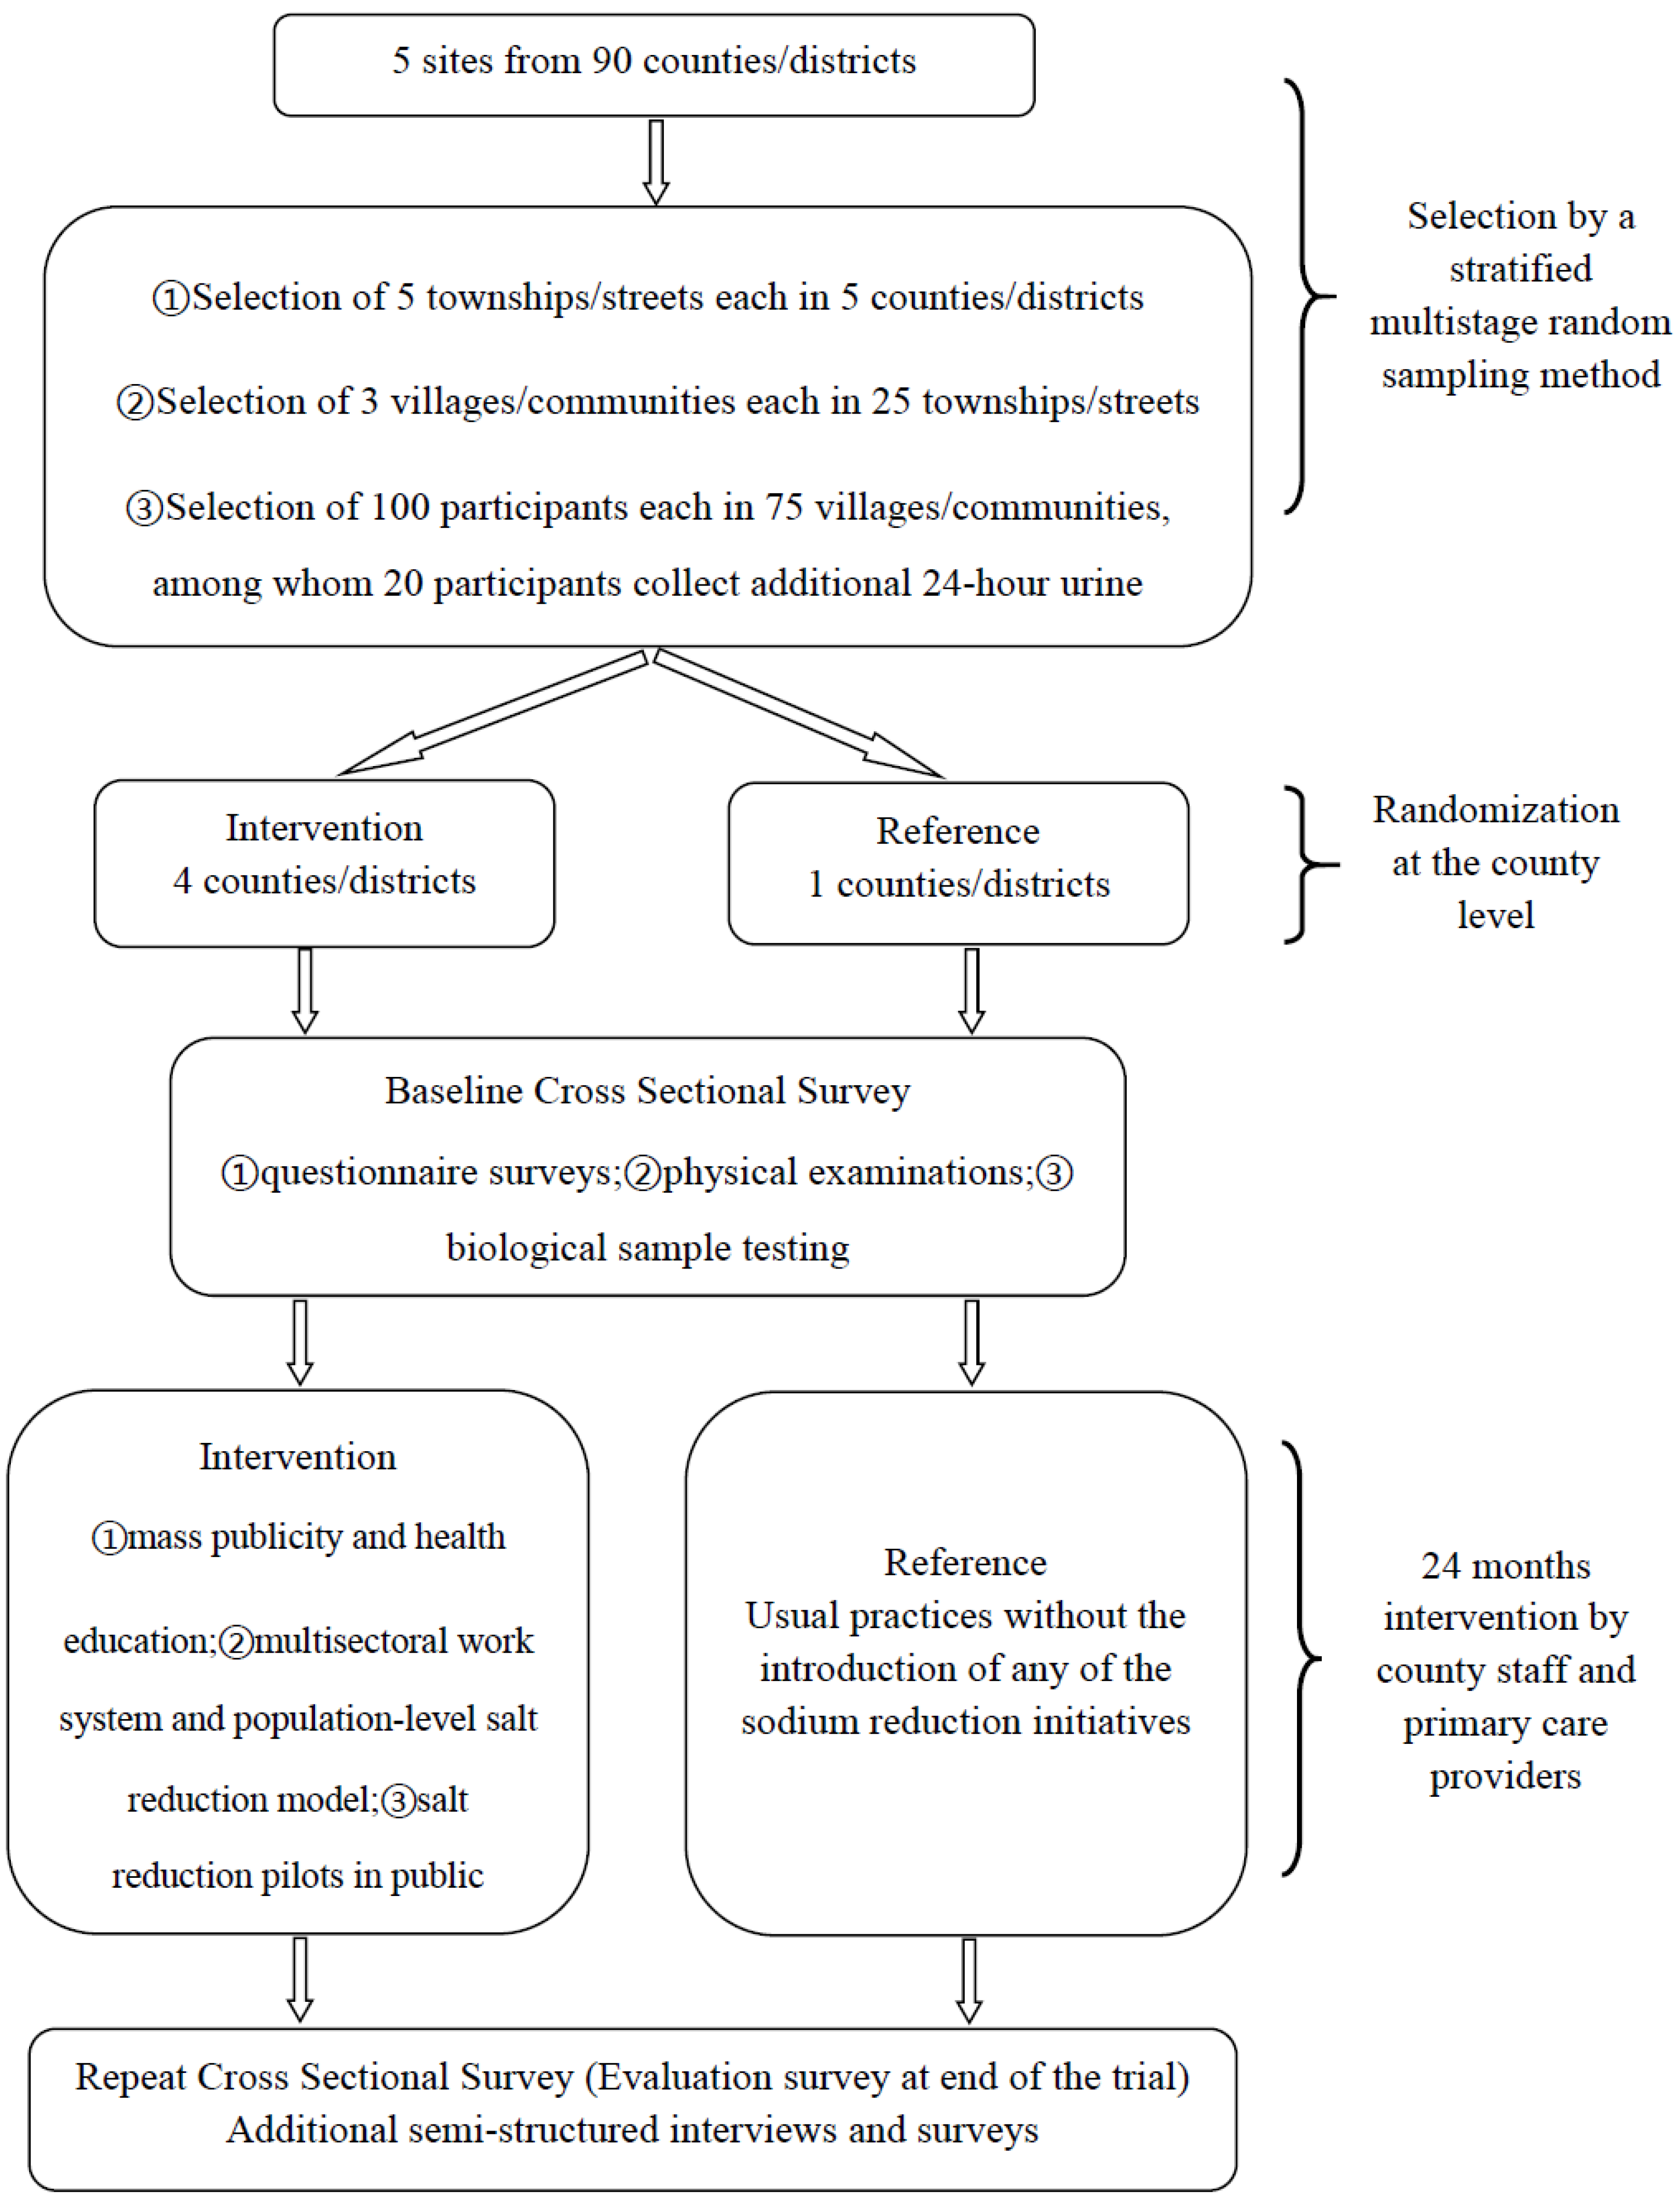
2.1. Study Setting and Overall Design

The SRHPP is crafted as a cluster randomized controlled trial (RCT), initiated in January 2017 and concluded by the end of 2021. The study encompasses a baseline cross-sectional survey and a terminal effectiveness evaluation across all sites, with equitable representation from both intervention and reference clusters. During the interval between these two surveys, a comprehensive salt reduction intervention was implemented exclusively in the intervention group, spanning a duration of 24 months. This study hypothesizes that extensive salt reduction interventions will lower participants’ daily salt intake to WHO-recommended levels, reducing their BP.
To ensure representativeness, five counties (districts) were selected from Zhejiang Province’s 90 counties, covering different regions. Then, using proportional probability sampling, five towns (rural) or streets (urban) were chosen from each county based on household registration type. Next, three villages or communities were selected from each sampled township or street. The project covered 75 villages or communities in total. From each, 100 adults aged 18–69 were randomly selected. In 2017, 7512 adults were included, with 1496 selected for 24 h urine tests [5]. In 2021, there were 6010 participants for exams/interviews and 1300 for urine data collection.
In accordance with the principles of randomized parallel controlled trials, five pilot sites were allocated by random sequence method to either the intervention group or the reference group with a ratio of 4:1. Absolute geographical separation ensured minimal cross-contamination between the sites. Ultimately, Yiwu City, Haining City, Taishun County, and Yinzhou District of Ningbo City were designated as intervention areas, while the Liandu District of Lishui City served as the reference area with no intervention. Randomization took place following the collection of baseline data, ensuring that those involved in recruitment and baseline surveys, as well as local investigators, remained unaware of the group assignments until the commencement of the intervention. The intervention measures were spearheaded by county investigators with the backing of local health institutions, and were implemented at the county and town levels. The intervention spanned a period of 24 months. The reference group maintained its routine practices without the introduction of any sodium reduction initiatives, resulting in minimal exposure to efforts aimed at achieving individual or population-wide salt reduction. The effectiveness of the intervention was assessed after its completion (i.e., endpoint assessment). The study was approved by the Ethics Review Committee of Zhejiang Provincial CDC, and written consent was obtained from all participants. A detailed study flowchart is depicted in Figure 1.
The preintervention and postintervention surveys were granted approval by the Ethics Committees of the Zhejiang Provincial Center for Disease Control and Prevention. The trial’s methodology and findings are reported in compliance with the CONSORT (Consolidated Standards of Reporting Trials) guidelines, as illustrated in Supplemental Figure S1. The trial has been duly registered with the China Clinical Trial Registry (ChiCTR2000033349). To date, the project has successfully concluded the baseline survey and intervention phase of the trial, adhering to the content as registered. Subsequently, the final effectiveness evaluation has been conducted in alignment with the established protocol.
All participants were invited to participate in confidential in-person interviews and physical examinations conducted at the central office of each community or village. The survey system was designed to gather comprehensive data, encompassing demographic characteristics, general health status, knowledge, attitudes, and behaviors (KABs) pertaining to dietary sodium intake, as well as physical measurement indicators such as BP and 24 h urinary sodium (24-hUNa) and potassium (24-hUKa) excretion [6]. All procedures, including questionnaire surveys, physical examinations, and biological specimen testing, were performed in strict adherence to pertinent guidelines and regulations. The interviews were conducted by trained interviewers who ensured a consistent and standardized approach throughout the process. The determination of the sample size, along with comprehensive details about participant recruitment, BP measurement protocols, urine sample collection, and analytical processes, and the enforcement of quality control measures, was meticulously detailed in the relevant literature [7]. Additionally, a questionnaire pertaining to knowledge, attitudes, and behaviors regarding salt intake is presented in Supplemental Table S1.

2.2. Intervention

The SRHPP adopted a multi-sectoral approach, collaborating with stakeholders like the education sector, trade unions, women’s associations, propaganda departments, and food and drug regulators to form a coordinated work pattern, establishing long-term systems for salt reduction.
The program launched a broad public awareness campaign on salt reduction, covering health impacts of salt, risks of excessive intake, salt sources, low-sodium alternatives, salt-limiting strategies, and debunking salt-related myths. It used diverse media, including TV, radio, print, Weibo, WeChat, and Tiktok, to spread knowledge and skills, also utilizing public transportation, stations, and digital screens.
A comprehensive salt reduction model was established, with communities in intervention areas providing low-salt diet information through billboards, posters, illustrations, and leaflets. They organized educational seminars and community activities via village or neighborhood committees, and provided residents with salt-restricting spoons and personal guidance on monitoring and reducing household salt intake.
The project also disseminated salt reduction information through posters, leaflets, banners, and videos in community health services under township hospitals and village clinics. Medical staff in intervention areas were trained on salt and hypertension, and primary healthcare institutions targeted pre-hypertensive individuals and those with hypertension or vascular diseases. They implemented interventions including follow-up, monitoring, and dietary advice, offering tailored guidance on dietary habits and hypertension-related risk factors, and distributed low-salt diet manuals to residents’ families.

2.3. Outcomes and Outcome Assessment

The primary outcomes measured were the changes in BP and 24-hUNa and 24-hUKa excretion levels from 2017 to 2021. Secondary outcomes included changes in KABs related to salt consumption. Both the intervention and reference groups underwent parallel evaluations using identical methodologies. Throughout the trial, from the initial baseline to its conclusion, comparisons were made between the intervention and reference groups to assess differences in the changes in 24-hUNa and 24-hUKa excretion, BP, and KABs related to salt. These comparisons aimed to evaluate the impact of the intervention on these key indicators.

2.4. Statistical Analysis

We utilized multivariable regression models to assess the variances in 24-hUNa and 24-hUKa levels, the sodium-to-potassium ratio, and blood BP between the surveys conducted in 2017 and 2020. The net differences between the intervention and reference groups were evaluated using a linear mixed-effects model [8]. To determine the difference in the prevalence of correct KABs regarding salt intake and hypertension management between the two groups, we employed a generalized linear mixed-effects model with two-sided tests at a 5% significance level. In a subsequent analysis, we adjusted for significant covariates including age, sex, education level, history of antihypertensive medication use, baseline body mass index, and baseline systolic (or diastolic) blood pressure (SBP, DBP), as well as 24-hUNa and 24-hUKa excretion levels. All statistical tests were two-tailed, with a p-value of less than 0.05 deemed to indicate statistical significance. The analyses were conducted using SPSS version 26.0 (IBM Corporation, Armonk, NY, USA).

3. Results

3.1. Descriptive Statistics

In the baseline survey conducted in 2017, a cohort of 7512 participants had an average age of 44.8 years (standard deviation [SD], 14.0), with 3745 individuals (49.3%) identifying as male. The average SBP recorded was 129.5 mmHg (SD 19.0), while the average DBP was 80.4 mmHg (SD 10.9). Within the intervention group, the average age was marginally higher, at 46.5 years (SD 13.7), with a gender distribution that was evenly split at 50.0% male. This group’s average SBP was 131.2 mmHg (SD 19.2), and the average DBP was 80.8 mmHg (SD 10.8). Among the 1496 participants who provided complete 24 h urine samples, the overall average 24-hUNa level was measured at 3849.5 mg per day (SD 1661.1), and the 24-hUKa level averaged 1491.1 mg per day (SD 710.9). For the intervention group specifically, the average 24-hUNa level was slightly lower at 3701.0 mg per day (SD 1641.8), with the 24-hUKa level being 1441.3 mg per day (SD 681.9).
The baseline characteristics of both the intervention and reference groups were comparable. Following the intervention—during which the reference group did not adopt any salt reduction strategies—there was a notable decrease in the intervention group’s SBP, from 131.2 (SD 19.2) to 129.8 mmHg (SD 18.0), and in DBP, which decreased from 80.8 (SD 10.8) to 78.9 mmHg (SD 10.2), p < 0.001. Furthermore, the 24-hUNa levels in the intervention group dropped from 3701.0 (SD 1641.8) to 3615.1 mg per day (SD 1788.9), p = 0.24, while the 24-hUKa levels rose from 1441.3 (SD 681.9) to 1676.9 (SD 931.4) mg per day, p < 0.001. Within the reference group, SBP saw a significant increase, while DBP showed a minor decline without statistical significance (refer to Table 1 for details).

3.2. Changes in SBP, DBP, Sodium, and Potassium Excretion

Mean SBP and DBP in the intervention group showed a decrease of 1.4 mmHg (95% confidence interval [CI] 0.9 to 1.8) and 1.8 mmHg (95%CI, 1.5 to 2.1), respectively, from the baseline to the final assessment, p < 0.001. In contrast, the reference group experienced a significant increase of 0.9 mmHg (0.0 to 1.8) in SBP and a non-significant decrease of 0.2 mmHg (−0.4 to 0.8) in DBP. Using a linear mixed-effects model, the adjusted net differences for SBP and DBP between the intervention and reference groups were 1.3 (95%CI, 0.5 to 2.1) and 1.4 mmHg (95%CI, 0.9 to 2.0), respectively, p < 0.001. Using a linear mixed-effects model, the adjusted net difference in urinary sodium changes between the intervention and reference groups was 394.1 mg per day (95%CI, 133.2 to 655.0), p = 0.003 (as detailed in Table 2).
This study conducted stratified analyses based on blood pressure categories, including normotension, prehypertension, and hypertension, as detailed in Supplemental Table S2. It was observed that the most significant changes in SBP and DBP were noted in hypertensive patients, with adjusted net differences between the intervention and reference groups being 2.0 (95%CI, 0.9 to 3.1) and 2.2 mmHg (95%CI, 1.2 to 3.2), respectively, following the intervention. The primary alteration in 24-hUNa excretion was observed among individuals with normal blood pressure, with a decrease of 307.4 mg per day (95%CI, 14.3 to 600.5) postintervention. The adjusted net difference between the two groups was 701.4 mg per day (95%CI, 233.8 to 1168.9). Changes in 24-hUKa excretion were predominantly seen in participants with normal blood pressure and those with hypertension, with adjusted net differences of 244.6 mg per day (95%CI, 3.1 to 486.0) and 246.9 mg per day (95%CI, 30.8 to 463.0), respectively.

3.3. Changes in Knowledge, Attitudes, and Behaviors Associated with Sodium Reduction

KABs in the intervention group saw a significant increase postintervention, with the differences being statistically significant, p < 0.001. In the reference group, only a few differences reached statistical significance. The discrepancies between the intervention and reference group was predominantly positive, signifying that the intervention group exhibited a higher growth rate in KABs compared to the reference group. A larger net difference indicates a more pronounced intervention effect. The generalized linear mixed model results demonstrate that participants in the intervention group had a higher likelihood of improving their KABs relative to the reference group, with odds ratios ranging from 1.12 to 1.74, all p < 0.05 (as shown in Table 3).

4. Discussion

In line with the WHO’s global target for sodium reduction, all member nations have implemented national strategies and initiatives to decrease salt consumption. Countries like the United States, New Zealand, and Thailand have established concrete goals for sodium reduction [9,10,11,12]. In China, salt intake decreased from 10.5g in 2012 to 9.3g in 2018 [13]. Shandong Province’s salt reduction initiative led to a 24.8% drop in sodium intake over five years, easing the rise in SBP and DBP [14]. Consequently, the upward trend in both SBP and DBP has been mitigated and reduced. Unlike developed countries where most sodium comes from processed foods, 75.8% of China’s salt intake is from household cooking [15]. Considering the characteristically high dietary salt intake in China, a comprehensive suite of preventive measures should be rigorously implemented to restrict salt consumption [16]. The SHRPP research emphasizes a family-based salt reduction approach, including distributing salt-restricting spoons and low-sodium salt, and improving the primary cook’s knowledge and skills through materials and lectures. The baseline survey shows that using salt-restricting spoons is linked to lower sodium intake and BP [17]. As a pivotal strategy for reducing BP, low-sodium salt is instrumental in both the reformulation of processed foods and the curtailment of salt intake in households [18]. However, it carries the potential risk of exacerbating hyperkalemia, particularly among individuals with conditions that compromise potassium excretion, such as chronic kidney disease. The RCT research conducted in China further demonstrates the extensive application potential of low-sodium salt [19]. Concurrently, Chinese researchers have formulated guidelines for the utilization and promotion of low-sodium salt within the country, which are designed to offer expert recommendations on the promotion and application of low-sodium salt in China [20]. The findings of this study also indicate that the awareness and utilization of low-sodium salt are indeed beneficial for BP control.
A reduction in sodium intake at the population level is correlated with a corresponding decrease in BP. Our findings align with those from other studies, especially regarding the more significant reduction in SBP. For example, a meta-analysis has shown that, for every 1725 mg decrease in daily sodium intake, there is a corresponding reduction in SBP by 4.1 mmHg [21,22]. However, some studies present divergent results. In the Shandong–Ministry of Health Action on Salt and Hypertension (SMASH) program, despite a certain decrease in salt intake, the reduction in both SBP and DBP was less pronounced [14]. This inconsistency might be due to the stronger correlation of DBP with environmental and risk factors. Our study also observed a slight but statistically significant increase in SBP in the reference group (p < 0.05), which suggests the natural progression of BP increase with age. The change in DBP was not statistically significant. After the intervention, the BP in the intervention group exhibited a decrease, indicating that the measures implemented were effective in reducing BP, even when considering age-related and environmental factors.
Boosting potassium intake while cutting sodium is crucial for lowering BP, especially in high-sodium consumers who benefit more from potassium’s BP-lowering effect [5,18,23]. Notably, research has shown that replacing regular table salt with healthier alternatives can result in a decreased incidence of hypertension among elderly Chinese individuals with normal BP [19]. This dietary shift does not seem to elevate the risk of developing hypotension. Our study indicates that participants in the intervention group increased their potassium intake following the intervention, a factor associated with the observed reduction in blood pressure across the population. The ratio of sodium to potassium, a well-established indicator for assessing the effectiveness of intervention strategies, has been significantly high in China, nearly reaching five. The reduction rate of 1.2 achieved in this study is indicative of the substantial positive effects of our comprehensive interventions, which were designed to decrease sodium consumption and enhance potassium supplementation.
In this study, sodium intake in the intervention area did not exhibit a significant change before and after the intervention. A nationally representative cross-sectional survey conducted in 2015 revealed that the overall weighted average for 24-hUNa excretion for adults in China was 4121 mg per day [13]. Our study measured an overall average 24-hUNa level of 3849.5 mg/day, with the intervention group’s baseline level at 3701.0 mg/day, both below the national average. Concurrently, the average sodium intake for American adults during the same period was 3608 mg per day [24]. This comparison underscores the difficulty in reducing salt intake in this region, and suggests that the potential for further reduction may be limited. Furthermore, the process of adopting sodium reduction behaviors and the associated behavioral changes among individuals with a high-sodium diet is often iterative and variable. It is likely that, in the middle and late stages of the intervention, the emphasis on salt reduction interventions may need to be intensified. Moreover, this study noted a pronounced change in sodium salt levels among individuals with normal BP, in contrast to the more noticeable changes in BP among those with hypertension. This discrepancy may be due to hypertensive patients’ reliance on antihypertensive medications and a disregard for dietary factors. Adhering to medication is perceived as more straightforward than reducing sodium intake, a critical yet often overlooked strategy for lowering blood pressure. A significant reduction in sodium intake over a brief period was associated with positive blood-pressure-lowering effects; however, such outcomes may be more readily achievable in community trials [25].
Previous studies have shown that acquiring comprehensive knowledge and adopting dynamic measures can markedly decrease the likelihood of developing hypertension, including for individuals who have already reached a prehypertensive state [26]. There exists a significant opportunity to elevate the Chinese population’s awareness and practices concerning salt consumption. This study reveals a strong linkage, indicating that an informed and proactive stance on KABs can effectively decrease sodium levels and augment potassium intake, notably the latter, which is essential in preventing the advancement of hypertension. The value of beliefs within the KAB framework deserves full recognition and enhancement, on par with the advancement of knowledge and the encouragement of active behaviors [27]. This research provides vital evidence and insights, supporting China’s efforts to reduce salt intake and prevent hypertension.
This study represents a large-scale population intervention study focused on key outcome indicators: BP and sodium intake. The 24-hUNa measurement is regarded as a precise method for assessing sodium consumption. Additionally, this study implemented standardized protocols for urine collection, measurement, and inclusion criteria, along with rigorous on-site quality control. In this research, a reference group was established to assess the efficacy of the intervention strategies. As secondary outcomes, KABs related to salt intake were examined, which can effectively elucidate the effectiveness of the intervention and any changes in the primary outcomes. The findings of this study demonstrate that a multi-sectoral approach, combined with extensive public awareness initiatives and precisely targeted interventions, can significantly reduce sodium intake and blood pressure. These results have important implications for public health policy. The strategies employed in this study, such as distributing salt restriction spoons, promoting low-sodium salt, and enhancing community-based education, can be replicated and scaled up in other regions. Furthermore, the establishment of enduring systems and mechanisms for salt reduction can contribute to long-term sustainability and broader population health improvements.
However, our study has certain limitations. Due to its high degree of randomness, the random sequence method may not effectively control known confounding factors, thereby affecting the accuracy and reliability of the study results. In both surveys, a single instance of 24 h urine was collected instead of multiple samples over different days. Due to variations in sodium intake influenced by diet, exercise, and other factors, the 24-hUNa measurements could be subject to instability [28]. To capture these daily variations accurately, multiple urine collections over several days are essential [29]. Research exploring the potential of single-day measurements, combined with external variables, to predict habitual salt intake distribution appears to be a promising approach [30]. Furthermore, the two-year duration of the intervention may have been influenced by other public health services and disease-related changes that could impact behaviors, thereby affecting BP and the levels of urine sodium. The absence of monitoring data for sodium and potassium excretion, as well as blood pressure, throughout the intervention period poses challenges in interpreting the research findings and distilling the intervention strategies.

5. Conclusions

The SRHPP program demonstrates that multi-sectoral collaboration, extensive public awareness campaigns, and targeted intervention strategies can effectively lead to an increase in 24-hUKa excretion and a decrease in 24-hUNa excretion and BP. Concurrently, there is a significant enhancement in the level of KABs related to salt intake. This offers valuable insights and inspiration for developing population-based salt reduction interventions aimed at the prevention and management of cardiovascular and cerebrovascular diseases.

Supplementary Materials

The following supporting information can be downloaded at: https://www.mdpi.com/article/10.3390/nu17050893/s1, Figure S1: Flow of participants through the SRHPP trial; Table S1: Questionnaire about knowledge, attitudes and behaviors related to salt, SRHPP 2017–2021; Table S2: Adjusted net systolic and diastolic blood pressure, 24-h urinary sodium and potassium excretion between intervention and reference group across various hypertension conditions in SRHPP from 2017 to 2021.

Author Contributions

The authors’ responsibilities were as follows: J.Z. (Jieming Zhong): study concept and design; M.W. and J.Z. (Jieming Zhong): resources and supervision; X.C., C.X., F.L. and J.Z. (Jie Zhang): acquisition of data; X.D., Y.Z. and J.G.: analysis and interpretation of data; X.D. and M.L.: drafting of the manuscript; Y.L. and J.Z. (Jieming Zhong): critical revision of the manuscript for important intellectual content. All authors have read and agreed to the published version of the manuscript.

Funding

This research was assisted by Noncommunicable Chronic Diseases-National Science and Technology Major Project (2023ZD0509800 and 2023ZD0509806) and Medical Science and Technology Project of Zhejiang Province (2022PY046).

Institutional Review Board Statement

The study was conducted in accordance with the Declaration of Helsinki, and approved by the Ethics Review Committee of Zhejiang Provincial CDC (protocol code: 2019056 and date: 30 December 2019).

Informed Consent Statement

Informed consent was obtained from all subjects involved in the study. Written informed consent has been obtained from the patients to publish this paper.

Data Availability Statement

The datasets utilized in this study are not accessible to the public due to intellectual property restrictions; however, they may be obtained from the corresponding author upon a legitimate request.

Acknowledgments

The authors express their gratitude to the China CDC, as well as the county-level CDCs and grassroots healthcare facilities across the various project locations in Zhejiang, for their guidance and assistance. Our deepest appreciation goes to all the participants for their enthusiasm and commitment to the study. Additionally, we extend our thanks to RESOLVE (Resolve to Save Lives) and the Welch Center for Prevention, Epidemiology, and Clinical Research at the Johns Hopkins Bloomberg School of Public Health for providing the invaluable opportunities for learning and exchange.

Conflicts of Interest

The authors declare that they have no competing interests.

Abbreviations

BMIbody mass index;
BPblood pressure;
CDCCenter for Disease Control and Prevention;
CIconfidence interval;
CVDcardiovascular diseases;
DBPdiastolic blood pressure;
KABsknowledge, attitudes, and behaviors;
ORodds ratio;
RCTrandomized controlled trial;
SBPsystolic blood pressure;
SDstandard deviation;
SMUsecond morning urine;
SRHPPSalt Reduction and Hypertension Prevention Project;
SUspot urine;
WHOWorld Health Organization;
24-hUKa24 h urinary potassium;
24-hUNa24 h urinary sodium.

References

  1. NCD Risk Factor Collaboration. Worldwide trends in hypertension prevalence and progress in treatment and control from 1990 to 2019: A pooled analysis of 1201 population-representative studies with 104 million participants. Lancet 2021, 398, 957–980. [Google Scholar] [CrossRef]
  2. Wang, Z.; Chen, Z.; Zhang, L.; Wang, X.; Hao, G.; Zhang, Z.; Shao, L.; Tian, Y.; Dong, Y.; Zheng, C.; et al. Status of Hypertension in China: Results from the China Hypertension Survey, 2012–2015. Circulation 2018, 137, 2344–2356. [Google Scholar] [CrossRef]
  3. Trieu, K.; Neal, B.; Hawkes, C.; Dunford, E.; Campbell, N.; Rodriguez-Fernandez, R.; Legetic, B.; McLaren, L.; Barberio, A.; Webster, J. Salt Reduction Initiatives around the World—A Systematic Review of Progress towards the Global Target. PLoS ONE 2015, 10, e0130247. [Google Scholar] [CrossRef] [PubMed]
  4. Tan, M.; He, F.J.; Wang, C.; MacGregor, G.A. Twenty-Four-Hour Urinary Sodium and Potassium Excretion in China: A Systematic Review and Meta-Analysis. J. Am. Heart Assoc. 2019, 8, e012923. [Google Scholar] [CrossRef] [PubMed]
  5. Du, X.; Fang, L.; Xu, J.; Chen, X.; Bai, Y.; Zhong, J. Association between 24-h urinary sodium and potassium excretion and blood pressure among Chinese adults aged 18–69 years. Sci. Rep. 2021, 11, 3474. [Google Scholar] [CrossRef] [PubMed]
  6. Du, X.; Guo, J.; Chen, X.; Zhang, J.; Lu, F.; Zhong, J. Calibration of 24-h urinary sodium excretion estimates from fasting morning urine in Chinese populations: A comparative analysis of 2 calibration models and a locally developed model. Am. J. Clin. Nutr. 2024, 120, 943–952. [Google Scholar] [CrossRef]
  7. Du, X.; Fang, L.; Xu, J.; Chen, X.; Zhang, J.; Bai, Y.; Wu, J.; Ma, J.; Yu, M.; Zhong, J. Prevalence, awareness, treatment and control of hypertension and sodium intake in Zhejiang Province, China: A cross-sectional survey in 2017. PLoS ONE 2019, 14, e0226756. [Google Scholar] [CrossRef]
  8. Sun, Y.; Mu, J.; Wang, D.W.; Ouyang, N.; Xing, L.; Guo, X.; Zhao, C.; Ren, G.; Ye, N.; Zhou, Y.; et al. A village doctor-led multifaceted intervention for blood pressure control in rural China: An open, cluster randomised trial. Lancet 2022, 399, 1964–1975. [Google Scholar] [CrossRef]
  9. Odili, A.N.; Chori, B.S.; Danladi, B.; Nwakile, P.C.; Okoye, I.C.; Abdullahi, U.; Zawaya, K.; Essien, I.; Sada, K.; Nwegbu, M.M.; et al. Urinary sodium excretion and its association with blood pressure in Nigeria: A nationwide population survey. J. Clin. Hypertens. 2020, 22, 2266–2275. [Google Scholar] [CrossRef]
  10. Jackson, S.L.; Cogswell, M.E.; Zhao, L.; Terry, A.L.; Wang, C.-Y.; Wright, J.; King, S.M.C.; Bowman, B.; Chen, T.-C.; Merritt, R.; et al. Association Between Urinary Sodium and Potassium Excretion and Blood Pressure Among Adults in the United States. Circulation 2018, 137, 237–246. [Google Scholar] [CrossRef]
  11. Chailimpamontree, W.; Kantachuvesiri, S.; Aekplakorn, W.; Lappichetpaiboon, R.; Sripaiboonkij Thokanit, N.; Vathesatogkit, P.; Kunjang, A.; Boonyagarn, N.; Sukhonthachit, P.; Chuaykarn, N.; et al. Estimated dietary sodium intake in Thailand: A nationwide population survey with 24-hour urine collections. J. Clin. Hypertens. 2021, 23, 744–754. [Google Scholar] [CrossRef] [PubMed]
  12. Eyles, H.; Shields, E.; Webster, J.; Ni Mhurchu, C. Achieving the WHO sodium target: Estimation of reductions required in the sodium content of packaged foods and other sources of dietary sodium. Am. J. Clin. Nutr. 2016, 104, 470–479. [Google Scholar] [CrossRef]
  13. Liu, Z.; Man, Q.; Li, Y.; Yang, X.; Ding, G.; Zhang, J.; Zhao, W. Estimation of 24-hour urinary sodium and potassium excretion among Chinese adults: A cross-sectional study from the China National Nutrition Survey. Am. J. Clin. Nutr. 2024, 119, 164–173. [Google Scholar] [CrossRef]
  14. Xu, A.; Ma, J.; Guo, X.; Wang, L.; Wu, J.; Zhang, J.; Bai, Y.; Xu, J.; Lu, Z.; Xu, Z.; et al. Association of a Province-Wide Intervention With Salt Intake and Hypertension in Shandong Province, China, 2011–2016. JAMA Intern. Med. 2020, 180, 877–886. [Google Scholar] [CrossRef]
  15. Anderson, C.A.M.; Appel, L.J.; Okuda, N.; Brown, I.J.; Chan, Q.; Zhao, L.; Ueshima, H.; Kesteloot, H.; Miura, K.; Curb, J.D.; et al. Dietary Sources of Sodium in China, Japan, the United Kingdom, and the United States, Women and Men Aged 40 to 59 Years: The INTERMAP Study. J. Am. Diet. Assoc. 2010, 110, 736–745. [Google Scholar] [CrossRef]
  16. Anderson, C.A.M.; Cobb, L.K.; Miller, E.R.; Woodward, M.; Hottenstein, A.; Chang, A.R.; Mongraw-Chaffin, M.; White, K.; Charleston, J.; Tanaka, T.; et al. Effects of a behavioral intervention that emphasizes spices and herbs on adherence to recommended sodium intake: Results of the SPICE randomized clinical trial. Am. J. Clin. Nutr. 2015, 102, 671–679. [Google Scholar] [CrossRef] [PubMed]
  17. Du, X.; Zhao, D.; Henry, M.E.; Fang, L.; Xu, J.; Chen, X.; Zhang, J.; Bai, Y.; Wu, J.; Ma, J.; et al. Use of Salt-Restriction Spoons and Its Associations with Urinary Sodium and Potassium in the Zhejiang Province of China: Results of a Population-Based Survey. Nutrients 2021, 13, 1047. [Google Scholar] [CrossRef] [PubMed]
  18. Greer, R.C.; Marklund, M.; Anderson, C.A.M.; Cobb, L.K.; Dalcin, A.T.; Henry, M.; Appel, L.J. Potassium-Enriched Salt Substitutes as a Means to Lower Blood Pressure: Benefits and Risks. Hypertension 2020, 75, 266–274. [Google Scholar] [CrossRef]
  19. Zhang, X.; Yuan, Y.; Li, C.; Feng, X.; Wang, H.; Qiao, Q.; Zhang, R.; Jin, A.; Li, J.; Li, H.; et al. Effect of a Salt Substitute on Incidence of Hypertension and Hypotension Among Normotensive Adults. J. Am. Coll. Cardiol. 2024, 83, 711–722. [Google Scholar] [CrossRef]
  20. Yuan, Y.; Gao, C.; Yin, X.; Zhang, X.; Ji, Y.; Zheng, X.; Zhou, Q.; Wu, Y. The Guidelines for use and promotion of low sodium salt in China. J. Evid. Based Med. 2024, 17, 454–467. [Google Scholar] [CrossRef]
  21. He, F.J.; Li, J.; MacGregor, G.A. Effect of longer term modest salt reduction on blood pressure: Cochrane systematic review and meta-analysis of randomised trials. BMJ 2013, 346, f1325. [Google Scholar] [CrossRef]
  22. Collaborators GCoD. Global burden of 288 causes of death and life expectancy decomposition in 204 countries and territories and 811 subnational locations, 1990–2021: A systematic analysis for the Global Burden of Disease Study 2021. Lancet 2024, 403, 2100–2132. [Google Scholar] [CrossRef]
  23. Neal, B.; Wu, Y.; Feng, X.; Zhang, R.; Zhang, Y.; Shi, J.; Zhang, J.; Tian, M.; Huang, L.; Li, Z.; et al. Effect of Salt Substitution on Cardiovascular Events and Death. N. Engl. J. Med. 2021, 385, 1067–1077. [Google Scholar] [CrossRef]
  24. Cogswell, M.E.; Loria, C.M.; Terry, A.L.; Zhao, L.; Wang, C.Y.; Chen, T.C.; Wright, J.D.; Pfeiffer, C.M.; Merritt, R.; Moy, C.S.; et al. Estimated 24-Hour Urinary Sodium and Potassium Excretion in US Adults. JAMA 2018, 319, 1209–1220. [Google Scholar] [CrossRef] [PubMed]
  25. Gupta, D.K.; Lewis, C.E.; Varady, K.A.; Su, Y.R.; Madhur, M.S.; Lackland, D.T.; Reis, J.P.; Wang, T.J.; Lloyd-Jones, D.M.; Allen, N.B. Effect of Dietary Sodium on Blood Pressure: A Crossover Trial. JAMA 2023, 330, 2258–2266. [Google Scholar] [CrossRef] [PubMed]
  26. Du, X.; Fang, L.; Xu, J.; Chen, X.; Bai, Y.; Wu, J.; Wu, L.; Zhong, J. The association of knowledge, attitudes and behaviors related to salt with 24-h urinary sodium, potassium excretion and hypertensive status. Sci. Rep. 2022, 12, 13901. [Google Scholar] [CrossRef] [PubMed]
  27. Bhana, N.; Utter, J.; Eyles, H. Knowledge, Attitudes and Behaviours Related to Dietary Salt Intake in High-Income Countries: A Systematic Review. Curr. Nutr. Rep. 2018, 7, 183–197. [Google Scholar] [CrossRef]
  28. Wang, C.-Y.; Cogswell, M.E.; Loria, C.M.; Chen, T.-C.; Pfeiffer, C.M.; Swanson, C.A.; Caldwell, C.G.; Perrine, A.L.; Carriquiry, K.; Liu, C.T.; et al. Urinary Excretion of Sodium, Potassium, and Chloride, but Not Iodine, Varies by Timing of Collection in a 24-Hour Calibration Study1–3. J. Nutr. 2013, 143, 1276–1282. [Google Scholar] [CrossRef]
  29. Dennis, B.; Stamler, J.; Buzzard, M.; Conway, R.; Elliott, P.; Moag-Stahlberg, A.; Okayama, A.; Okuda, N.; Robertson, C.; Robinson, F.; et al. INTERMAP: The dietary data—Process and quality control. J. Hum. Hypertens. 2003, 17, 609–622. [Google Scholar] [CrossRef]
  30. Verkaik-Kloosterman, J.; Dekkers, A.L.M.; de Borst, M.H.; Bakker, S.J.L. Estimation of the salt intake distribution of Dutch kidney transplant recipients using 24-h urinary sodium excretion: The potential of external within-person variance. Am. J. Clin. Nutr. 2019, 110, 641–651. [Google Scholar] [CrossRef]
Figure 1. Study design of SRHPP trial.
Nutrients 17 00893 g001
Table 1. Characteristics of participants in intervention and reference groups between preintervention and postintervention surveys a.
CharacteristicIntervention Reference
Preintervention Postinterventionp Value bPreinterventionPostinterventionp Value b
Age, years46.5 (13.7)50.2 (13.8)<0.001 *46.0 (13.8)49.8 (13.7)<0.001 *
Sex 1.00 1.00
Female3001 (50.0%)2518 (52.1%) 765 (50.7%)605 (53.4%)
Male3002 (50.0%)2317 (47.9%) 744 (49.3%)528 (46.6%)
Education 1.00 1.00
Primary school or lower1893 (31.6%)1589 (33.4%) 388 (25.7%)338 (28.3%)
Junior high school2848 (47.5%)2244 (47.1%) 760 (50.4%)580 (48.5%)
College or higher1259 (21.0%)928 (19.5%) 361 (23.9%)278 (23.2%)
Cigarette smoking <0.001 * 0.26
Never smoked4261 (71.0%)3699 (76.9%) 1111 (73.6%)908 (75.8%)
Former smokers266 (4.4%)220 (4.6%) 46 (3.0%)55 (4.6%)
Current smokers1473 (24.6%)893 (18.6%) 352 (23.3%)235 (19.6%)
Alcohol use status1925 (32.1%)1076 (22.4%)<0.001 *549 (36.4%)352 (29.4%)<0.001 *
Physical activity2418 (40.3%)2334 (48.5%)<0.001 *602 (39.9%)517 (43.2%)0.05
Use of antihypertensive medications780 (13.0%)979 (20.3%)<0.001 *181 (12.0%)239 (20.6%)<0.001 *
BMI, kg/m2 0.043 * <0.001 *
Low weight231 (3.8%)187 (3.9%) 53 (3.5%)26 (2.2%)
Normal3048 (50.1%)2429 (50.4%) 726 (48.0%)528 (45.5%)
Overweight2044 (33.6%)1655 (34.3%) 546 (36.1%)426 (36.7%)
Obese679 (11.2%)551 (11.4%) 184 (12.2%)181 (15.6%)
Mean24.0 (3.3)23.9 (3.4)0.05 24.2 (3.4)24.5 (3.5)<0.001 *
SBP, mmHg131.2 (19.2)129.8(18.0)<0.001 *127.0 (18.7)127.8 (17.8)0.049 *
DBP, mmHg80.8 (10.8)78.9 (10.2)<0.001 *80.5 (10.9)80.2 (10.7)0.47
BP status 0.69 <0.001 *
Normal1677 (27.9%)1282 (26.5%) 517 (34.3%)339 (29.0%)
Prehypertension2154 (35.9%)1678 (34.7%) 511 (33.9%)376 (32.2%)
Hypertension2172 (36.2%)1869 (38.7%) 481 (31.9%)453 (38.8%)
Diabetes mellitus428 (7.1%)529 (10.9%)<0.001 *137 (9.1%)150 (12.4%)<0.001 *
24-hUNa excretion, mg/24 h3701.0 (1641.8)3615.1 (1788.9)0.24 4227.0 (1473.7)4149.8 (1770.4)0.58
24-hUKa excretion, mg/24 h1441.3 (681.9)1676.9 (931.4)<0.001 *1726.6 (671.5)2017.2 (783.5)<0.001 *
Sodium-to-potassium ratio4.8 (2.2)3.6 (1.7)<0.001 *4.6 (2.2)4.2 (1.9)0.031 *
a Data are mean (SD) n (%) unless otherwise stated. b p value for difference between preintervention and postintervention based on paired-sample t test for continuous variable and χ2 test for categorical variable. * p < 0.05. Abbreviations: BMI: body mass index; BP: blood pressure; DBP: diastolic blood pressure; SBP: systolic blood pressure; SD: standard deviation; 24-hUKa: 24 h urinary potassium; 24-hUNa: 24 h urinary sodium.
Table 2. Adjusted net systolic and diastolic blood pressure and 24 h urinary sodium and potassium excretion between intervention and reference group in SRHPP from 2017 to 2021.
Mean Change (95%CI) aNet Difference (95%CI) bp ValueAdjusted Net Difference (95%CI) cp Value
Interventionp ValueReferencep Value
Change in SBP, mmHg1.4 (0.9 to 1.8)<0.001 *−0.9 (−1.8 to −0.0)0.049 *2.3 (1.3 to 3.3)<0.001 *1.3 (0.5 to 2.1)<0.001 *
Change in DBP, mmHg1.8 (1.5 to 2.1)<0.001 *0.2 (−0.4 to 0.8)0.47 1.6 (0.9 to 2.2)<0.001 *1.4 (0.9 to 2.0)<0.001 *
Change in 24−hUNa excretion, mg85.9 (−57.7 to 229.5)0.24 77.3 (−195.9 to 350.4)0.58 8.6 (−309.2 to 326.4)0.96 394.1 (133.2 to 655.0)0.003 *
Change in 24−hUKa excretion, mg−235.5 (−304.0 to −167.1)<0.001 *−290.6 (−420.6 to −160.5)<0.001 *55.0 (−96.7 to 206.7)0.48 240.9 (108.2 to −373.6)<0.001 *
a Change refers to the difference from baseline to terminal investigation. b Unadjusted net difference. c Adjusted for age, sex, education, history of antihypertensive treatment, baseline body mass index, systolic (or diastolic) blood pressure, and 24-hUNa, 24-hUKa excretion. * p < 0.05. Abbreviations: CI: confidence interval; DBP: diastolic blood pressure; SBP: systolic blood pressure; 24-hUKa: 24 h urinary potassium; 24-hUNa: 24 h urinary sodium.
Table 3. Knowledge, attitudes, and behaviors associated with sodium reduction in SRHPP from 2017 to 2021.
Proportion (%)Net Difference (%) aAdjusted OR (95%CI) bp Value
InterventionReference
Preintervention (d1)Postintervention (d2)p ValuePreintervention (d3)Postintervention (d4)p Value
Knowledge
Know the diagnostic criteria of hypertension50.3 65.1 <0.001 *64.8 68.4 0.13 11.1 1.45 (1.33 to 1.59)<0.001 *
Know the hazards of hypertension72.9 84.9 <0.001 *81.1 87.1 <0.001 *6.0 1.36 (1.20 to 1.53)<0.001 *
Know the risk factors of hypertension78.2 88.6 <0.001 *84.2 90.0 <0.001 *4.6 1.27 (1.11 to 1.45)<0.001 *
Know less than 6 g salt per day35.2 57.5 <0.001 *53.7 59.4 0.01 *16.6 1.57 (1.43 to 1.72)<0.001 *
Know that eating less salt lowers blood pressure63.3 79.8 <0.001 *75.4 82.6 <0.001 *9.3 1.48 (1.33 to 1.64)<0.001 *
Know the hazards of high salt69.3 85.4 <0.001 *78.3 87.7 <0.001 *6.6 1.37 (1.22 to 1.54)<0.001 *
Know what kind of people should eat a low-salt diet78.0 91.8 <0.001 *84.8 91.7 <0.001 *6.8 1.28 (1.12 to 1.46)<0.001 *
Know how to use salt restriction spoon correctly8.1 32.3 <0.001 *11.5 21.0 <0.001 *14.7 1.32 (1.17 to 1.49)<0.001 *
Know low-sodium salt29.0 44.6 <0.001 *34.1 43.5 <0.001 *6.1 1.02 (0.93 to 1.12)0.61
Know that low-sodium salt helps control blood pressure19.6 35.9 <0.001 *25.6 36.0 <0.001 *5.9 1.10 (1.00 to 1.22)0.049 *
Attitude
Evaluate whether low-salt diet affects taste of food <0.001 * 0.87 1.35 (1.24 to 1.47)<0.001 *
Great influence11.4 9.8 12.5 12.6 −1.7
Has some influence, but can accept62.1 58.8 65.9 65.8 −3.1
No effect26.5 31.3 21.6 21.6 4.8
Approve that low-salt diet should be promoted among the crowd86.4 93.2 <0.001 *89.9 92.7 0.04 *3.9 1.14 (0.98 to 1.32)0.09
Approve of low-salt diet87.8 91.8 <0.001 *89.7 90.5 0.75 3.2 1.01 (0.88 to 1.16)0.90
Approve of the nutrition labeling of prepackaged food74.9 77.3 <0.001 *75.8 76.0 0.57 2.2 1.11 (1.00 to 1.23)0.06
Approve that the nutrition labeling of prepackaged food will help to choose low-salt diet72.3 76.3 <0.001 *74.0 75.4 0.09 2.7 1.06 (0.96 to 1.17)0.28
Behavior
Self-assessment salt level <0.001 * 0.26 1.74 (1.61 to 1.89)<0.001 *
Not much31.3 35.5 17.2 18.6 2.8
Moderate50.2 53.9 63.7 64.2 3.2
Excessive18.5 10.5 19.2 17.2 −6.1
Received publicity or education on low-salt diet45.8 64.2 <0.001 *61.7 72.2 <0.001 *7.9 1.68 (1.53 to 1.83)<0.001 *
Once promoted low-salt diet knowledge to people68.0 57.9 <0.001 *72.3 63.1 0.33 −0.9 1.17 (1.06 to 1.30)0.003 *
Pay attention to the nutrition label of prepackaged food20.6 31.0 <0.001 *28.3 32.3 0.10 6.4 1.20 (1.09 to 1.33)<0.001 *
Plan to reduce salt78.0 90.3 <0.001 *78.2 87.3 <0.001 *3.2 1.14 (1.02 to 1.28)0.02 *
Take initiative to reduce salt58.2 70.6 <0.001 *58.6 66.2 <0.001 *4.8 1.12 (1.02 to 1.22)0.02 *
Using or used salt restriction spoon11.1 39.0 <0.001 *15.3 24.0 <0.001 *19.1 1.37 (1.22 to 1.53)<0.001 *
Using salt restriction spoon correctly5.1 26.0 <0.001 *7.4 16.5 <0.001 *11.8 1.36 (1.19 to 1.56)<0.001 *
Using or used low-sodium salt15.0 21.8 <0.001 *18.5 21.0 0.19 4.3 1.04 (0.93 to 1.17)0.45
a Net difference means (d2–d1) minus (d4–d3). b Adjusted for age, sex, education, history of antihypertensive treatment, baseline body mass index, systolic (or diastolic) blood pressure, and 24-hUNa and 24-hUKa excretion. * p < 0.05. Abbreviations: CI: confidence interval; OR: odds ratio; 24-hUKa: 24 h urinary potassium; 24-hUNa: 24 h urinary sodium.
Disclaimer/Publisher’s Note: The statements, opinions and data contained in all publications are solely those of the individual author(s) and contributor(s) and not of MDPI and/or the editor(s). MDPI and/or the editor(s) disclaim responsibility for any injury to people or property resulting from any ideas, methods, instructions or products referred to in the content.

