

Age Difference in the Association Between Nutritional Status and Dynapenia in Older Adults
 , ,
, ,  , and
, and
Abstract

1. Introduction
2. Materials and Methods
2.1. Research Design and Study Samples
2.2. Measurements
2.2.1. Nutritional Status
2.2.2. Dynapenia
2.2.3. Muscle Strength
2.2.4. Physical Performance
2.2.5. Muscle Mass
2.2.6. Covariates
2.3. Statistical Analysis
3. Results
3.1. Sample Characteristics
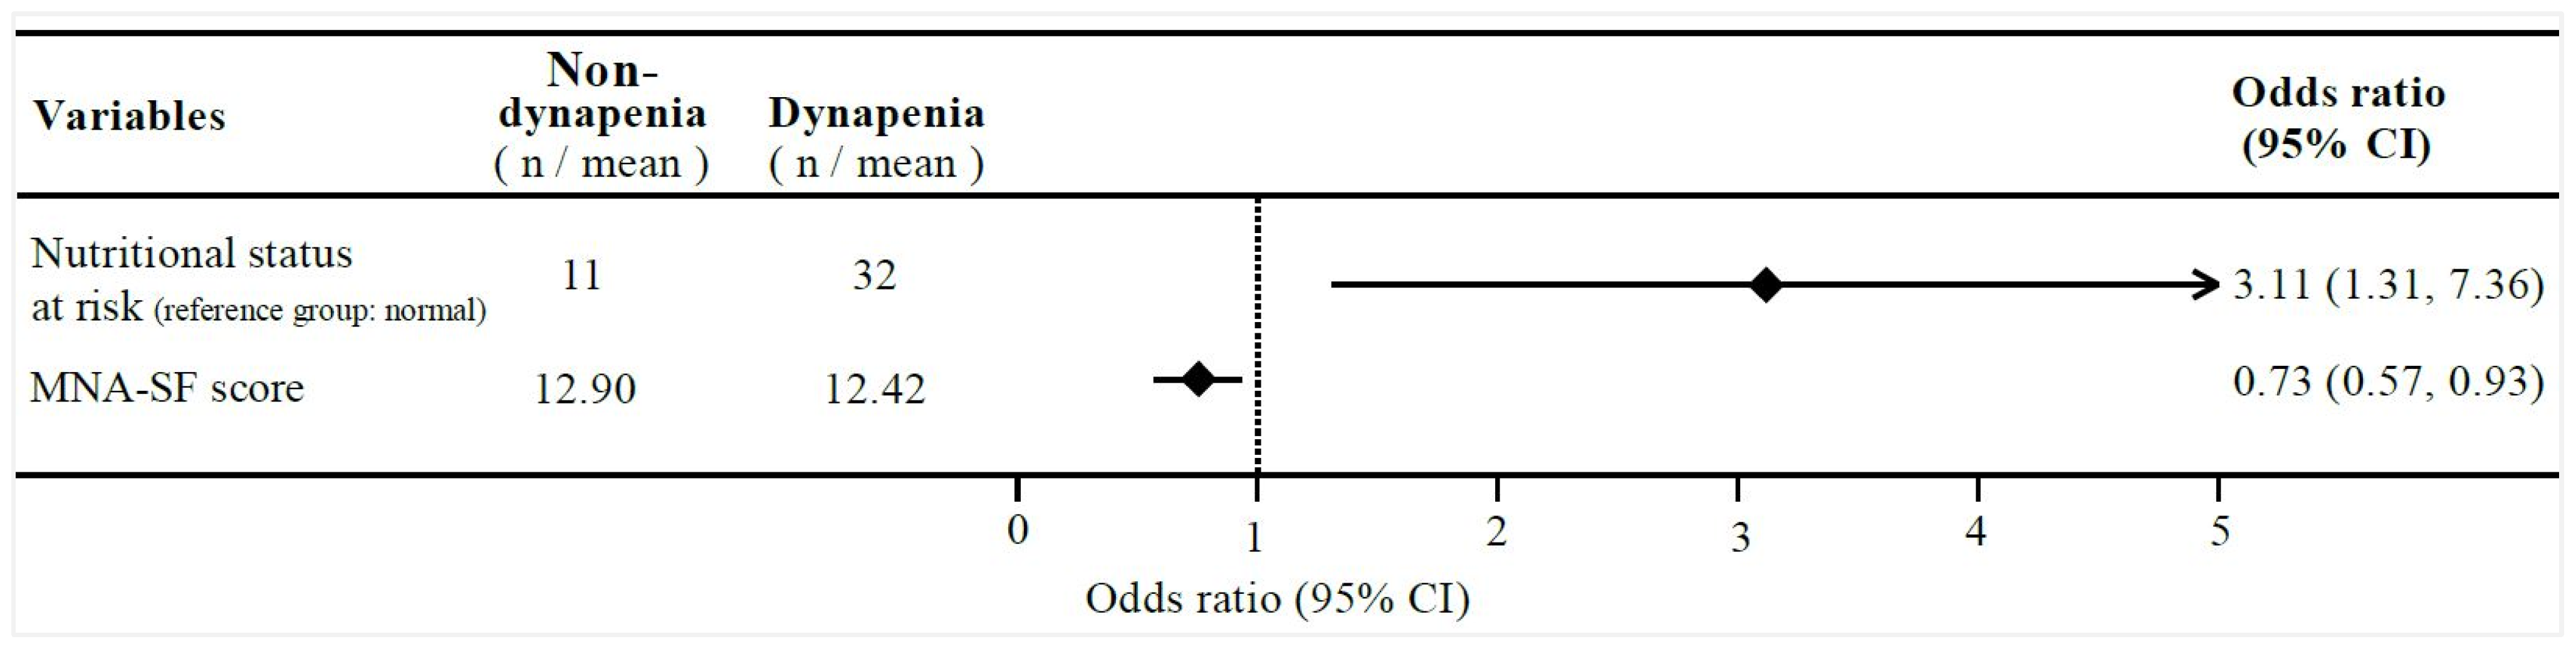
3.2. Associations Between MNA-SF, Nutritional Status, and Dynapenia Among All Participants
3.3. Interactions Regarding Dynapenia Between Nutritional Status and Sociodemographic Variants
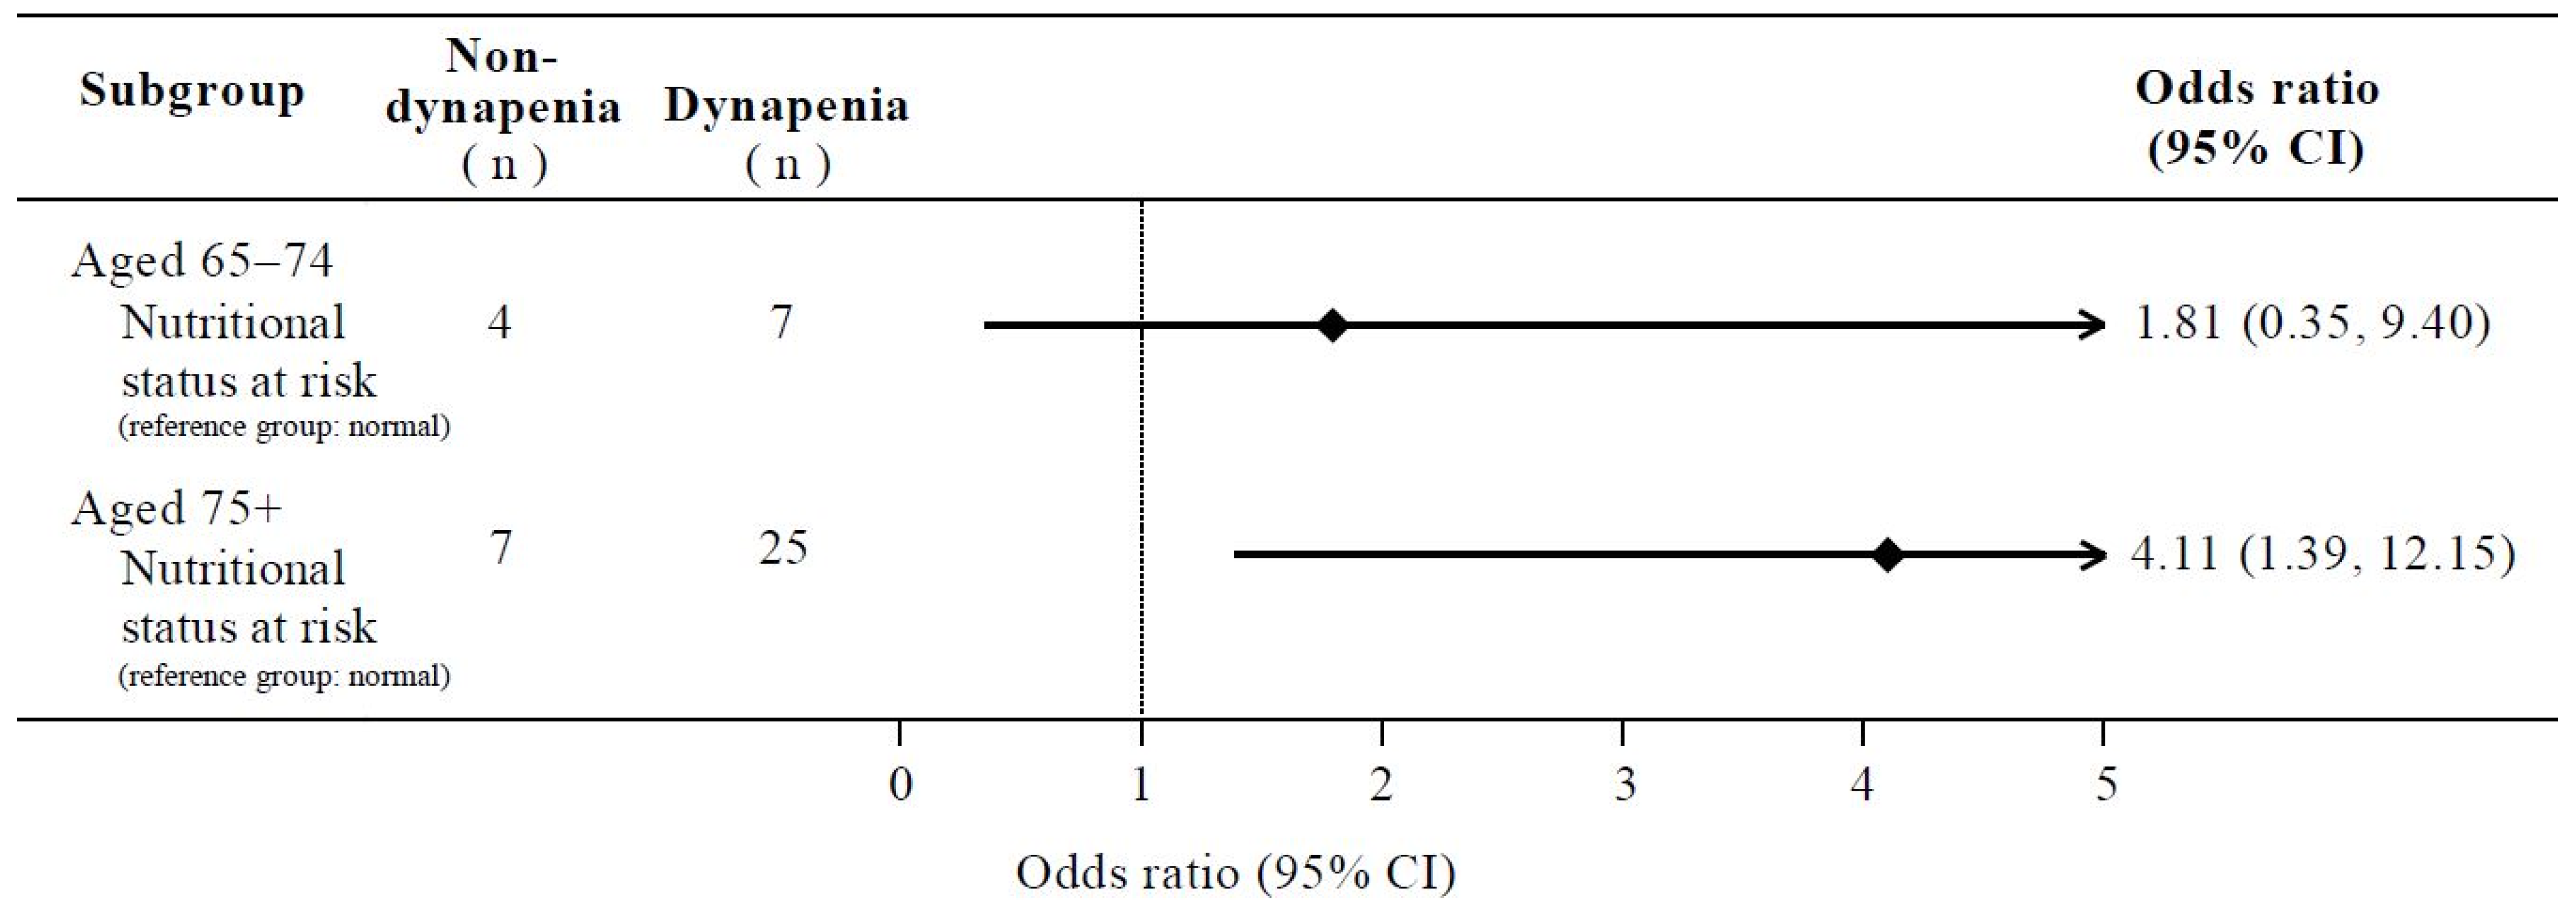
3.4. Associations Between Nutritional Status and Dynapenia in Different Age Groups
4. Discussion
5. Conclusions
Author Contributions
Funding
Institutional Review Board Statement
Informed Consent Statement
Data Availability Statement
Acknowledgments
Conflicts of Interest
References
- DESA/Population Division. World Population Prospects 2024: Summary of Results, 9th ed.; United Nations: New York, NY, USA, 2024. [Google Scholar]
- GBD 2019 Ageing Collaborators. Global, regional, and national burden of diseases and injuries for adults 70 years and older: Systematic analysis for the Global Burden of Disease 2019 Study. BMJ 2022, 376, e068208. [Google Scholar] [CrossRef]
- Manini, T.M.; Clark, B.C. Dynapenia and aging: An update. J. Gerontol. Ser. A Biol. Sci. Med. Sci. 2012, 67, 28–40. [Google Scholar] [CrossRef] [PubMed]
- Seene, T.; Kaasik, P. Muscle weakness in the elderly: Role of sarcopenia, dynapenia, and possibilities for rehabilitation. Eur. Rev. Aging Phys. Act. 2012, 9, 109–117. [Google Scholar] [CrossRef]
- Mitchell, W.K.; Williams, J.; Atherton, P.; Larvin, M.; Lund, J.; Narici, M. Sarcopenia, dynapenia, and the impact of advancing age on human skeletal muscle size and strength; a quantitative review. Front. Physiol. 2012, 3, 260. [Google Scholar] [CrossRef] [PubMed]
- Leong, D.P.; Teo, K.K.; Rangarajan, S.; Lopez-Jaramillo, P.; Avezum, A.; Orlandini, A.; Seron, P.; Ahmed, S.H.; Rosengren, A.; Kelishadi, R.; et al. Prognostic value of grip strength: Findings from the Prospective Urban Rural Epidemiology (PURE) study. Lancet 2015, 386, 266–273. [Google Scholar] [CrossRef] [PubMed]
- Riviati, N.; Indra, B. Relationship between muscle mass and muscle strength with physical performance in older adults: A systematic review. SAGE Open Med. 2023, 11, 20503121231214650. [Google Scholar] [CrossRef]
- Burbank, C.M.; Branscum, A.; Bovbjerg, M.L.; Hooker, K.; Smit, E. Muscle power predicts frailty status over four years: A retrospective cohort study of the National Health and Aging Trends Study. J. Frailty Sarcopenia Falls 2023, 8, 1–8. [Google Scholar] [CrossRef] [PubMed]
- Clark, B.C.; Manini, T.M. Sarcopenia =/= dynapenia. J. Gerontol. Ser. A Biol. Sci. Med. Sci. 2008, 63, 829–834. [Google Scholar] [CrossRef] [PubMed]
- Clark, B.C.; Manini, T.M. What is dynapenia? Nutrition 2012, 28, 495–503. [Google Scholar] [CrossRef] [PubMed]
- Chen, L.K.; Woo, J.; Assantachai, P.; Auyeung, T.W.; Chou, M.Y.; Iijima, K.; Jang, H.C.; Kang, L.; Kim, M.; Kim, S.; et al. Asian Working Group for Sarcopenia: 2019 Consensus Update on Sarcopenia Diagnosis and Treatment. J. Am. Med. Dir. Assoc. 2020, 21, 300–307.E2. [Google Scholar] [CrossRef]
- Iwamura, M.; Kanauchi, M. A cross-sectional study of the association between dynapenia and higher-level functional capacity in daily living in community-dwelling older adults in Japan. BMC Geriatr. 2017, 17, 1. [Google Scholar] [CrossRef] [PubMed]
- Alexandre Tda, S.; Duarte, Y.A.; Santos, J.L.; Wong, R.; Lebrão, M.L. Sarcopenia according to the European Working Group on Sarcopenia in Older People (EWGSOP) versus dynapenia as a risk factor for mortality in the elderly. J. Nutr. Health Aging 2014, 18, 751–756. [Google Scholar] [CrossRef]
- Kobayashi, K.; Imagama, S.; Ando, K.; Nakashima, H.; Machino, M.; Morozumi, M.; Kanbara, S.; Ito, S.; Inoue, T.; Yamaguchi, H.; et al. Dynapenia and physical performance in community-dwelling elderly people in Japan. Nagoya J. Med. Sci. 2020, 82, 415–424. [Google Scholar] [CrossRef] [PubMed]
- Zhou, W.; Tong, J.; Wen, Z.; Mao, M.; Wei, Y.; Li, X.; Zhou, M.; Wan, H. Prevalence and factors associated with dynapenia among middle-aged and elderly people in rural southern China. Prev. Med. Rep. 2024, 38, 102630. [Google Scholar] [CrossRef] [PubMed]
- Neves, T.; Ferriolli, E.; Lopes, M.B.M.; Souza, M.G.C.; Fett, C.A.; Fett, W.C.R. Prevalence and factors associated with sarcopenia and dynapenia in elderly people. J. Frailty Sarcopenia Falls 2018, 3, 194–202. [Google Scholar] [CrossRef]
- Benjumea, A.M.; Curcio, C.L.; Duque, G.; Gómez, F. Dynapenia and Sarcopenia as a Risk Factor for Disability in a Falls and Fractures Clinic in Older Persons. Open Access Maced. J. Med. Sci. 2018, 6, 344–349. [Google Scholar] [CrossRef] [PubMed]
- Kao, T.W.; Peng, T.C.; Chen, W.L.; Han, D.S.; Chen, C.L.; Yang, W.S. Impact of adiposity on muscle function and clinical events among elders with dynapenia, presarcopenia and sarcopenia: A community-based cross-sectional study. Aging 2021, 13, 7247–7258. [Google Scholar] [CrossRef] [PubMed]
- Huang, C.-Y.; Hwang, A.-C.; Liu, L.-K.; Lee, W.-J.; Chen, L.-Y.; Peng, L.-N.; Lin, M.-H.; Chen, L.-K. Association of Dynapenia, Sarcopenia, and Cognitive Impairment Among Community-Dwelling Older Taiwanese. Rejuvenation Res. 2016, 19, 71–78. [Google Scholar] [CrossRef] [PubMed]
- Chao, Y.P.; Fang, W.H.; Chen, W.L.; Peng, T.C.; Yang, W.S.; Kao, T.W. Exploring Muscle Health Deterioration and Its Determinants Among Community-Dwelling Older Adults. Front. Nutr. 2022, 9, 817044. [Google Scholar] [CrossRef] [PubMed]
- Chen, L.K.; Arai, H.; Assantachai, P.; Akishita, M.; Chew, S.T.H.; Dumlao, L.C.; Duque, G.; Woo, J. Roles of nutrition in muscle health of community-dwelling older adults: Evidence-based expert consensus from Asian Working Group for Sarcopenia. J. Cachex-Sarcopenia Muscle 2022, 13, 1653–1672. [Google Scholar] [CrossRef] [PubMed]
- Deer, R.R.; Volpi, E. Protein intake and muscle function in older adults. Curr. Opin. Clin. Nutr. Metab. Care 2015, 18, 248–253. [Google Scholar] [CrossRef]
- Ahmed, T.; Haboubi, N. Assessment and management of nutrition in older people and its importance to health. Clin. Interv. Aging 2010, 5, 207–216. [Google Scholar] [CrossRef] [PubMed]
- World Health Organization. World Report on Ageing and Health; World Health Organization: Geneva, Switzerland, 2015. [Google Scholar]
- Dent, E.; Wright, O.R.L.; Woo, J.; Hoogendijk, E.O. Malnutrition in older adults. Lancet 2023, 401, 951–966. [Google Scholar] [CrossRef]
- Söderström, L.; Rosenblad, A.; Thors Adolfsson, E.; Bergkvist, L. Malnutrition is associated with increased mortality in older adults regardless of the cause of death. Br. J. Nutr. 2017, 117, 532–540. [Google Scholar] [CrossRef]
- Wei, K.; Nyunt, M.S.Z.; Gao, Q.; Wee, S.L.; Ng, T.P. Long-term changes in nutritional status are associated with functional and mortality outcomes among community-living older adults. Nutrition 2019, 66, 180–186. [Google Scholar] [CrossRef]
- Amarya, S.; Singh, K.; Sabharwal, M. Changes during aging and their association with malnutrition. J. Clin. Gerontol. Geriatr. 2015, 6, 78–84. [Google Scholar] [CrossRef]
- Robinson, S.; Granic, A.; Sayer, A.A. Nutrition and Muscle Strength, As the Key Component of Sarcopenia: An Overview of Current Evidence. Nutrients 2019, 11, 2942. [Google Scholar] [CrossRef] [PubMed]
- Kramer, C.S.; Groenendijk, I.; Beers, S.; Wijnen, H.H.; van de Rest, O.; de Groot, L.C. The Association between Malnutrition and Physical Performance in Older Adults: A Systematic Review and Meta-Analysis of Observational Studies. Curr. Dev. Nutr. 2022, 6, nzac007. [Google Scholar] [CrossRef]
- de Medeiros, L.C.; da Luz, M.C.L.; da Costa Pereira, J.P.; Bezerra, G.K.A.; Cabral, P.C. Nutritional status and dynapenia in people living with Parkinson’s disease: A cross-sectional study. Neurol. Sci. 2022, 43, 2509–2517. [Google Scholar] [CrossRef] [PubMed]
- de Blasio, F.; Scalfi, L.; Castellucci, B.; Sacco, A.M.; Berlingieri, G.M.; Capitelli, L.; Alicante, P.; Sanduzzi, A.; Bocchino, M. Poor Nutritional Status and Dynapenia Are Highly Prevalent in Post-Acute COVID-19. Front. Nutr. 2022, 9, 888485. [Google Scholar] [CrossRef] [PubMed]
- Filion, M.E.; Barbat-Artigas, S.; Dupontgand, S.; Fex, A.; Karelis, A.D.; Aubertin-Leheudre, M. Relationship between protein intake and dynapenia in postmenopausal women. J. Nutr. Health Aging 2012, 16, 616–619. [Google Scholar] [CrossRef] [PubMed]
- Elia, M.; Stratton, R.J. An analytic appraisal of nutrition screening tools supported by original data with particular reference to age. Nutrition 2012, 28, 477–494. [Google Scholar] [CrossRef] [PubMed]
- Leij-Halfwerk, S.; Verwijs, M.H.; van Houdt, S.; Borkent, J.W.; Guaitoli, P.R.; Pelgrim, T.; Heymans, M.W.; Power, L.; Visser, M.; Corish, C.A.; et al. Prevalence of protein-energy malnutrition risk in European older adults in community, residential and hospital settings, according to 22 malnutrition screening tools validated for use in adults ≥ 65 years: A systematic review and meta-analysis. Maturitas 2019, 126, 80–89. [Google Scholar] [CrossRef] [PubMed]
- Norman, K.; Haß, U.; Pirlich, M. Malnutrition in Older Adults-Recent Advances and Remaining Challenges. Nutrients 2021, 13, 2764. [Google Scholar] [CrossRef] [PubMed]
- Wilkinson, D.J.; Piasecki, M.; Atherton, P.J. The age-related loss of skeletal muscle mass and function: Measurement and physiology of muscle fibre atrophy and muscle fibre loss in humans. Ageing Res. Rev. 2018, 47, 123–132. [Google Scholar] [CrossRef] [PubMed]
- Reid, K.F.; Pasha, E.; Doros, G.; Clark, D.J.; Patten, C.; Phillips, E.M.; Frontera, W.R.; Fielding, R.A. Longitudinal decline of lower extremity muscle power in healthy and mobility-limited older adults: Influence of muscle mass, strength, composition, neuromuscular activation and single fiber contractile properties. Eur. J. Appl. Physiol. 2014, 114, 29–39. [Google Scholar] [CrossRef] [PubMed]
- Chung, E.; Lee, S.-H.; Lee, H.-J.; Kim, Y.-H. Comparative study of young-old and old-old people using functional evaluation, gait characteristics, and cardiopulmonary metabolic energy consumption. BMC Geriatr. 2023, 23, 400. [Google Scholar] [CrossRef]
- Ouchi, Y.; Rakugi, H.; Arai, H.; Akishita, M.; Ito, H.; Toba, K.; Kai, I.; Joint Committee of Japan Gerontological Society (JGLS); Japan Geriatrics Society (JGS). Redefining the elderly as aged 75 years and older: Proposal from the Joint Committee of Japan Gerontological Society and the Japan Geriatrics Society. Geriatr. Gerontol. Int. 2017, 17, 1045–1047. [Google Scholar] [CrossRef]
- Faul, F.; Erdfelder, E.; Buchner, A.; Lang, A.G. Statistical power analyses using G*Power 3.1: Tests for correlation and regression analyses. Behav. Res. Methods 2009, 41, 1149–1160. [Google Scholar] [CrossRef]
- Vellas, B.; Guigoz, Y.; Garry, P.J.; Nourhashemi, F.; Bennahum, D.; Lauque, S.; Albarede, J.L. The Mini Nutritional Assessment (MNA) and its use in grading the nutritional state of elderly patients. Nutrition 1999, 15, 116–122. [Google Scholar] [CrossRef] [PubMed]
- Rubenstein, L.Z.; Harker, J.O.; Salvà, A.; Guigoz, Y.; Vellas, B. Screening for undernutrition in geriatric practice: Developing the short-form mini-nutritional assessment (MNA-SF). J. Gerontol. Ser. A Biol. Sci. Med. Sci. 2001, 56, M366–M372. [Google Scholar] [CrossRef]
- Tsai, A.C.; Yang, S.F.; Wang, J.Y. Validation of population-specific Mini-Nutritional Assessment with its long-term mortality-predicting ability: Results of a population-based longitudinal 4-year study in Taiwan. Br. J. Nutr. 2010, 104, 93–99. [Google Scholar] [CrossRef]
- Yamada, M.; Kimura, Y.; Ishiyama, D.; Nishio, N.; Abe, Y.; Kakehi, T.; Fujimoto, J.; Tanaka, T.; Ohji, S.; Otobe, Y.; et al. Differential Characteristics of Skeletal Muscle in Community-Dwelling Older Adults. J. Am. Med Dir. Assoc. 2017, 18, 807.e9–807.e16. [Google Scholar] [CrossRef] [PubMed]
- Troiano, R.P.; Berrigan, D.; Dodd, K.W.; Mâsse, L.C.; Tilert, T.; McDowell, M. Physical activity in the United States measured by accelerometer. Med. Sci. Sports Exerc. 2008, 40, 181–188. [Google Scholar] [CrossRef]
- World Health Organization. WHO Guidelines on Physical Activity and Sedentary Behaviour: At a Glance; World Health Organization: Geneva, Switzerland, 2020. [Google Scholar]
- Deutz, N.E.; Bauer, J.M.; Barazzoni, R.; Biolo, G.; Boirie, Y.; Bosy-Westphal, A.; Cederholm, T.; Cruz-Jentoft, A.; Krznariç, Z.; Nair, K.S.; et al. Protein intake and exercise for optimal muscle function with aging: Recommendations from the ESPEN Expert Group. Clin. Nutr. 2014, 33, 929–936. [Google Scholar] [CrossRef] [PubMed]
- Boucher, B.J. The problems of vitamin d insufficiency in older people. Aging Dis 2012, 3, 313–329. [Google Scholar] [PubMed]
- Campbell, W.W.; Deutz, N.E.P.; Volpi, E.; Apovian, C.M. Nutritional Interventions: Dietary Protein Needs and Influences on Skeletal Muscle of Older Adults. J. Gerontol. Ser. A Biol. Sci. Med. Sci. 2023, 78, 67–72. [Google Scholar] [CrossRef]
- Coelho-Júnior, H.J.; Calvani, R.; Tosato, M.; Landi, F.; Picca, A.; Marzetti, E. Protein intake and physical function in older adults: A systematic review and meta-analysis. Ageing Res. Rev. 2022, 81, 101731. [Google Scholar] [CrossRef]
- Giustina, A.; Bouillon, R.; Dawson-Hughes, B.; Ebeling, P.R.; Lazaretti-Castro, M.; Lips, P.; Marcocci, C.; Bilezikian, J.P. Vitamin D in the older population: A consensus statement. Endocrine 2023, 79, 31–44. [Google Scholar] [CrossRef]
- Sahota, O. Understanding vitamin D deficiency. Age Ageing 2014, 43, 589–591. [Google Scholar] [CrossRef] [PubMed]
- Holick, M.F. Vitamin D deficiency. N. Engl. J. Med. 2007, 357, 266–281. [Google Scholar] [CrossRef]
- Delinocente, M.L.B.; Luiz, M.M.; de Oliveira, D.C.; de Souza, A.F.; Ramírez, P.C.; de Oliveira Máximo, R.; Soares, N.C.; Steptoe, A.; de Oliveira, C.; da Silva Alexandre, T. Are Serum 25-Hydroxyvitamin D Deficiency and Insufficiency Risk Factors for the Incidence of Dynapenia? Calcif. Tissue Int. 2022, 111, 571–579. [Google Scholar] [CrossRef] [PubMed]
- Kitsu, T.; Kabasawa, K.; Ito, Y.; Kitamura, K.; Watanabe, Y.; Tanaka, J.; Nakamura, K.; Narita, I. Low serum 25-hydroxyvitamin D is associated with low grip strength in an older Japanese population. J. Bone Miner. Metab. 2020, 38, 198–204. [Google Scholar] [CrossRef] [PubMed]
- Granic, A.; Davies, K.; Martin-Ruiz, C.; Jagger, C.; Kirkwood, T.B.L.; von Zglinicki, T.; Aihie Sayer, A. Grip strength and inflammatory biomarker profiles in very old adults. Age Ageing 2017, 46, 976–982. [Google Scholar] [CrossRef]
- Haeri, N.S.; Perera, S.; Nadkarni, N.K.; Greenspan, S.L. Association of inflammatory markers with muscle and cognitive function in early and late-aging older adults. J. Nutr. Health Aging 2024, 28, 100207. [Google Scholar] [CrossRef] [PubMed]
- Schaap, L.A.; Pluijm, S.M.; Deeg, D.J.; Harris, T.B.; Kritchevsky, S.B.; Newman, A.B.; Colbert, L.H.; Pahor, M.; Rubin, S.M.; Tylavsky, F.A.; et al. Higher inflammatory marker levels in older persons: Associations with 5-year change in muscle mass and muscle strength. J. Gerontol. Ser. A Biol. Sci. Med. Sci. 2009, 64, 1183–1189. [Google Scholar] [CrossRef]
- Chatindiara, I.; Williams, V.; Sycamore, E.; Richter, M.; Allen, J.; Wham, C. Associations between nutrition risk status, body composition and physical performance among community-dwelling older adults. Aust. N. Z. J. Public Health 2019, 43, 56–62. [Google Scholar] [CrossRef] [PubMed]
- Forster, S.; Gariballa, S. Age as a determinant of nutritional status: A cross sectional study. Nutr. J. 2005, 4, 28. [Google Scholar] [CrossRef]
- Makizako, H.; Shimada, H.; Doi, T.; Tsutsumimoto, K.; Lee, S.; Lee, S.C.; Harada, K.; Hotta, R.; Nakakubo, S.; Bae, S.; et al. Age-dependent changes in physical performance and body composition in community-dwelling Japanese older adults. J. Cachex-Sarcopenia Muscle 2017, 8, 607–614. [Google Scholar] [CrossRef] [PubMed]
- Tieland, M.; Trouwborst, I.; Clark, B.C. Skeletal muscle performance and ageing. J. Cachexia Sarcopenia Muscle 2018, 9, 3–19. [Google Scholar] [CrossRef] [PubMed]
- Hughes, V.A.; Frontera, W.R.; Wood, M.; Evans, W.J.; Dallal, G.E.; Roubenoff, R.; Singh, M.A.F. Longitudinal Muscle Strength Changes in Older Adults: Influence of Muscle Mass, Physical Activity, and Health. J. Gerontol. Ser. A 2001, 56, B209–B217. [Google Scholar] [CrossRef]
- Donovan, N.J.; Blazer, D. Social Isolation and Loneliness in Older Adults: Review and Commentary of a National Academies Report. Am. J. Geriatr. Psychiatry 2020, 28, 1233–1244. [Google Scholar] [CrossRef] [PubMed]
- Rosso, A.L.; Taylor, J.A.; Tabb, L.P.; Michael, Y.L. Mobility, disability, and social engagement in older adults. J. Aging Health 2013, 25, 617–637. [Google Scholar] [CrossRef] [PubMed]
- Simmons, W.K.; Burrows, K.; Avery, J.A.; Kerr, K.L.; Bodurka, J.; Savage, C.R.; Drevets, W.C. Depression-Related Increases and Decreases in Appetite: Dissociable Patterns of Aberrant Activity in Reward and Interoceptive Neurocircuitry. Am. J. Psychiatry 2016, 173, 418–428. [Google Scholar] [CrossRef] [PubMed]
- Lindsay Smith, G.; Banting, L.; Eime, R.; O’Sullivan, G.; van Uffelen, J.G.Z. The association between social support and physical activity in older adults: A systematic review. Int. J. Behav. Nutr. Phys. Act. 2017, 14, 56. [Google Scholar] [CrossRef] [PubMed]
- Luo, M.; Ding, D.; Bauman, A.; Negin, J.; Phongsavan, P. Social engagement pattern, health behaviors and subjective well-being of older adults: An international perspective using WHO-SAGE survey data. BMC Public Health 2020, 20, 99. [Google Scholar] [CrossRef] [PubMed]


| Variables | Total (n = 211) | Non-Dynapenia (n = 88) | Dynapenia (n = 123) | p-Value |
|---|---|---|---|---|
| Categorical Variables a | N (%) | N (%) | N (%) | |
| Age group (years) | ||||
| 65–74 | 53 (25.1) | 22 (25.0) | 31 (25.2) | 0.973 |
| 75+ | 158 (74.9) | 66 (75.0) | 92 (74.8) | |
| Sex | ||||
| Men | 97 (46.0) | 44 (50.0) | 53 (43.1) | 0.321 |
| Women | 114 (54.0) | 44 (50.0) | 70 (56.9) | |
| Educational level | ||||
| Lower than university | 108 (51.2) | 31 (35.2) | 77 (62.6) | <0.001 * |
| University and over | 103 (48.8) | 57 (64.8) | 46 (37.4) | |
| Living status | ||||
| Alone | 20 (9.5) | 8 (9.1) | 12 (9.8) | 0.871 |
| With others | 191 (90.5) | 80 (90.9) | 111 (90.2) | |
| Smoking | ||||
| No | 194 (91.9) | 85 (96.6) | 109 (88.6) | 0.036 * |
| Yes | 17 (8.1) | 3 (3.4) | 14 (11.4) | |
| Alcohol drinking | ||||
| No | 189 (89.6) | 83 (94.3) | 106 (86.2) | 0.056 |
| Yes | 22 (10.4) | 5 (5.7) | 17 (13.8) | |
| MVPA (mins/per week) | ||||
| <150 | 145 (68.7) | 50 (56.8) | 95 (77.2) | 0.002 * |
| ≥150 | 66 (31.3) | 38 (43.2) | 28 (22.8) | |
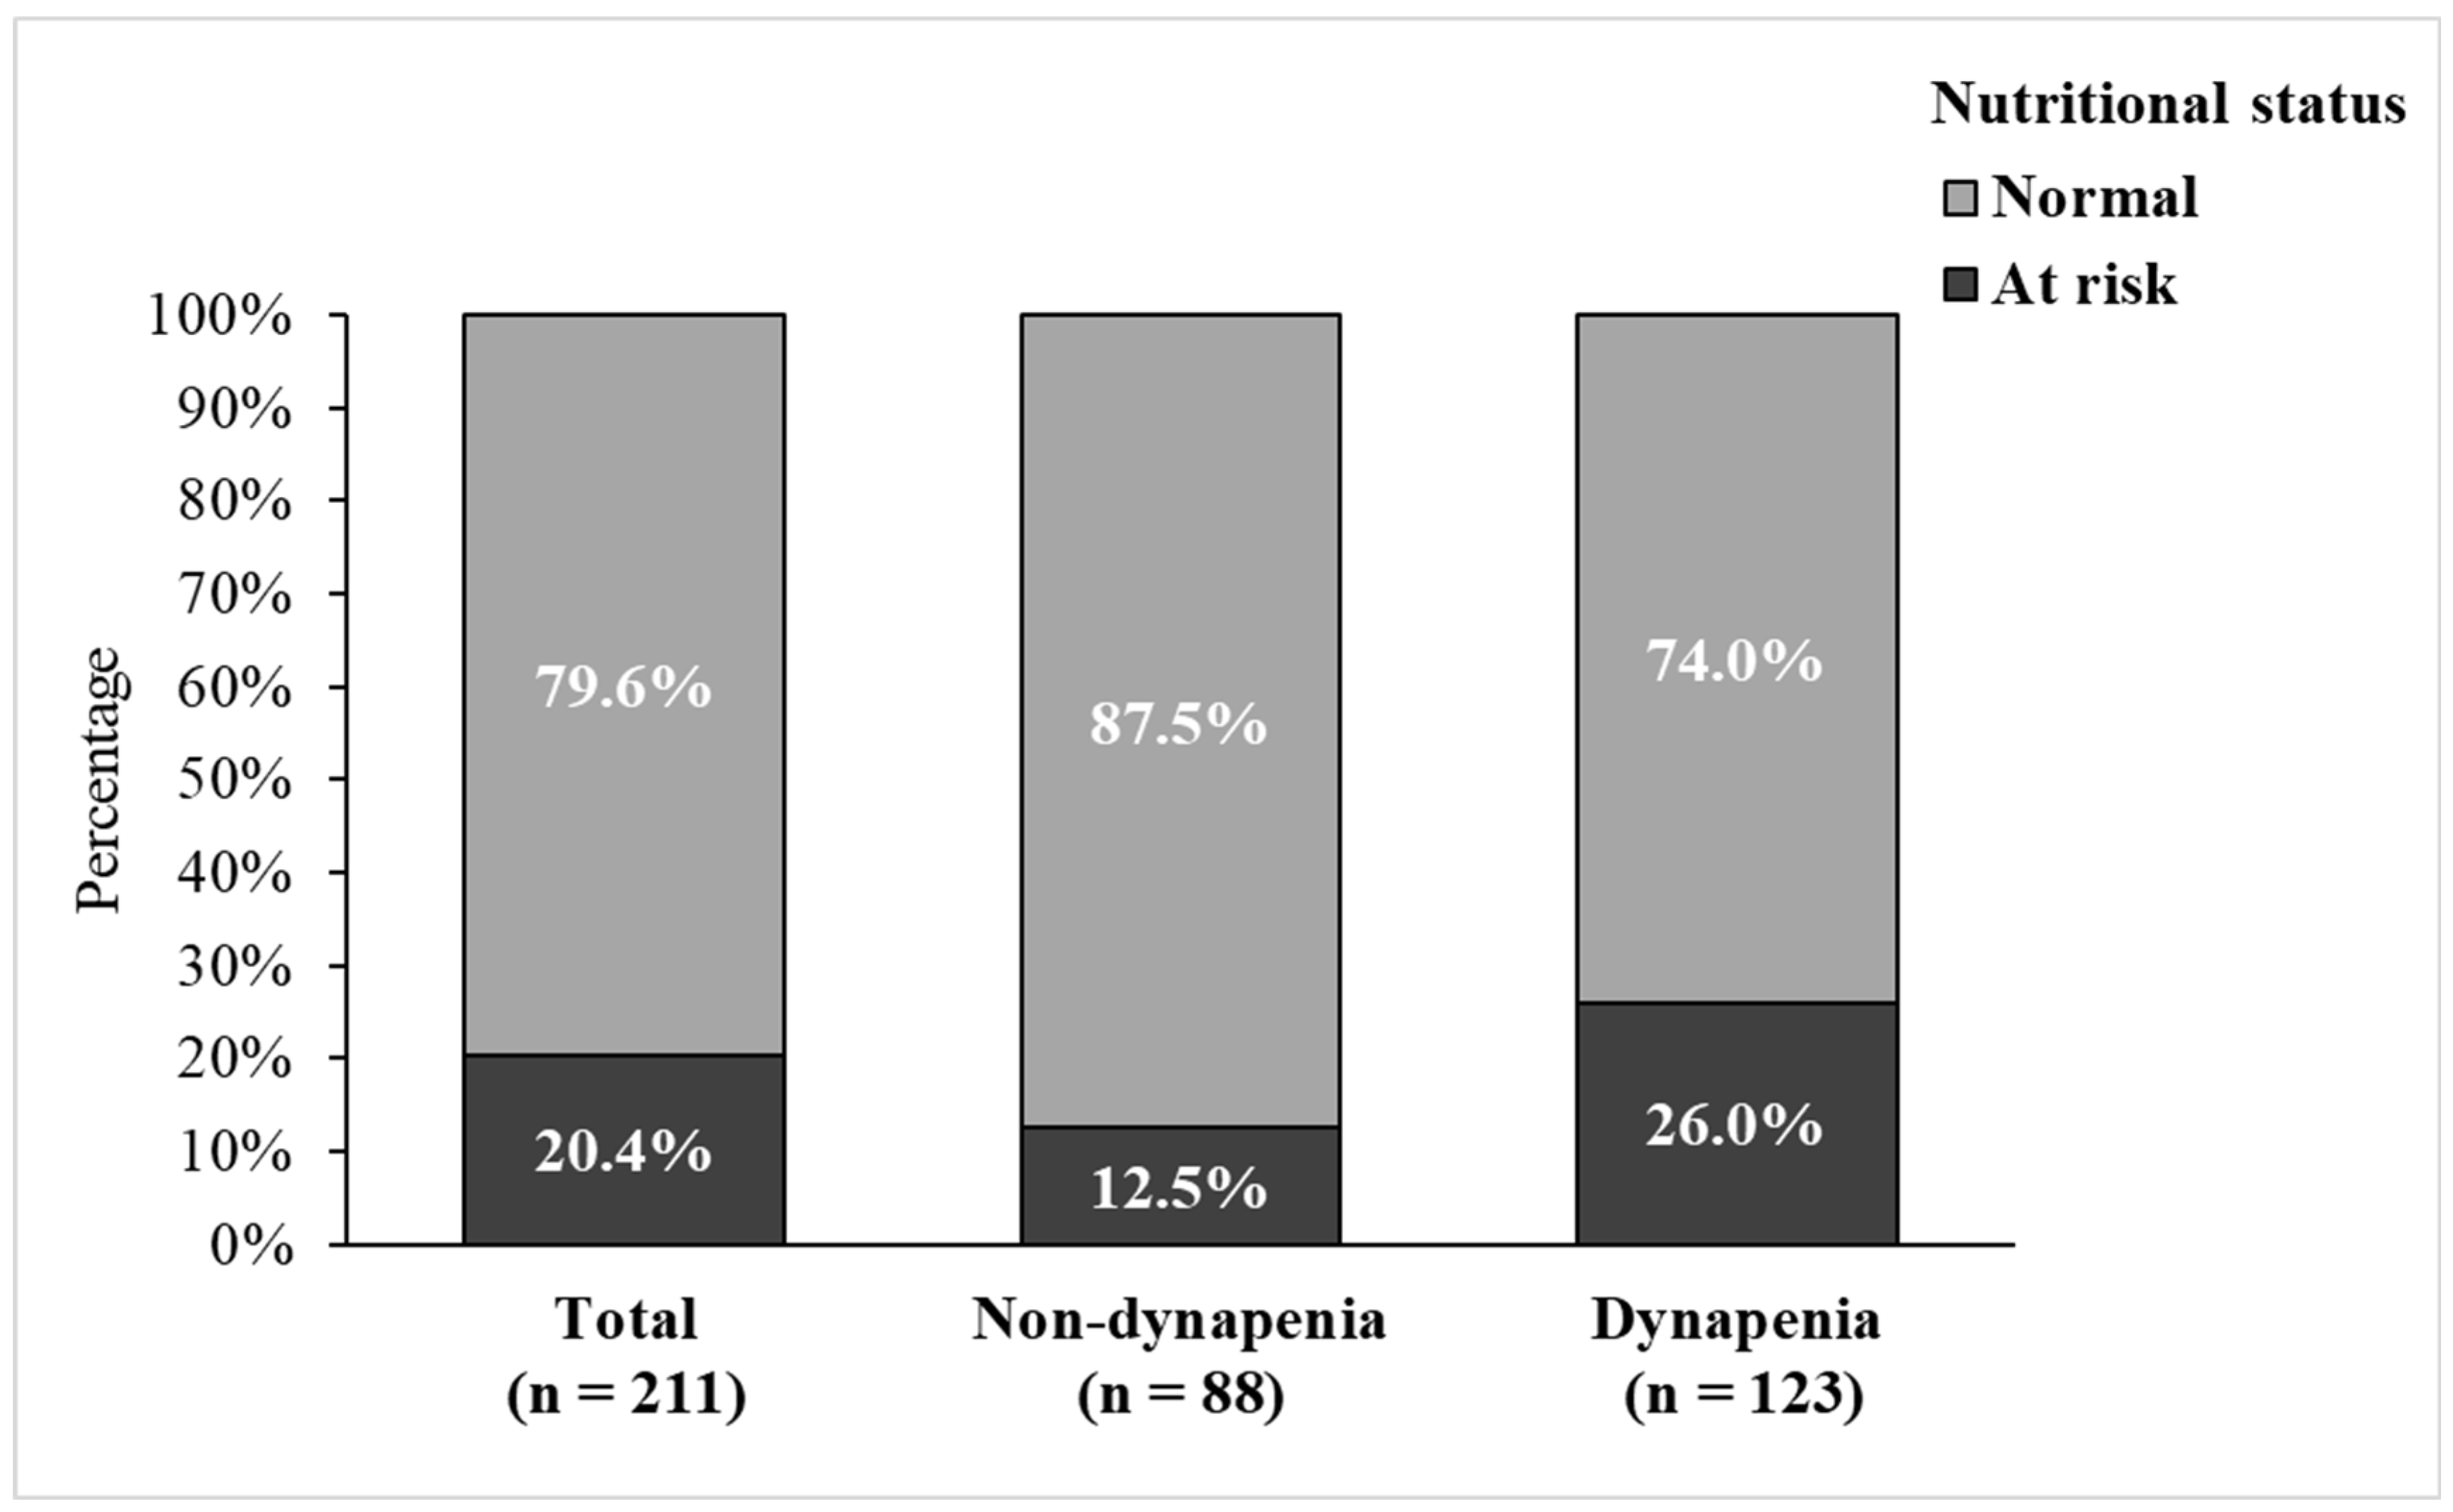
| Nutritional status | ||||
| Normal | 168 (79.6) | 77 (87.5) | 91 (74.0) | 0.016 * |
| At risk | 43 (20.4) | 11 (12.5) | 32 (26.0) | |
| Continuous variables b | Mean (SD) | Mean (SD) | Mean (SD) | p-value |
| Age (years) | 80.69 (7.06) | 80.25 (7.16) | 81.00 (7.00) | 0.448 |
| BMI (kg/m2) | 24.39 (3.67) | 23.64 (3.15) | 24.93 (3.92) | 0.009 * |
| MNA-SF (scores) | 12.62 (1.68) | 12.90 (1.43) | 12.42 (1.81) | 0.035 * |
| MVPA (mins/per week) | 104.17 (167.85) | 173.27 (219.32) | 54.74 (91.04) | <0.001 * |
| Variables | Model 1 | Model 2 | ||
|---|---|---|---|---|
| OR (95%CI) | p-Value | OR (95%CI) | p-Value | |
| Nutritional status at risk (Ref. Normal) | 2.46 (1.16, 5.21) | 0.018 * | 3.11 (1.31, 7.36) | 0.009 ** |
| MNA-SF (scores) | 0.83 (0.70, 1.00) | 0.045 * | 0.73 (0.57, 0.93) | 0.011 * |
| Variables | p-Value for Interaction Termwith Nutritional Status |
|---|---|
| Dynapenia (p-Value) | |
| Age | 0.014 * |
| Sex | 0.125 |
| Educational level | 0.863 |
| Living status | 0.675 |
| Smoking | 0.999 |
| Alcohol drinking | 0.999 |
| Variables | Model 1 | Model 2 | ||
|---|---|---|---|---|
| OR (95%CI) | p-Value | OR (95%CI) | p-Value | |
| Aged 65–74 (n = 53) | ||||
| Nutritional status at risk (Ref. Normal) | 1.31 (0.33, 5.18) | 0.698 | 1.81 (0.35, 9.40) | 0.480 |
| Aged 75+ (n = 158) | ||||
| Nutritional status at risk (Ref. Normal) | 3.15 (1.27, 7.80) | 0.013 * | 4.11 (1.39, 12.15) | 0.010 * |
Disclaimer/Publisher’s Note: The statements, opinions and data contained in all publications are solely those of the individual author(s) and contributor(s) and not of MDPI and/or the editor(s). MDPI and/or the editor(s) disclaim responsibility for any injury to people or property resulting from any ideas, methods, instructions or products referred to in the content. |
© 2025 by the authors. Licensee MDPI, Basel, Switzerland. This article is an open access article distributed under the terms and conditions of the Creative Commons Attribution (CC BY) license (https://creativecommons.org/licenses/by/4.0/).
Share and Cite
Chang, C.-C.; Lai, T.-F.; Chen, J.; Liao, Y.; Park, J.-H.; Chang, Y.-J. Age Difference in the Association Between Nutritional Status and Dynapenia in Older Adults. Nutrients 2025, 17, 734. https://doi.org/10.3390/nu17040734
Chang C-C, Lai T-F, Chen J, Liao Y, Park J-H, Chang Y-J. Age Difference in the Association Between Nutritional Status and Dynapenia in Older Adults. Nutrients. 2025; 17(4):734. https://doi.org/10.3390/nu17040734
Chicago/Turabian StyleChang, Chih-Ching, Ting-Fu Lai, Jiaren Chen, Yung Liao, Jong-Hwan Park, and Yen-Jung Chang. 2025. "Age Difference in the Association Between Nutritional Status and Dynapenia in Older Adults" Nutrients 17, no. 4: 734. https://doi.org/10.3390/nu17040734
APA StyleChang, C.-C., Lai, T.-F., Chen, J., Liao, Y., Park, J.-H., & Chang, Y.-J. (2025). Age Difference in the Association Between Nutritional Status and Dynapenia in Older Adults. Nutrients, 17(4), 734. https://doi.org/10.3390/nu17040734