Identifying Key Features Associated with Excessive Fructose Intake: A Machine Learning Analysis of a Mexican Cohort
Abstract
1. Introduction
2. Materials and Methods
2.1. Data
2.1.1. Clinical Measurements
2.1.2. Biochemical Parameters
2.1.3. Behavioral Variables
2.1.4. Dietary Intake
- Natural fructose intake (g/day): sum of fructose from intrinsic sources (e.g., fruits, vegetables, and natural juices), calculated according to portion size and reported frequency of consumption.
- Added fructose intake (g/day): sum of fructose from industrially processed foods and beverages, including free fructose, HFCS, and the fructose moiety of sucrose, based on typical composition values and reported consumption.
2.2. Methods and Computational Framework
3. Results
3.1. Cluster Analysis
3.2. Supervised Algorithms and Model Interpretation
4. Discussion
5. Strengths and Limitations
6. Conclusions
Supplementary Materials
Author Contributions
Funding
Institutional Review Board Statement
Informed Consent Statement
Data Availability Statement
Acknowledgments
Conflicts of Interest
References
- Stern, D.; Piernas, C.; Barquera, S.; Rivera, J.A.; Popkin, B.M. Caloric beverages were major sources of energy among children and adults in Mexico, 1999–2012. J. Nutr. 2014, 144, 949–956. [Google Scholar] [CrossRef]
- Singh, G.M.; Micha, R.; Khatibzadeh, S.; Shi, P.; Lim, S.; Andrews, K.G.; Engell, R.E.; Ezzati, M.; Mozaffarian, D.; Global Burden of Diseases Nutrition and Chronic Diseases Expert Group (NutriCoDE). Global, regional, and national consumption of sugar-sweetened beverages, fruit juices, and milk: A systematic assessment of beverage intake in 187 countries. PLoS ONE 2015, 10, e0124845. [Google Scholar] [CrossRef] [PubMed]
- Malik, V.S.; Hu, F.B. The role of sugar-sweetened beverages in the global epidemics of obesity and chronic diseases. Nat. Rev. Endocrinol. 2022, 18, 205–218. [Google Scholar] [CrossRef]
- Sánchez-Pimienta, T.G.; Batis, C.; Lutter, C.K.; Rivera, J.A. Sugar-sweetened beverages are the main sources of added sugar intake in the Mexican population. J. Nutr. 2016, 146, 1888S–1896S. [Google Scholar] [CrossRef]
- Aburto, T.C.; Pedraza, L.S.; Sánchez-Pimienta, T.G.; Batis, C.; Rivera, J.A. Discretionary foods have a high contribution and fruit, vegetables, and legumes have a low contribution to the total energy intake of the Mexican population. J. Nutr. 2016, 146, 1881S–1887S. [Google Scholar] [CrossRef]
- Cantoral, A.; Contreras-Manzano, A.; Luna-Villa, L.; Batis, C.; Roldán-Valadez, E.A.; Ettinger, A.S.; Mercado, A.; Peterson, K.E.; Téllez-Rojo, M.M.; Rivera, J.A. Dietary sources of fructose and its association with fatty liver in mexican young adults. Nutrients 2019, 11, 522. [Google Scholar] [CrossRef] [PubMed]
- World Health Organization. Guideline: Sugars Intake for Adults and Children; World Health Organization: Geneva, Switzerland, 2015. [Google Scholar]
- Santhekadur, P.K. The dark face of fructose as a tumor promoter. Genes Dis. 2019, 7, 163–165. [Google Scholar] [CrossRef] [PubMed]
- Dommarco, J.Á.R.; Aragonés, M.A.C.; Fuentes, M.L.; Martínez, T.G.d.C.; Salinas, C.A.A.; Licona, G.H.; Barquera, S. La Obesidad en México. Estado de la Política Pública y Recomendaciones Para su Prevención y Control; Instituto Nacional de Salud Pública de México: Morelos, México, 2018; p. 271. [Google Scholar]
- Burger, K.; Trauner, M.M.; Bergheim, I. Pathogenic aspects of fructose consumption in metabolic dysfunction-associated steatotic liver disease (MASLD): A narrative review. Cell Stress 2025, 9, 49. [Google Scholar] [CrossRef]
- Muriel, P.; López-Sánchez, P.; Ramos-Tovar, E. Fructose and the Liver. Int. J. Mol. Sci. 2021, 22, 6969. [Google Scholar] [CrossRef]
- Oviedo-Solís, C.I.; Hernández-Alcaraz, C.; Sánchez-Ortíz, N.A.; López-Olmedo, N.; Jáuregui, A.; Barquera, S. Association of sociodemographic and lifestyle factors with dietary patterns among men and women living in Mexico City: A cross-sectional study. Front. Public Health 2022, 10, 859132. [Google Scholar] [CrossRef]
- Zheng, X.; Pan, F.; Naumovski, N.; Wei, Y.; Wu, L.; Peng, W.; Wang, K. Precise prediction of metabolites patterns using machine learning approaches in distinguishing honey and sugar diets fed to mice. Food Chem. 2024, 430, 136915. [Google Scholar] [CrossRef]
- Davies, T.; Louie, J.C.Y.; Ndanuko, R.; Barbieri, S.; Perez-Concha, O.; Wu, J.H. A machine learning approach to predict the added-sugar content of packaged foods. J. Nutr. 2022, 152, 343–349. [Google Scholar] [CrossRef]
- AlYammahi, J.; Darwish, A.S.; Lemaoui, T.; AlNashef, I.M.; Hasan, S.W.; Taher, H.; Banat, F. Parametric analysis and machine learning for enhanced recovery of high-value sugar from date fruits using supercritical CO2 with co-solvents. J. CO2 Util. 2023, 72, 102511. [Google Scholar] [CrossRef]
- Colin-Ramirez, E.; Rivera-Mancia, S.; Infante-Vazquez, O.; Cartas-Rosado, R.; Vargas-Barron, J.; Madero, M.; Vallejo, M. Protocol for a prospective longitudinal study of risk factors for hypertension incidence in a Mexico City population: The Tlalpan 2020 cohort. BMJ Open 2017, 7, e016773. [Google Scholar] [CrossRef]
- Riis, P. Thirty years of bioethics: The Helsinki Declaration 1964–2003. New Rev. Bioeth. 2003, 1, 15–25. [Google Scholar] [CrossRef] [PubMed]
- Chobanian, A.V.; Bakris, G.L.; Black, H.R.; Cushman, W.C.; Green, L.A.; Izzo, J.L., Jr.; Jones, D.W.; Materson, B.J.; Oparil, S.; Wright, J.T., Jr.; et al. Seventh report of the joint national committee on prevention, detection, evaluation, and treatment of high blood pressure. Hypertension 2003, 42, 1206–1252. [Google Scholar] [CrossRef]
- Amezcua-Guerra, L.M.; Pazarán-Romero, G.; Gutiérrez-Esparza, G.O.; Fonseca-Camarillo, G.; Martínez-García, M.; Groves-Miralrío, L.E.; Brianza-Padilla, M. Gender assessment of sleep disorders in an adult urban population of Mexico City. Salud Publica Mexico 2024, 66, 824–830. [Google Scholar] [CrossRef]
- Amezcua-Guerra, L.M.; Velázquez-Espinosa, K.P.; Piña-Soto, L.A.; Gutiérrez-Esparza, G.O.; Martínez-García, M.; Brianza-Padilla, M. The Self-Reported Quality of Sleep and Its Relationship with the Development of Arterial Hypertension: Perspectives from the Tlalpan 2020 Cohort. J. Clin. Med. 2024, 13, 6089. [Google Scholar] [CrossRef]
- Stewart, A.L.; Ware, J.E. Measuring Functioning and Well-Being: The Medical Outcomes Study Approach; Duke University Press: Durham, NC, USA, 1992; p. 449. [Google Scholar]
- Zagalaz-Anula, N.; Hita-Contreras, F.; Martínez-Amat, A.; Cruz-Díaz, D.; Lomas-Vega, R. Psychometric properties of the medical outcomes study sleep scale in Spanish postmenopausal women. Menopause 2017, 24, 824–831. [Google Scholar] [CrossRef] [PubMed]
- Akçay, B.D.; Akcay, D.; Yetkin, S. Turkish reliability and validity study of the medical outcomes study (MOS) sleep scale inpatients with obstructive sleep apnea. Turk. J. Med. Sci. 2021, 51, 268–279. [Google Scholar] [CrossRef] [PubMed]
- Kim, M.K.; You, J.A.; Lee, J.H.; Lee, S.A. The reliability and validity of the Korean version of the Medical Outcomes Study-Sleep Scale in patients with obstructive sleep apnea. Sleep Med. Res. 2011, 2, 89–95. [Google Scholar] [CrossRef]
- Spielberger, C.D.; Smith, L.H. Anxiety (drive), stress, and serial-position effects in serial-verbal learning. J. Exp. Psychol. 1966, 72, 589. [Google Scholar] [CrossRef]
- Craig, C.L.; Marshall, A.L.; Sjöström, M.; Bauman, A.E.; Booth, M.L.; Ainsworth, B.E.; Pratt, M.; Ekelund, U.; Yngve, A.; Sallis, J.F.; et al. International physical activity questionnaire: 12-country reliability and validity. Med. Sci. Sport. Exerc. 2003, 35, 1381–1395. [Google Scholar] [CrossRef]
- Hernández-Avila, M.; Romieu, I.; Parra, S.; Hernández-Avila, J.; Madrigal, H.; Willett, W. Validity and reproducibility of a food frequency questionnaire to assess dietary intake of women living in Mexico City. Salud Publica Mexico 1998, 40, 133–140. [Google Scholar] [CrossRef]
- Hernández-Avila, J.; González-Avilés, L.; Rosales-Mendoza, E. Manual de Usuario. SNUT Sistema de Evaluación de Hábitos Nutricionales y Consumo de Nutrimentos; Instituto Nacional de Salud Pública: Morelos, México, 2003; Response: Confirmed. [Google Scholar]
- Lizaur, A.B.P.; Laborde, L.M.; González, B.P. Sistema Mexicano de Alimentos Equivalentes; Fomento de Nutrición y Salud: Mexico City, Mexico, 2014. [Google Scholar]
- Denova-Gutiérrez, E.; Tucker, K.L.; Salmerón, J.; Flores, M.; Barquera, S. Relative validity of a food frequency questionnaire to identify dietary patterns in an adult Mexican population. Salud Publica Mexico 2016, 58, 608–616. [Google Scholar] [CrossRef]
- Al Farizi, W.S.; Hidayah, I.; Rizal, M.N. Isolation forest based anomaly detection: A systematic literature review. In Proceedings of the 2021 8th International Conference on Information Technology, Computer and Electrical Engineering (ICITACEE), Semarang, Indonesia, 23–24 September 2021; IEEE: Piscataway, NJ, USA, 2021; pp. 118–122. [Google Scholar]
- Morgenstern, J.D.; Rosella, L.C.; Costa, A.P.; de Souza, R.J.; Anderson, L.N. Perspective: Big data and machine learning could help advance nutritional epidemiology. Adv. Nutr. 2021, 12, 621–631. [Google Scholar] [CrossRef] [PubMed]
- Russo, S.; Bonassi, S. Prospects and pitfalls of machine learning in nutritional epidemiology. Nutrients 2022, 14, 1705. [Google Scholar] [CrossRef] [PubMed]
- Krishnan, S.; Ramyaa, R. When two heads are better than one: Nutritional epidemiology meets machine learning. Am. J. Clin. Nutr. 2020, 111, 1124–1126. [Google Scholar] [CrossRef]
- Li, X.; Joh, H.K.; Hur, J.; Song, M.; Zhang, X.; Cao, Y.; Wu, K.; Giovannucci, E.L. Fructose consumption from different food sources and cardiometabolic biomarkers: Cross-sectional associations in US men and women. Am. J. Clin. Nutr. 2023, 117, 490–498. [Google Scholar] [CrossRef]
- Andersen, S.H.; Black, T.; Grassi-Oliveira, R.; Wegener, G. Can early-life high fructose exposure induce long-term depression and anxiety-like behaviours?–A preclinical systematic review. Brain Res. 2023, 1814, 148427. [Google Scholar] [CrossRef] [PubMed]
- Coursan, A.; Polve, D.; Leroi, A.M.; Monnoye, M.; Roussin, L.; Tavolacci, M.P.; Quillard Muraine, M.; Maccarone, M.; Guerin, O.; Houivet, E.; et al. Fructose malabsorption induces dysbiosis and increases anxiety in Human and animal models. bioRxiv 2025. [Google Scholar] [CrossRef]
- Zhang, P.; Sun, H.; Cheng, X.; Li, Y.; Zhao, Y.; Mei, W.; Wei, X.; Zhou, H.; Du, Y.; Zeng, C. Dietary intake of fructose increases purine de novo synthesis: A crucial mechanism for hyperuricemia. Front. Nutr. 2022, 9, 1045805. [Google Scholar] [CrossRef]
- Chaumontet, C.; Azzout-Marniche, D.; Blais, A.; Gaudichon, C.; Mathe, V.; Tomé, D. High dietary protein decreases fat deposition induced by high-fat and high-sucrose diet in rats. J. Nutr. Biochem. 2015, 26, 766–777. [Google Scholar] [CrossRef]
- Skytte, M.J.; Samkani, A.; Petersen, A.D.; Thomsen, M.N.; Astrup, A.; Chabanova, E.; Frystyk, J.; Holst, J.J.; Thomsen, H.S.; Madsbad, S.; et al. A carbohydrate-reduced high-protein diet improves HbA 1c and liver fat content in weight stable participants with type 2 diabetes: A randomised controlled trial. Diabetologia 2019, 62, 2066–2078. [Google Scholar] [CrossRef] [PubMed]
- Mok, A.; Haldar, S.; Lee, J.C.Y.; Leow, M.K.S.; Henry, C.J. Postprandial changes in cardiometabolic disease risk in young Chinese men following isocaloric high or low protein diets, stratified by either high or low meal frequency-a randomized controlled crossover trial. Nutr. J. 2015, 15, 27. [Google Scholar] [CrossRef]
- Vogtschmidt, Y.D.; Raben, A.; Faber, I.; de Wilde, C.; Lovegrove, J.A.; Givens, D.I.; Pfeiffer, A.F.; Soedamah-Muthu, S.S. Is protein the forgotten ingredient: Effects of higher compared to lower protein diets on cardiometabolic risk factors. A systematic review and meta-analysis of randomised controlled trials. Atherosclerosis 2021, 328, 124–135. [Google Scholar] [CrossRef]
- Shahdadian, F.; Boozari, B.; Saneei, P. Association between short sleep duration and intake of sugar and sugar-sweetened beverages: A systematic review and meta-analysis of observational studies. Sleep Health 2023, 9, 159–176. [Google Scholar] [CrossRef]
- Boozari, B.; Saneei, P.; Safavi, S.M. Association between sleep duration and sleep quality with sugar and sugar-sweetened beverages intake among university students. Sleep Breath. 2021, 25, 649–656. [Google Scholar] [CrossRef]
- Kim, S.Y.; Hong, S.J.; Kim, E.; Lee, C.H.; Kim, G. Application of ensemble neural-network method to integrated sugar content prediction model for citrus fruit using Vis/NIR spectroscopy. J. Food Eng. 2023, 338, 111254. [Google Scholar] [CrossRef]
- Jeong, S.; Cho, S.; Lee, S. Integrative hyperspectral imaging and artificial intelligence approaches for identifying sucrose substitutes and assessing cookie qualities. LWT 2025, 217, 117412. [Google Scholar] [CrossRef]
- Softic, S.; Cohen, D.E.; Kahn, C.R. Role of dietary fructose and hepatic de novo lipogenesis in fatty liver disease. Dig. Dis. Sci. 2016, 61, 1282–1293. [Google Scholar] [CrossRef]
- Geidl-Flueck, B.; Gerber, P.A. Fructose drives de novo lipogenesis affecting metabolic health. J. Endocrinol. 2023, 257, e220270. [Google Scholar] [CrossRef] [PubMed]
- Todoric, J.; Di Caro, G.; Reibe, S.; Henstridge, D.C.; Green, C.R.; Vrbanac, A.; Ceteci, F.; Conche, C.; McNulty, R.; Shalapour, S.; et al. Fructose stimulated de novo lipogenesis is promoted by inflammation. Nat. Metab. 2020, 2, 1034–1045. [Google Scholar] [CrossRef] [PubMed]
- Schneider, E.; Sabate, J.M.; Bouchoucha, M.; Debras, C.; Touvier, M.; Hercberg, S.; Benamouzig, R.; Buscail, C.; Julia, C. FODMAP Consumption by Adults from the French Population-Based NutriNet-Santé Cohort. J. Nutr. 2021, 151, 3180–3186. [Google Scholar] [CrossRef] [PubMed]
- Ying, X. An Overview of Overfitting and its Solutions. J. Phys. Conf. Ser. 2019, 1168, 022022. [Google Scholar] [CrossRef]
- Bu, C.; Zhang, Z. Research on Overfitting Problem and Correction in Machine Learning. J. Phys. Conf. Ser. 2020, 1693, 012100. [Google Scholar] [CrossRef]
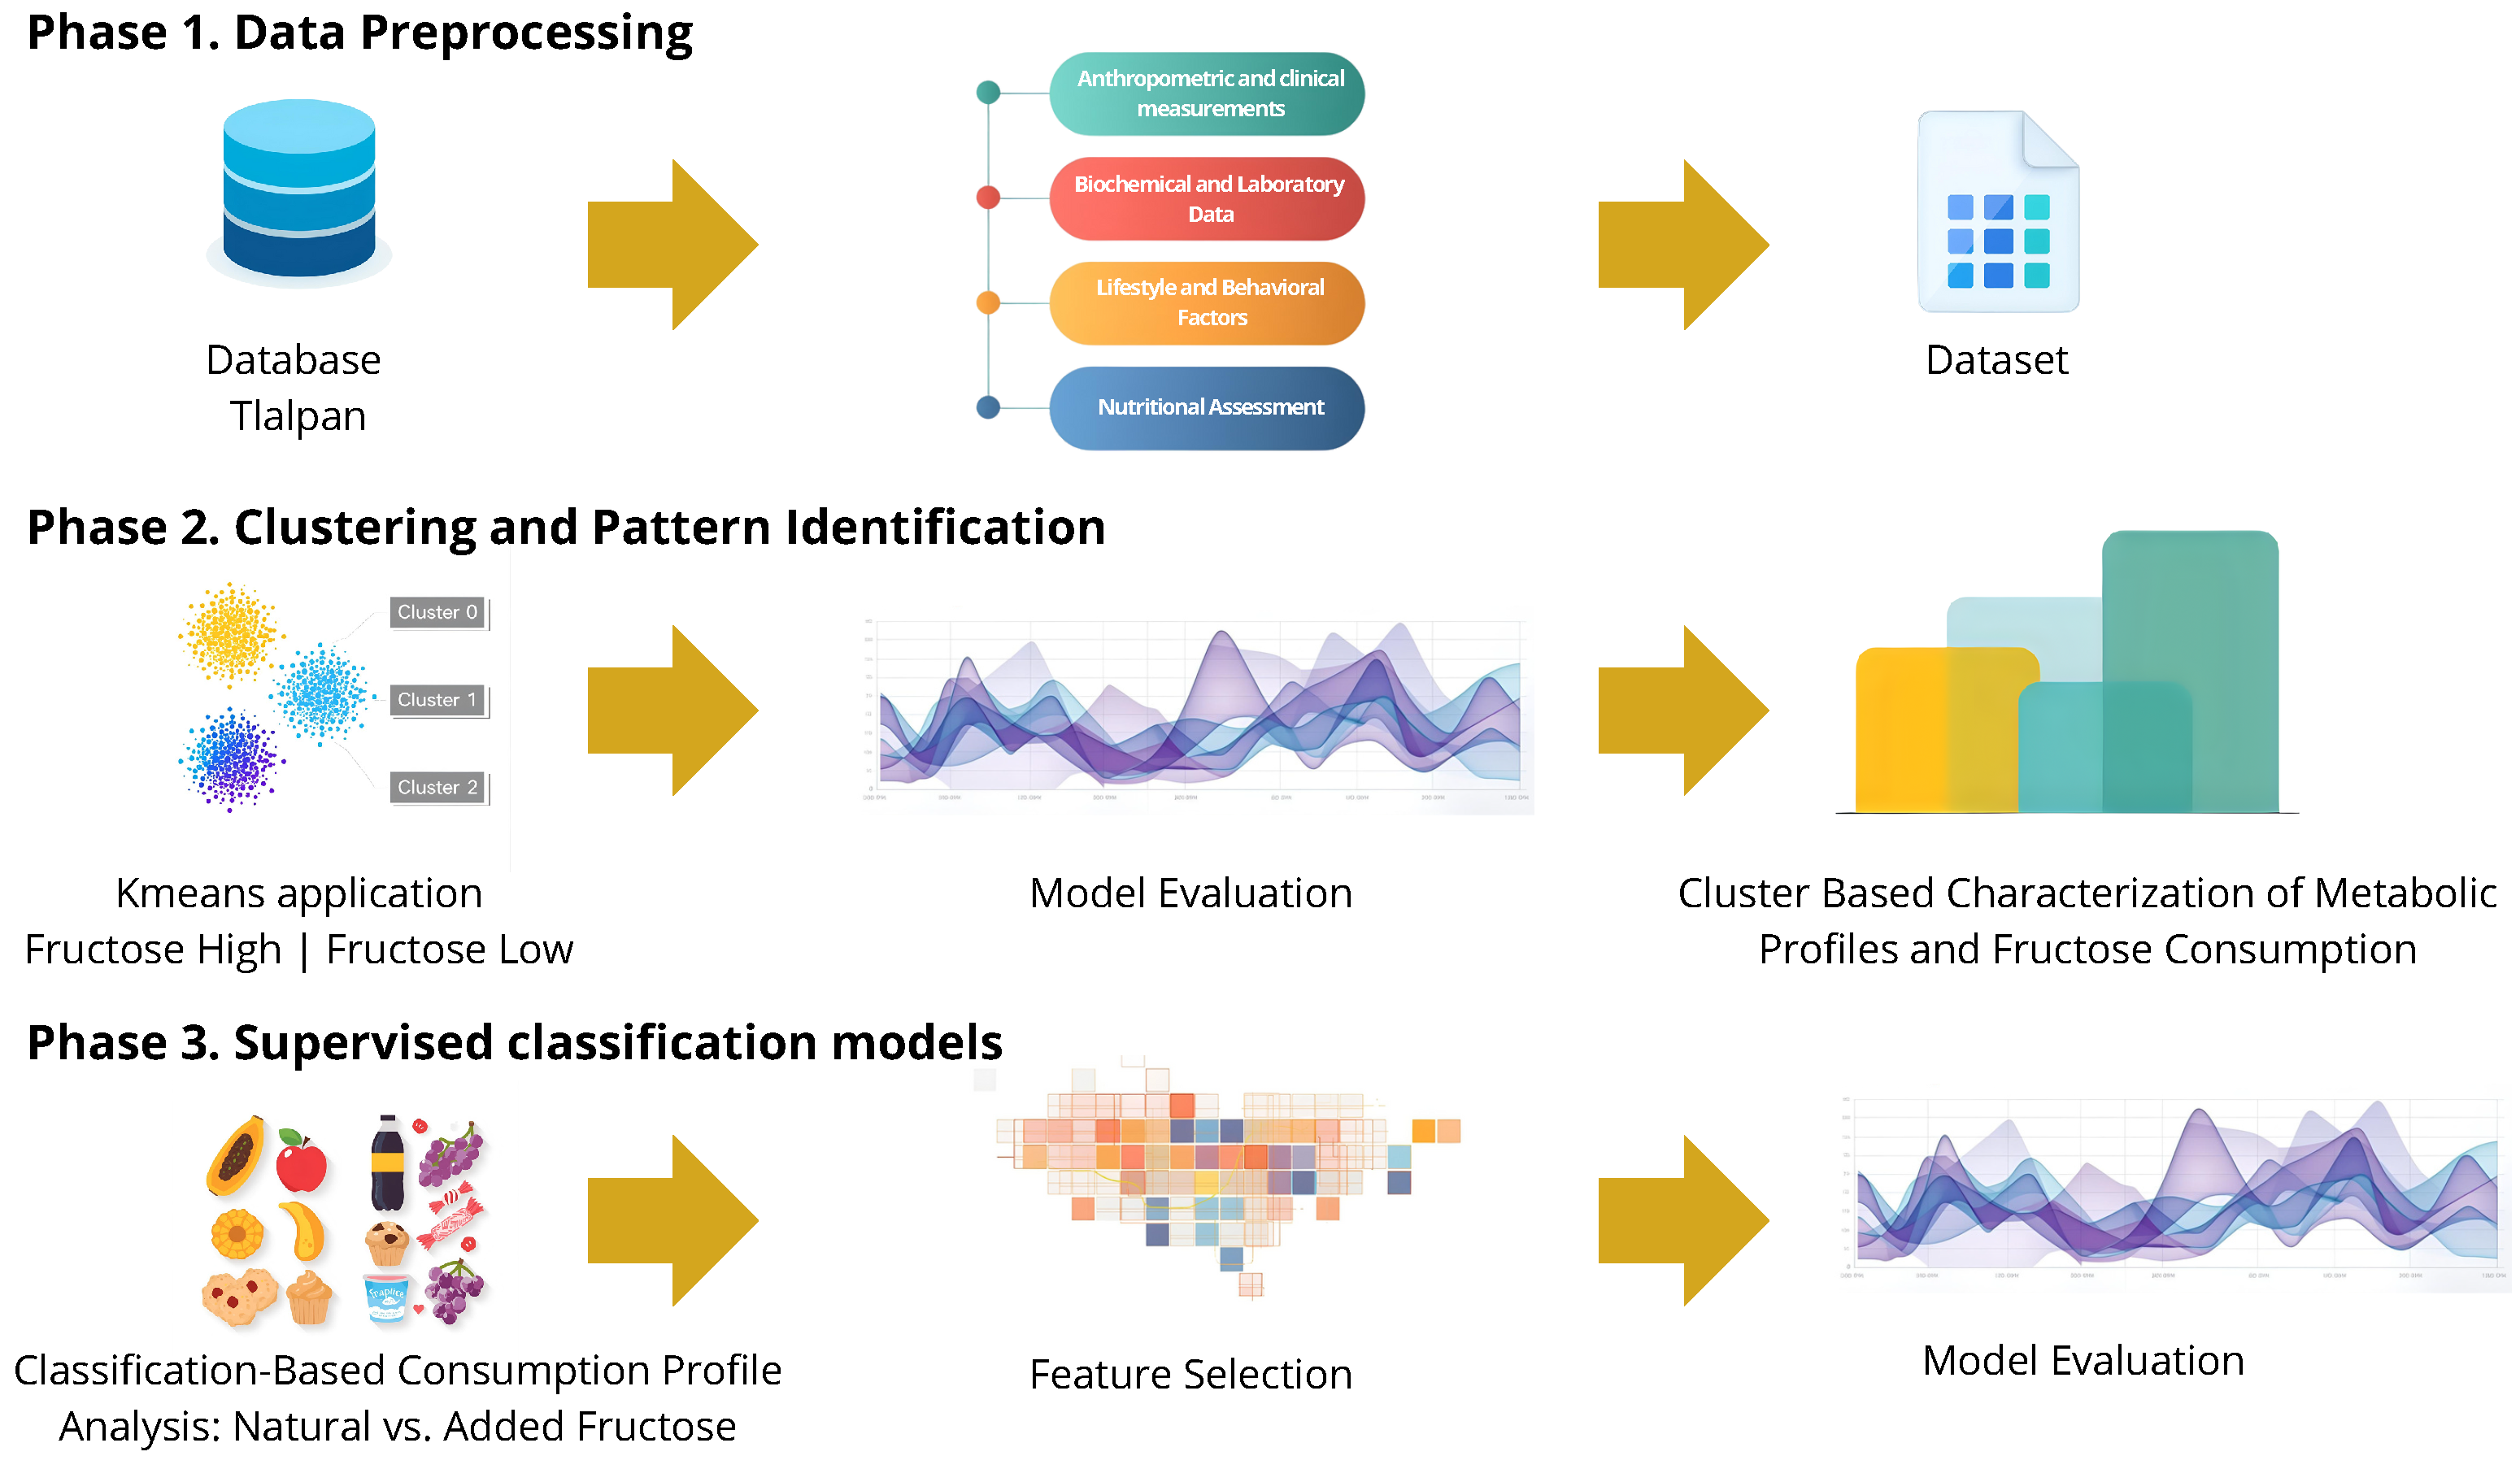
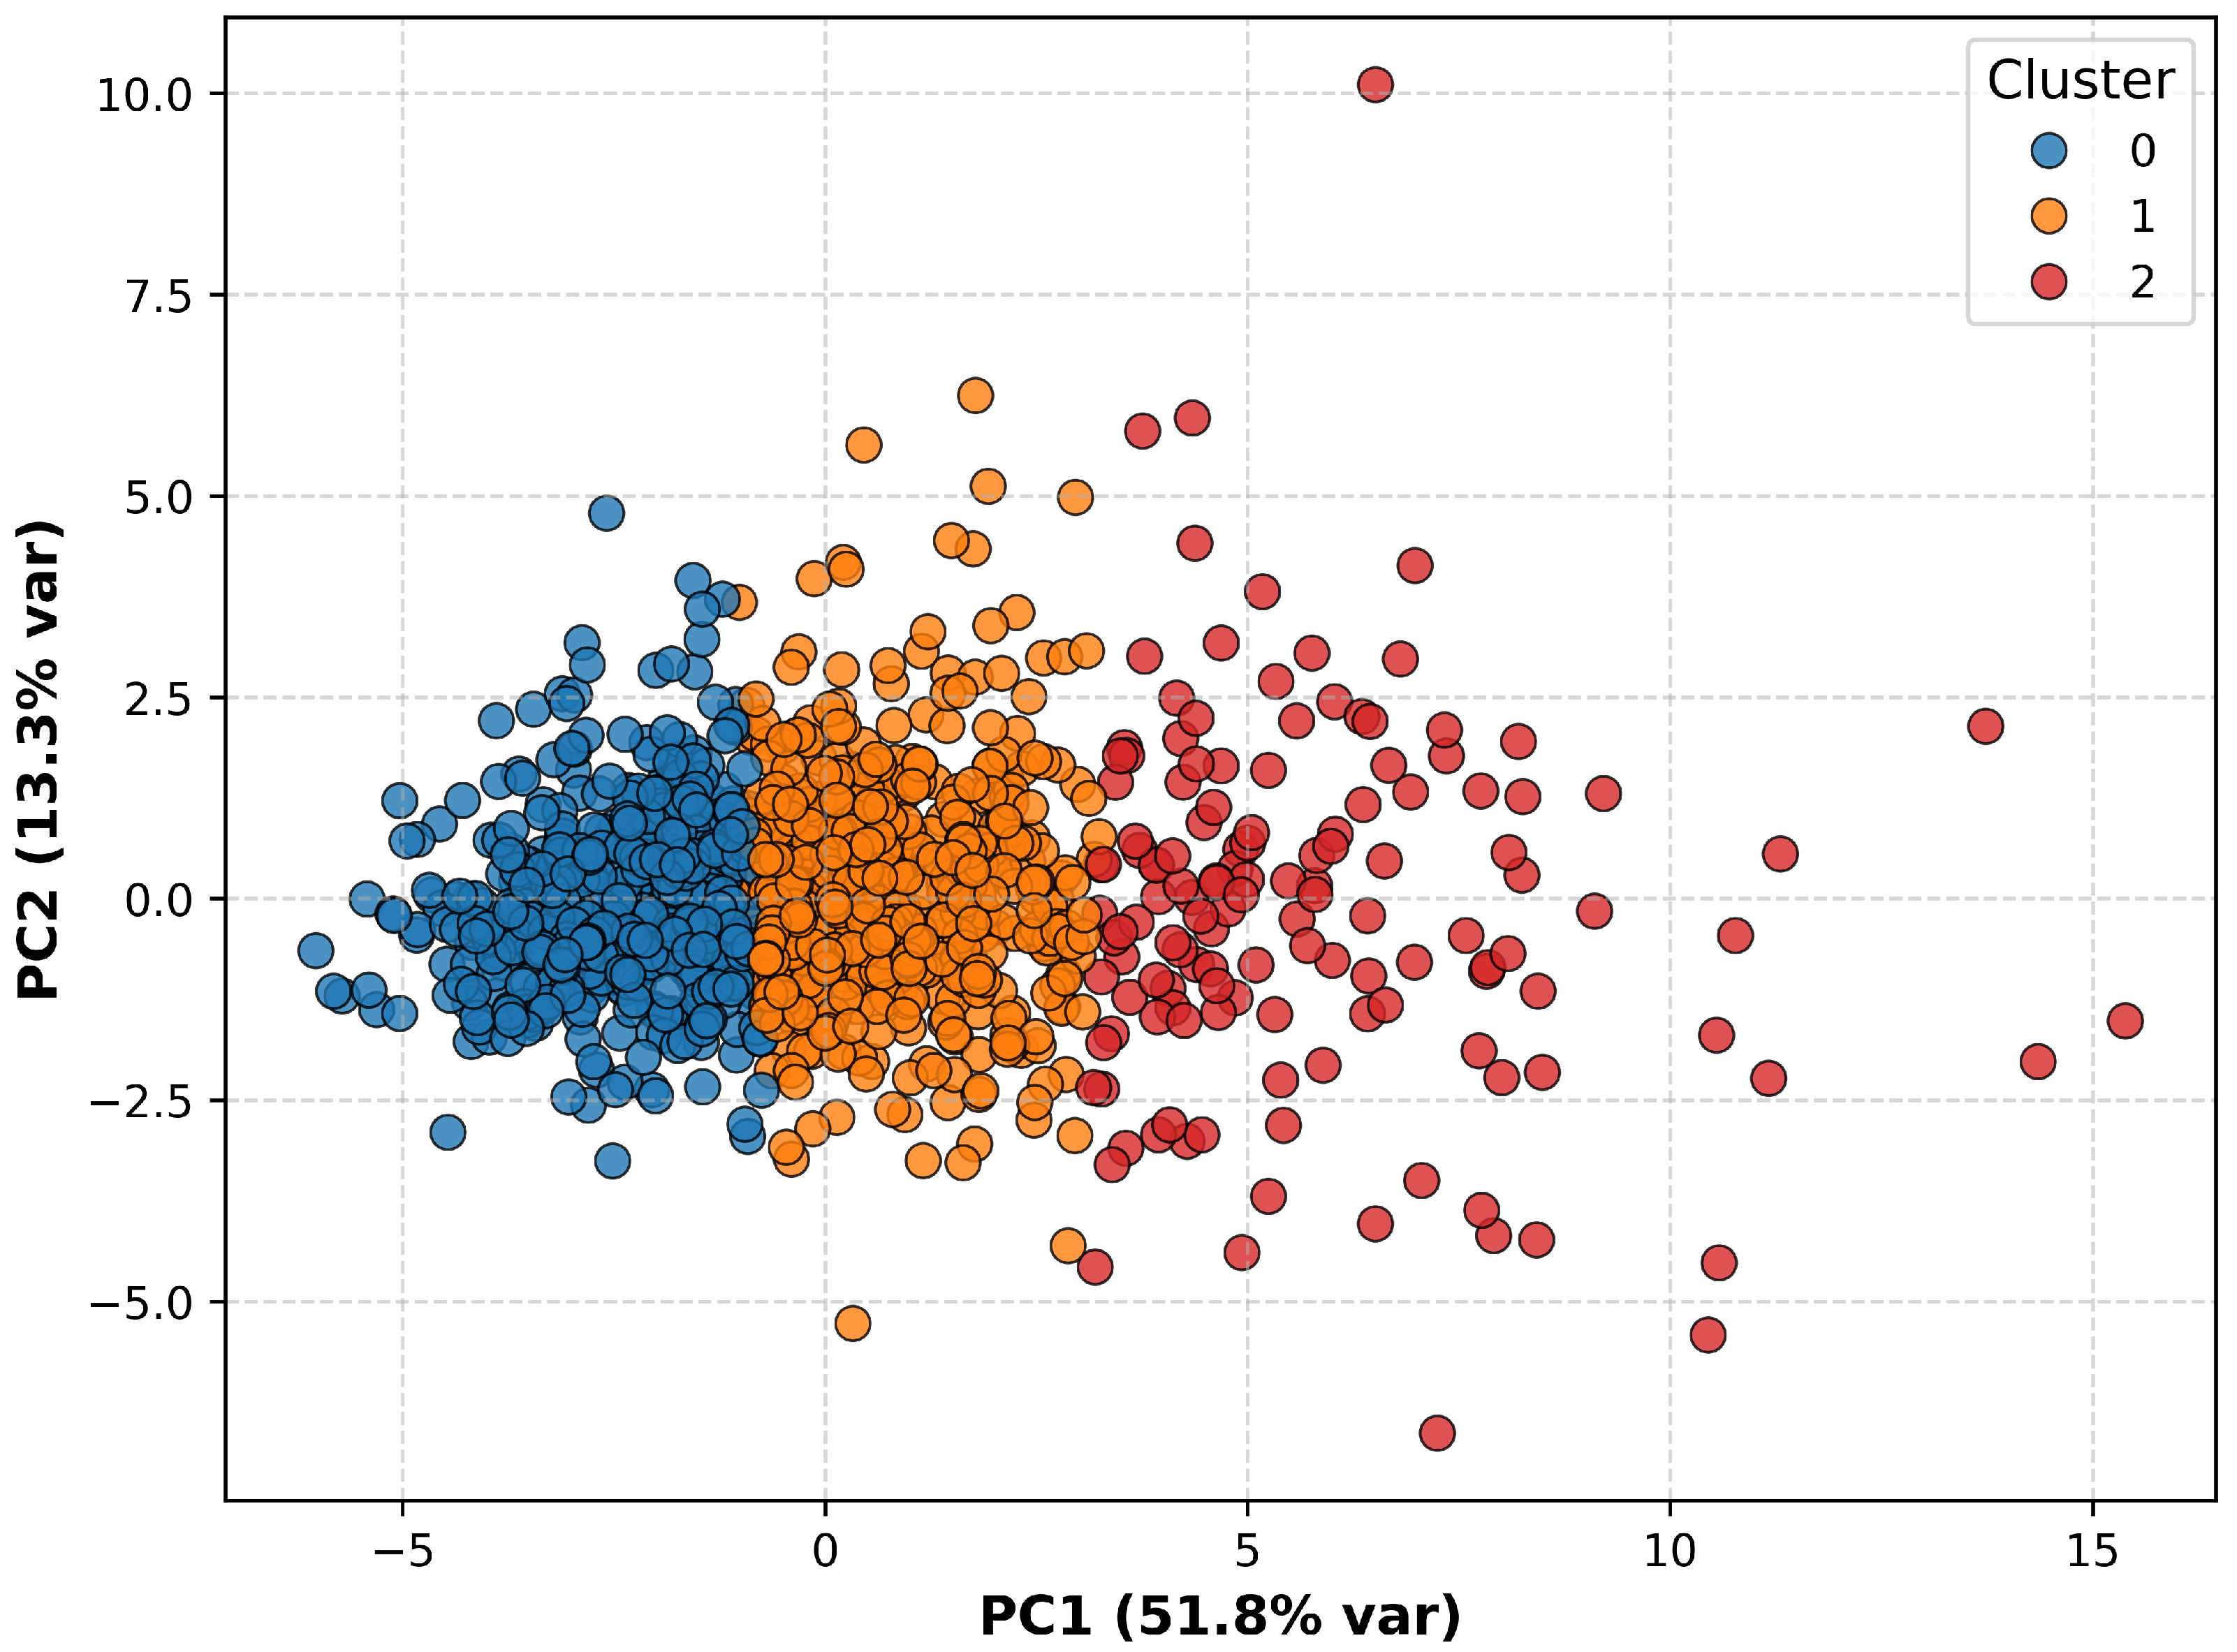
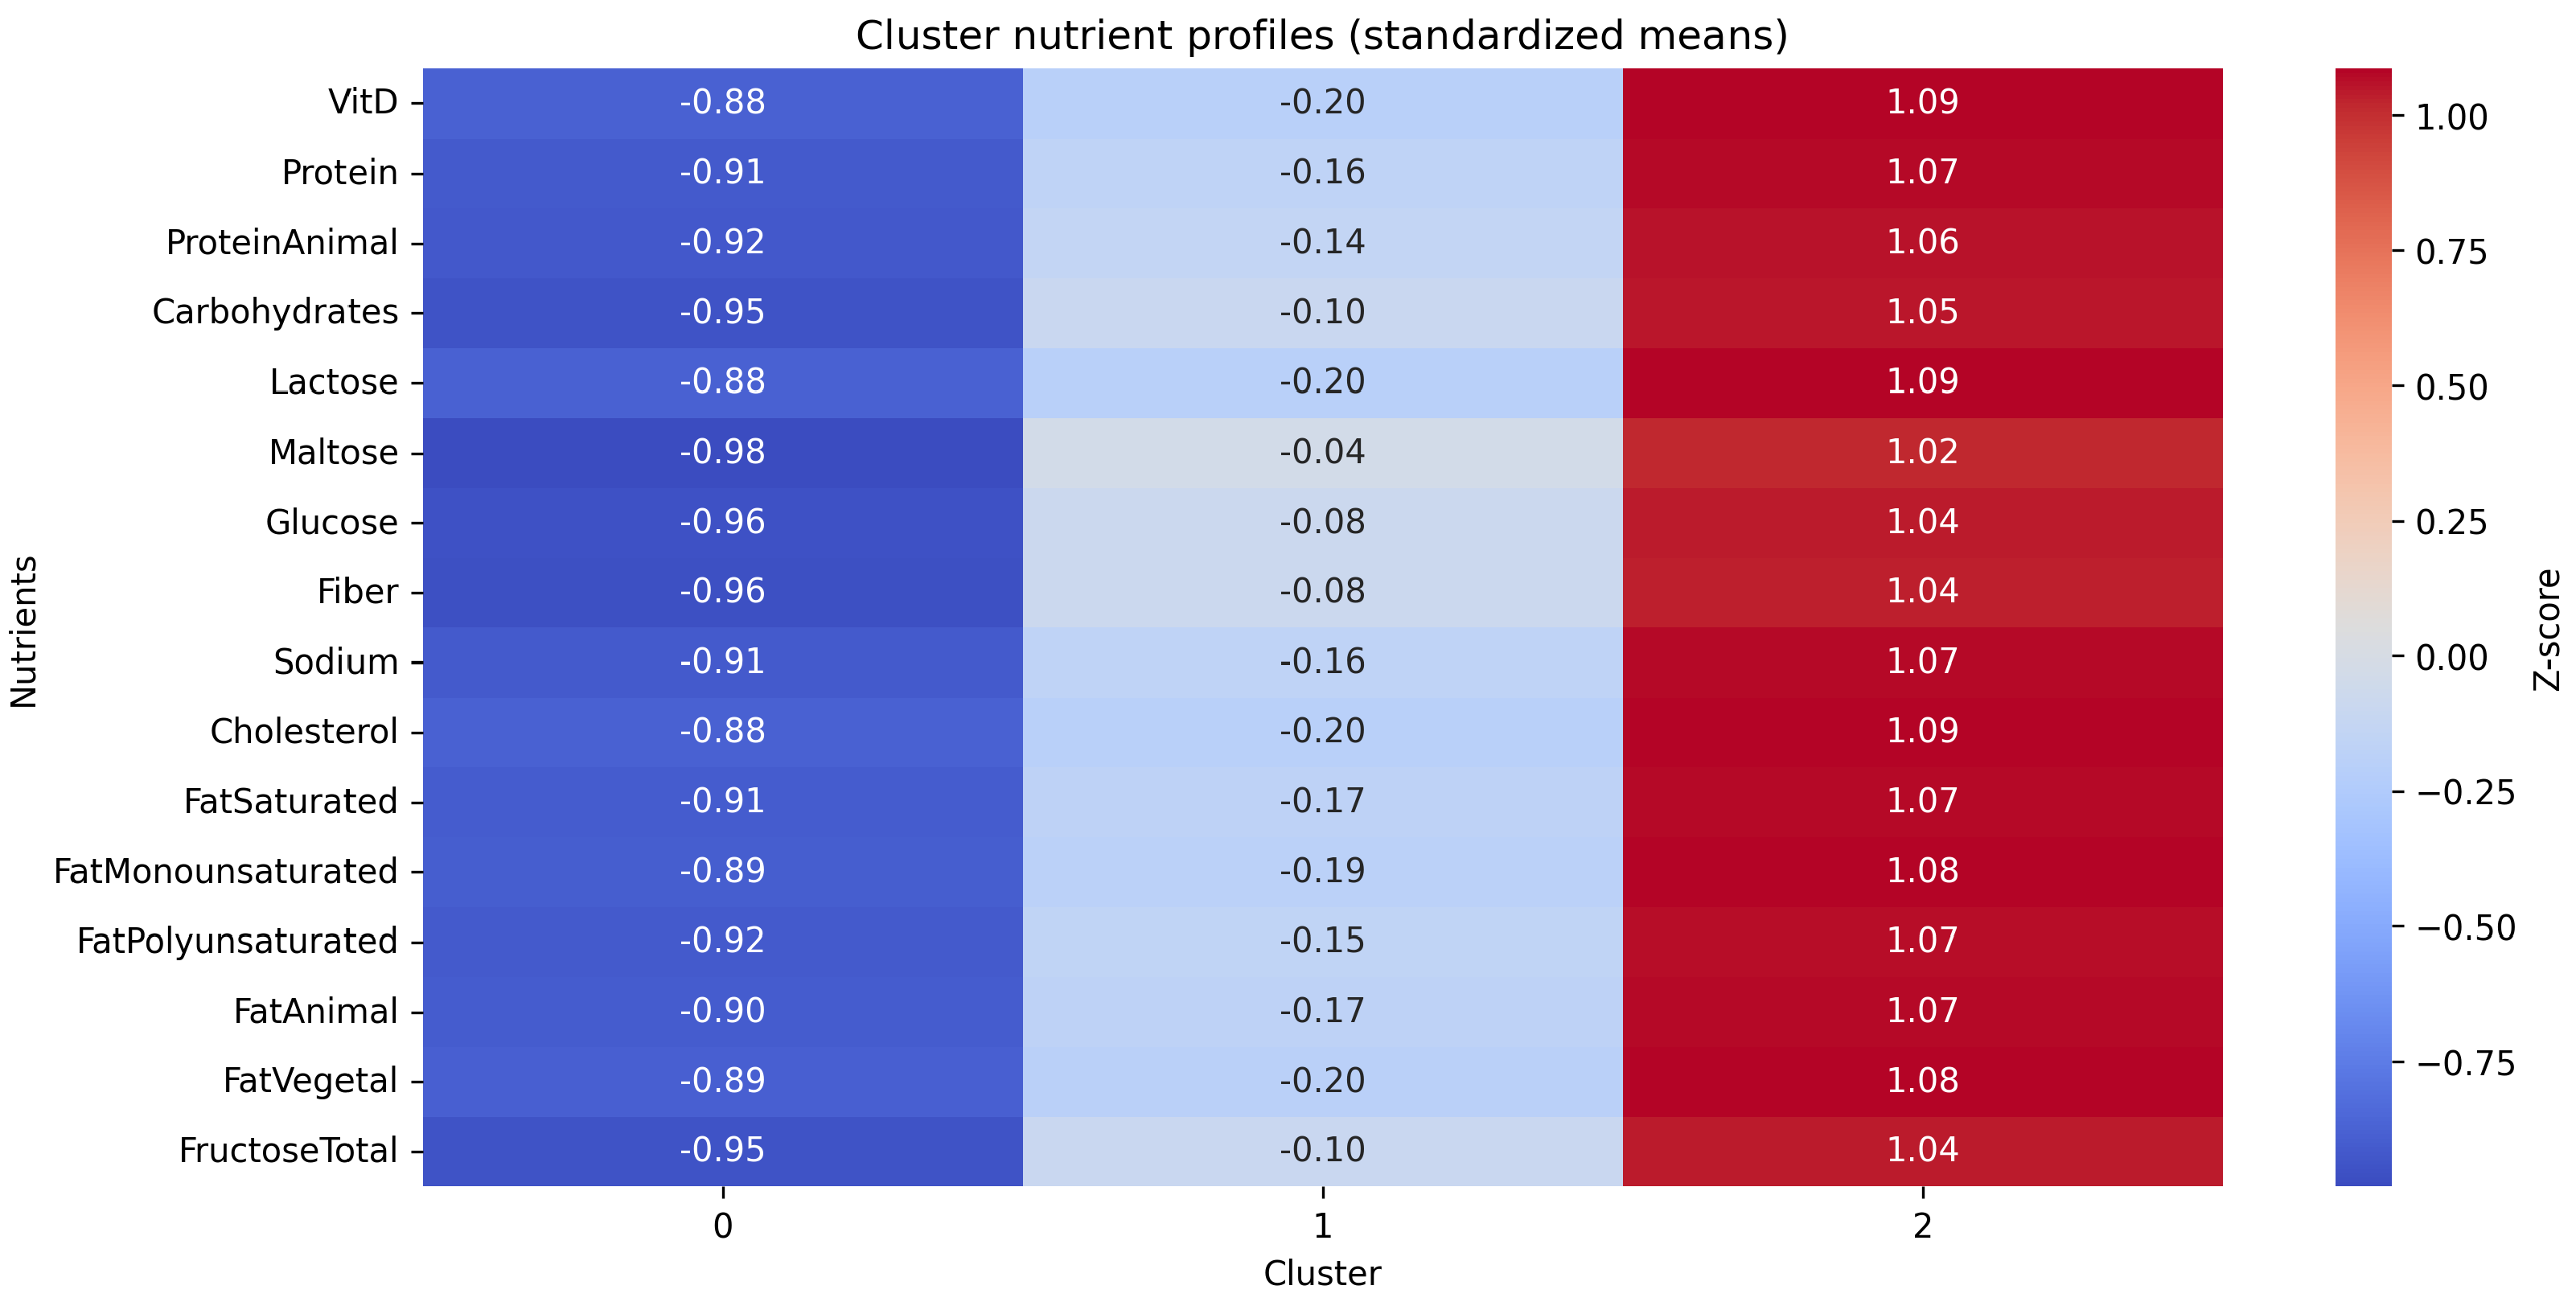
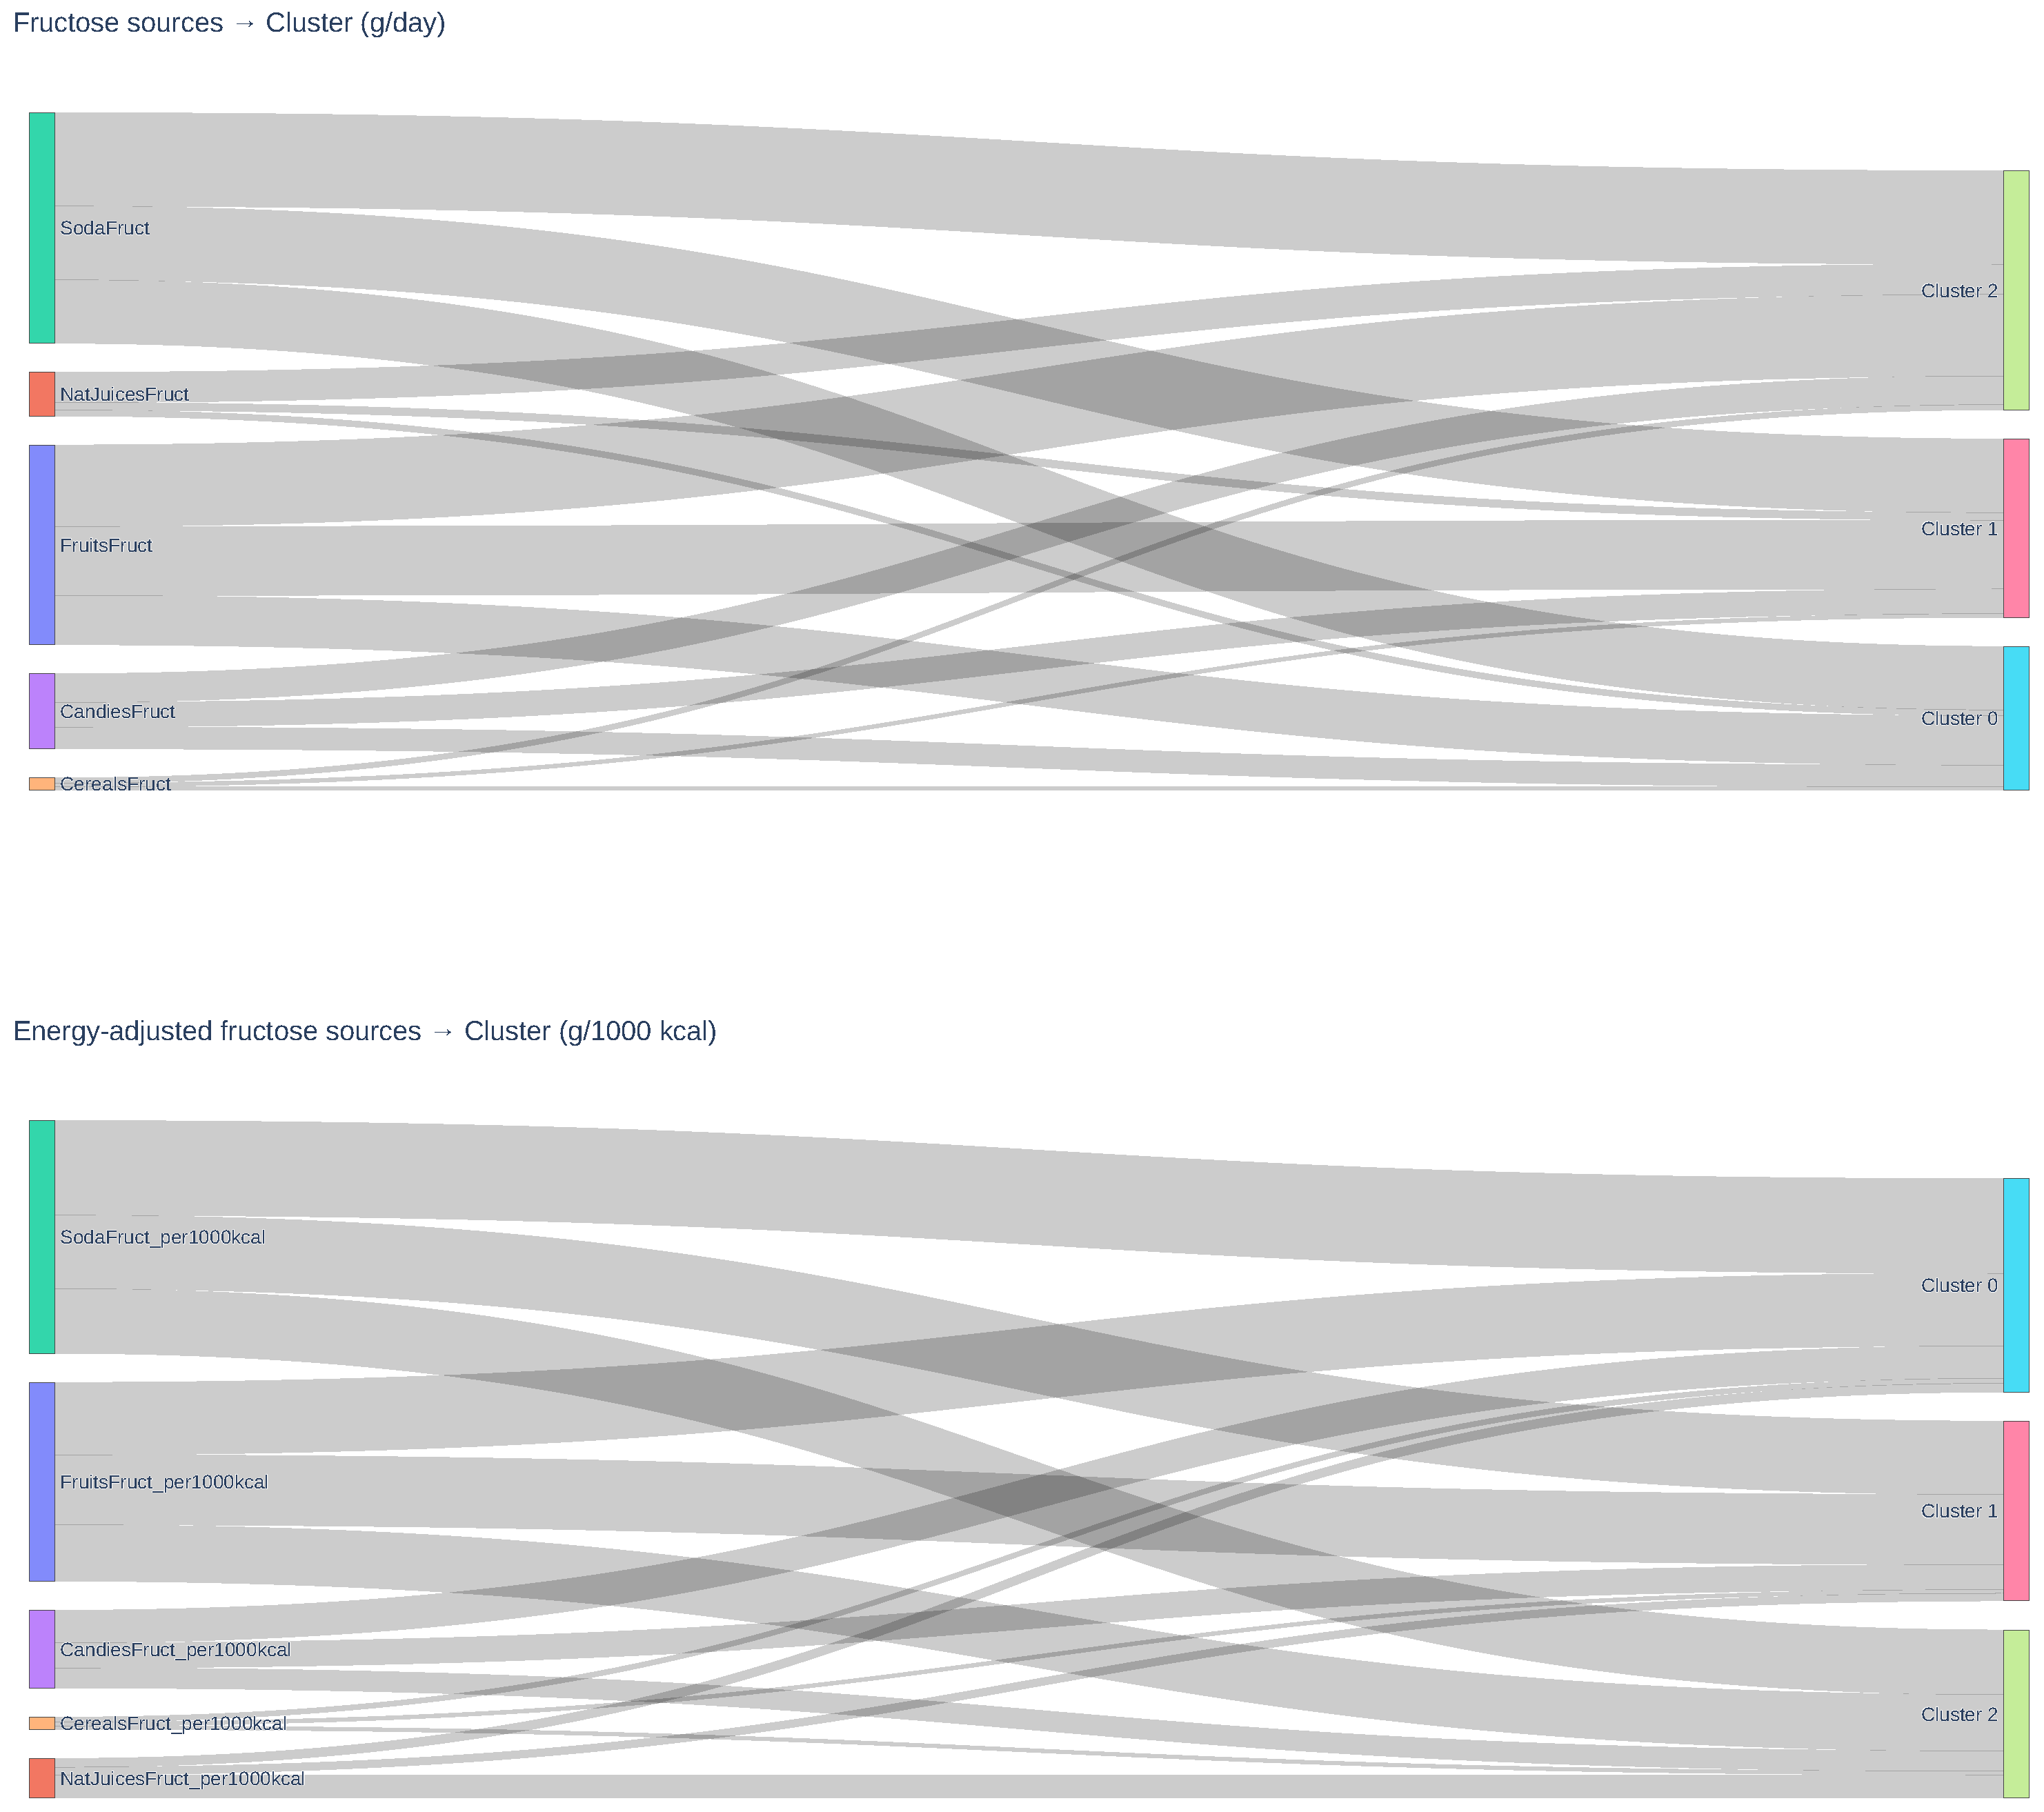
| Variable | Total (n = 1151) | Women (n = 713) | Men (n = 438) |
|---|---|---|---|
| Clinical variables a | |||
| Age (years) | 40 (31–46) | 40 (32–46) | 39 (30–45) |
| BMI (kg/) | 29.0 (26.7–31.7) | 28.8 (26.4–31.7) | 29.3 (27.1–31.8) |
| WC (cm) | 95 (88–102) | 92.5 (86–99) | 98.5 (92–106) |
| SBP (mmHg) | 109 (102–117) | 107 (99–115) | 113 (107–121) |
| DBP (mmHg) | 73 (68–80) | 72 (66–79) | 78 (71–83) |
| Behavioral variables b | |||
| Physical activity (low), n (%) | 415 (36.1) | 236 (33.1) | 179 (40.9) |
| Physical activity (moderate), n (%) | 379 (32.9) | 260 (36.5) | 119 (27.2) |
| High anxiety (state), n (%) | 366 (31.8) | 236 (33.1) | 130 (29.7) |
| High anxiety (trait), n (%) | 377 (32.8) | 278 (39.0) | 99 (22.6) |
| Current smoker, n (%) | 376 (32.7) | 228 (32.0) | 148 (33.8) |
| Alcohol consumption, n (%) | 851 (73.9) | 512 (71.8) | 339 (77.4) |
| Biochemical variables a | |||
| Glucose (mg/dL) | 94 (89–101) | 94 (88–101) | 95 (90–101) |
| Uric acid (mg/dL) | 5.4 (4.6–6.5) | 4.9 (4.2–5.6) | 6.6 (5.7–7.4) |
| Serum creatinine (mg/dL) | 0.8 (0.7–0.9) | 0.7 (0.6–0.8) | 0.9 (0.9–1.0) |
| Total cholesterol (mg/dL) | 181 (162–206) | 180 (162–203) | 184 (163–209) |
| Triglycerides (mg/dL) | 142 (101–197) | 132 (96–181) | 158 (114–234) |
| Serum sodium (mmol/L) | 141 (140–142) | 140 (140–141) | 141 (140–142) |
| Nutritional variables a | |||
| Total fructose (g/day) | 50.9 (35.8–69.6) | 50.1 (36.7–68.6) | 52.3 (35.0–70.2) |
| Natural fructose (g/day) | 20.4 (13.6–28.7) | 21.7 (14.6–29.7) | 18.8 (11.4–26.3) |
| Added fructose (g/day) | 26.0 (17.0–42.7) | 25.2 (15.4–39.9) | 27.4 (17.0–46.0) |
| Sucrose (g/day) | 34.8 (25.9–46.6) | 33.8 (25.9–46.6) | 36.0 (25.9–47.1) |
| Carbohydrates (g/day) | 276 (223–336) | 264 (215–328) | 297 (241–349) |
| Total protein (g/day) | 77 (61.9–92.9) | 73.5 (60.8–88.7) | 82.2 (66.0–100.9) |
| Animal protein (g/day) | 41.4 (30.9–53.3) | 39.7 (30.0–50.4) | 46.5 (33.7–57.5) |
| Total fat (g/day) | 89.2 (70.1–111.4) | 84.8 (67.0–104.3) | 96.7 (76.5–119.0) |
| Saturated fat (g/day) | 25.2 (19.4–31.9) | 23.6 (18.8–30.0) | 27.4 (20.8–34.8) |
| Monounsaturated fat (g/day) | 35.6 (27.2–45.4) | 32.8 (26.4–42.9) | 39.1 (30.3–49.3) |
| Polyunsaturated fat (g/day) | 17.6 (14.1–24.0) | 17.3 (13.7–24.0) | 18.2 (14.5–24.0) |
| Fiber (g/day) | 6.0 (4.8–7.5) | 5.9 (4.8–7.5) | 6.1 (4.6–7.6) |
| Total energy intake (kcal/day) | 2130 (1741–2563) | 2058 (1680–2483) | 2302 (1859–2727) |
| Variable | Cluster 0 | Cluster 1 | Cluster 2 | F | p-Value |
|---|---|---|---|---|---|
| Energy intake | |||||
| Total energy (kcal/day) | 1660.4 | 2404.3 | 3543.7 | 1526.3 | <0.001 |
| Protein (kcal/day) | 239.2 | 347.0 | 524.5 | 1230.8 | <0.001 |
| Carbohydrates (kcal/day) | 874.9 | 1231.6 | 1715.5 | 613.8 | <0.001 |
| Fat (kcal/day) | 546.4 | 825.7 | 1303.8 | 1104.4 | <0.001 |
| Fructose intake | |||||
| Natural fructose (g/day) | 17.1 | 23.7 | 34.6 | 15.09 | <0.001 |
| Added fructose (g/day) | 24.2 | 34.5 | 45.4 | 68.9 | <0.001 |
| Natural fructose (g/1000 kcal) | 10.5 | 10.0 | 10.3 | 0.14 | 0.871 |
| Added fructose (g/1000 kcal) | 14.2 | 14.3 | 12.9 | 1.5 | 0.222 |
| Fructose sources | |||||
| Natural juice (g/day) | 1.8 | 2.3 | 9.4 | 5.2 | 0.006 |
| Fruits (g/day) | 15.3 | 21.4 | 25.3 | 14.6 | <0.001 |
| Cereals (g/day) | 1.02 | 1.2 | 1.6 | 28.0 | <0.001 |
| Candies (g/day) | 6.8 | 7.6 | 8.9 | 2.5 | 0.08 |
| Soda (g/day) | 19.7 | 22.8 | 28.9 | 9.7 | <0.001 |
| Natural juice (g/1000 kcal) | 1.2 | 1.0 | 3.0 | 3.3 | 0.039 |
| Fruits (g/1000 kcal) | 9.3 | 9.0 | 7.3 | 1.7 | 0.183 |
| Cereals (g/1000 kcal) | 0.7 | 0.5 | 0.5 | 15.8 | <0.001 |
| Candies (g/1000 kcal) | 4.2 | 3.2 | 2.6 | 6.5 | 0.002 |
| Soda (g/1000 kcal) | 12.2 | 9.5 | 8.3 | 7.6 | 0.001 |
| Anthropometry | |||||
| Height (m) | 1.61 | 1.63 | 1.64 | 10.0 | <0.001 |
| Waist circumference (cm) | 94.3 | 95.4 | 98.5 | 6.5 | 0.002 |
| Weight (kg) | 75.2 | 77.6 | 81.3 | 9.6 | <0.001 |
| BMI (kg/) | 29.0 | 29.2 | 30.1 | 3.2 | 0.042 |
| Age (years) | 38.2 | 38.4 | 36.2 | 3.4 | 0.036 |
| Biochemical variables | |||||
| Uric acid (mg/dL) | 5.4 | 5.7 | 5.8 | 5.7 | 0.003 |
| Serum creatinine (mg/dL) | 0.7 | 0.8 | 0.8 | 8.1 | <0.001 |
| Glucose (mg/dL) | 96.2 | 97.9 | 99.1 | 1.18 | 0.308 |
| Total cholesterol (mg/dL) | 185.1 | 184.5 | 183.9 | 0.1 | 0.930 |
| Triglycerides (mg/dL) | 160.6 | 173.4 | 170.4 | 1.46 | 0.233 |
| Serum sodium (mmol/L) | 140.7 | 140.4 | 140.7 | 0.95 | 0.386 |
| Atherogenic index | 2.8 | 2.9 | 2.9 | 0.8 | 0.456 |
| Sleep and lifestyle | |||||
| Sleep alterations | 26.78 | 27.15 | 27.29 | 0.05 | 0.952 |
| Snoring | 39.3 | 43.5 | 48.1 | 4.8 | 0.009 |
| Sleep breathing risk | 13.06 | 12.32 | 14.85 | 0.74 | 0.479 |
| Sleep adequacy | 52.36 | 53.50 | 54.93 | 0.47 | 0.625 |
| Drowsy | 28.20 | 28.59 | 30.93 | 1.46 | 0.232 |
| Overall sleep quality | 6.50 | 6.59 | 6.56 | 0.49 | 0.611 |
| Sleep optimal | 0.43 | 0.41 | 0.43 | 0.22 | 0.800 |
| Smoked | 0.61 | 0.67 | 0.79 | 7.39 | 0.001 |
| Currently smoking | 0.31 | 0.32 | 0.41 | 2.55 | 0.079 |
| Daily smoker | 0.11 | 0.10 | 0.16 | 1.93 | 0.145 |
| Ex smoker | 0.19 | 0.22 | 0.21 | 0.74 | 0.477 |
| Passive smoker | 0.39 | 0.39 | 0.45 | 0.85 | 0.429 |
| Alcohol consumption | 0.74 | 0.73 | 0.76 | 0.29 | 0.749 |
| Energy drink consumption | 0.07 | 0.08 | 0.12 | 1.78 | 0.169 |
| XGBoost | HistGradientBoosting | Random Forest | |||
|---|---|---|---|---|---|
| Feature | SHAP | Feature | Importance | Feature | Importance |
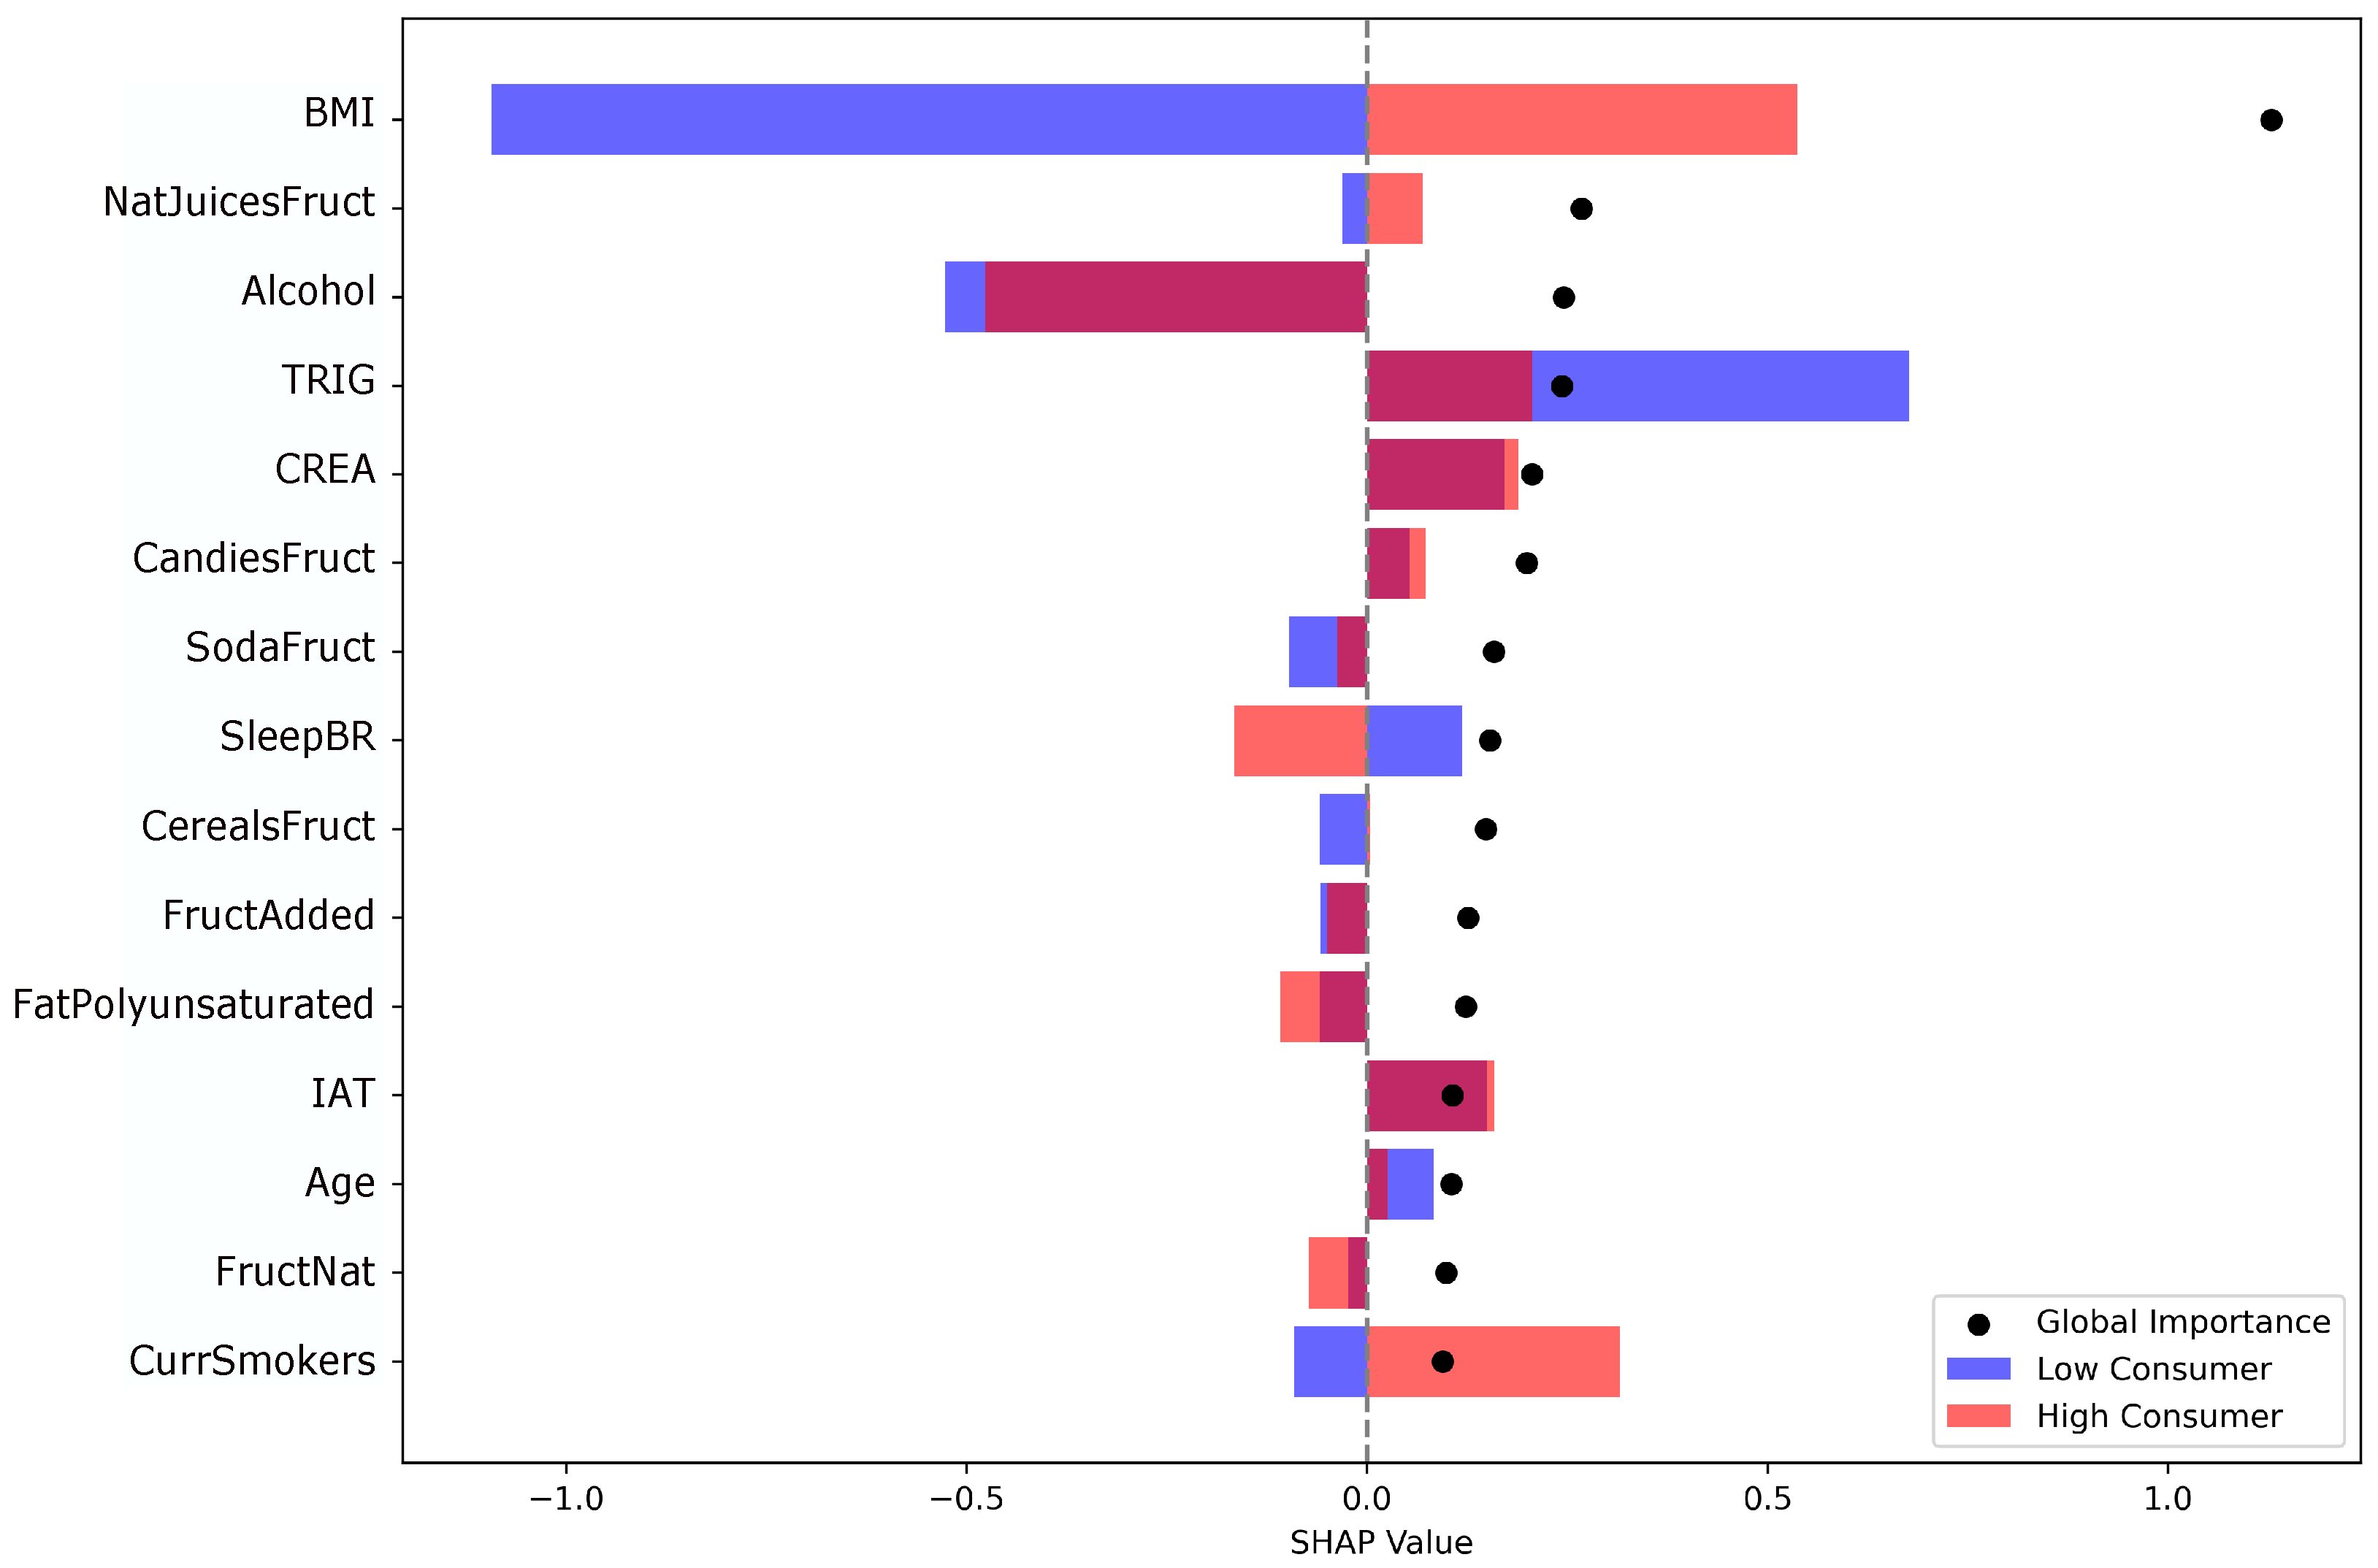
| BMI | 1.0564 | BMI | 0.1506 | BMI | 0.1303 |
| Alcohol | 0.2563 | WC | 0.0640 | NatJuicesFruct | 0.0251 |
| NatJuicesFruct | 0.2314 | Weight | 0.0485 | Alcohol | 0.0239 |
| TRIG | 0.2182 | NatJuicesFruct | 0.0444 | FatAnimal | 0.0072 |
| CandiesFruct | 0.1929 | TRIG | 0.0325 | CHOL | 0.0063 |
| CREA | 0.1862 | CandiesFruct | 0.0285 | Snoring | 0.0063 |
| SodaFruct | 0.1587 | SodaFruct | 0.0274 | GLU | 0.0049 |
| SleepBR | 0.1584 | IAT | 0.0274 | SleepQual | 0.0034 |
| CerealsFruct | 0.1509 | CerealsFruct | 0.0260 | HighAnxState | 0.0034 |
| Algorithm | Balanced Accuracy (95% CI) | Sensitivity (95% CI) | Specificity (95% CI) | F1 (95% CI) | AUC (95% CI) |
|---|---|---|---|---|---|
| XGBoost | 81.8 (79.9–83.6) | 88.1 (84.1–92.1) | 75.4 (72.4–78.5) | 82.8 (80.9–84.7) | 0.893 (0.882–0.904) |
| Random Forest | 87.51 (77.11–95.85) | 96.92 (95.09–98.49) | 78.09 (57.14–94.45) | 97.83 (96.70–98.80) | 0.979 (0.960–0.994) |
| HistGradient Boosting | 88.41 (78.04–96.91) | 99.09 (97.88–100.00) | 77.74 (57.14–94.74) | 98.94 (98.13–99.69) | 0.992 (0.980–0.999) |
| Logistic Regression | 77.17 (75.35–79.26) | 73.33 (70.40–76.11) | 81.00 (78.62–83.66) | 76.09 (73.81–78.44) | 0.772 (0.753–0.793) |
| Feature | Coefficient | Direction | p-Value | Significant |
|---|---|---|---|---|
| Natural fructose (g/day) | −393.98 | ↓ | <0.001 | Yes |
| Fructose from fruits (g/day) | 290.09 | ↑ | <0.001 | Yes |
| Fructose from natural juices (g/day) | 259.46 | ↑ | <0.001 | Yes |
| Fructose from soda (g/day) | 22.39 | ↑ | 0.001 | Yes |
| Added fructose (g/day) | −20.15 | ↓ | 0.002 | Yes |
| Fructose from candies (g/day) | 10.61 | ↑ | 0.015 | Yes |
| Fructose from cereals (g/day) | 1.20 | ↑ | 0.083 | No |
| Total carbohydrate (g/day) | −0.91 | ↓ | 0.107 | No |
| Monounsaturated fat (g/day) | −0.70 | ↓ | 0.129 | No |
| Vegetable fat (g/day) | 0.65 | ↑ | 0.136 | No |
| Alcohol consumption | 0.53 | ↑ | 0.148 | No |
| Total protein (g/day) | 0.51 | ↑ | 0.152 | No |
| Height () | −0.49 | ↓ | 0.165 | No |
| Body mass index (kg/) | 0.40 | ↑ | 0.172 | No |
| Currently smokes | 0.37 | ↑ | 0.181 | No |
Disclaimer/Publisher’s Note: The statements, opinions and data contained in all publications are solely those of the individual author(s) and contributor(s) and not of MDPI and/or the editor(s). MDPI and/or the editor(s) disclaim responsibility for any injury to people or property resulting from any ideas, methods, instructions or products referred to in the content. |
© 2025 by the authors. Licensee MDPI, Basel, Switzerland. This article is an open access article distributed under the terms and conditions of the Creative Commons Attribution (CC BY) license (https://creativecommons.org/licenses/by/4.0/).
Share and Cite
Gutiérrez-Esparza, G.; Martínez-García, M.; González Salazar, M.d.C.; Amezcua-Guerra, L.M.; Brianza-Padilla, M.; Ramírez-delReal, T.; Hernández-Lemus, E. Identifying Key Features Associated with Excessive Fructose Intake: A Machine Learning Analysis of a Mexican Cohort. Nutrients 2025, 17, 3623. https://doi.org/10.3390/nu17223623
Gutiérrez-Esparza G, Martínez-García M, González Salazar MdC, Amezcua-Guerra LM, Brianza-Padilla M, Ramírez-delReal T, Hernández-Lemus E. Identifying Key Features Associated with Excessive Fructose Intake: A Machine Learning Analysis of a Mexican Cohort. Nutrients. 2025; 17(22):3623. https://doi.org/10.3390/nu17223623
Chicago/Turabian StyleGutiérrez-Esparza, Guadalupe, Mireya Martínez-García, María del Carmen González Salazar, Luis M. Amezcua-Guerra, Malinalli Brianza-Padilla, Tania Ramírez-delReal, and Enrique Hernández-Lemus. 2025. "Identifying Key Features Associated with Excessive Fructose Intake: A Machine Learning Analysis of a Mexican Cohort" Nutrients 17, no. 22: 3623. https://doi.org/10.3390/nu17223623
APA StyleGutiérrez-Esparza, G., Martínez-García, M., González Salazar, M. d. C., Amezcua-Guerra, L. M., Brianza-Padilla, M., Ramírez-delReal, T., & Hernández-Lemus, E. (2025). Identifying Key Features Associated with Excessive Fructose Intake: A Machine Learning Analysis of a Mexican Cohort. Nutrients, 17(22), 3623. https://doi.org/10.3390/nu17223623


