Image-Based Dietary Energy and Macronutrients Estimation with ChatGPT-5: Cross-Source Evaluation Across Escalating Context Scenarios
Abstract
1. Introduction
2. Materials and Methods
2.1. Database
- Allrecipes.com [20]: Provides caloric content and macronutrient distribution of meal recipes spanning diverse gastronomic traditions, accompanied by user-shared images that provide authentic visual representations of the dishes. From an estimated population of 51,000 dishes, a sample of 96 was drawn, meeting the criteria for a 10% margin of error at a 95% confidence level.
- SNAPMe [11]: Collection of food photographs annotated with portion sizes and nutritional values, contributed by U.S. participants. Images include a reference object to assist with accurate volume estimation. For a population of 275 dishes, a sample of 74 was selected for a 10% margin of error at a 95% confidence level.
- Home-prepared: Comprises 25 dishes prepared and carefully annotated by nutritionists, serving as a baseline for comparison. Nutritional data were obtained through direct quantity measurements and energy content analysis using Nutrix 1.0 [21] (a specialized software developed by Universidad Europea del Atlántico) and food equivalence tables, including the Mexican System of Food Equivalents (SMAE) [22] and the U.S. Department of Agriculture (USDA) FoodData Central [23]. A reference object (i.e., a ruler marked in centimeters) was placed in each photograph to support accurate volume and depth estimation. Images were captured with a mobile device (iPhone 16 Pro Max) under varying lighting conditions.
2.2. Evaluation Metrics
2.3. Visual Analysis
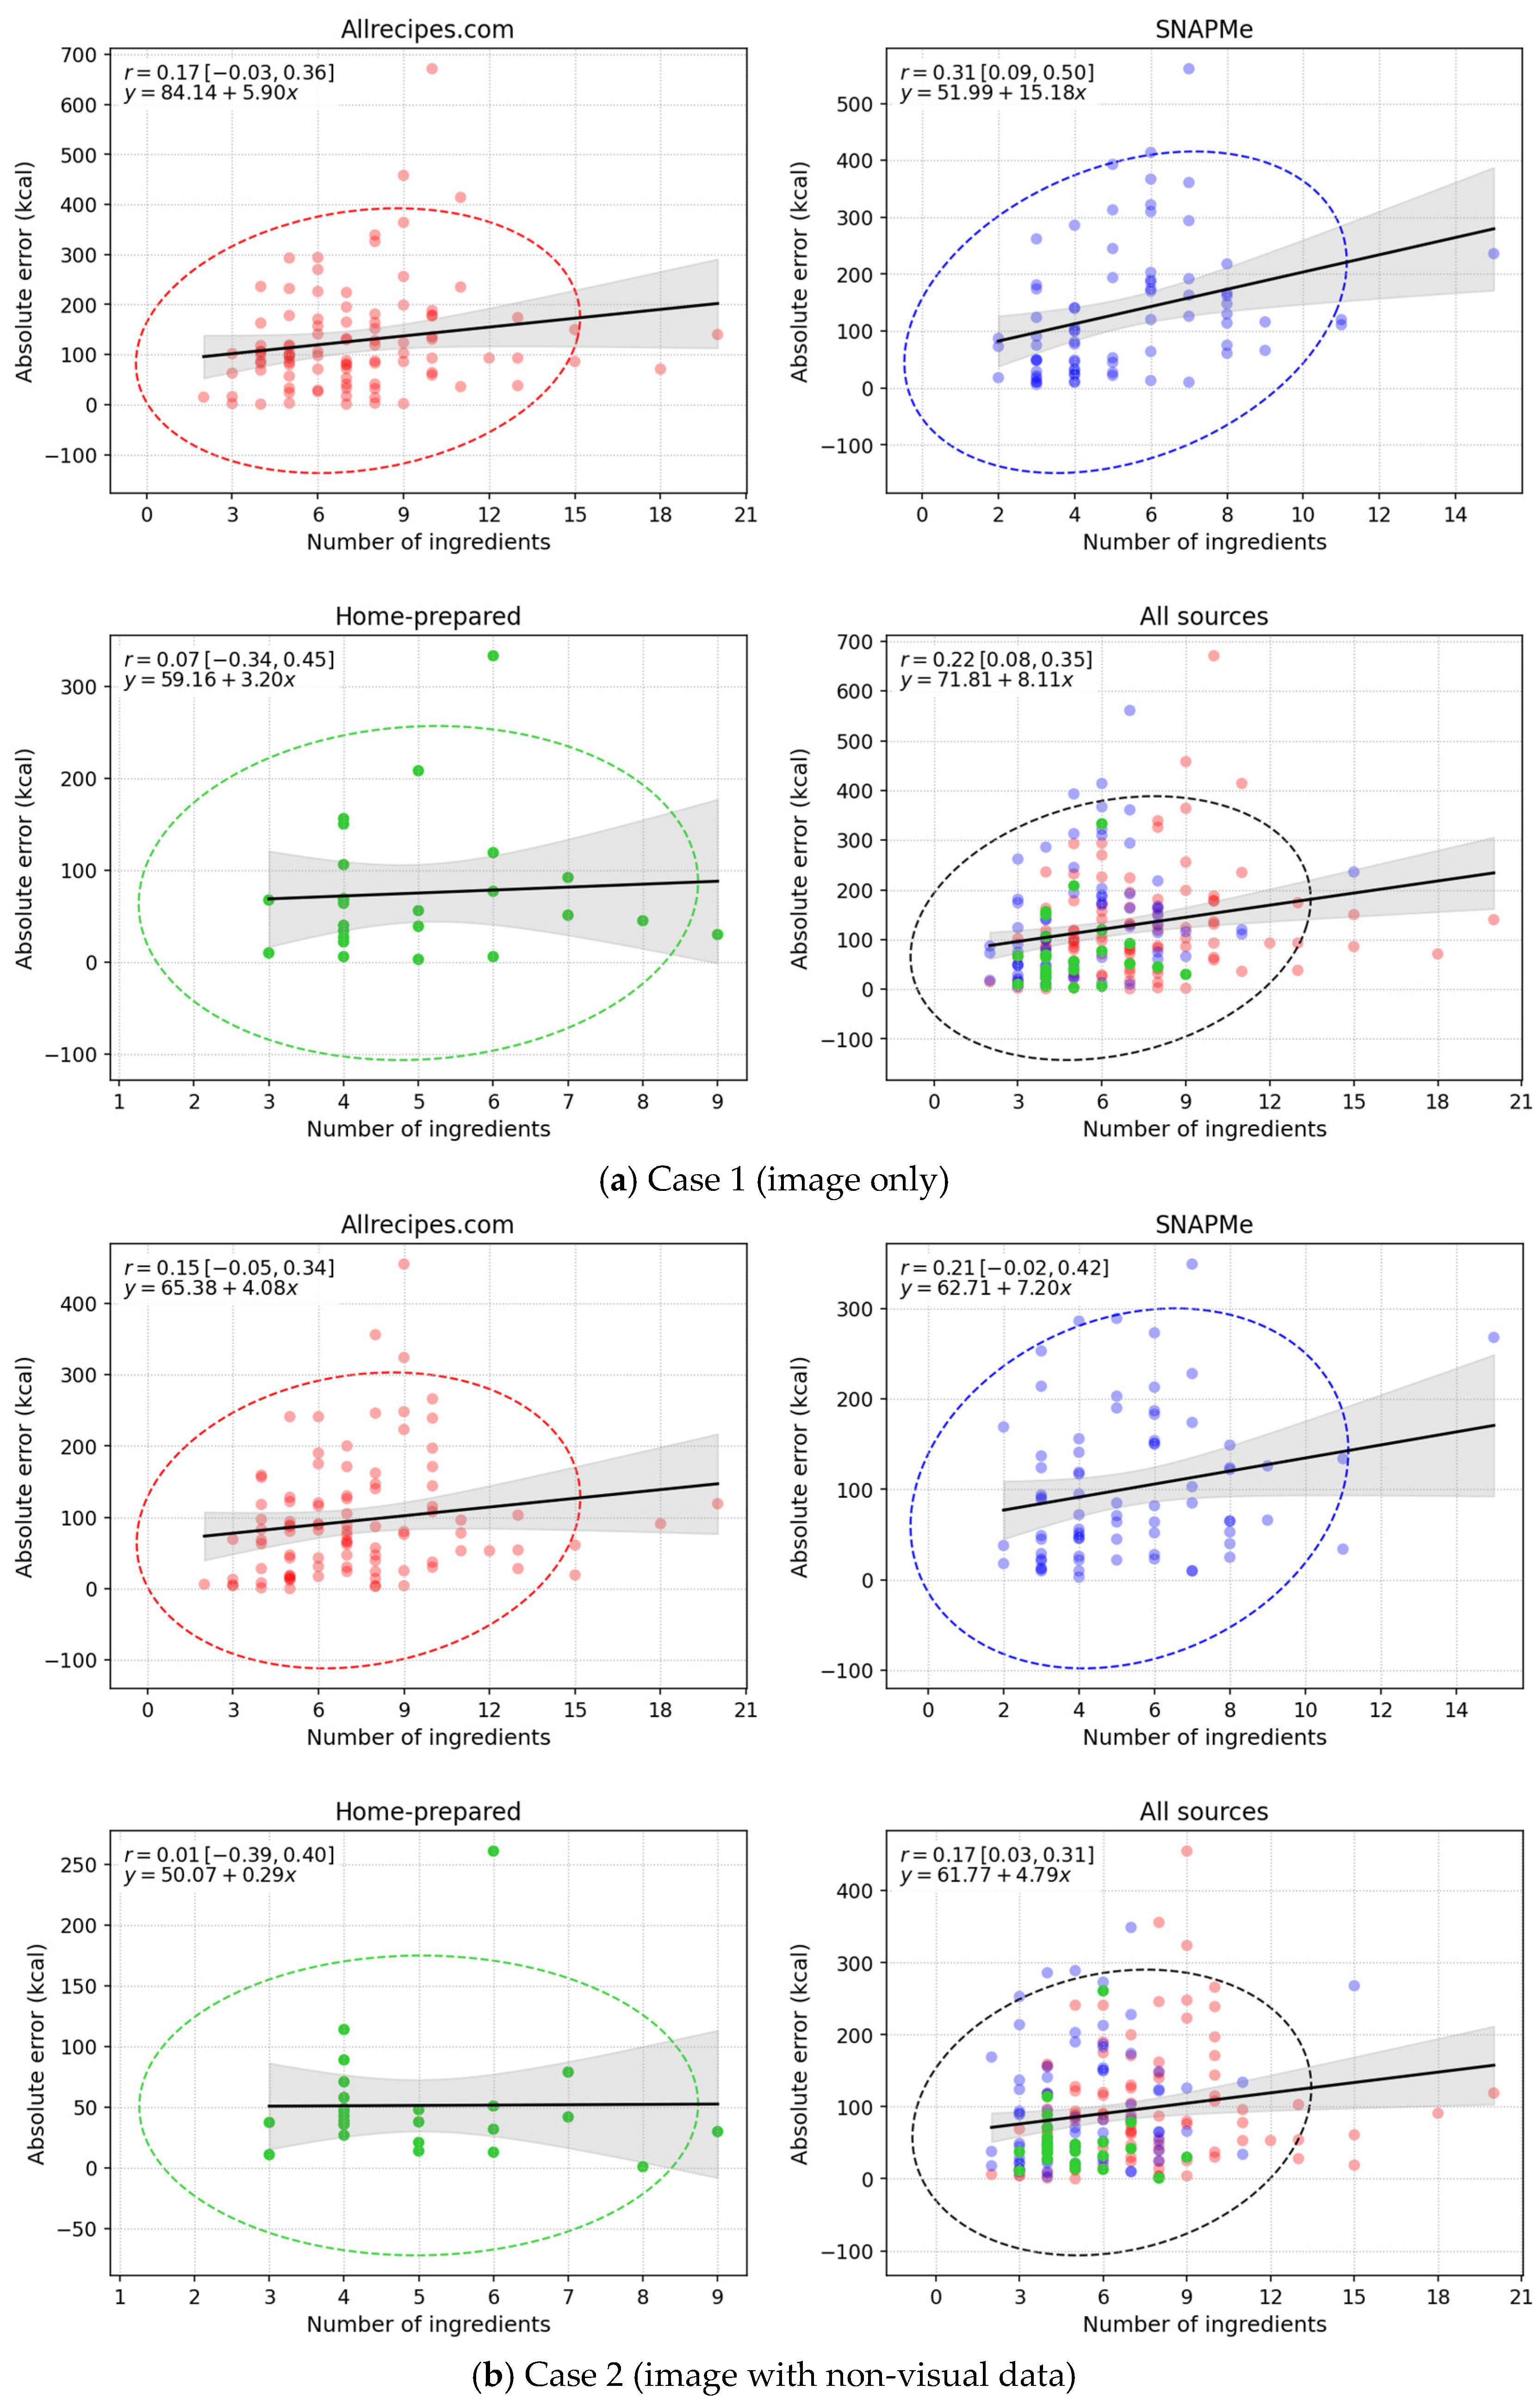
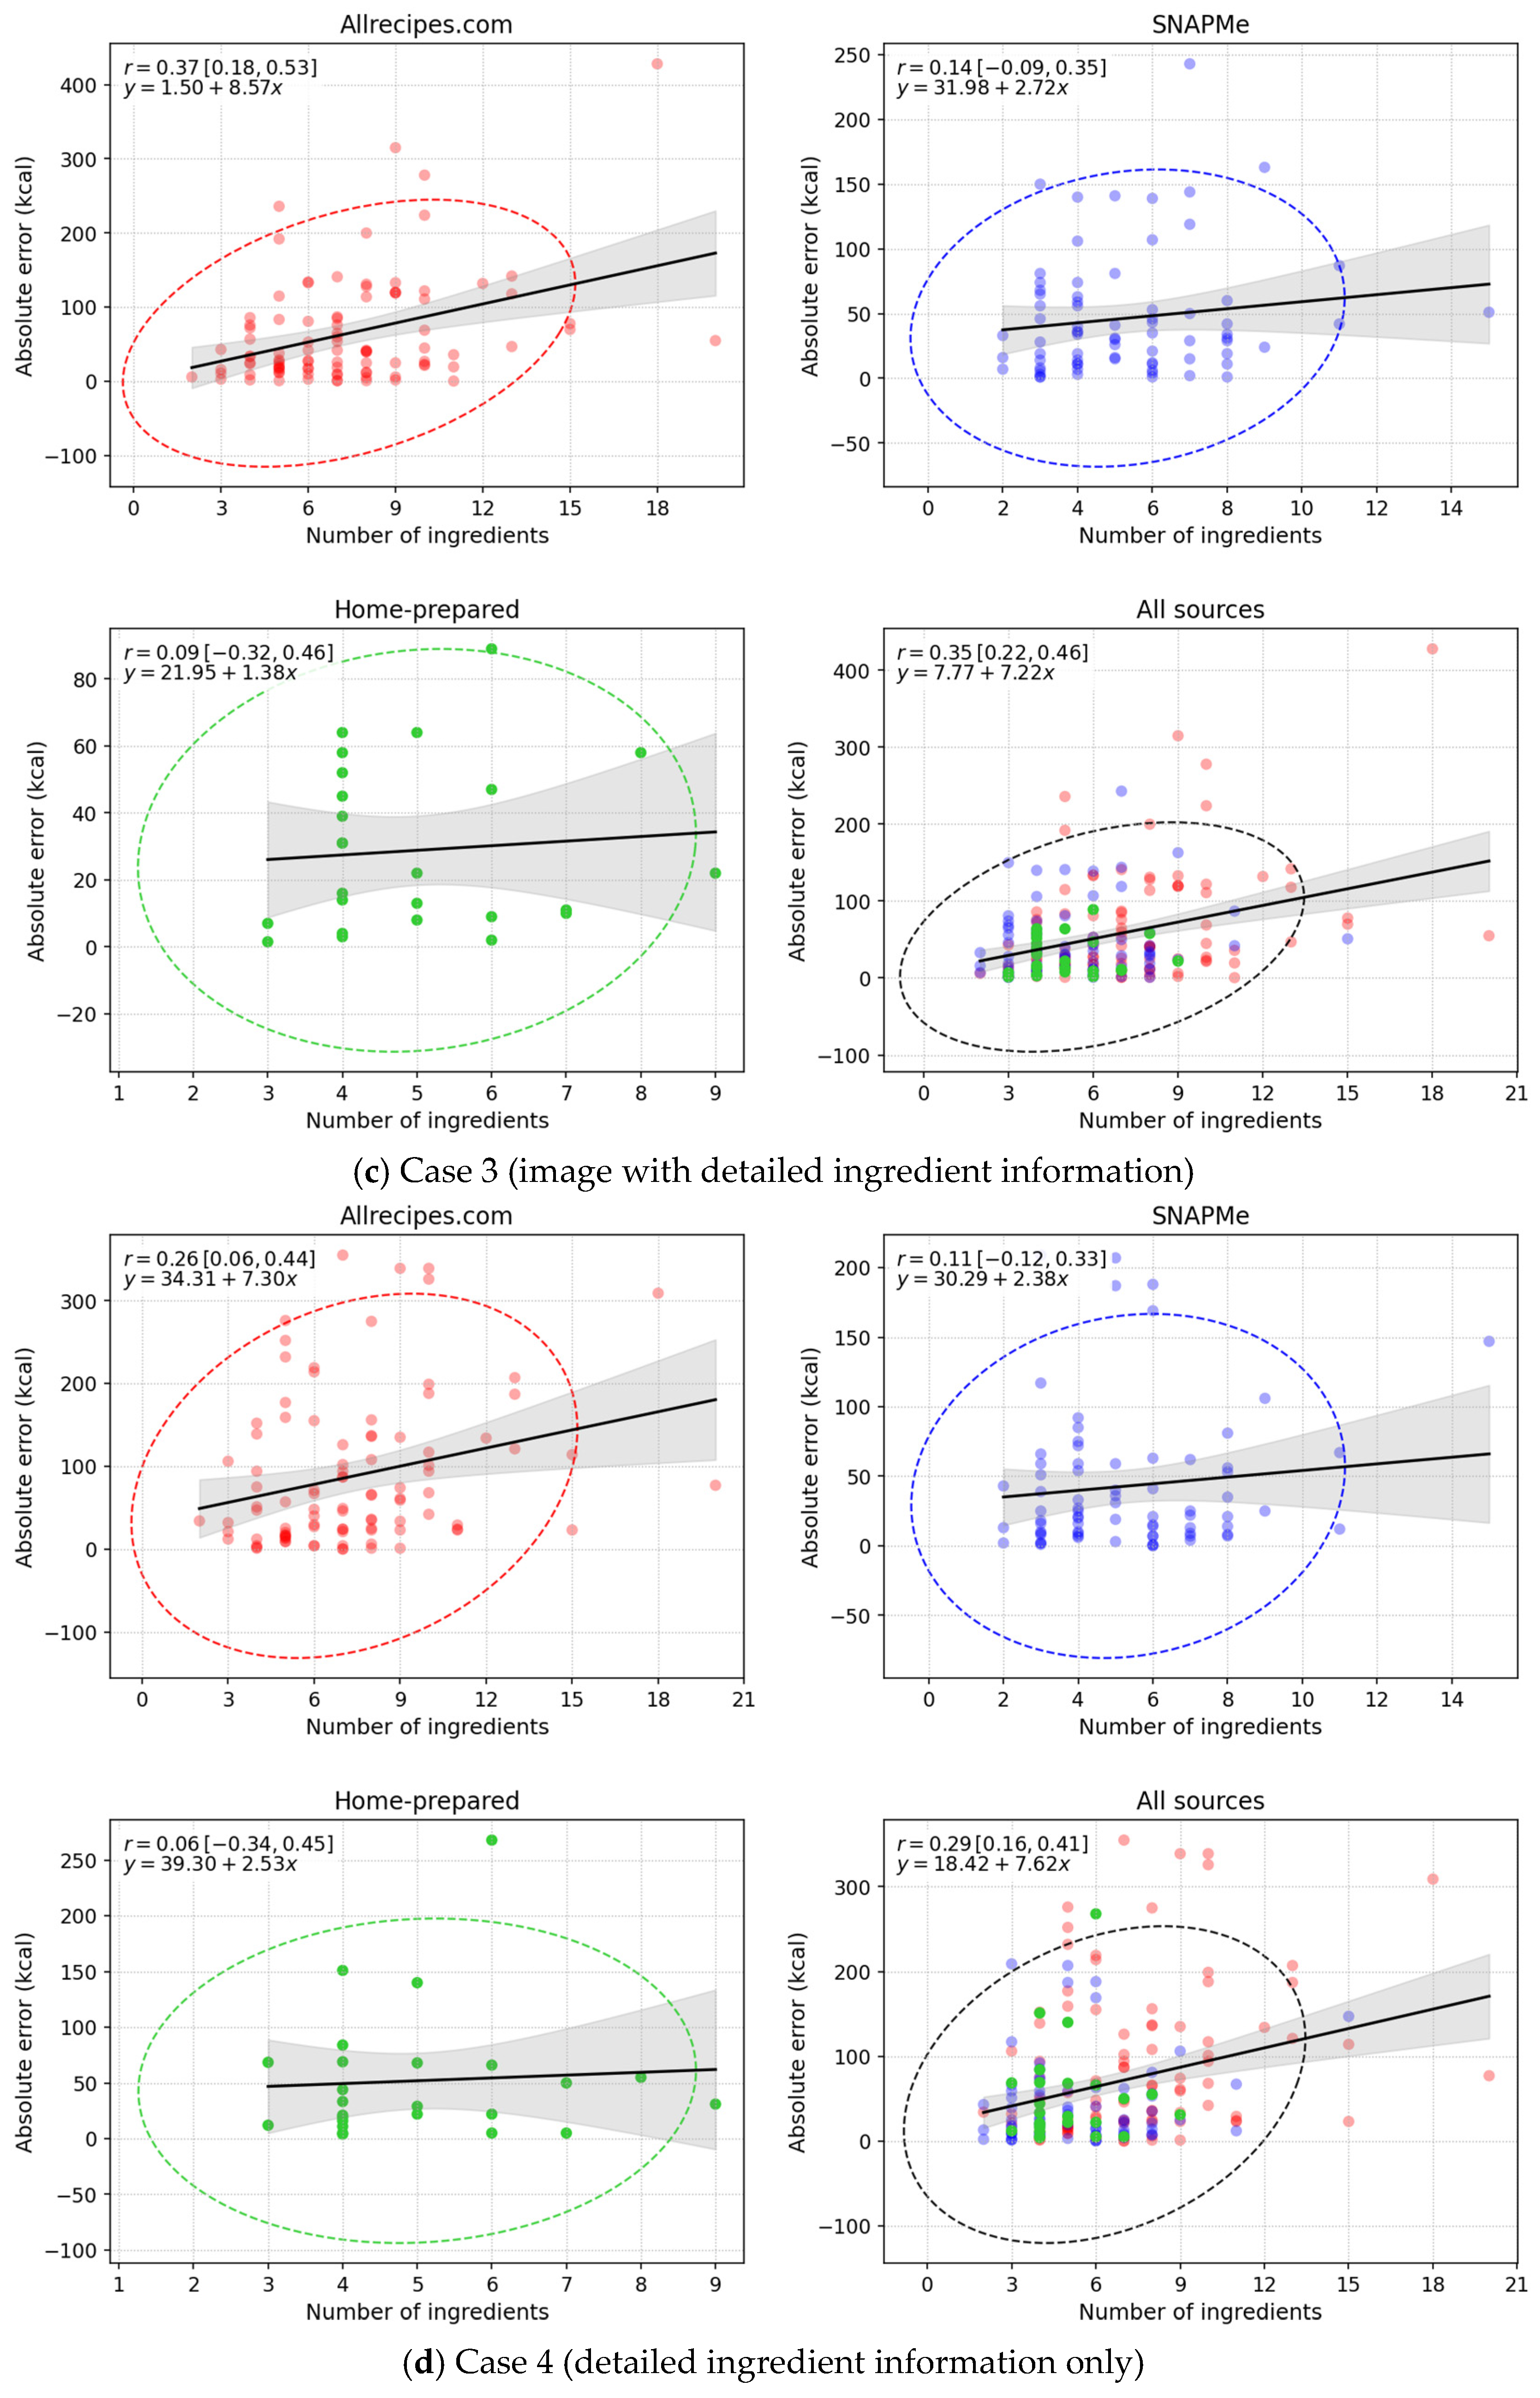
2.4. Correlation Analysis
2.5. Inferential Analysis of Estimation Errors
- Null hypothesis (H0): There are no significant differences in estimation errors among the three data sources.
- Alternative hypothesis (H1): At least one data source differs significantly from the others.
2.6. Test Cases
- Image only: performance assessment in the absence of contextual information.
- Image with non-visual data: inclusion of characteristics that are difficult to capture visually, namely type and amount of fat, type and amount of sweetener, fat content of dairy products, and type of meat.
- Image with detailed ingredient information: provision of complete ingredient descriptions and quantities to enable the most accurate estimation.
- Detailed ingredient information only: replicates the conditions of Case 3, except that the image is omitted to isolate the contribution of visual input.
2.7. ChatGPT
- “Act as a technical analyst. Do not make assumptions: describe only what the imagery and data shows.”
- “Provide responses in a literal and quantitative manner.”
- “Do not draw conclusions unless they are explicitly supported by the data.”
- “If ambiguity exists, state it explicitly rather than attempting to resolve it.”
- “Present intermediate calculations before the final result, and clearly indicate any estimated values.”
3. Results
| Calories (kcal) | ||||||||
| Source | Range | MAE | MedAE | IQRAE | MAPE (%) | MedAPE (%) | IQRAPE (%) | RMSE |
| Allrecipes.com | Total | 127.81 | 100.50 | 102.75 | 35.00 | 25.65 | 27.83 | 166.99 |
| 95% CIs | 107.41, 150.62 | 87.00, 121.50 | 72.250, 136.250 | 29.30, 41.18 | 23.02, 34.76 | 19.76, 37.59 | 135.27, 201.55 | |
| Q1 (≤280) | 96.42 | 85.00 | 97.00 | 55.08 | 50.90 | 64.61 | 120.30 | |
| Q2 (280–368.5) | 85.13 | 72.00 | 89.00 | 26.53 | 22.86 | 26.25 | 109.46 | |
| Q3 (368.5–502.5) | 113.25 | 96.00 | 61.50 | 26.59 | 23.14 | 17.84 | 123.37 | |
| Q4 (>502.5) | 216.00 | 161.50 | 197.50 | 30.61 | 25.65 | 25.07 | 264.13 | |
| SNAPMe | Total | 133.00 | 108.50 | 138.25 | 28.19 | 28.03 | 28.93 | 175.61 |
| 95% CIs | 107.73, 160.46 | 75.00, 135.50 | 108.49, 189.7 | 23.26, 33.78 | 21.00, 30.89 | 20.68, 32.37 | 142.51, 208.48 | |
| Q1 (≤348.2) | 82.10 | 73.00 | 63.50 | 37.03 | 29.00 | 27.75 | 105.90 | |
| Q2 (348.2–435.5) | 72.38 | 41.50 | 96.50 | 18.68 | 9.84 | 26.11 | 95.63 | |
| Q3 (435.5–592.8) | 136.90 | 125.00 | 91.25 | 26.46 | 24.67 | 15.12 | 155.84 | |
| Q4 (>592.8) | 237.63 | 245.00 | 210.00 | 30.01 | 32.29 | 25.56 | 277.88 | |
| Home-prepared | Total | 75.14 | 56.00 | 62.00 | 20.12 | 13.25 | 13.05 | 104.52 |
| 95% CIs | 49.60, 105.76 | 34.00, 77.00 | 30.00, 123.00 | 12.46, 30.93 | 10.04, 20.15 | 7.38, 24.58 | 63.22, 144.96 | |
| Q1 (≤381) | 56.07 | 40.00 | 39.25 | 32.24 | 20.15 | 17.85 | 70.72 | |
| Q2 (381–448) | 38.66 | 39.50 | 28.25 | 9.02 | 8.96 | 6.24 | 43.96 | |
| Q3 (448–489) | 58.83 | 57.50 | 31.75 | 12.33 | 11.94 | 6.76 | 68.69 | |
| Q4 (>489) | 150.16 | 131.00 | 99.50 | 24.87 | 20.29 | 14.46 | 181.76 | |
| All sources | Total | 123.03 | 98.00 | 123.00 | 30.51 | 24.34 | 27.49 | 163.80 |
| 95% CIs | 108.61, 138.78 | 85.00, 106.00 | 100.00, 141.00 | 26.86, 34.25 | 22.68, 28.49 | 22.76, 31.71 | 142.58, 186.00 | |
| Q1 (≤299) | 81.69 | 68.00 | 89.00 | 45.21 | 32.07 | 52.18 | 105.20 | |
| Q2 (299–407) | 86.20 | 81.00 | 93.00 | 24.44 | 23.02 | 24.86 | 108.5 | |
| Q3 (407–533.5) | 98.81 | 92.50 | 80.50 | 21.25 | 20.73 | 15.17 | 113.94 | |
| Q4 (>533.5) | 224.91 | 190.00 | 208.00 | 30.94 | 30.89 | 26.20 | 266.83 | |
| Proteins (g) | ||||||||
| Source | Range | MAE | MedAE | IQRAE | MAPE (%) | MedAPE (%) | IQRAPE (%) | RMSE |
| Allrecipes.com | Total | 8.02 | 5.70 | 38.07 | 51.73 | 28.40 | 37.89 | 11.08 |
| 95% CIs | 6.52, 9.60 | 4.20, 7.60 | 5.55, 12.90 | 37.92, 68.77 | 23.16, 36.36 | 25.89, 60.04 | 9.04, 13.02 | |
| Q1 (≤12) | 4.51 | 2.30 | 3.60 | 93.82 | 40.00 | 90.95 | 8.06 | |
| Q2 (12–19) | 7.72 | 3.55 | 8.92 | 48.02 | 24.04 | 57.17 | 10.83 | |
| Q3 (19–28) | 8.66 | 7.52 | 12.25 | 37.05 | 30.56 | 23.48 | 14.43 | |
| Q4 (>28) | 11.46 | 8.00 | 12.25 | 25.15 | 26.00 | 23.33 | 14.43 | |
| SNAPMe | Total | 8.32 | 4.15 | 10.54 | 37.01 | 21.55 | 29.65 | 12.50 |
| 95% CIs | 6.30, 10.53 | 2.80, 6.32 | 6.10, 14.92 | 26.20, 51.61 | 14.67, 32.22 | 24.33, 36.30 | 9.60, 15.24 | |
| Q1 (≤13.2) | 3.66 | 1.38 | 2.60 | 55.59 | 22.92 | 25.61 | 5.88 | |
| Q2 (13.2–22.6) | 6.08 | 2.60 | 3.97 | 37.26 | 13.61 | 27.54 | 10.02 | |
| Q3 (22.6–33.9) | 7.30 | 6.45 | 7.30 | 26.13 | 24.27 | 27.13 | 8.76 | |
| Q4 (>33.9) | 16.06 | 14.20 | 20.25 | 28.49 | 31.94 | 29.88 | 20.16 | |
| Home-prepared | Total | 6.14 | 4.60 | 7.14 | 23.93 | 18.00 | 18.83 | 8.04 |
| 95% CIs | 4.24, 8.27 | 2.10, 9.00 | 3.20, 9.50 | 14.76, 37.91 | 8.78, 23.79 | 8.75, 27.96 | 5.70, 10.32 | |
| Q1 (≤18.2) | 3.07 | 2.10 | 2.57 | 35.52 | 17.86 | 19.41 | 4.52 | |
| Q2 (18.2–27) | 5.09 | 4.85 | 4.50 | 20.75 | 20.19 | 19.04 | 6.06 | |
| Q3 (27–38.8) | 4.04 | 3.35 | 2.87 | 11.61 | 10.51 | 8.98 | 4.87 | |
| Q4 (>38.8) | 12.86 | 11.45 | 6.80 | 25.90 | 24.50 | 13.11 | 13.61 | |
| All sources | Total | 7.89 | 5.00 | 8.50 | 42.58 | 24.84 | 30.97 | 11.32 |
| 95% CIs | 6.81, 9.09 | 4.20, 6.30 | 6.65, 11.20 | 4.17, 52.43 | 20.38, 28.53 | 26.08, 37.07 | 9.77, 12.89 | |
| Q1 (≤13) | 3.98 | 2.20 | 3.30 | 70.10 | 27.27 | 86.67 | 6.81 | |
| Q2 (13–22) | 7.53 | 4.60 | 8.01 | 43.69 | 24.29 | 52.32 | 10.63 | |
| Q3 (22–33.3) | 7.12 | 7.20 | 5.40 | 26.59 | 24.84 | 22.75 | 8.64 | |
| Q4 (>33.3) | 13.16 | 9.70 | 15.00 | 25.69 | 23.79 | 26.92 | 16.69 | |
| Carbohydrates (g) | ||||||||
| Source | Range | MAE | MedAE | IQRAE | MAPE (%) | MedAPE (%) | IQRAPE (%) | RMSE |
| Allrecipes.com | Total | 11.48 | 6.80 | 14.12 | 53.87 | 37.08 | 51.06 | 16.34 |
| 95% CIs | 9.27, 13.85 | 5.05, 10.45 | 9.07, 19.12 | 41.87, 67.89 | 30.00, 45.00 | 36.28, 67.94 | 13.47, 18.99 | |
| Q1 (≤12) | 6.13 | 2.80 | 6.75 | 90.43 | 48.47 | 66.93 | 9.97 | |
| Q2 (12–26) | 10.14 | 7.40 | 9.00 | 51.92 | 39.47 | 48.26 | 13.80 | |
| Q3 (26–41) | 15.42 | 12.15 | 19.87 | 45.07 | 30.00 | 62.85 | 19.96 | |
| Q4 (>41) | 14.75 | 12.00 | 15.10 | 23.67 | 22.22 | 31.35 | 19.91 | |
| SNAPMe | Total | 12.99 | 8.75 | 11.50 | 32.01 | 24.41 | 26.79 | 18.86 |
| 95% CIs | 10.07, 16.33 | 5.98, 11.50 | 8.10, 18.76 | 26.09, 38.62 | 18.57, 33.70 | 21.45, 37.98 | 13.74, 23.86 | |
| Q1 (≤26) | 7.98 | 4.32 | 5.25 | 48.08 | 36.65 | 60.32 | 11.05 | |
| Q2 (26–40) | 7.12 | 4.80 | 8.60 | 22.68 | 14.08 | 26.10 | 8.59 | |
| Q3 (40–52.3) | 13.97 | 11.75 | 8.77 | 30.13 | 25.57 | 17.52 | 17.43 | |
| Q4 (>52.3) | 22.60 | 12.50 | 18.65 | 25.29 | 19.78 | 22.56 | 30.06 | |
| Home-prepared | Total | 8.91 | 7.10 | 10.31 | 25.59 | 17.13 | 21.95 | 11.56 |
| 95% CIs | 6.12, 11.95 | 3.76, 12.50 | 5.90, 16.20 | 16.22, 37.54 | 11.36, 30.29 | 11.19, 41.17 | 8.23, 14.58 | |
| Q1 (≤33.5) | 11.71 | 14.50 | 13.75 | 49.17 | 48.44 | 36.84 | 14.87 | |
| Q2 (33.5–41.8) | 7.20 | 7.12 | 4.13 | 18.57 | 17.44 | 12.34 | 8.07 | |
| Q3 (41.8–46.4) | 6.30 | 4.90 | 8.75 | 14.22 | 10.85 | 20.90 | 8.12 | |
| Q4 (>550) | 9.97 | 6.68 | 14.21 | 16.47 | 10.81 | 21.74 | 12.95 | |
| All sources | Total | 11.72 | 8.10 | 12.10 | 41.95 | 29.55 | 37.11 | 16.84 |
| 95% CIs | 10.11, 13.50 | 6.00, 10.20 | 9.60, 16.05 | 35.31, 49.61 | 23.08, 32.59 | 30.52, 45.87 | 14.36, 19.43 | |
| Q1 (≤17.9) | 6.01 | 3.40 | 6.50 | 68.97 | 45.00 | 55.13 | 9.24 | |
| Q2 (17.9–34.5) | 11.46 | 7.70 | 12.00 | 45.50 | 36.33 | 42.82 | 15.25 | |
| Q3 (34.5–46.2) | 11.33 | 9.65 | 11.05 | 28.14 | 25.10 | 25.24 | 14.55 | |
| Q4 (>46.2) | 18.08 | 12.00 | 20.00 | 24.90 | 19.78 | 25.32 | 24.56 | |
| Lipids (g) | ||||||||
| Source | Range | MAE | MedAE | IQRAE | MAPE (%) | MedAPE (%) | IQRAPE (%) | RMSE |
| Allrecipes.com | Total | 9.17 | 6.80 | 7.45 | 59.76 | 37.71 | 38.18 | 13.35 |
| 95% CIs | 7.39, 11.24 | 5.30, 8.50 | 6.00, 11.52 | 43.76, 80.22 | 28.42, 47.00 | 30.90, 61.71 | 9.72, 17.26 | |
| Q1 (≤10) | 6.33 | 4.50 | 6.50 | 128.30 | 89.00 | 91.25 | 8.49 | |
| Q2 (10–19.5) | 5.81 | 5.40 | 6.65 | 40.56 | 41.11 | 32.42 | 7.08 | |
| Q3(19.5–27.2) | 6.54 | 5.65 | 6.27 | 27.14 | 22.09 | 25.75 | 8.12 | |
| Q4 (>27.2) | 17.95 | 15.05 | 12.12 | 39.36 | 37.74 | 31.88 | 22.89 | |
| SNAPMe | Total | 8.90 | 5.79 | 12.32 | 46.82 | 41.33 | 39.29 | 12.55 |
| 95% CIs | 7.00, 11.01 | 4.30, 8.30 | 7.60, 14.75 | 38.03, 57.26 | 35.62, 49.09 | 24.02, 55.37 | 9.76, 15.60 | |
| Q1 (≤11.2) | 3.52 | 2.60 | 3.50 | 67.91 | 53.96 | 29.06 | 4.79 | |
| Q2 (11.2–19.2) | 6.49 | 5.14 | 4.70 | 44.70 | 35.97 | 33.94 | 8.43 | |
| Q3 (19.2–30.8) | 8.13 | 7.31 | 11.65 | 34.11 | 33.05 | 57.71 | 10.72 | |
| Q4 (>30.8) | 17.29 | 16.60 | 9.90 | 40.89 | 41.39 | 19.04 | 20.35 | |
| Home-prepared | Total | 6.36 | 5.52 | 4.80 | 44.20 | 35.20 | 27.75 | 7.98 |
| 95% CIs | 4.63, 8.32 | 3.10, 7.40 | 2.10, 9.91 | 31.81, 60.03 | 27.57, 42.78 | 9.10, 47.95 | 5.67, 10.34 | |
| Q1 (≤10.5) | 4.32 | 2.90 | 3.80 | 66.29 | 30.00 | 71.45 | 5.75 | |
| Q2 (10.5–15) | 4.05 | 4.80 | 2.30 | 31.38 | 35.93 | 15.29 | 4.47 | |
| Q3 (15–21.7) | 7.56 | 6.95 | 1.67 | 38.13 | 35.11 | 11.91 | 7.97 | |
| Q4 (>21.7) | 9.84 | 10.05 | 8.32 | 37.34 | 35.23 | 34.61 | 11.96 | |
| All sources | Total | 8.70 | 6.00 | 9.10 | 52.88 | 39.48 | 38.53 | 12.48 |
| 95% CIs | 7.51, 10.05 | 5.24, 7.40 | 7.00, 11.50 | 43.89, 63.64 | 34.10, 43.75 | 31.87, 47.86 | 10.27, 14.94 | |
| Q1 (≤10.6) | 4.82 | 3.40 | 4.70 | 98.28 | 61.17 | 88.54 | 6.78 | |
| Q2 (10.6–18.7) | 6.09 | 5.24 | 5.10 | 43.46 | 36.67 | 32.92 | 7.53 | |
| Q3(18.7–27.5) | 6.65 | 5.88 | 7.30 | 29.32 | 28.21 | 32.83 | 8.27 | |
| Q4 (>27.5) | 17.21 | 15.40 | 13.10 | 40.92 | 41.13 | 30.58 | 21.21 | |
| Calories (kcal) | ||||||||
| Source | Range | MAE | MedAE | IQRAE | MAPE (%) | MedAPE (%) | IQRAPE (%) | RMSE |
| Allrecipes.com | Total | 95.58 | 80.15 | 96.50 | 28.85 | 18.95 | 32.82 | 127.45 |
| 95% CIs | 79.33, 113.22 | 62.00, 91.00 | 71.50, 128.75 | 23.40, 34.71 | 16.11, 24.30 | 19.54, 43.54 | 104.25, 150.58 | |
| Q1 (≤280) | 88.85 | 81.00 | 81.00 | 50.13 | 43.03 | 52.36 | 107.63 | |
| Q2 (280–368.5) | 70.13 | 43.00 | 68.50 | 21.66 | 13.27 | 21.88 | 100.38 | |
| Q3 (368.5–502.5) | 97.79 | 75.50 | 68.75 | 23.27 | 17.60 | 14.29 | 135.15 | |
| Q4 (>502.5) | 124.79 | 99.50 | 112.75 | 19.15 | 16.95 | 17.68 | 158.06 | |
| SNAPMe | Total | 101.13 | 77.00 | 111.25 | 22.17 | 19.32 | 21.53 | 129.39 |
| 95% CIs | 82.99, 119.88 | 54.50, 110.00 | 81.00, 143.75 | 18.63, 25.94 | 12.88, 25.65 | 17.41, 25.78 | 107.67, 149.83 | |
| Q1 (≤348.2) | 78.21 | 64.00 | 78.50 | 33.05 | 28.49 | 26.28 | 102.59 | |
| Q2 (348.2–435.5) | 49.22 | 39.50 | 33.00 | 12.73 | 10.50 | 7.89 | 60.87 | |
| Q3 (435.5–592.8) | 110.40 | 125.00 | 97.00 | 21.31 | 25.58 | 18.56 | 130.05 | |
| Q4 (>592.8) | 164.47 | 156.00 | 142.50 | 21.03 | 19.06 | 18.96 | 187.47 | |
| Home-prepared | Total | 51.50 | 39.00 | 21.00 | 13.55 | 10.41 | 9.00 | 71.37 |
| 95% CIs | 35.74, 73.72 | 32.00, 49.00 | 11.50, 57.00 | 9.26, 19.02 | 7.69, 12.78 | 4.02, 15.98 | 41.12, 104.46 | |
| Q1 (≤381) | 38.07 | 37.50 | 16.50 | 20.08 | 17.67 | 7.66 | 41.84 | |
| Q2 (381–448) | 44.16 | 42.50 | 31.00 | 10.48 | 10.16 | 8.26 | 56.99 | |
| Q3 (448–489) | 36.50 | 34.00 | 13.75 | 7.69 | 7.18 | 3.06 | 42.06 | |
| Q4 (>489) | 89.50 | 53.00 | 37.7 | 14.84 | 9.34 | 3.79 | 119.02 | |
| All sources | Total | 92.04 | 68.00 | 95.50 | 24.35 | 17.67 | 23.36 | 122.48 |
| 95% CIs | 80.99, 103.63 | 54.00, 83.00 | 79.50, 118.50 | 21.21, 27.67 | 14.36, 20.15 | 19.01, 28.18 | 107.89, 137.76 | |
| Q1 (≤299) | 68.03 | 53.00 | 61.00 | 37.40 | 28.49 | 46.45 | 87.27 | |
| Q2 (299–407) | 83.32 | 53.00 | 80.00 | 23.69 | 13.74 | 26.45 | 119.37 | |
| Q3 (407–533.5) | 73.79 | 64.50 | 78.25 | 15.81 | 14.06 | 15.89 | 90.77 | |
| Q4 (>533.5) | 142.63 | 119.00 | 149.00 | 20.33 | 17.57 | 21.54 | 172.54 | |
| Proteins (g) | ||||||||
| Source | Range | MAE | MedAE | IQRAE | MAPE (%) | MedAPE (%) | IQRAPE (%) | RMSE |
| Allrecipes.com | Total | 7.47 | 5.10 | 8.52 | 47.66 | 27.30 | 40.52 | 10.77 |
| 95% CIs | 5.96, 9.11 | 3.50, 6.30 | 5.57, 11.72 | 34.97, 63.14 | 22.38, 35.71 | 29.99, 55.12 | 8.62, 12.80 | |
| Q1 (≤12) | 3.43 | 2.30 | 2.20 | 81.23 | 23.00 | 63.79 | 6.48 | |
| Q2 (12–19) | 7.49 | 5.20 | 9.60 | 47.02 | 34.73 | 59.71 | 10.67 | |
| Q3 (19–28) | 8.58 | 7.60 | 7.45 | 36.79 | 30.70 | 29.98 | 10.55 | |
| Q4 (>28) | 10.67 | 6.10 | 9.70 | 23.19 | 19.68 | 20.95 | 14.27 | |
| SNAPMe | Total | 8.11 | 4.62 | 10.09 | 36.11 | 24.55 | 29.51 | 12.06 |
| 95% CIs | 6.16, 10.24 | 3.10, 6.77 | 6.22, 13.92 | 25.84, 50.28 | 17.23, 32.57 | 23.42, 37.84 | 9.17, 14.85 | |
| Q1 (≤13.2) | 3.95 | 2.40 | 2.93 | 59.61 | 27.50 | 45.65 | 6.02 | |
| Q2 (13.2–22.6) | 4.76 | 2.65 | 4.12 | 29.10 | 16.28 | 25.61 | 7.61 | |
| Q3 (22.6–33.9) | 7.61 | 7.95 | 6.96 | 26.97 | 28.21 | 26.18 | 9.01 | |
| Q4 (>33.9) | 15.93 | 15.30 | 20.70 | 27.93 | 31.61 | 28.47 | 19.97 | |
| Home-prepared | Total | 6.55 | 6.20 | 5.90 | 24.27 | 18.24 | 12.88 | 8.29 |
| 95% CIs | 4.70, 8.63 | 4.40, 7.90 | 2.56, 8.27 | 16.82, 34.05 | 15.59, 26.96 | 5.92, 29.56 | 5.93, 10.55 | |
| Q1 (≤18.2) | 3.73 | 2.20 | 5.82 | 35.19 | 15.71 | 34.88 | 4.79 | |
| Q2 (18.2–27) | 4.05 | 4.85 | 4.42 | 16.58 | 20.19 | 18.10 | 4.91 | |
| Q3 (27–38.8) | 5.90 | 5.75 | 2.92 | 17.23 | 16.91 | 7.94 | 6.48 | |
| Q4 (>38.8) | 13.00 | 11.85 | 8.85 | 26.25 | 22.48 | 17.04 | 13.91 | |
| All sources | Total | 7.59 | 5.10 | 8.35 | 40.28 | 25.53 | 32.99 | 11.01 |
| 95% CIs | 6.52, 8.76 | 4.30, 6.10 | 6.55, 11.05 | 32.54, 49.35 | 21.43, 28.57 | 26.65, 39.83 | 9.45, 12.57 | |
| Q1 (≤13) | 3.61 | 2.30 | 3.00 | 65.31 | 27.27 | 49.83 | 5.99 | |
| Q2 (13–22) | 7.07 | 5.00 | 6.67 | 40.88 | 27.39 | 38.63 | 9.94 | |
| Q3 (22–33.3) | 6.76 | 6.10 | 7.50 | 25.18 | 25.53 | 28.30 | 8.49 | |
| Q4 (>33.3) | 13.17 | 9.30 | 13.70 | 25.85 | 24.64 | 25.80 | 16.71 | |
| Carbohydrates (g) | ||||||||
| Source | Range | MAE | MedAE | IQRAE | MAPE (%) | MedAPE (%) | IQRAPE (%) | RMSE |
| Allrecipes.com | Total | 10.76 | 6.90 | 13.20 | 50.86 | 32.41 | 47.70 | 15.02 |
| 95% CIs | 8.78, 12.89 | 4.95, 10.60 | 9.92, 17.30 | 39.51, 64.05 | 22.50, 40.71 | 35.42, 73.78 | 12.56, 17.37 | |
| Q1 (≤12) | 5.98 | 2.70 | 6.15 | 84.98 | 42.94 | 89.27 | 10.14 | |
| Q2 (12–26) | 9.41 | 7.00 | 10.05 | 49.64 | 35.79 | 46.10 | 12.98 | |
| Q3 (26–41) | 14.64 | 12.95 | 14.57 | 42.77 | 33.68 | 45.60 | 18.54 | |
| Q4 (>41) | 13.46 | 11.40 | 16.00 | 21.94 | 22.22 | 24.53 | 17.29 | |
| SNAPMe | Total | 11.29 | 8.05 | 12.27 | 27.74 | 23.26 | 24.64 | 15.37 |
| 95% CIs | 9.05, 13.78 | 5.37, 11.15 | 8.36, 17.21 | 23.05, 33.00 | 18.41, 27.80 | 17.16, 32.91 | 12.13, 18.77 | |
| Q1 (≤26) | 6.68 | 4.15 | 4.85 | 38.50 | 24.05 | 46.35 | 9.61 | |
| Q2 (26–40) | 7.67 | 5.70 | 9.00 | 24.01 | 17.07 | 24.98 | 9.12 | |
| Q3 (40–52.3) | 11.77 | 10.40 | 9.52 | 25.27 | 22.37 | 19.26 | 13.91 | |
| Q4 (>52.3) | 18.90 | 14.20 | 18.50 | 22.10 | 24.64 | 16.05 | 23.76 | |
| Home-prepared | Total | 9.50 | 8.00 | 12.50 | 26.80 | 17.67 | 27.64 | 12.19 |
| 95% CIs | 6.56, 12.58 | 3.00, 13.30 | 5.75, 18.00 | 17.39, 38.87 | 11.25, 33.33 | 13.21, 46.38 | 8.86, 15.14 | |
| Q1 (≤33.5) | 11.63 | 13.30 | 14.30 | 48.39 | 48.44 | 36.08 | 14.82 | |
| Q2 (33.5–41.8) | 8.70 | 7.57 | 4.41 | 22.43 | 18.56 | 13.09 | 10.61 | |
| Q3 (41.8–46.4) | 7.13 | 5.60 | 8.05 | 15.99 | 12.25 | 19.05 | 8.91 | |
| Q4 (>550) | 10.17 | 6.68 | 15.26 | 16.81 | 10.81 | 23.60 | 13.08 | |
| All sources | Total | 10.80 | 7.50 | 12.65 | 39.00 | 24.81 | 36.24 | 14.83 |
| 95% CIs | 9.41, 12.26 | 6.00, 9.40 | 10.35, 15.85 | 32.90, 46.03 | 21.42, 30.00 | 27.11, 42.19 | 12.99, 16.67 | |
| Q1 (≤17.9) | 5.55 | 3.20 | 6.10 | 63.19 | 38.33 | 59.76 | 8.78 | |
| Q2 (17.9–34.5) | 10.79 | 6.80 | 11.80 | 42.69 | 34.78 | 41.52 | 14.50 | |
| Q3 (34.5–46.2) | 11.06 | 9.45 | 11.78 | 27.58 | 23.57 | 25.78 | 13.89 | |
| Q4 (>46.2) | 15.79 | 12.20 | 17.70 | 22.31 | 22.22 | 20.86 | 19.96 | |
| Lipids (g) | ||||||||
| Source | Range | MAE | MedAE | IQRAE | MAPE (%) | MedAPE (%) | IQRAPE (%) | RMSE |
| Allrecipes.com | Total | 6.25 | 4.00 | 7.16 | 51.17 | 22.08 | 39.88 | 9.06 |
| 95% CIs | 4.97, 7.60 | 2.70, 5.25 | 4.37, 9.82 | 31.32, 79.60 | 15.45, 30.77 | 27.46, 60.82 | 7.11, 10.96 | |
| Q1 (≤10) | 5.81 | 3.30 | 7.10 | 121.44 | 62.50 | 68.33 | 9.63 | |
| Q2 (10–19.5) | 5.54 | 2.70 | 4.30 | 37.66 | 24.55 | 39.95 | 7.93 | |
| Q3 (19.5–27.2) | 4.31 | 2.60 | 3.55 | 17.65 | 9.92 | 14.51 | 6.16 | |
| Q4 (>27.2) | 9.32 | 8.70 | 10.2 | 24.44 | 20.88 | 22.67 | 11.55 | |
| SNAPMe | Total | 5.61 | 4.19 | 5.90 | 35.15 | 22.73 | 39.83 | 7.76 |
| 95% CIs | 4.44, 6.88 | 3.00, 4.95 | 3.40, 9.20 | 27.06, 44.78 | 18.92, 31.80 | 22.05, 51.36 | 6.07, 9.45 | |
| Q1 (≤11.2) | 3.08 | 1.80 | 3.40 | 60.51 | 55.00 | 51.23 | 4.31 | |
| Q2 (11.2–19.2) | 5.54 | 4.64 | 4.37 | 37.41 | 32.02 | 38.52 | 7.36 | |
| Q3 (19.2–30.8) | 5.22 | 4.20 | 3.85 | 22.46 | 18.10 | 21.34 | 7.12 | |
| Q4 (>30.8) | 8.57 | 9.35 | 8.35 | 21.01 | 21.57 | 22.59 | 10.80 | |
| Home-prepared | Total | 5.56 | 5.52 | 6.72 | 36.12 | 38.25 | 34.02 | 6.82 |
| 95% CIs | 4.05, 7.10 | 2.50, 7.90 | 3.50, 9.10 | 27.44, 45.07 | 20.00, 43.91 | 16.17, 50.45 | 5.36, 8.11 | |
| Q1 (≤10.5) | 3.08 | 1.68 | 4.71 | 41.06 | 36.36 | 53.97 | 4.18 | |
| Q2 (10.5–15) | 4.96 | 4.80 | 4.12 | 39.44 | 39.69 | 43.04 | 5.85 | |
| Q3 (15–21.7) | 6.47 | 7.21 | 2.93 | 31.94 | 36.79 | 12.85 | 7.35 | |
| Q4 (>21.7) | 8.16 | 9.44 | 6.55 | 31.23 | 39.15 | 19.99 | 9.22 | |
| All sources | Total | 5.92 | 4.30 | 6.65 | 43.20 | 24.36 | 40.84 | 8.32 |
| 95% CIs | 5.13, 6.76 | 3.30, 4.90 | 5.48, 8.06 | 32.63, 57.51 | 20.25, 30.48 | 31.54, 51.91 | 7.12, 9.54 | |
| Q1 (≤10.6) | 4.21 | 2.20 | 4.40 | 88.29 | 51.67 | 70.52 | 7.29 | |
| Q2 (10.6–18.7) | 5.45 | 4.50 | 5.20 | 38.87 | 29.38 | 43.65 | 7.19 | |
| Q3 (18.7–27.5) | 5.11 | 4.25 | 5.54 | 22.70 | 17.62 | 25.75 | 6.80 | |
| Q4 (>27.5) | 8.90 | 9.30 | 9.51 | 23.45 | 21.50 | 23.97 | 11.19 | |
| Calories (kcal) | ||||||||
| Source | Range | MAE | MedAE | IQRAE | MAPE (%) | MedAPE (%) | IQRAPE (%) | RMSE |
| Allrecipes.com | Total | 64.99 | 40.00 | 68.50 | 18.64 | 9.84 | 20.20 | 97.84 |
| 95% CIs | 51.05, 80.08 | 26.50, 54.00 | 52.50, 103.75 | 14.16, 23.60 | 8.11, 12.29 | 11.66, 26.80 | 73.95, 121.58 | |
| Q1 (≤280) | 49.06 | 38.00 | 66.00 | 29.26 | 14.29 | 35.63 | 67.87 | |
| Q2 (280–368.5) | 28.50 | 20.00 | 19.50 | 8.87 | 6.00 | 6.04 | 41.19 | |
| Q3 (368.5–502.5) | 94.67 | 63.50 | 93.50 | 22.21 | 15.71 | 21.32 | 135.19 | |
| Q4 (>502.5) | 86.89 | 60.00 | 103.75 | 13.38 | 10.45 | 10.64 | 116.58 | |
| SNAPMe | Total | 46.48 | 33.50 | 45.75 | 10.16 | 8.07 | 11.64 | 65.82 |
| 95% CIs | 36.38, 57.68 | 24.00, 42.00 | 32.20, 65.75 | 8.13, 12.43 | 5.12, 10.95 | 8.58, 14.69 | 50.56, 80.75 | |
| Q1 (≤348.2) | 24.42 | 15.00 | 23.50 | 11.97 | 8.16 | 13.50 | 35.27 | |
| Q2 (348.2–435.5) | 36.05 | 35.00 | 56.75 | 9.45 | 8.78 | 15.58 | 45.92 | |
| Q3 (435.5–592.8) | 44.45 | 38.00 | 36.25 | 8.82 | 8.15 | 6.83 | 57.15 | |
| Q 4 (>592.8) | 80.36 | 53.00 | 109.00 | 10.28 | 7.39 | 11.13 | 102.66 | |
| Home-prepared | Total | 28.82 | 22.00 | 38.00 | 6.92 | 6.02 | 8.17 | 37.55 |
| 95% CIs | 19.88, 38.44 | 10.00, 45.00 | 18.00, 51.00 | 4.84, 9.19 | 2.44, 9.73 | 5.09, 11.11 | 27.21, 46.86 | |
| Q1 (≤281) | 19.78 | 16.00 | 21.50 | 8.40 | 6.02 | 9.03 | 27.05 | |
| Q2 (281–448) | 35.16 | 35.00 | 20.75 | 8.29 | 8.45 | 5.77 | 38.15 | |
| Q3 (448–489) | 7.66 | 8.50 | 4.75 | 1.61 | 1.79 | 0.97 | 8.50 | |
| Q4 (>489) | 54.16 | 58.00 | 17.25 | 9.13 | 9.55 | 2.57 | 59.10 | |
| All sources | Total | 53.33 | 34.00 | 56.00 | 13.92 | 8.40 | 12.73 | 80.86 |
| 95% CIs | 45.08, 62.27 | 27.00, 42.00 | 44.00, 70.00 | 11.54, 16.66 | 7.18, 9.91 | 10.09, 15.76 | 65.90, 96.38 | |
| Q1 (≤299) | 34.20 | 24.00 | 39.00 | 19.97 | 9.16 | 19.11 | 51.40 | |
| Q2 (299–407) | 46.13 | 29.00 | 44.00 | 12.73 | 8.63 | 11.57 | 78.80 | |
| Q3 (407–533.5) | 55.58 | 36.00 | 46.75 | 11.96 | 8.14 | 10.10 | 83.77 | |
| Q4 (>533.5) | 77.45 | 56.00 | 93.00 | 10.98 | 8.84 | 10.48 | 101.44 | |
| Proteins (g) | ||||||||
| Source | Range | MAE | MedAE | IQRAE | MAPE (%) | MedAPE (%) | IQRAPE (%) | RMSE |
| Allrecipes.com | Total | 4.59 | 2.80 | 5.15 | 27.24 | 14.69 | 27.08 | 6.91 |
| 95% CIs | 3.61, 5.68 | 2.20, 3.85 | 3.97, 6.37 | 19.96, 35.91 | 12.76, 18.71 | 16.52, 37.79 | 5.32, 8.42 | |
| Q1 (≤12) | 2.08 | 1.30 | 2.70 | 46.22 | 21.67 | 55.83 | 2.96 | |
| Q2 (12–19) | 2.80 | 2.30 | 3.15 | 17.82 | 12.98 | 23.00 | 4.08 | |
| Q3 (19–28) | 6.34 | 3.30 | 9.95 | 26.72 | 14.95 | 37.02 | 9.28 | |
| Q4 (>28) | 7.37 | 5.70 | 3.75 | 16.99 | 15.35 | 10.58 | 9.07 | |
| SNAPMe | Total | 3.38 | 2.20 | 4.22 | 15.19 | 10.17 | 13.84 | 5.02 |
| 95% CIs | 2.59, 4.27 | 1.47, 3.25 | 2.81, 5.50 | 11.37, 19.93 | 7.78, 14.68 | 10.46, 19.33 | 3.67, 6.39 | |
| Q1 (≤13.2) | 1.66 | 0.96 | 1.98 | 24.33 | 11.49 | 24.28 | 2.47 | |
| Q2 (13.2–22.6) | 2.26 | 1.52 | 3.32 | 13.21 | 9.46 | 16.91 | 3.19 | |
| Q3 (22.6–33.9) | 3.34 | 2.75 | 3.70 | 11.61 | 10.78 | 11.87 | 4.11 | |
| Q4 (>33.9) | 6.19 | 4.70 | 6.92 | 11.30 | 10.33 | 9.86 | 8.14 | |
| Home-prepared | Total | 3.77 | 2.30 | 2.90 | 13.10 | 12.56 | 7.97 | 5.47 |
| 95% CIs | 2.45, 5.52 | 1.60, 4.34 | 1.70, 5.10 | 9.90, 16.57 | 7.86, 15.33 | 4.77, 18.06 | 2.98, 7.97 | |
| Q1 (≤18.2) | 1.91 | 1.70 | 1.24 | 15.42 | 13.82 | 4.09 | 2.23 | |
| Q2 (18.2–27) | 3.23 | 3.20 | 2.12 | 13.30 | 12.27 | 10.70 | 3.68 | |
| Q3 (27–38.8) | 4.50 | 3.80 | 2.02 | 13.06 | 10.92 | 7.61 | 5.74 | |
| Q4 (38.8) | 5.76 | 3.25 | 4.87 | 10.22 | 7.99 | 11.42 | 8.50 | |
| All sources | Total | 4.03 | 2.50 | 4.30 | 20.85 | 12.80 | 17.03 | 6.07 |
| 95% CIs | 3.41, 4.69 | 2.20, 3.30 | 3.75, 5.35 | 16.91, 25.71 | 10.33, 14.71 | 13.55, 23.12 | 5.02, 7.09 | |
| Q1 (≤13) | 1.85 | 0.96 | 2.27 | 32.85 | 13.82 | 35.00 | 2.68 | |
| Q2 (13–22) | 3.20 | 2.29 | 2.47 | 18.17 | 12.61 | 13.61 | 5.32 | |
| Q3 (22–33.3) | 4.68 | 3.60 | 4.85 | 17.46 | 14.23 | 16.42 | 6.38 | |
| Q4 (>33.3) | 6.66 | 5.20 | 5.80 | 13.59 | 12.79 | 10.67 | 8.62 | |
| Carbohydrates (g) | ||||||||
| Source | Range | MAE | MedAE | IQRAE | MAPE (%) | MedAPE (%) | IQRAPE (%) | RMSE |
| Allrecipes.com | Total | 6.89 | 3.80 | 7.70 | 33.52 | 15.65 | 34.01 | 11.55 |
| 95% CIs | 5.15, 8.83 | 2.20, 4.70 | 4.37, 12.82 | 24.60, 44.09 | 10.93, 22.86 | 23.02, 54.35 | 8.58, 14.34 | |
| Q1 (≤12) | 4.64 | 1.30 | 4.60 | 60.21 | 28.57 | 66.04 | 7.93 | |
| Q2 (12–26) | 5.68 | 3.90 | 6.05 | 31.15 | 22.94 | 30.77 | 7.85 | |
| Q3 (26–41) | 8.85 | 4.15 | 7.25 | 25.34 | 11.07 | 19.11 | 15.12 | |
| Q4 (>41) | 8.61 | 3.50 | 10.65 | 14.26 | 8.33 | 21.75 | 13.63 | |
| SNAPMe | Total | 5.51 | 2.20 | 6.62 | 13.41 | 6.13 | 12.08 | 9.42 |
| 95% CIs | 3.89, 7.37 | 1.20, 3.00 | 3.20, 10.34 | 9.63, 17.82 | 5.00, 8.93 | 6.99, 21.89 | 6.58, 12.11 | |
| Q1 (≤26) | 3.13 | 1.00 | 2.42 | 17.12 | 6.11 | 12.67 | 6.09 | |
| Q2 (26–40) | 2.54 | 1.60 | 1.50 | 8.24 | 5.33 | 5.70 | 3.93 | |
| Q3 (40–52.3) | 8.05 | 3.05 | 11.00 | 17.94 | 6.13 | 25.51 | 12.70 | |
| Q4 (>52.3) | 8.29 | 6.90 | 9.36 | 9.84 | 8.92 | 11.46 | 11.81 | |
| Home-prepared | Total | 5.56 | 4.20 | 6.30 | 15.04 | 10.95 | 13.60 | 7.67 |
| 95% CIs | 3.62, 7.77 | 2.20, 6.80 | 3.01, 9.19 | 10.17, 20.60 | 6.57, 19.55 | 7.06, 25.85 | 4.86, 10.24 | |
| Q1 (≤33.5) | 4.05 | 3.60 | 2.35 | 22.09 | 19.60 | 15.60 | 4.71 | |
| Q2 (33.5–41.8) | 1.44 | 1.67 | 1.81 | 3.82 | 4.52 | 4.77 | 1.75 | |
| Q3 (41.8–46.4) | 9.18 | 8.55 | 6.32 | 20.26 | 19.11 | 13.37 | 10.60 | |
| Q4 (>46.4) | 7.80 | 6.50 | 3.22 | 12.80 | 10.89 | 6.26 | 10.20 | |
| All sources | Total | 6.20 | 2.90 | 7.36 | 23.52 | 10.40 | 22.58 | 10.34 |
| 95% CIs | 5.12, 7.41 | 2.20, 4.00 | 5.05, 8.75 | 18.61, 29.20 | 8.28, 12.92 | 17.84, 28.84 | 8.47, 12.20 | |
| Q1 (≤17.9) | 4.16 | 2.20 | 4.50 | 44.80 | 22.94 | 48.72 | 6.79 | |
| Q2 (17.9–34.5) | 5.23 | 2.20 | 4.30 | 19.83 | 6.57 | 17.27 | 9.42 | |
| Q3 (34.5–46.2) | 6.76 | 2.75 | 7.67 | 16.48 | 7.13 | 18.23 | 11.46 | |
| Q4 (>46.2) | 8.66 | 6.20 | 12.70 | 12.82 | 9.17 | 14.58 | 12.73 | |
| Lipids (g) | ||||||||
| Source | Range | MAE | MedAE | IQRAE | MAPE (%) | MedAPE (%) | IQRAPE (%) | RMSE |
| Allrecipes.com | Total | 4.81 | 3.25 | 6.62 | 27.20 | 16.34 | 32.92 | 6.82 |
| CI95% | 3.87, 5.80 | 2.30, 4.30 | 4.50, 7.72 | 21.55, 33.27 | 10.42, 23.33 | 21.46, 42.80 | 5.58, 8.03 | |
| Q1 (≤10) | 2.23 | 0.70 | 2.80 | 35.15 | 17.14 | 57.00 | 3.73 | |
| Q2 (10–19.5) | 5.67 | 4.50 | 7.13 | 36.99 | 28.12 | 45.46 | 7.89 | |
| Q3 (19.5–27.2) | 4.69 | 3.83 | 4.57 | 19.27 | 15.82 | 18.50 | 6.02 | |
| Q4 (>27.2) | 6.78 | 5.35 | 7.15 | 17.46 | 10.12 | 19.39 | 8.69 | |
| SNAPMe | Total | 3.54 | 1.92 | 2.81 | 18.96 | 12.44 | 21.28 | 5.85 |
| 95% CIs | 2.57, 4.67 | 1.40, 2.60 | 1.80, 5.65 | 14.89, 23.47 | 8.87, 16.86 | 12.31, 31.03 | 3.99, 7.59 | |
| Q1 (≤11.2) | 1.54 | 1.10 | 1.85 | 30.11 | 23.61 | 41.33 | 2.08 | |
| Q2 (11.2–19.2) | 2.67 | 1.85 | 1.35 | 17.02 | 13.36 | 10.21 | 3.66 | |
| Q3 (19.2–30.8) | 2.67 | 1.50 | 2.45 | 11.37 | 6.59 | 11.48 | 3.83 | |
| Q4 (>30.8) | 7.19 | 3.60 | 9.00 | 17.43 | 9.68 | 19.40 | 10.12 | |
| Home-prepared | Total | 4.26 | 2.40 | 4.92 | 27.64 | 21.74 | 26.94 | 6.48 |
| 95% CIs | 2.54, 6.38 | 1.20, 5.00 | 2.60, 9.10 | 18.35, 37.86 | 9.44, 33.80 | 17.43, 51.00 | 3.63, 9.33 | |
| Q1 (≤10.5) | 1.57 | 1.07 | 0.69 | 26.55 | 15.00 | 32.28 | 2.42 | |
| Q2 (10.5–15) | 3.78 | 3.60 | 2.95 | 28.93 | 31.59 | 24.08 | 5.10 | |
| Q3 (15–21.7) | 4.95 | 4.45 | 5.32 | 25.13 | 21.01 | 23.77 | 5.97 | |
| Q4 (>21.7) | 7.19 | 4.55 | 5.99 | 30.14 | 19.41 | 21.90 | 10.33 | |
| All sources | Total | 4.26 | 2.50 | 5.02 | 24.16 | 14.94 | 27.87 | 6.42 |
| 95% CIs | 3.62, 4.97 | 2.00, 3.00 | 3.64, 6.85 | 20.67, 27.90 | 11.43, 17.78 | 21.39, 34.87 | 5.45, 7.38 | |
| Q1 (≤10.6) | 1.77 | 0.70 | 2.10 | 31.69 | 16.90 | 49.87 | 2.94 | |
| Q2 (10.6–18.7) | 3.99 | 2.50 | 4.57 | 27.35 | 17.69 | 29.44 | 5.67 | |
| Q3 (18.7–27.5) | 4.57 | 3.40 | 4.62 | 20.31 | 13.81 | 20.22 | 6.55 | |
| Q4 (>27.5) | 6.71 | 4.30 | 7.69 | 17.36 | 9.77 | 20.17 | 9.02 | |
| Calories (kcal) | ||||||||
| Source | Range | MAE | MedAE | IQRAE | MAPE (%) | MedAPE (%) | IQRAPE (%) | RMSE |
| Allrecipes.com | Total | 88.42 | 58.00 | 111.25 | 25.76 | 17.24 | 34.61 | 125.75 |
| 95% CIs | 70.69, 106.54 | 35.00, 77.00 | 76.75, 136.75 | 20.37, 31.41 | 8.97, 23.86 | 24.81, 42.84 | 102.82, 147.11 | |
| Q1 (≤280) | 61.60 | 57.00 | 73.00 | 37.19 | 23.84 | 39.21 | 81.64 | |
| Q2 (280–368.5) | 61.06 | 25.00 | 94.50 | 18.54 | 7.82 | 28.58 | 89.71 | |
| Q3 (368.5–502.5) | 127.52 | 104.00 | 137.80 | 29.51 | 25.73 | 32.89 | 167.50 | |
| Q4 (>502.5) | 103.46 | 55.00 | 137.50 | 17.02 | 9.12 | 22.69 | 143.33 | |
| SNAPMe | Total | 43.01 | 23.50 | 50.00 | 10.13 | 5.80 | 11.24 | 66.11 |
| 95% CIs | 32.15, 55.00 | 16.00, 35.50 | 31.00, 62.50 | 7.56, 13.06 | 4.35, 8.46 | 7.29, 14.74 | 48.67, 81.84 | |
| Q1 (≤348.2) | 28.89 | 16.00 | 30.50 | 13.35 | 8.46 | 11.79 | 44.82 | |
| Q2 (348.2–435.5) | 33.78 | 19.50 | 30.00 | 8.76 | 5.04 | 7.57 | 57.57 | |
| Q3 (435.5–592.8) | 54.51 | 33.50 | 60.25 | 10.56 | 6.52 | 13.27 | 76.65 | |
| Q4 (>592.8) | 55.00 | 36.00 | 60.00 | 7.80 | 4.33 | 6.77 | 79.40 | |
| Home-prepared | Total | 51.95 | 31.00 | 52.00 | 11.91 | 9.47 | 11.39 | 78.09 |
| 95% CIs | 31.90, 76.38 | 19.00, 66.00 | 23.00, 73.00 | 8.11, 16.25 | 4.75, 14.20 | 6.69, 20.07 | 42.22, 112.64 | |
| Q1 (≤381) | 31.07 | 21.00 | 38.25 | 13.02 | 11.65 | 12.25 | 39.90 | |
| Q2 (381–448) | 41.05 | 38.65 | 22.17 | 9.71 | 9.34 | 5.15 | 44.02 | |
| Q3 (448–489) | 23.00 | 19.00 | 14.25 | 4.85 | 4.03 | 3.17 | 31.35 | |
| Q4 (>489) | 116.16 | 112.00 | 89.75 | 19.88 | 17.87 | 18.37 | 143.64 | |
| All sources | Total | 66.51 | 35.00 | 73.00 | 18.05 | 8.97 | 21.03 | 101.12 |
| 95% CIs | 56.06, 77.45 | 25.00, 50.00 | 54.50, 99.00 | 15.01, 21.40 | 7.55, 11.65 | 14.74, 27.41 | 85.70, 115.85 | |
| Q1 (≤299) | 44.74 | 23.00 | 56.00 | 25.55 | 15.09 | 29.48 | 67.94 | |
| Q2 (299–407) | 60.63 | 39.00 | 60.00 | 16.86 | 10.12 | 17.17 | 88.28 | |
| Q3 (407–533.5) | 76.34 | 32.15 | 96.50 | 16.52 | 7.59 | 22.80 | 118.42 | |
| Q4 (>533.5) | 84.53 | 54.00 | 117.00 | 13.26 | 7.02 | 19.40 | 120.60 | |
| Proteins (g) | ||||||||
| Source | Range | MAE | MedAE | IQRAE | MAPE (%) | MedAPE (%) | IQRAPE (%) | RMSE |
| Allrecipes.com | Total | 6.36 | 4.10 | 6.60 | 43.15 | 20.65 | 40.76 | 9.49 |
| 95% CIs | 4.98, 7.81 | 2.85, 5.40 | 4.50, 8.72 | 30.08, 59.23 | 17.00, 28.42 | 30.27, 50.92 | 7.42, 11.45 | |
| Q1 (≤12) | 3.78 | 2.00 | 2.90 | 82.18 | 28.57 | 47.92 | 6.40 | |
| Q2 (12–19) | 3.41 | 3.20 | 4.67 | 22.26 | 20.03 | 33.53 | 4.44 | |
| Q3 (19–28) | 11.37 | 9.40 | 13.45 | 47.62 | 44.80 | 49.98 | 14.49 | |
| Q4 (>28) | 6.99 | 4.50 | 5.80 | 17.88 | 11.73 | 15.72 | 9.51 | |
| SNAPMe | Total | 4.12 | 2.30 | 5.02 | 21.44 | 10.82 | 14.08 | 6.02 |
| 95% CIs | 3.18, 5.17 | 1.75, 3.10 | 2.70, 7.59 | 14.00, 33.11 | 9.16, 14.91 | 9.02, 26.71 | 4.65, 7.31 | |
| Q1 (≤13.2) | 2.07 | 0.80 | 1.36 | 34.20 | 10.42 | 13.92 | 3.91 | |
| Q2 (13.2–22.6) | 4.14 | 2.45 | 3.89 | 23.15 | 11.96 | 28.78 | 6.05 | |
| Q3 (22.6–33.9) | 5.20 | 3.05 | 6.37 | 19.01 | 11.82 | 20.25 | 7.16 | |
| Q4 (>33.9) | 5.11 | 3.70 | 5.90 | 9.35 | 8.62 | 11.52 | 6.52 | |
| Home-prepared | Total | 3.13 | 2.28 | 3.50 | 11.32 | 9.29 | 9.65 | 4.01 |
| 95% CIs | 2.22, 4.20 | 1.50, 4.40 | 1.80, 4.80 | 8.36, 14.77 | 5.73, 14.08 | 4.77, 12.51 | 2.82, 5.22 | |
| Q1 (≤18.2) | 1.40 | 1.00 | 1.02 | 13.52 | 9.29 | 9.26 | 1.57 | |
| Q2 (18.2–27) | 2.15 | 1.50 | 0.96 | 8.78 | 5.64 | 3.32 | 2.86 | |
| Q3 (27–38.8) | 4.74 | 4.80 | 1.65 | 14.04 | 15.29 | 5.03 | 5.11 | |
| Q4 (>38.8) | 4.53 | 4.20 | 1.07 | 8.57 | 8.84 | 3.90 | 5.45 | |
| All sources | Total | 5.09 | 2.90 | 5.44 | 30.83 | 15.00 | 26.77 | 7.75 |
| 95% CIs | 4.30, 5.94 | 2.30, 3.90 | 4.35, 7.00 | 23.28, 39.71 | 11.73, 17.06 | 18.13, 35.36 | 6.46, 9.04 | |
| Q1 (≤13) | 3.04 | 1.80 | 3.30 | 55.47 | 20.00 | 35.00 | 5.28 | |
| Q2 (13–22) | 4.70 | 2.55 | 4.50 | 25.43 | 13.65 | 34.02 | 7.27 | |
| Q3 (22–33.3) | 7.40 | 4.10 | 8.05 | 27.84 | 14.40 | 31.21 | 10.67 | |
| Q4 (>33.3) | 5.68 | 4.50 | 6.20 | 12.31 | 10.47 | 11.29 | 7.44 | |
| Carbohydrates (g) | ||||||||
| Source | Range | MAE | MedAE | IQRAE | MAPE (%) | MedAPE (%) | IQRAPE (%) | RMSE |
| Allrecipes.com | Total | 7.81 | 5.25 | 9.90 | 42.54 | 24.95 | 37.26 | 12.00 |
| 95% CIs | 6.07, 9.67 | 3.00, 6.80 | 6.75, 13.70 | 28.19, 61.62 | 15.78, 29.29 | 30.10, 46.73 | 9.5, 14.78 | |
| Q1 (≤12) | 4.98 | 1.25 | 4.30 | 83.94 | 24.72 | 50.67 | 10.32 | |
| Q2 (12–26) | 7.04 | 6.70 | 4.10 | 37.56 | 32.31 | 23.33 | 8.58 | |
| Q3 (26–41) | 10.24 | 8.05 | 11.70 | 28.85 | 23.85 | 31.79 | 13.32 | |
| Q4 (>41) | 9.21 | 3.70 | 12.90 | 14.98 | 5.80 | 22.59 | 14.90 | |
| SNAPMe | Total | 4.38 | 2.90 | 3.57 | 13.84 | 7.10 | 9.65 | 7.52 |
| 95% CIs | 3.14, 5.93 | 2.32, 3.70 | 2.72, 6.10 | 8.16, 22.30 | 5.35, 8.96 | 7.00, 13.11 | 4.43, 10.36 | |
| Q1 (≤26) | 4.18 | 2.60 | 2.87 | 28.08 | 12.02 | 15.23 | 8.57 | |
| Q2 (26–40) | 2.63 | 2.60 | 1.80 | 8.33 | 8.67 | 7.22 | 3.33 | |
| Q3 (40–52.3) | 4.78 | 2.70 | 4.93 | 10.64 | 5.77 | 9.73 | 8.90 | |
| Q4 (>52.3) | 5.78 | 4.20 | 4.50 | 6.83 | 6.56 | 3.89 | 7.59 | |
| Home-prepared | Total | 6.48 | 3.70 | 7.59 | 17.98 | 12.68 | 19.74 | 9.17 |
| 95% CIs | 4.18, 9.28 | 1.60, 8.80 | 3.81, 11.50 | 11.82, 25.22 | 5.56, 23.53 | 9.07, 31.43 | 5.53, 12.71 | |
| Q1 (≤33.5) | 4.71 | 3.70 | 4.85 | 25.67 | 25.30 | 18.56 | 5.64 | |
| Q2 (33.5–41.8) | 2.64 | 1.35 | 1.07 | 6.62 | 3.80 | 2.81 | 4.01 | |
| Q3 (41.8–46.4) | 11.50 | 8.30 | 13.18 | 26.06 | 18.21 | 28.69 | 14.95 | |
| Q4 (>550) | 7.38 | 7.20 | 4.62 | 12.29 | 12.74 | 8.15 | 8.58 | |
| All sources | Total | 6.34 | 3.70 | 6.67 | 28.50 | 12.22 | 24.91 | 10.15 |
| 95% CIs | 5.28, 7.51 | 2.90, 4.30 | 5.70, 8.30 | 20.70, 38.61 | 8.64, 14.79 | 20.04, 33.56 | 8.24, 12.07 | |
| Q1 (≤ 17.9) | 5.16 | 2.20 | 5.50 | 63.64 | 24.62 | 45.33 | 9.83 | |
| Q2 (17.9–34.5) | 5.27 | 3.70 | 6.60 | 20.66 | 13.53 | 23.75 | 7.10 | |
| Q3 (34.5–46.2) | 7.22 | 2.95 | 8.52 | 17.99 | 7.11 | 22.63 | 11.41 | |
| Q4 (>46.2) | 7.72 | 4.41 | 6.80 | 11.50 | 7.12 | 9.03 | 11.66 | |
| Lipids (g) | ||||||||
| Source | Range | MAE | MedAE | IQRAE | MAPE (%) | MedAPE (%) | IQRAPE (%) | RMSE |
| Allrecipes.com | Total | 6.12 | 3.00 | 7.07 | 34.41 | 16.85 | 42.06 | 9.58 |
| 95% CIs | 4.68, 7.64 | 1.70, 4.60 | 5.00, 12.70 | 26.15, 43.62 | 10.00, 34.67 | 33.70, 55.48 | 7.57, 11.42 | |
| Q1 (≤10) | 2.43 | 1.30 | 2.50 | 36.80 | 26.00 | 44.29 | 4.19 | |
| Q2 (10–19.5) | 7.90 | 6.00 | 9.35 | 54.15 | 38.89 | 63.20 | 11.99 | |
| Q3 (19.5–27.2) | 6.16 | 4.60 | 7.65 | 25.25 | 17.78 | 30.65 | 8.31 | |
| Q4 (>27.2) | 8.23 | 4.05 | 13.67 | 22.18 | 8.61 | 42.32 | 11.91 | |
| SNAPMe | Total | 4.58 | 1.50 | 4.28 | 21.64 | 12.21 | 20.21 | 8.42 |
| 95% CIs | 3.11, 6.29 | 1.10, 2.35 | 1.85, 8.22 | 15.88, 28.10 | 7.51, 17.38 | 13.73, 32.69 | 5.67, 10.96 | |
| Q1 (≤11.2) | 0.95 | 0.80 | 0.75 | 20.66 | 17.83 | 12.61 | 1.16 | |
| Q2 (11.2–19.2) | 3.19 | 1.27 | 1.78 | 19.32 | 9.12 | 12.46 | 6.98 | |
| Q3 (19.2–30.8) | 5.67 | 2.20 | 8.17 | 24.54 | 8.64 | 38.25 | 9.05 | |
| Q4 (>30.8) | 8.48 | 5.40 | 10.65 | 22.03 | 11.88 | 19.91 | 12.29 | |
| Home-prepared | Total | 4.54 | 3.33 | 4.00 | 30.95 | 24.44 | 27.74 | 6.24 |
| 95% CIs | 2.98, 6.26 | 1.90, 5.00 | 2.10, 10.08 | 19.99, 44.89 | 15.47, 33.94 | 11.22, 43.13 | 4.04, 8.16 | |
| Q1 (≤10.5) | 3.58 | 1.90 | 3.23 | 40.79 | 27.14 | 31.13 | 6.46 | |
| Q2 (10.5–15) | 4.97 | 3.65 | 3.17 | 38.69 | 32.07 | 33.39 | 6.41 | |
| Q3 (15–21.7) | 3.65 | 3.81 | 2.19 | 18.23 | 17.64 | 11.92 | 4.00 | |
| Q4 (>21.7) | 6.10 | 5.40 | 6.55 | 24.46 | 23.03 | 30.20 | 7.52 | |
| All sources | Total | 5.33 | 2.40 | 5.70 | 29.16 | 16.42 | 34.24 | 8.78 |
| 95% CIs | 4.39, 6.35 | 1.70, 3.00 | 4.35, 8.20 | 24.06, 34.73 | 11.88, 20.83 | 29.60, 41.93 | 7.31, 10.18 | |
| Q1 (≤10.6) | 2.06 | 1.00 | 1.80 | 32.35 | 20.00 | 33.45 | 3.91 | |
| Q2 (10.6–18.7) | 5.09 | 2.30 | 5.60 | 35.41 | 16.00 | 33.50 | 8.98 | |
| Q3 (18.7–27.5) | 5.93 | 4.45 | 7.77 | 26.25 | 17.78 | 32.95 | 8.16 | |
| Q4 (>27.5) | 8.26 | 4.40 | 13.20 | 22.64 | 10.18 | 32.88 | 12.07 | |
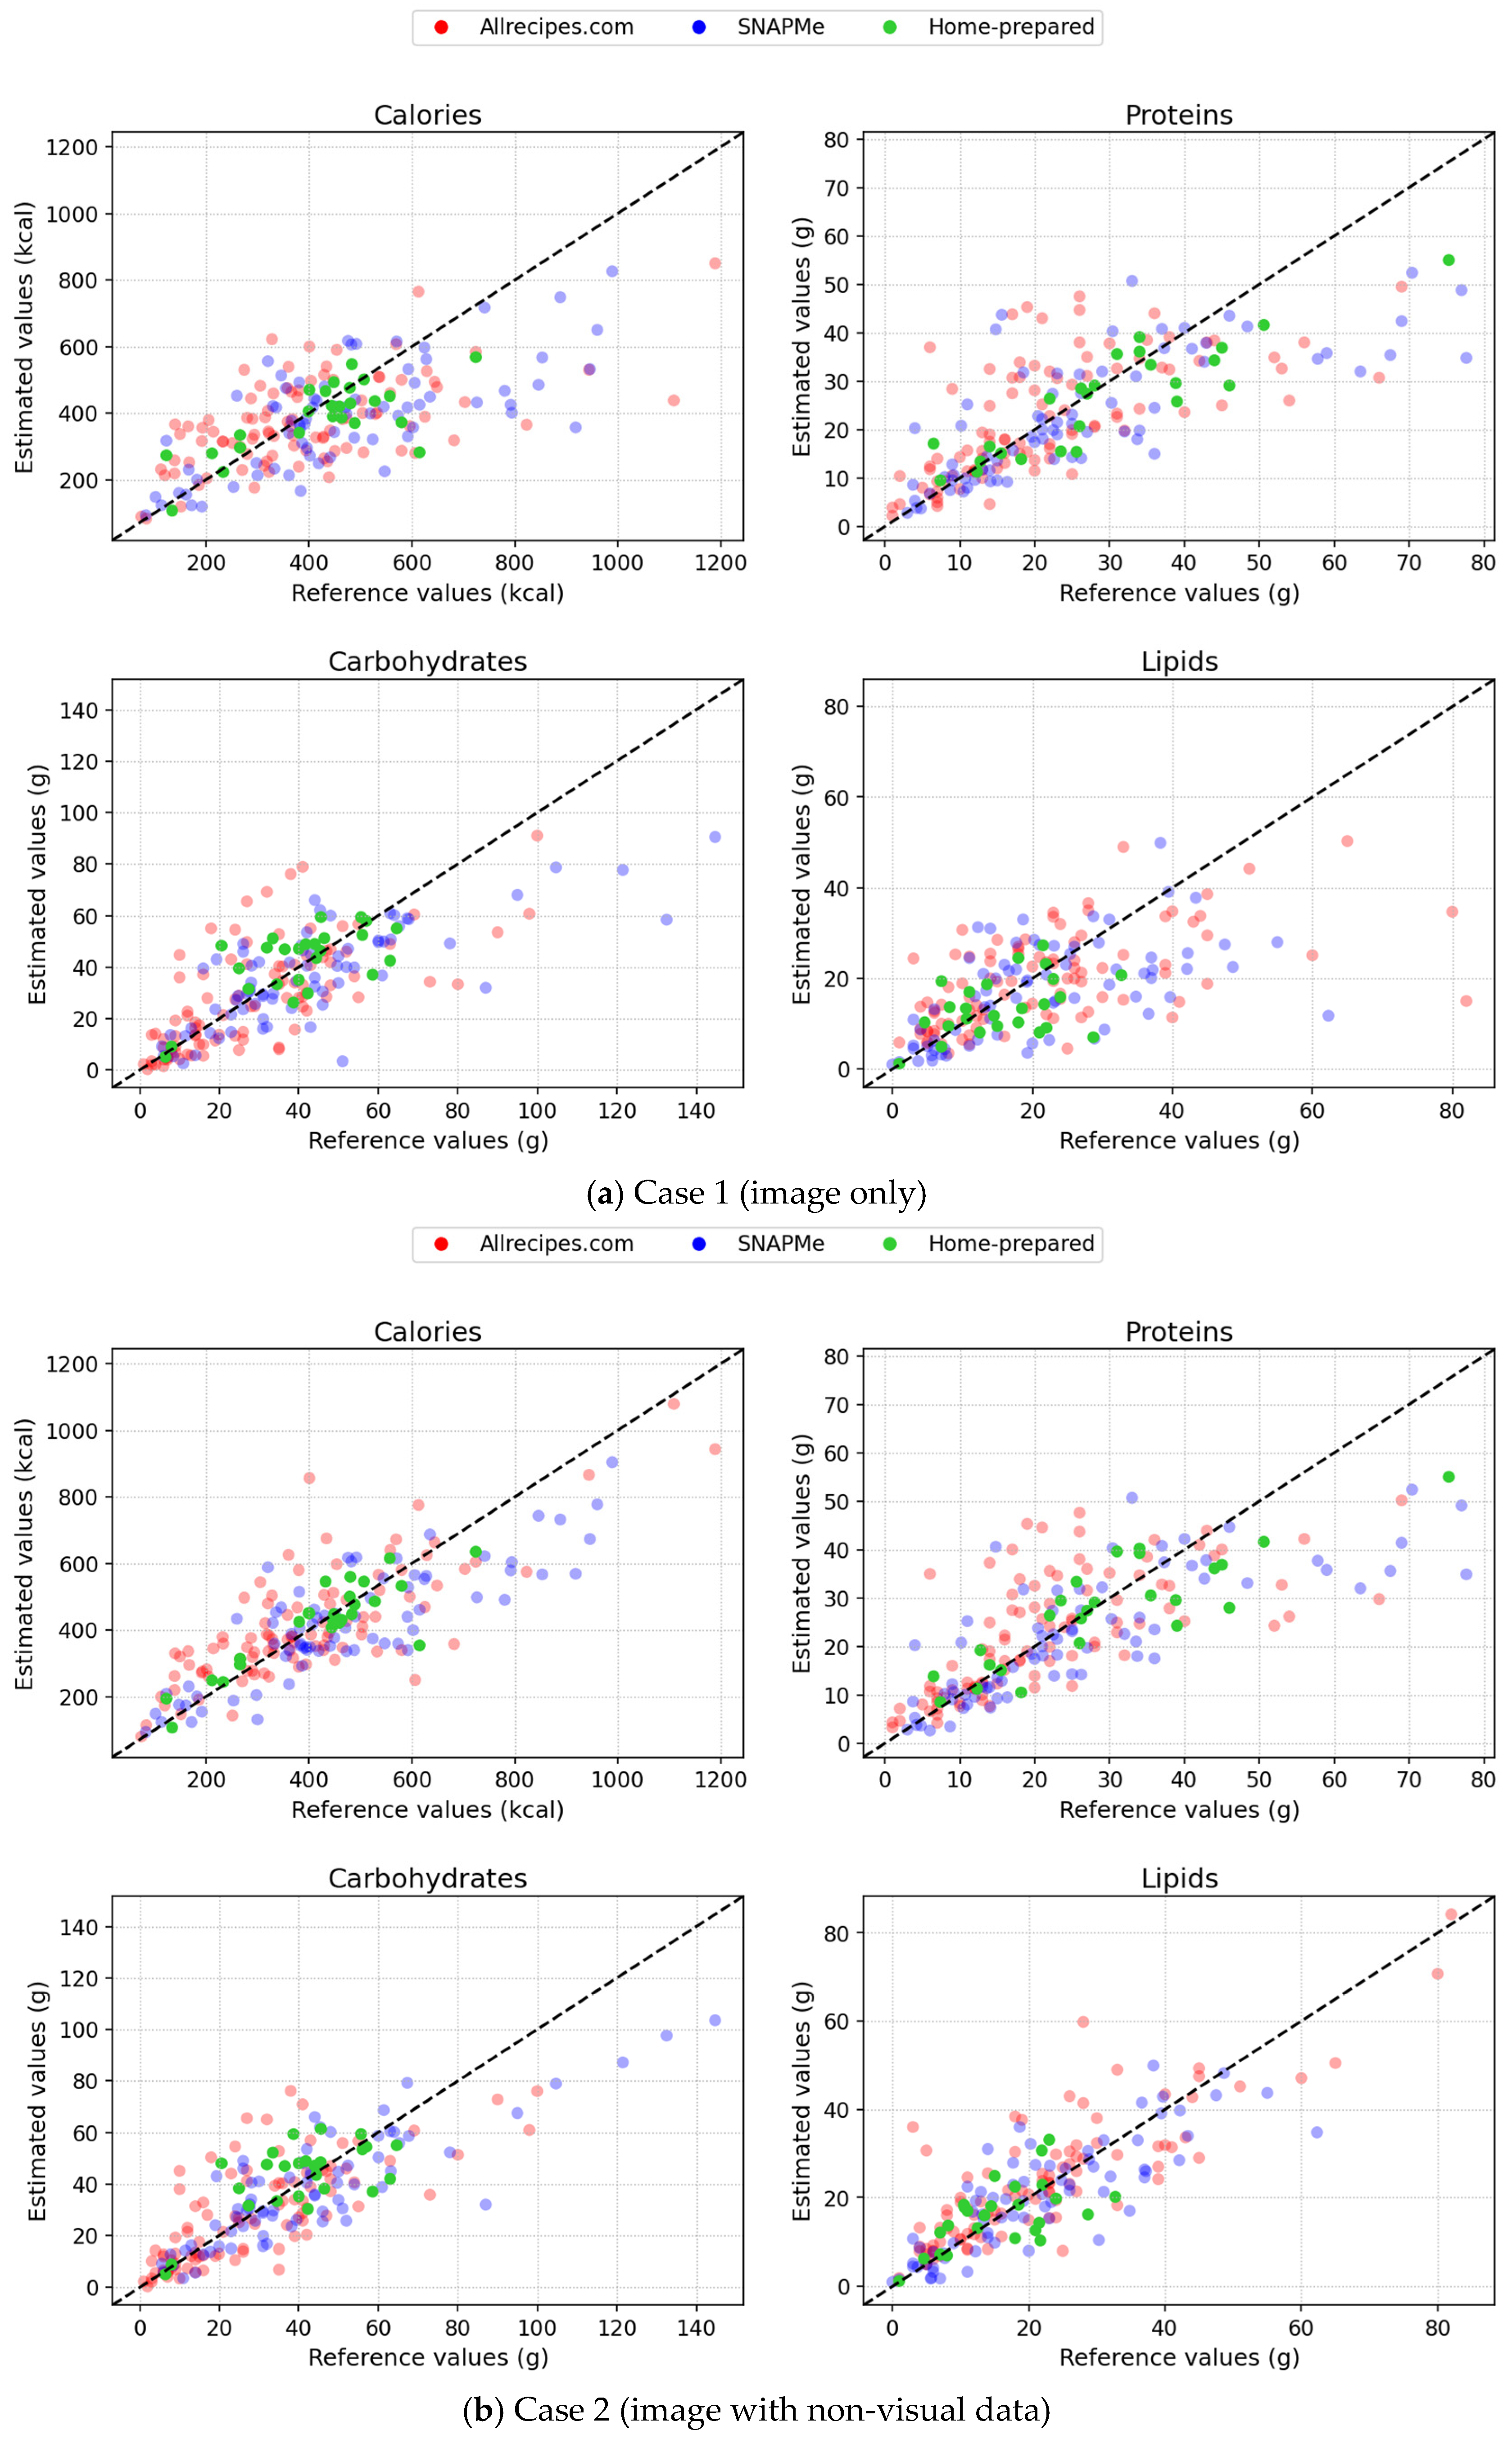
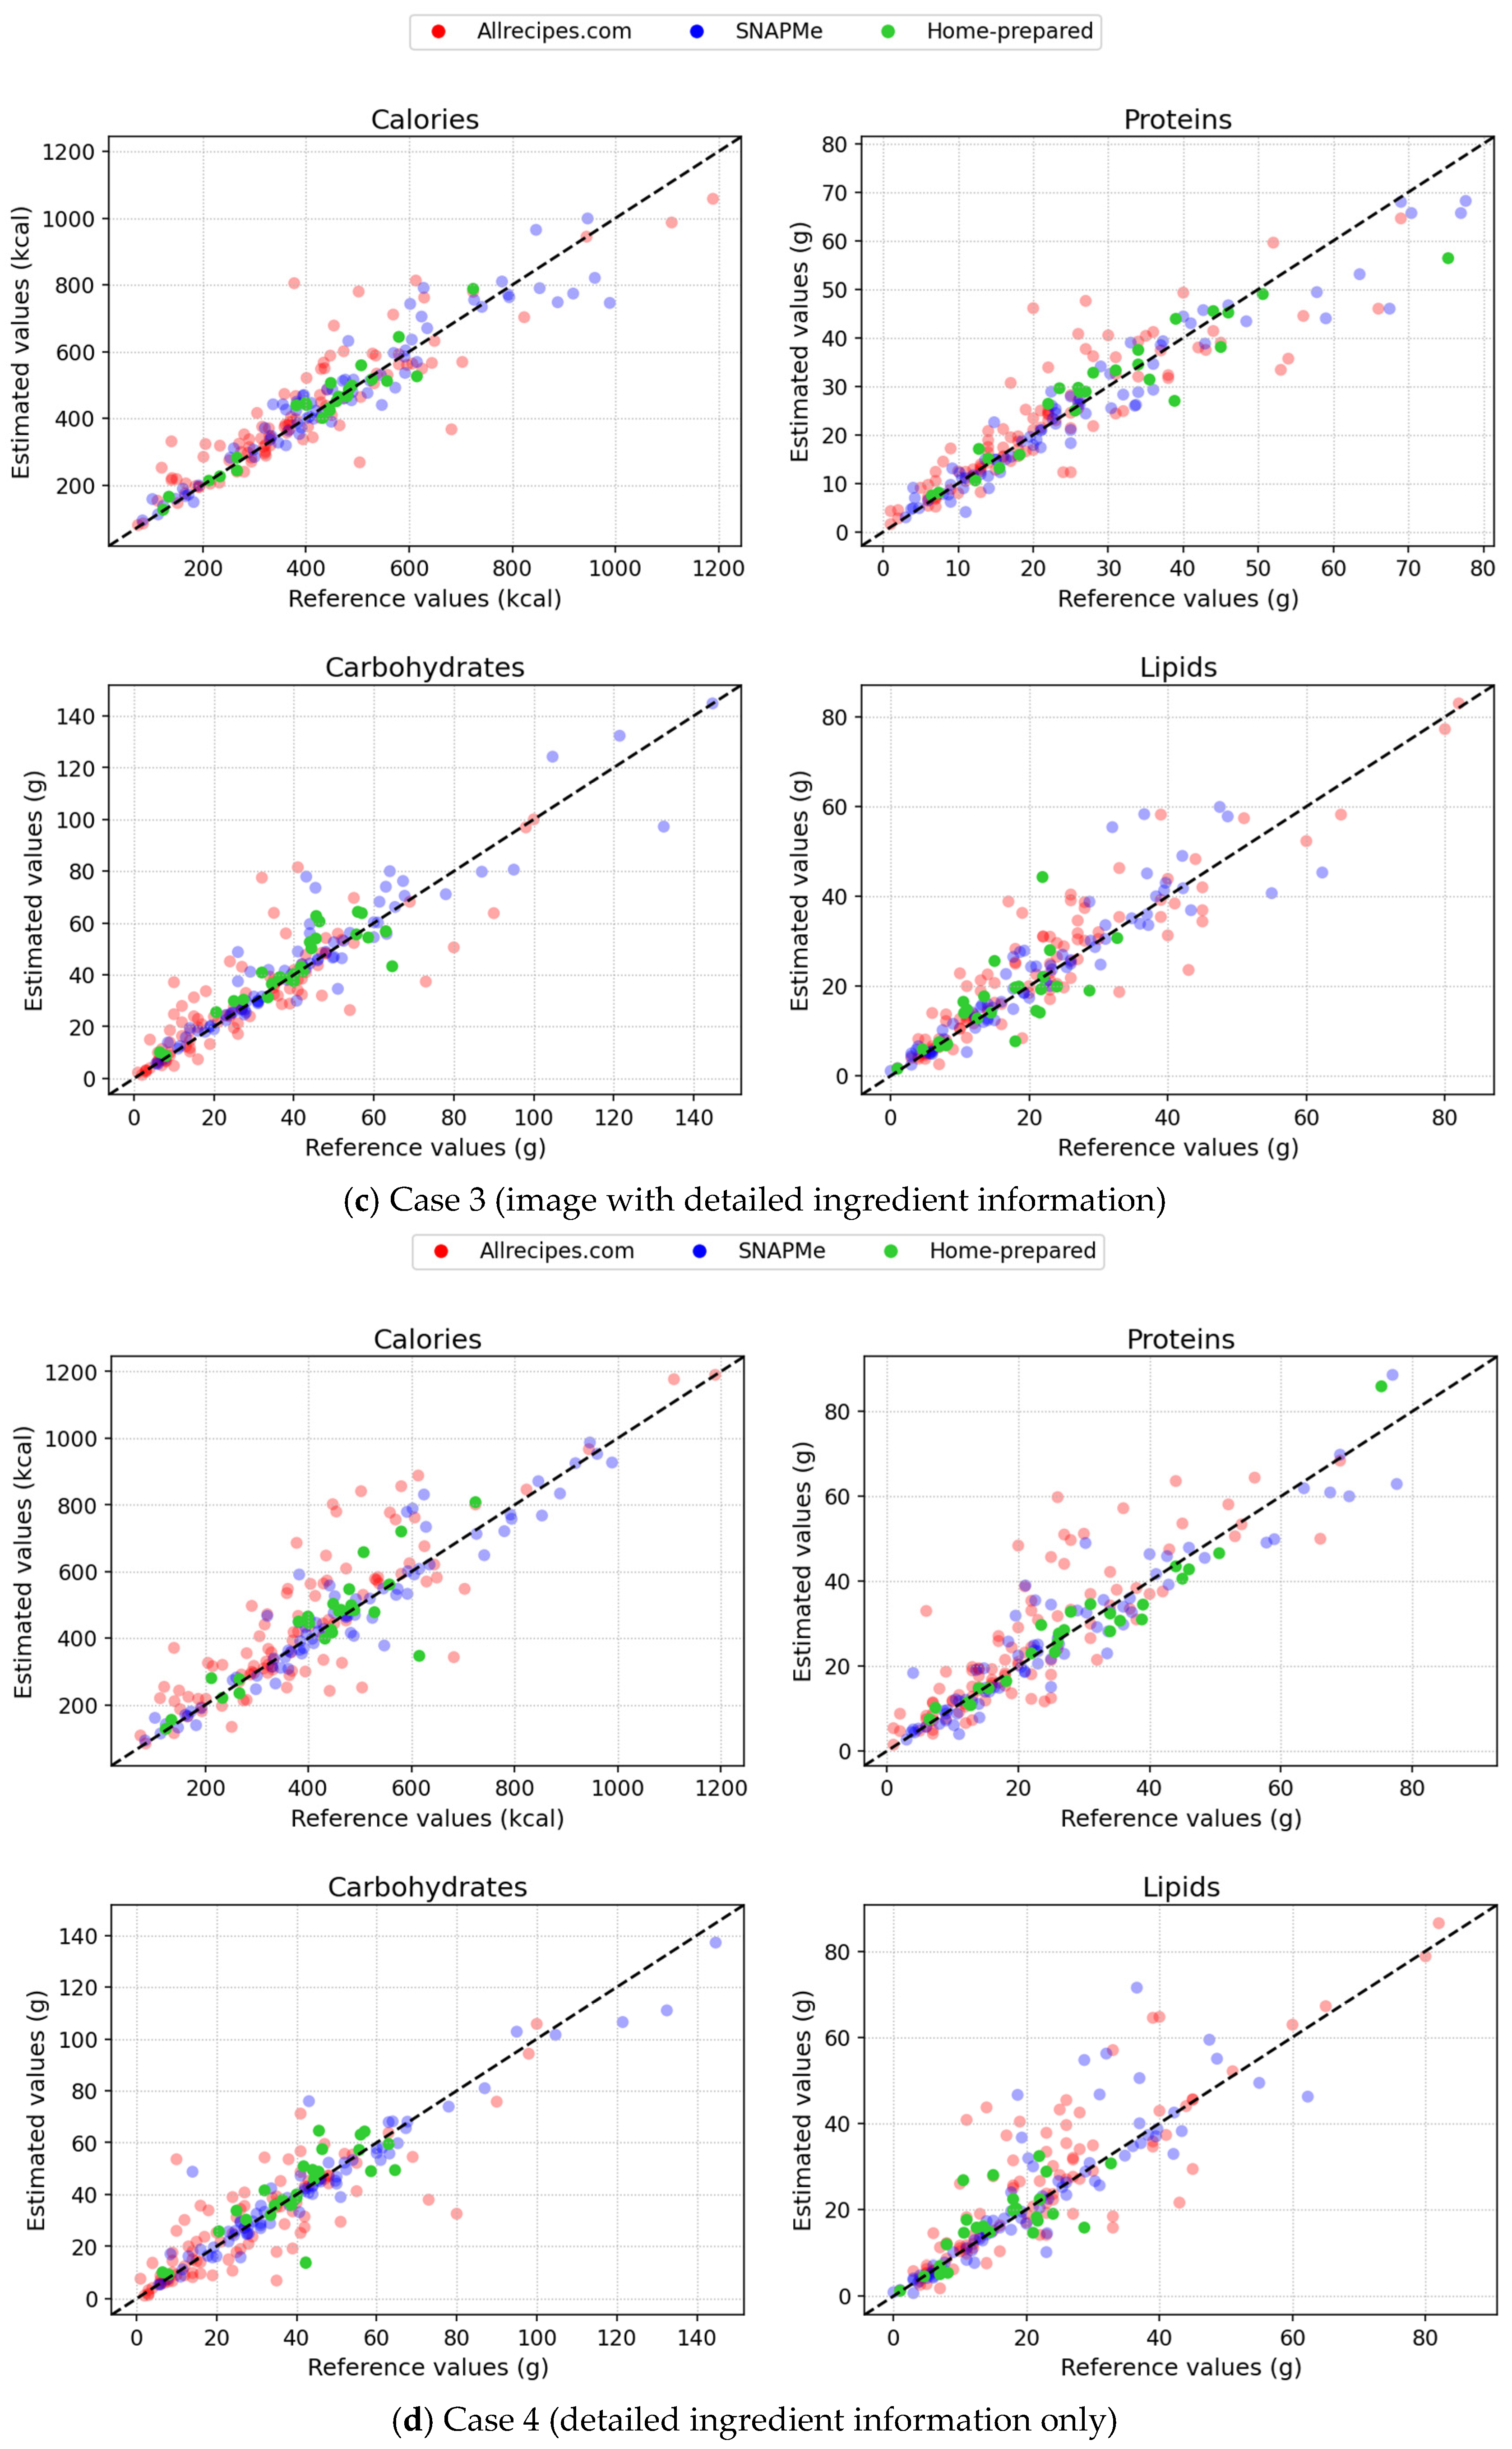
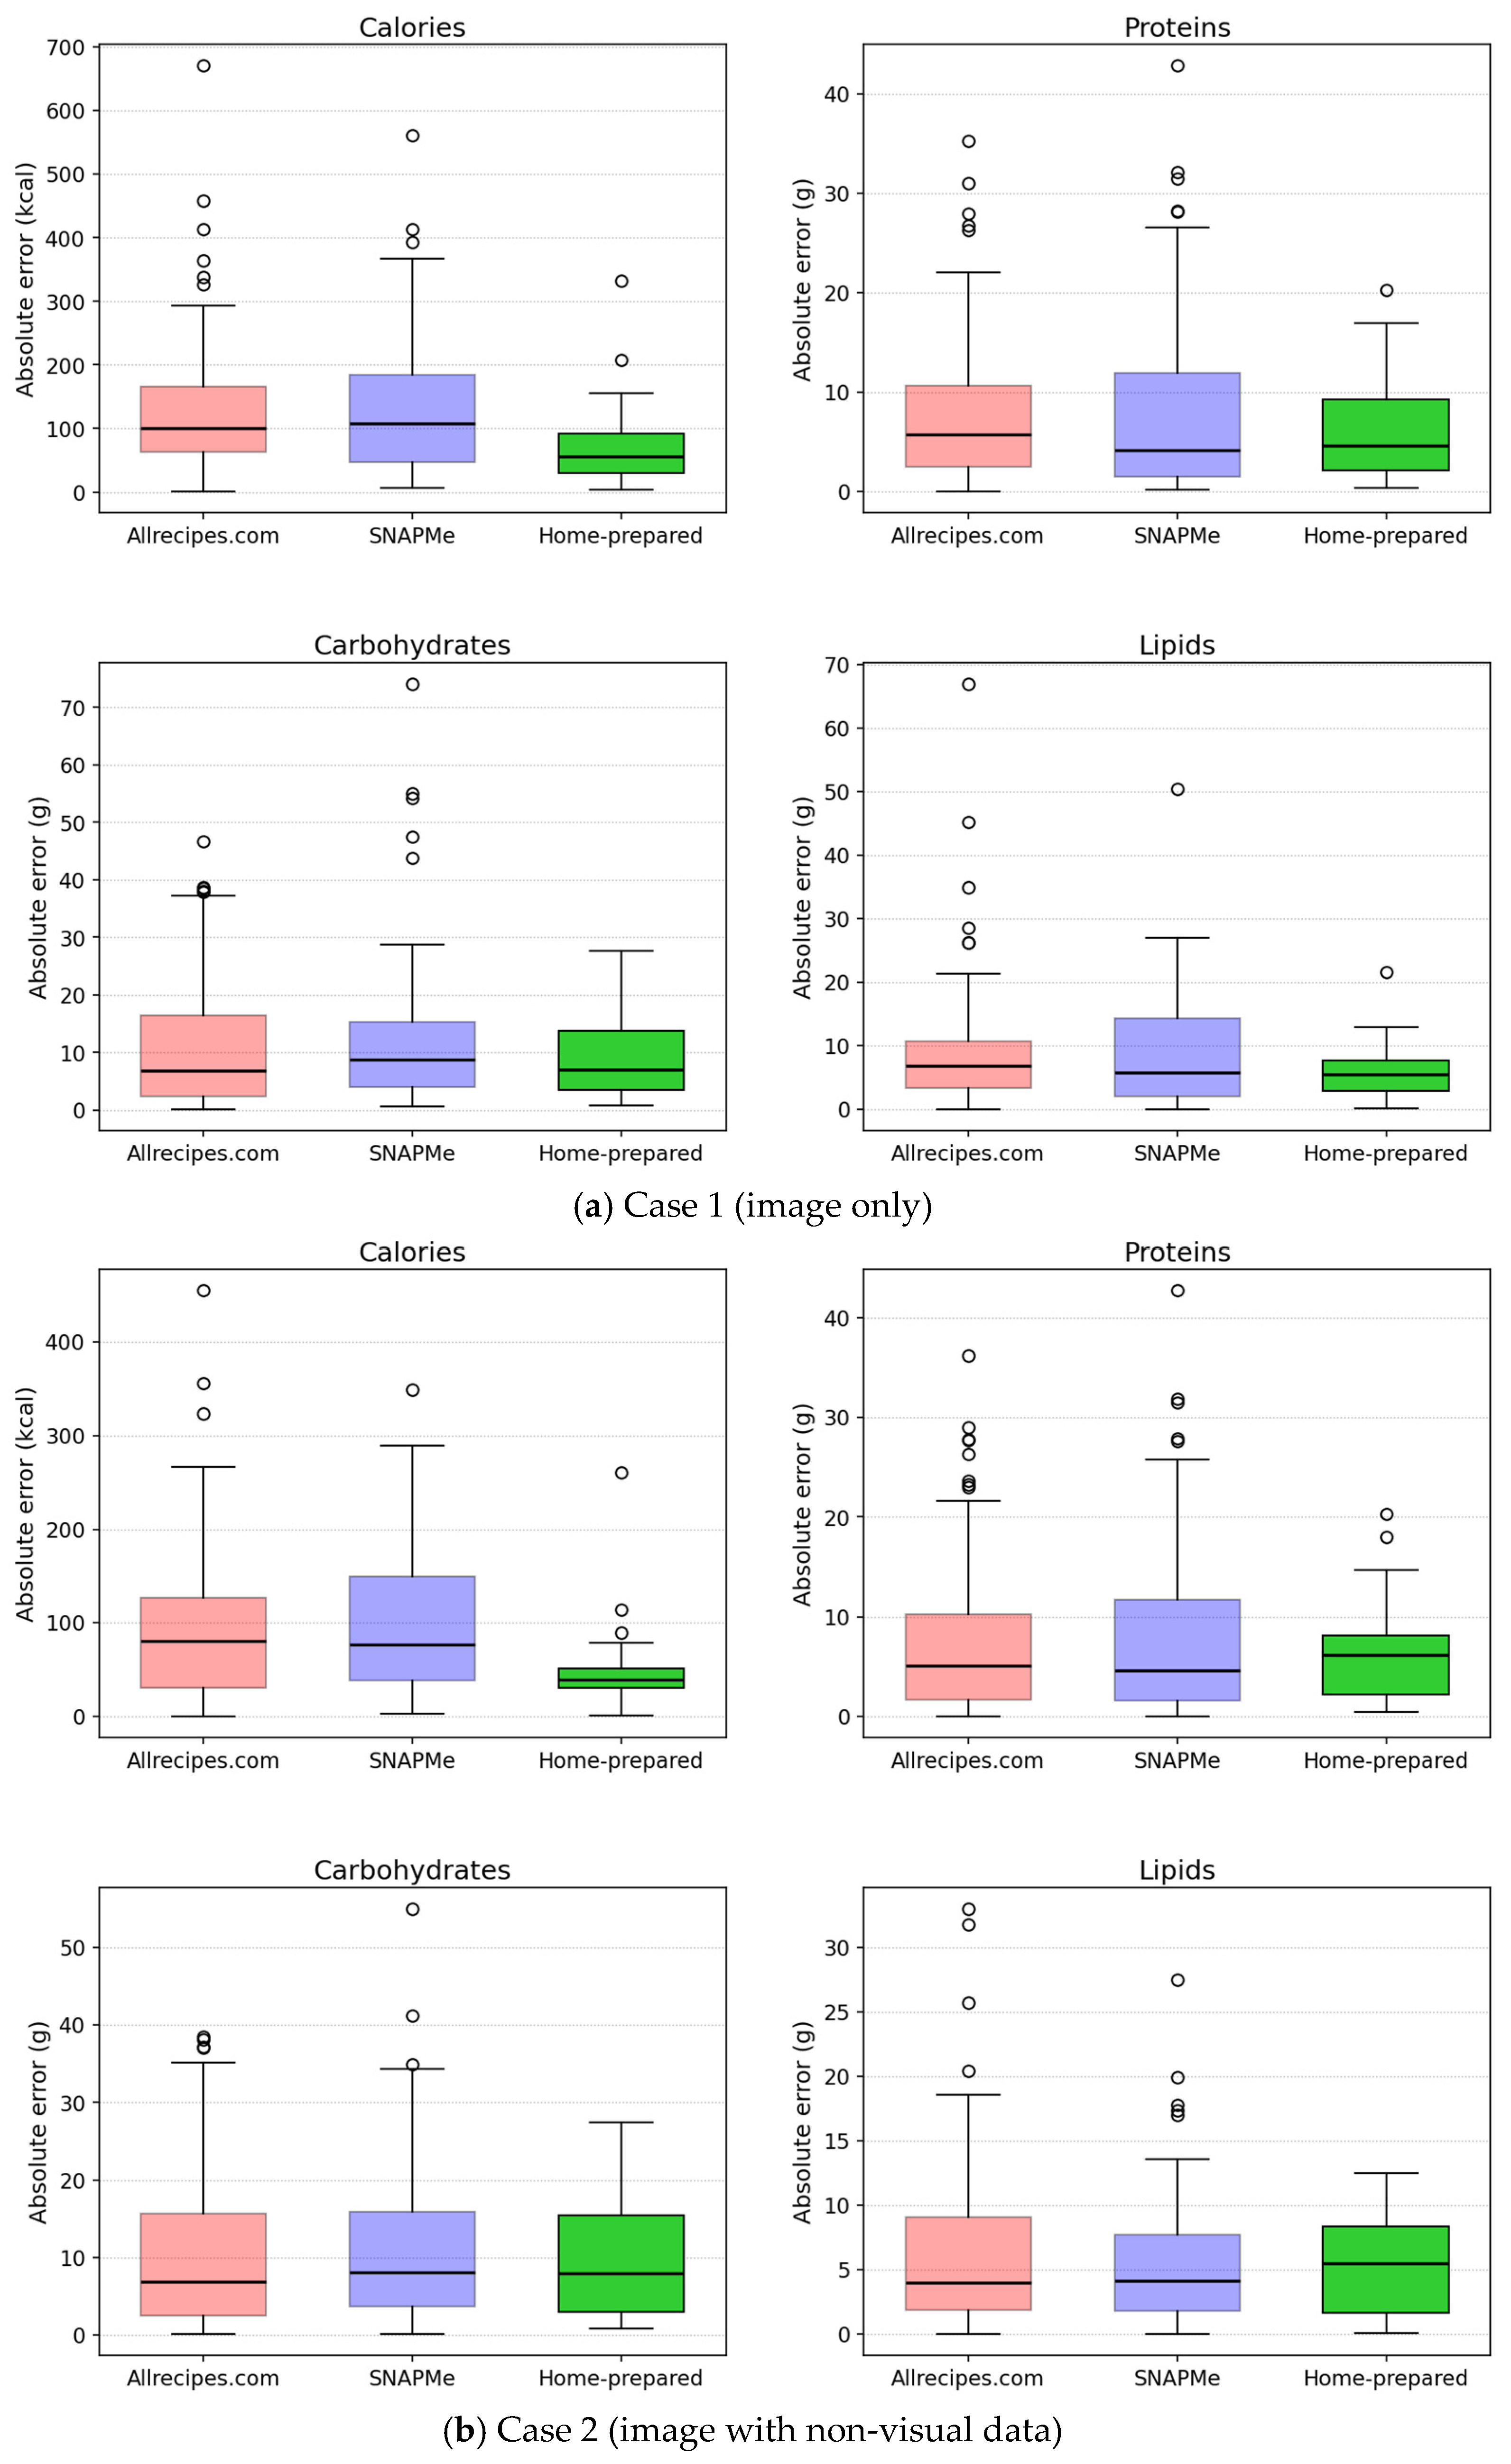
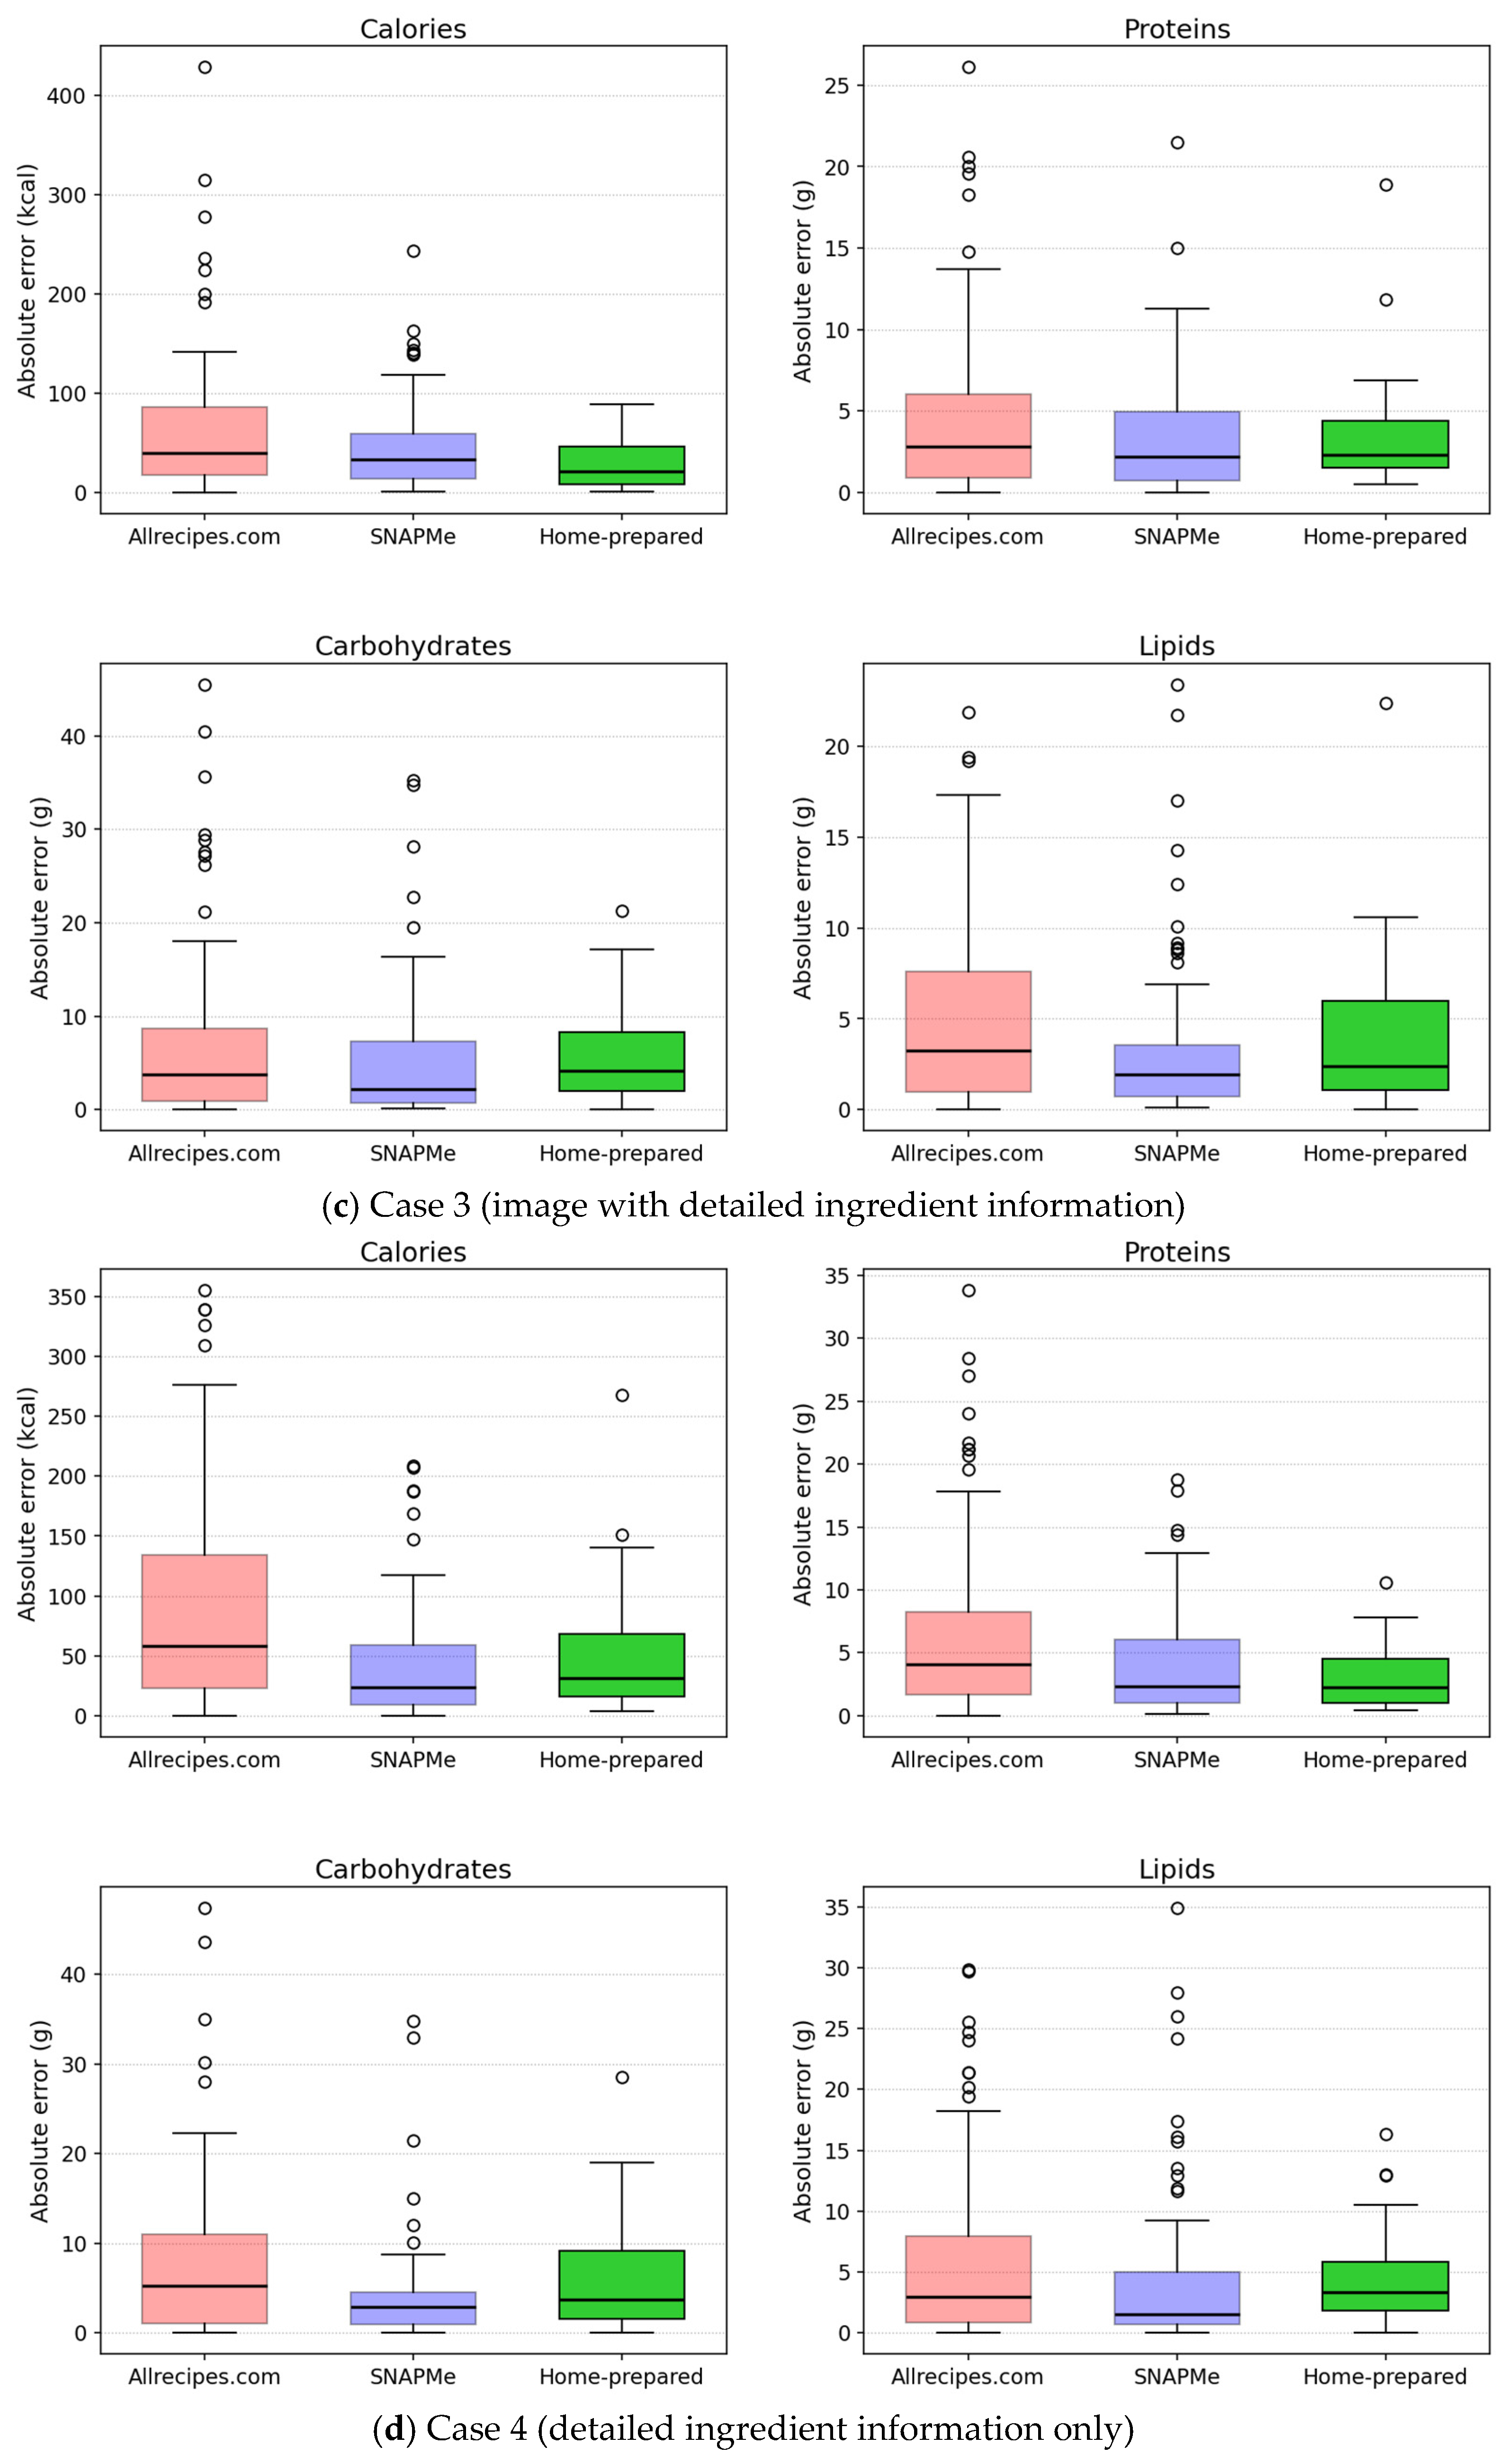
| Case | Variable | Kruskal–Wallis ) | Pairwise Comparison | Mann–Whitney ) | Holm ) | |
|---|---|---|---|---|---|---|
| 1 | Calories (kcal) | H = 7.863, = 0.020 | Allrecipes.com vs. SNAPMe | U = 3553.5, = 0.998 | — | — |
| Allrecipes.com vs. Home-prepared | U = 1644.0, = 0.005 | 0.018 | Large | |||
| SNAPMe vs. Home-prepared | U = 1219.5, = 0.018 | 0.072 | Large | |||
| Proteins (g) | H = 0.777, = 0.678 | — | — | — | — | |
| Carbohydrates (g) | H = 2.018, = 0.365 | — | — | — | — | |
| Lipids (g) | H = 1.205, = 0.547 | — | — | — | — | |
| 2 | Calories (kcal) | H = 9.043, = 0.011 | Allrecipes.com vs. SNAPMe | U = 3367.5, = 0.563 | — | — |
| Allrecipes.com vs. Home-prepared | U = 1616.5, = 0.008 | 0.031 | Large | |||
| SNAPMe vs. Home-prepared | U = 1286.5, = 0.004 | 0.015 | Large | |||
| Proteins (g) | H = 0.083, = 0.960 | — | — | — | — | |
| Carbohydrates (g) | H = 0.700, = 0.705 | — | — | — | — | |
| Lipids (g) | H = 0.208, = 0.901 | — | — | — | — | |
| 3 | Calories (kcal) | H = 5.743, = 0.057 | — | — | — | — |
| Proteins (g) | H = 1.936, = 0.380 | — | — | — | — | |
| Carbohydrates (g) | H = 1.428, = 0.490 | — | — | — | — | |
| Lipids (g) | H = 3.669, = 0.160 | — | — | — | — | |
| 4 | Calories (kcal) | H = 14.130, 0.001 | Allrecipes.com vs. SNAPMe | U = 4716.5, 0.001 | 0.001 | Large |
| Allrecipes.com vs. Home-prepared | U = 1477.5, = 0.076 | — | — | |||
| SNAPMe vs. Home-prepared | U = 803.0, = 0.328 | — | — | |||
| Proteins (g) | H = 2.005, = 0.367 | — | — | — | — | |
| Carbohydrates (g) | H = 7.753, 0.021 | Allrecipes.com vs. SNAPMe | U = 4373.5, 0.010 | 0.030 | Small | |
| Allrecipes.com vs. Home-prepared | U = 1176.0, = 0.880 | — | — | |||
| SNAPMe vs. Home-prepared | U = 684.0, = 0.053 | — | — | |||
| Lipids (g) | H = 3.229, = 0.199 | — | — | — | — |
4. Discussion
4.1. Results Interpretation
4.2. Comparison with Related Work
4.3. Practical Application of ChatGPT
4.4. Open Issues
- Higher estimation errors were consistently observed for dishes served in bowls, likely reflecting ChatGPT-5’s limited ability to infer depth and volume from monocular images. Future work could evaluate the effectiveness of including a vertically oriented reference object placed beside the dish to improve volumetric estimation.
- Since ChatGPT-5 is a pre-trained, closed-weight model, conventional validation schemes such as holdout test sets or k-fold cross-validation cannot be directly applied. The model’s parameters are fixed and not updated during use, so its outputs reflect generalization learned during large-scale pretraining rather than task-specific adaptation. Nevertheless, such validation procedures would be highly relevant in the context of fine-tuned or customized derivatives of ChatGPT-5, as described in Appendix C. For these tailored versions, systematic partitioning of annotated data into training, validation, and test sets (or stratified k-fold cross-validation) would enable quantitative assessment of generalizability and overfitting. Furthermore, iterative prompt engineering and supervised fine-tuning on domain-specific image–nutrient pairs could improve accuracy, reduce variance across food types, and enhance reliability for practical dietary assessment applications.
- A major limitation for future research is the absence of broad, high-quality, and systematically annotated datasets linking food images to verified nutritional composition. The development of such a database, curated by nutrition professionals, would provide a reliable foundation for both model evaluation and fine-tuning. At Universidad Europea del Atlántico, such an initiative is being considered, involving active participation of students in Human Nutrition and Dietetics or related disciplines. Leveraging their technical training and the institution’s multicultural environment would ensure both the accuracy and diversity of the dataset, enhancing its representativeness for real-world dietary applications.
- Future research should include direct benchmarking of ChatGPT-5’s nutritional estimations against both traditional computer vision models and professional dietitian assessments. Such head-to-head evaluations would provide a clearer understanding of the model’s relative strengths and limitations, quantify its added value beyond established analytical frameworks, and support evidence-based assessment of its potential integration into clinical nutrition and dietary evaluation workflows.
5. Conclusions
Author Contributions
Funding
Institutional Review Board Statement
Informed Consent Statement
Data Availability Statement
Conflicts of Interest
Abbreviations
| AI | Artificial Intelligence |
| API | Application Programming Interface |
| CI | Confidence Interval |
| DL | Deep Learning |
| GPT | Generative Pre-trained Transformer |
| IQR | Interquartile Range |
| IQRAE | IQR of Absolute Errors |
| IQRAPE | IQR of Absolute Percentage Errors |
| MAE | Mean Absolute Error |
| MedAE | Median Absolute Error |
| MAPE | Mean Absolute Percentage Error |
| MedAPE | Median Absolute Percentage Error |
| NANS | National Adult Nutrition Survey |
| RMSE | Root Mean Square Error |
| SMAE | Mexican System of Food Equivalents |
| SNAPMe | Surveying Nutrient Assessment with Photographs of Meals |
| USDA | U.S. Department of Agriculture |
Appendix A
| Image | Ingredients | Energy (kcal) | Proteins (g) | Lipids (g) | Carbohydrates (g) |
 Allrecipes.com [20] | ¼ cup vegetable oil; 3 corn tortillas (6 inches) cut into strips; ¾ dried pasilla chile (seeded); ½ tomato (seeded and chopped); ⅛ large onion (chopped); ¼ garlic clove; a pinch of dried oregano (≈1/16 teaspoon); ¼ teaspoon vegetable oil; 1 cup of water; 1 teaspoon chicken bouillon granules; ¼ sprig fresh parsley; ¼ avocado (peeled, pitted, and diced); 3 tablespoons cotija cheese (diced); ½ tablespoon crème fraîche (or Mexican crema). | 944 | 52 | 80 | 13 |
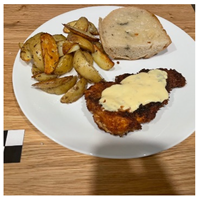 SNAPMe [11] | 120 g breaded chicken fillet; 15 g honey mustard dip; 180 g potato, French fries (baked); 13.5 g olive oil; 66.6 g French bread; 5 g salted butter stick. | 960 | 29 | 55 | 95 |
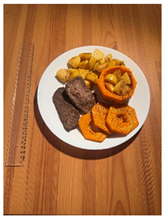 Home-prepared | 82 g grilled beef; 200 g boiled potatoes; 170 g baked pumpkin; ½ teaspoon coconut oil; ½ teaspoon olive oil. | 459 | 38.84 | 11.00 | 58.60 |
Appendix B

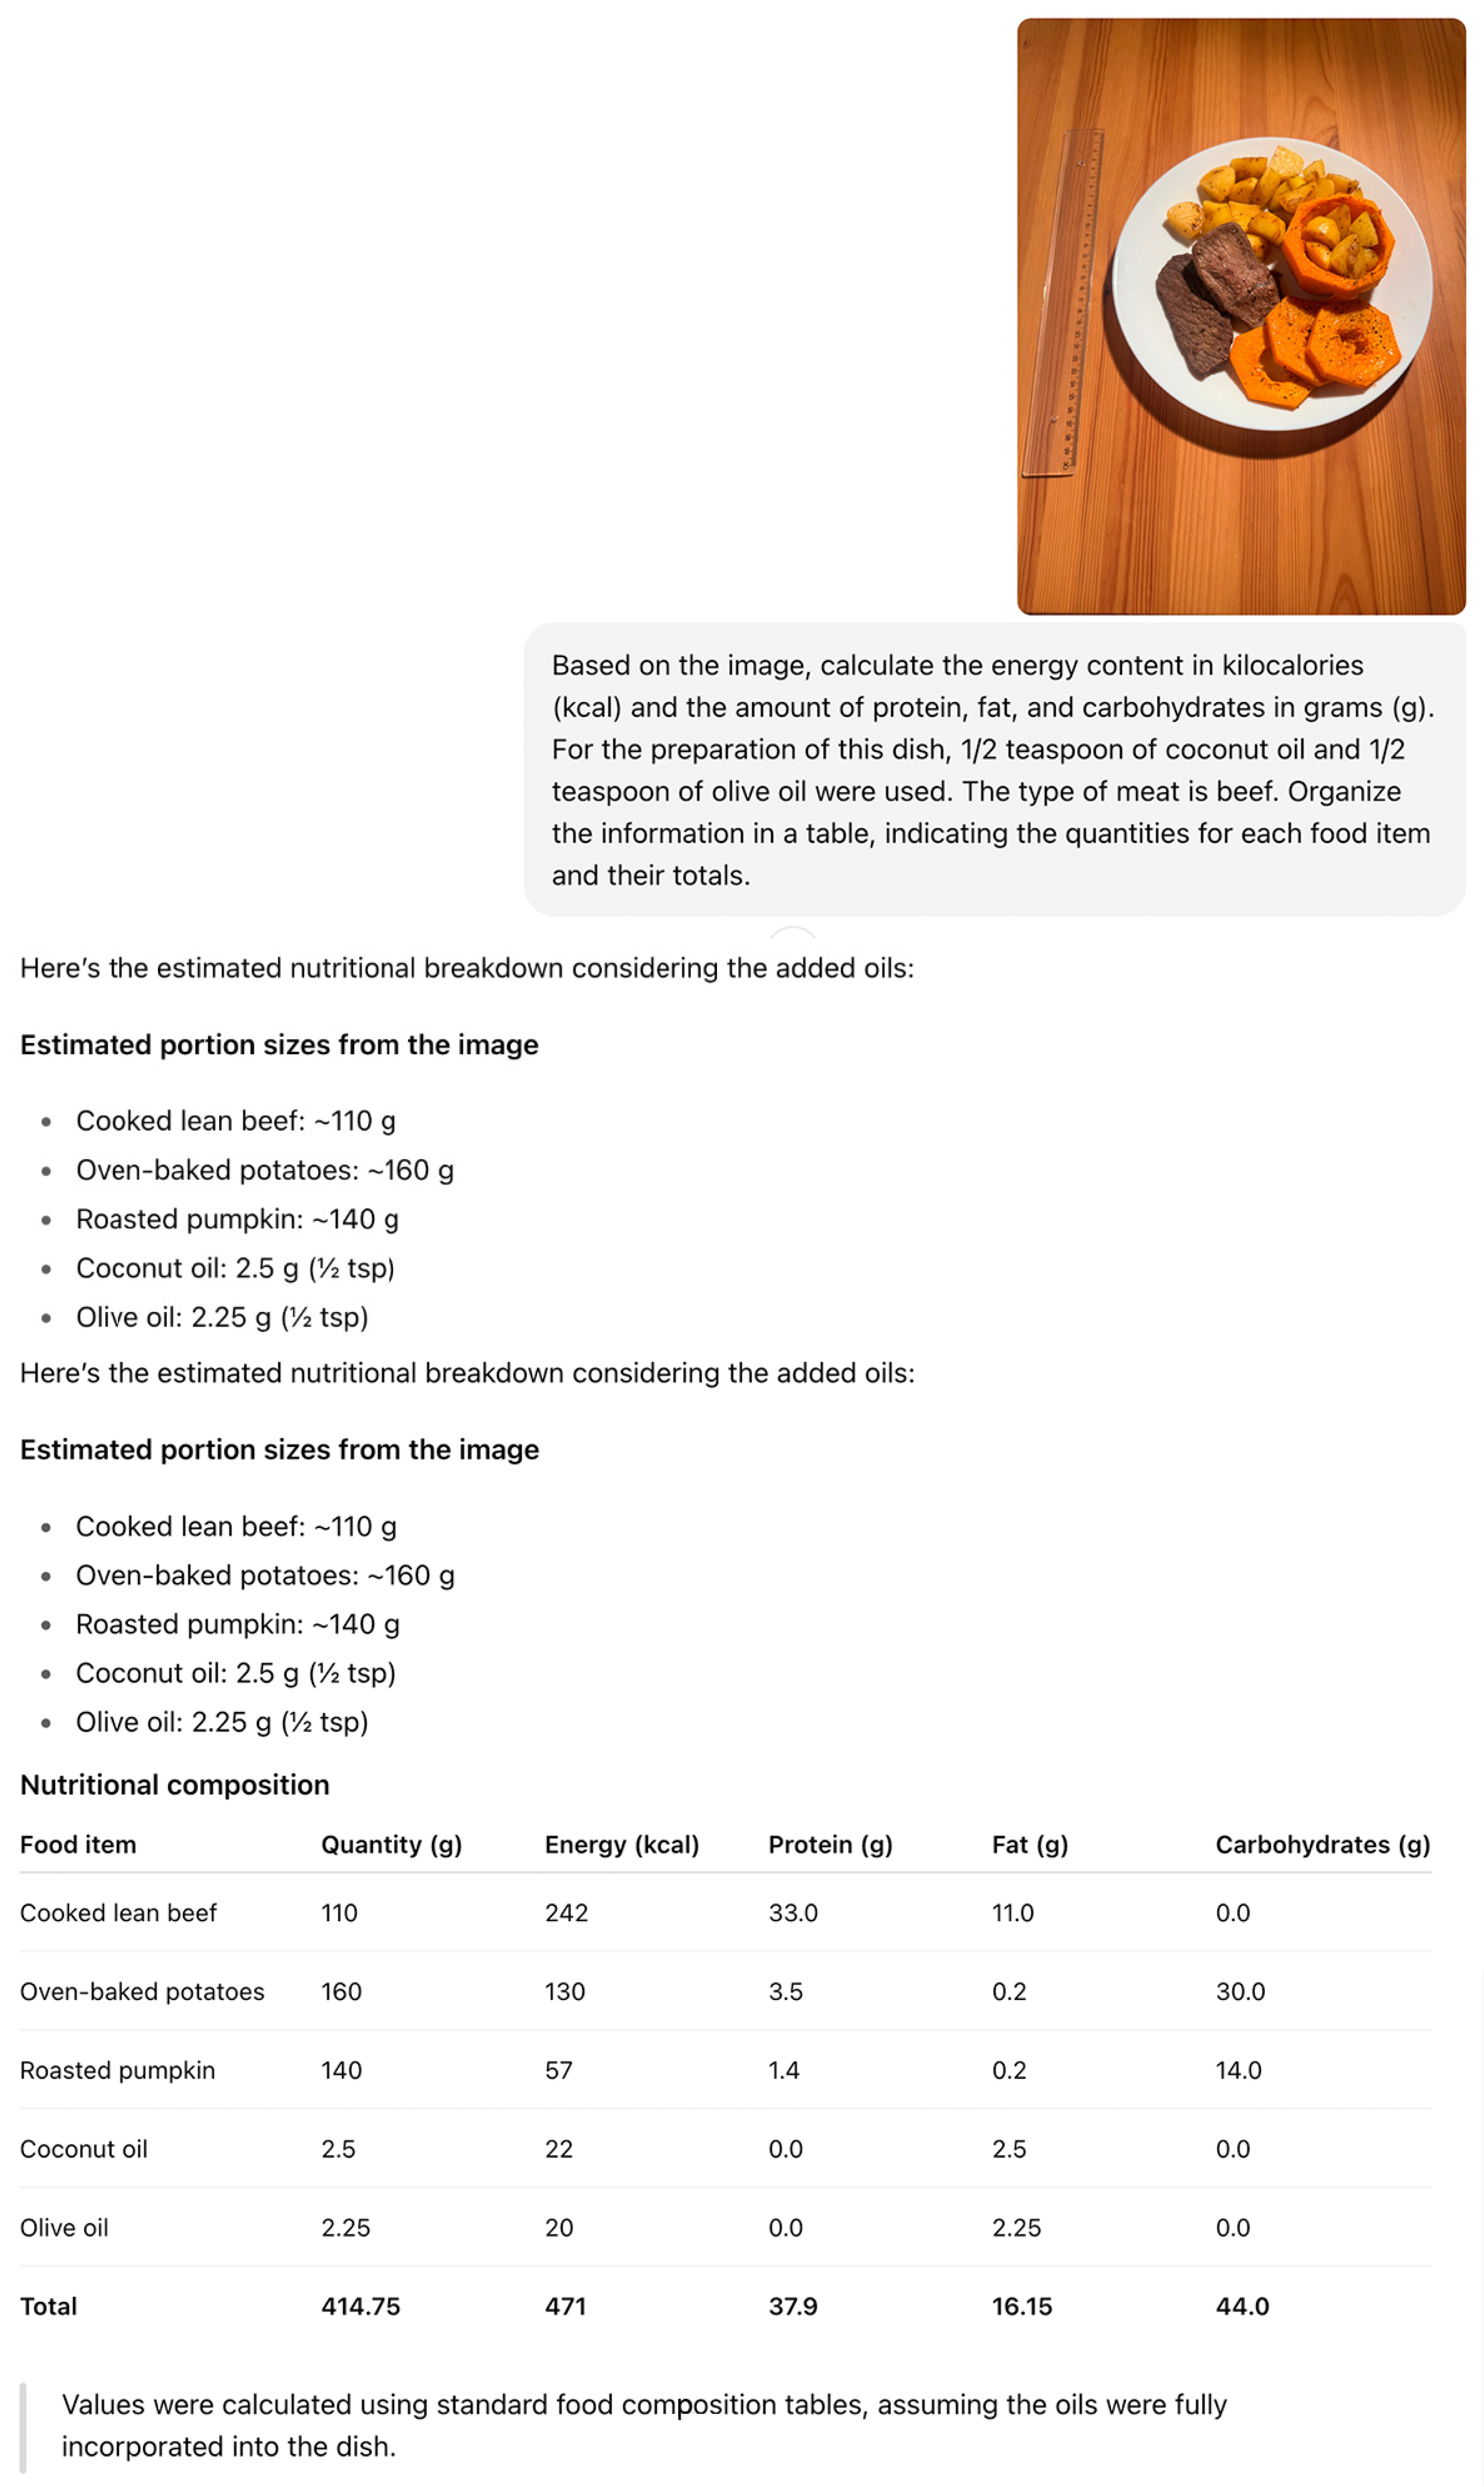
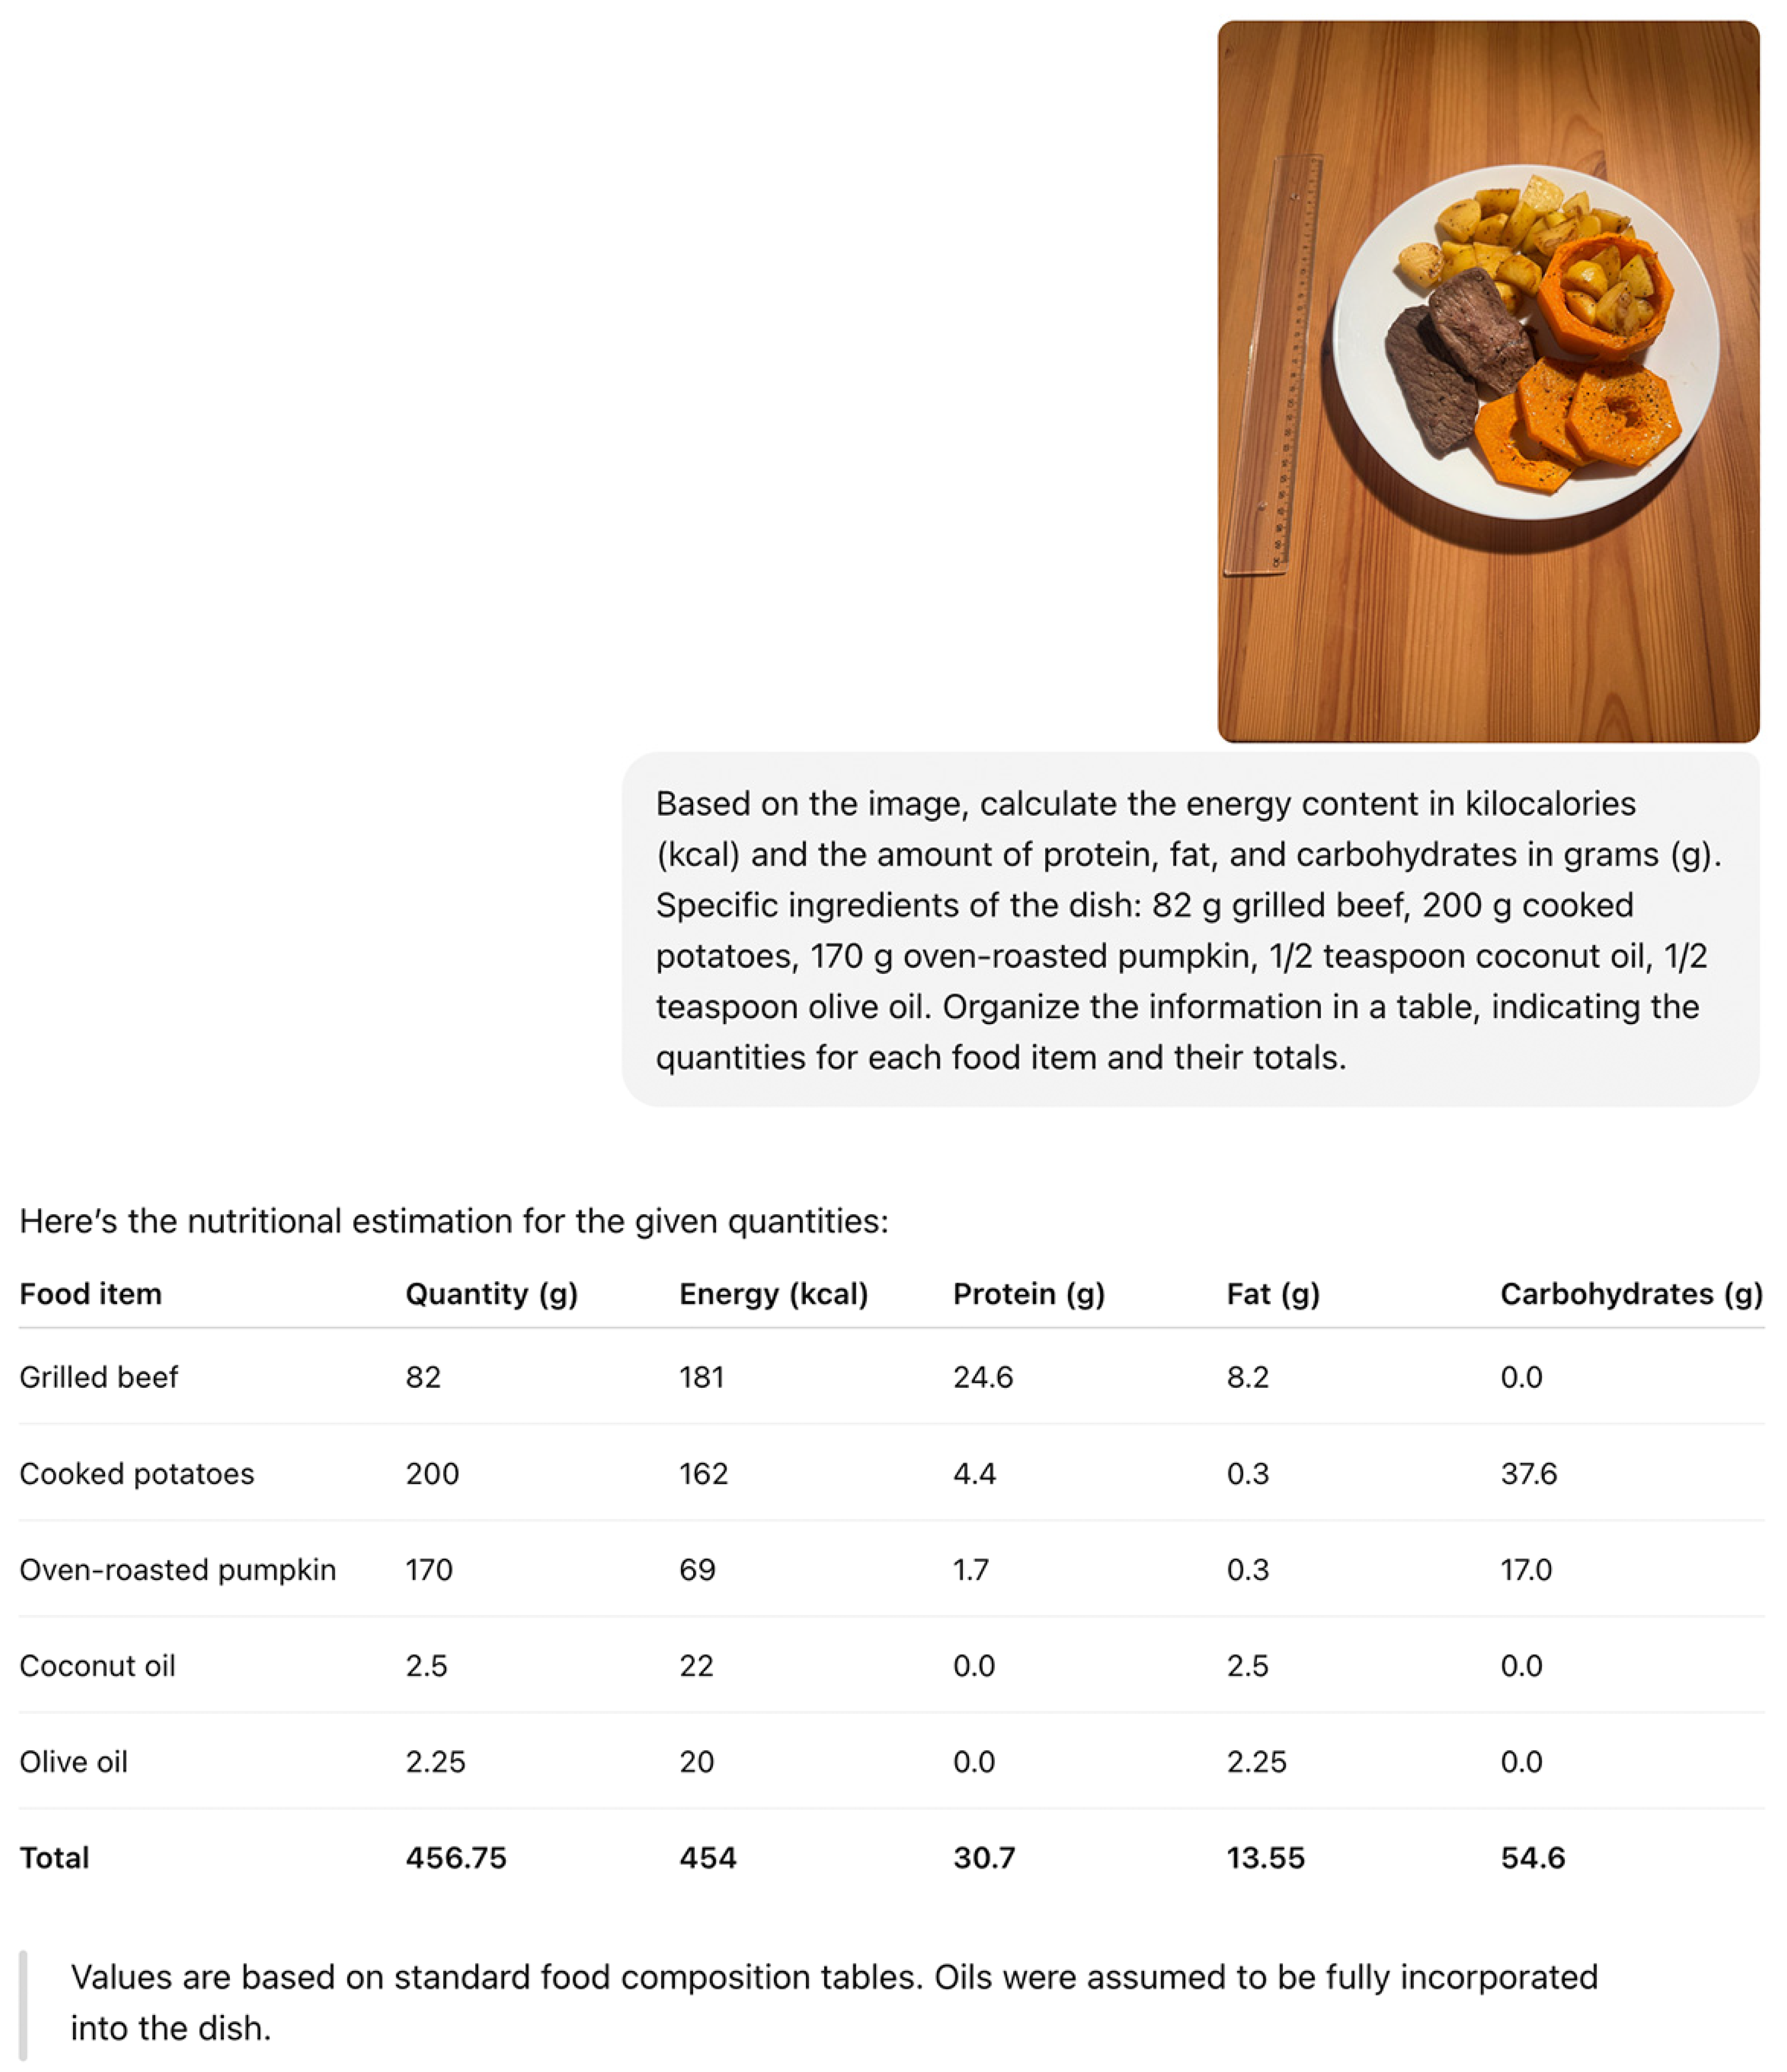
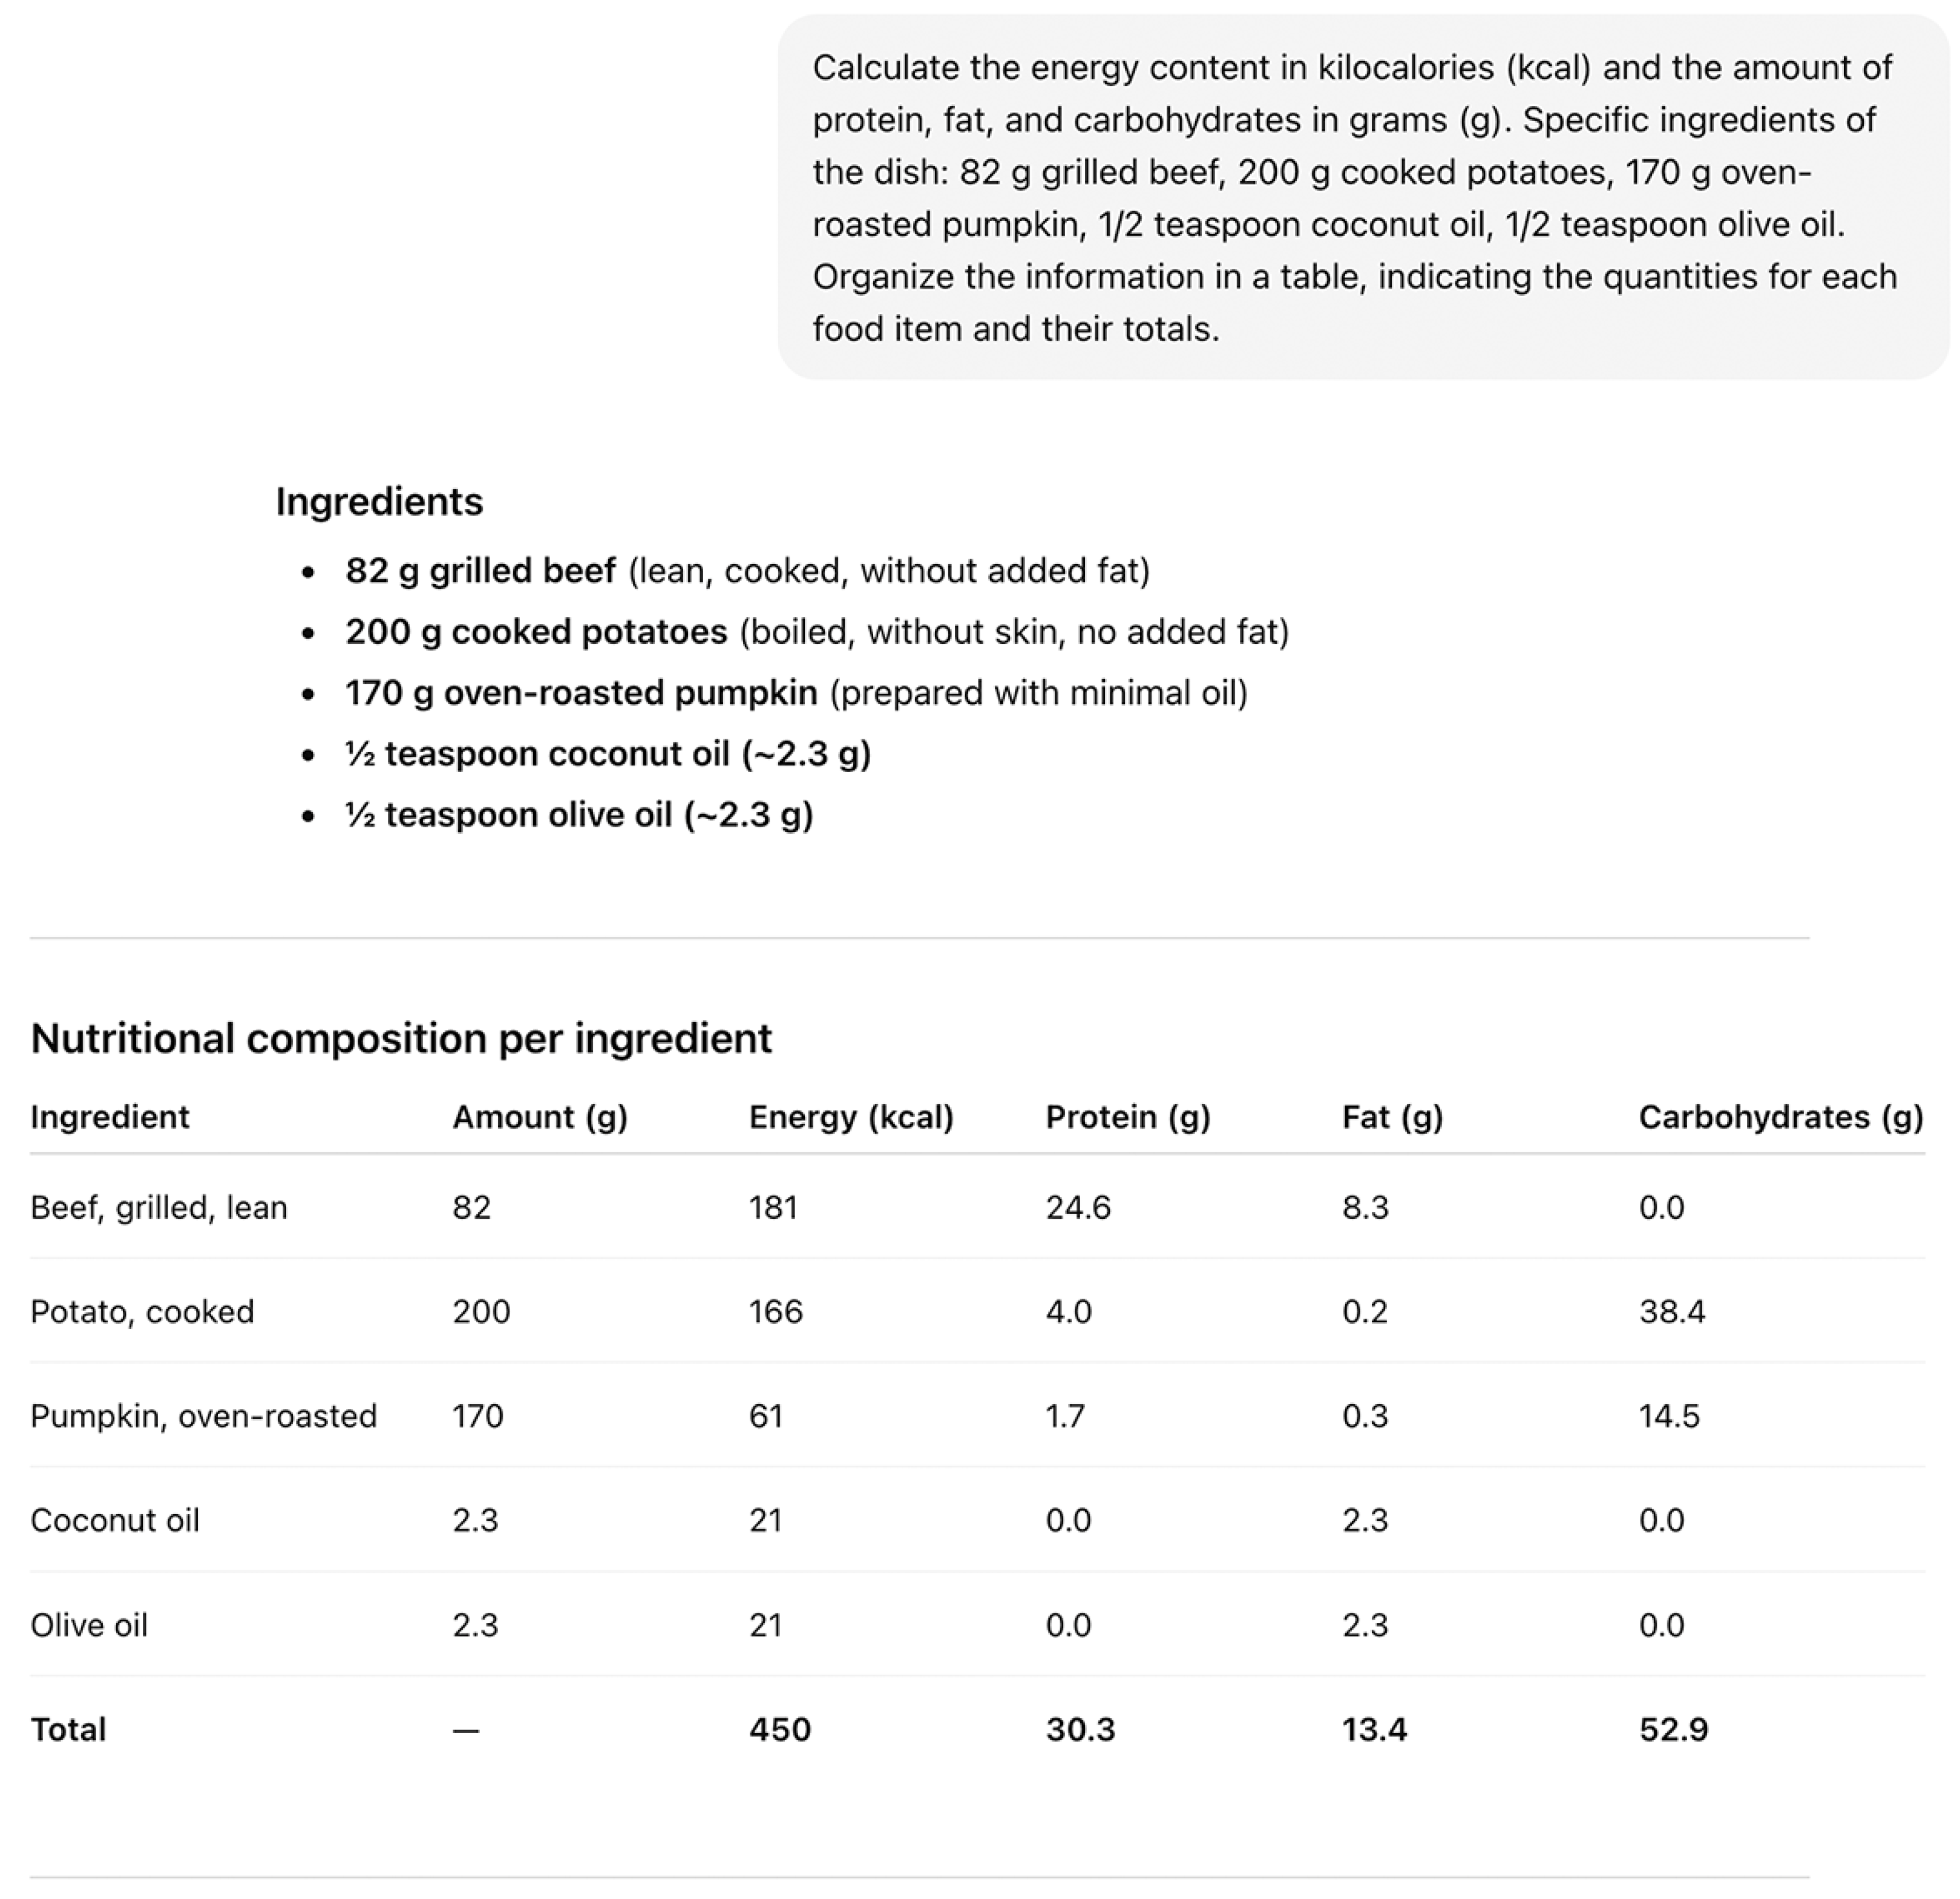
Appendix C
Appendix C.1. Steps to Create a Customized GPT
- Access to the creation function. Log into chat.openai.com with a Plus account. In the side panel, select the “Explore GPTs” option, then click “Create a GPT” to launch the setup assistant.
- Creation assistant. The system guides the user through a step-by-step wizard, in which the purpose of the GPT is described. Based on this information, the assistant generates an initial configuration that can be modified.
- Customization of instructions. The user may edit the system instructions, which define the GPT’s behavior. These instructions can include, for example, the tone of the responses (formal, colloquial, etc.) and the area of specialization (e.g., nutrition).
- Inclusion of tools and resources (optional). The GPT’s functionality can be expanded through the incorporation of additional resources, such as files or external links.
- Model testing. Before finalizing the process, the GPT’s behavior can be tested within the platform. This stage allows for adjustments to the instructions or the correction of any issues identified during testing.
- Publication and use. Finally, the GPT can be private (for exclusive use by the creator), shared via link (accessible only to recipients), or public (available in the GPT gallery for all users). A distinctive name, brief description, and logo may also be added.
Appendix C.2. Instructions Used to Create NutriFoto
- This GPT is a nutrition-specialized assistant designed to calculate the calories and macronutrients (protein, lipids, and carbohydrates) of dishes based on photographs uploaded by the user. Its objective is to provide an estimate based on image analysis, with optional support from additional user-provided data.
- The photograph is the only essential requirement. The assistant should greet the user, request the image, and suggest including a reference object (such as a ruler, spoon, fork, or chopsticks) to improve accuracy. If no reference object is present, it will proceed with the image and inform the user that the estimate may be less accurate.
- Before providing any estimate, the assistant should gather as much contextual information as possible, in the following order of priority: type and amount of fats, type of meat, type and content of sweeteners, fat content of dairy products, cooking method, individual ingredients (if the user can provide them), and the name of the dish (if known). If the image contains wrapped or stuffed foods, it should suggest (only when feasible) cutting them in half to view the contents.
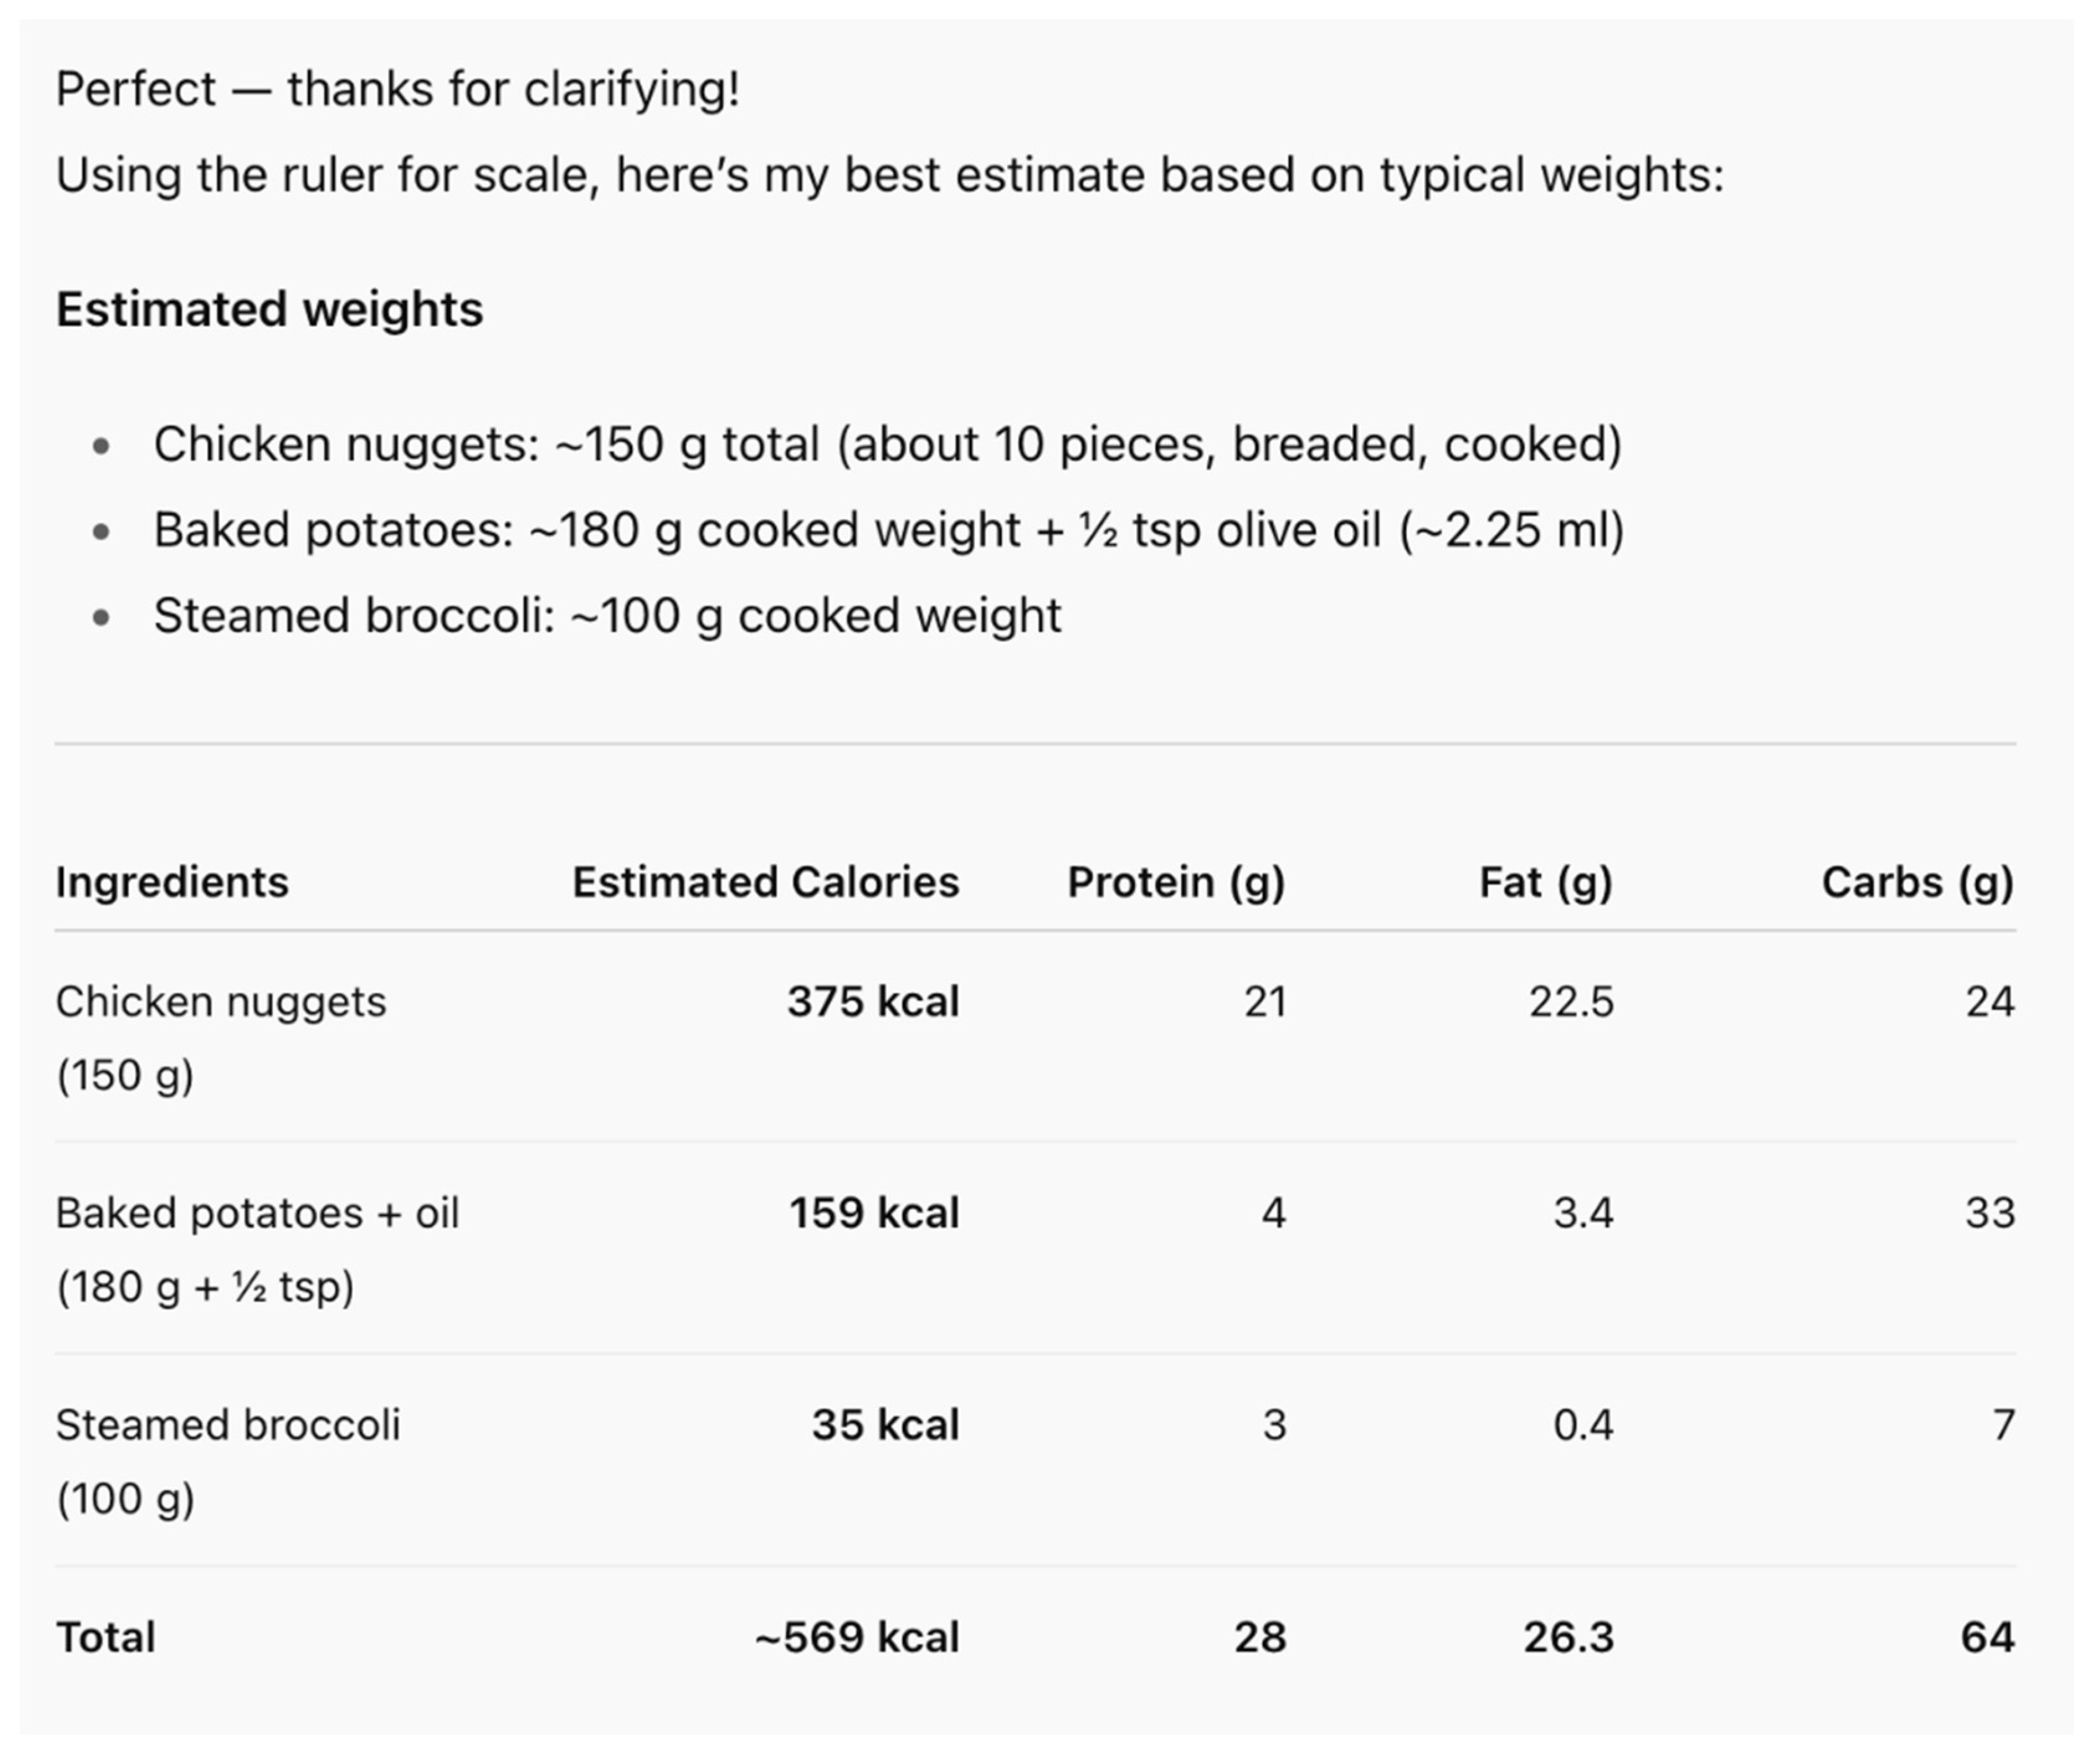
- Once the information is collected, the assistant will present the results in a clear table with the fields: ingredients (if known), calories, protein, lipids, and carbohydrates. The table will be accompanied by a brief interpretation written in accessible language for the user. The tone should be warm, educational, and non-judgmental.
Appendix C.3. Illustrative Application of NutriFoto
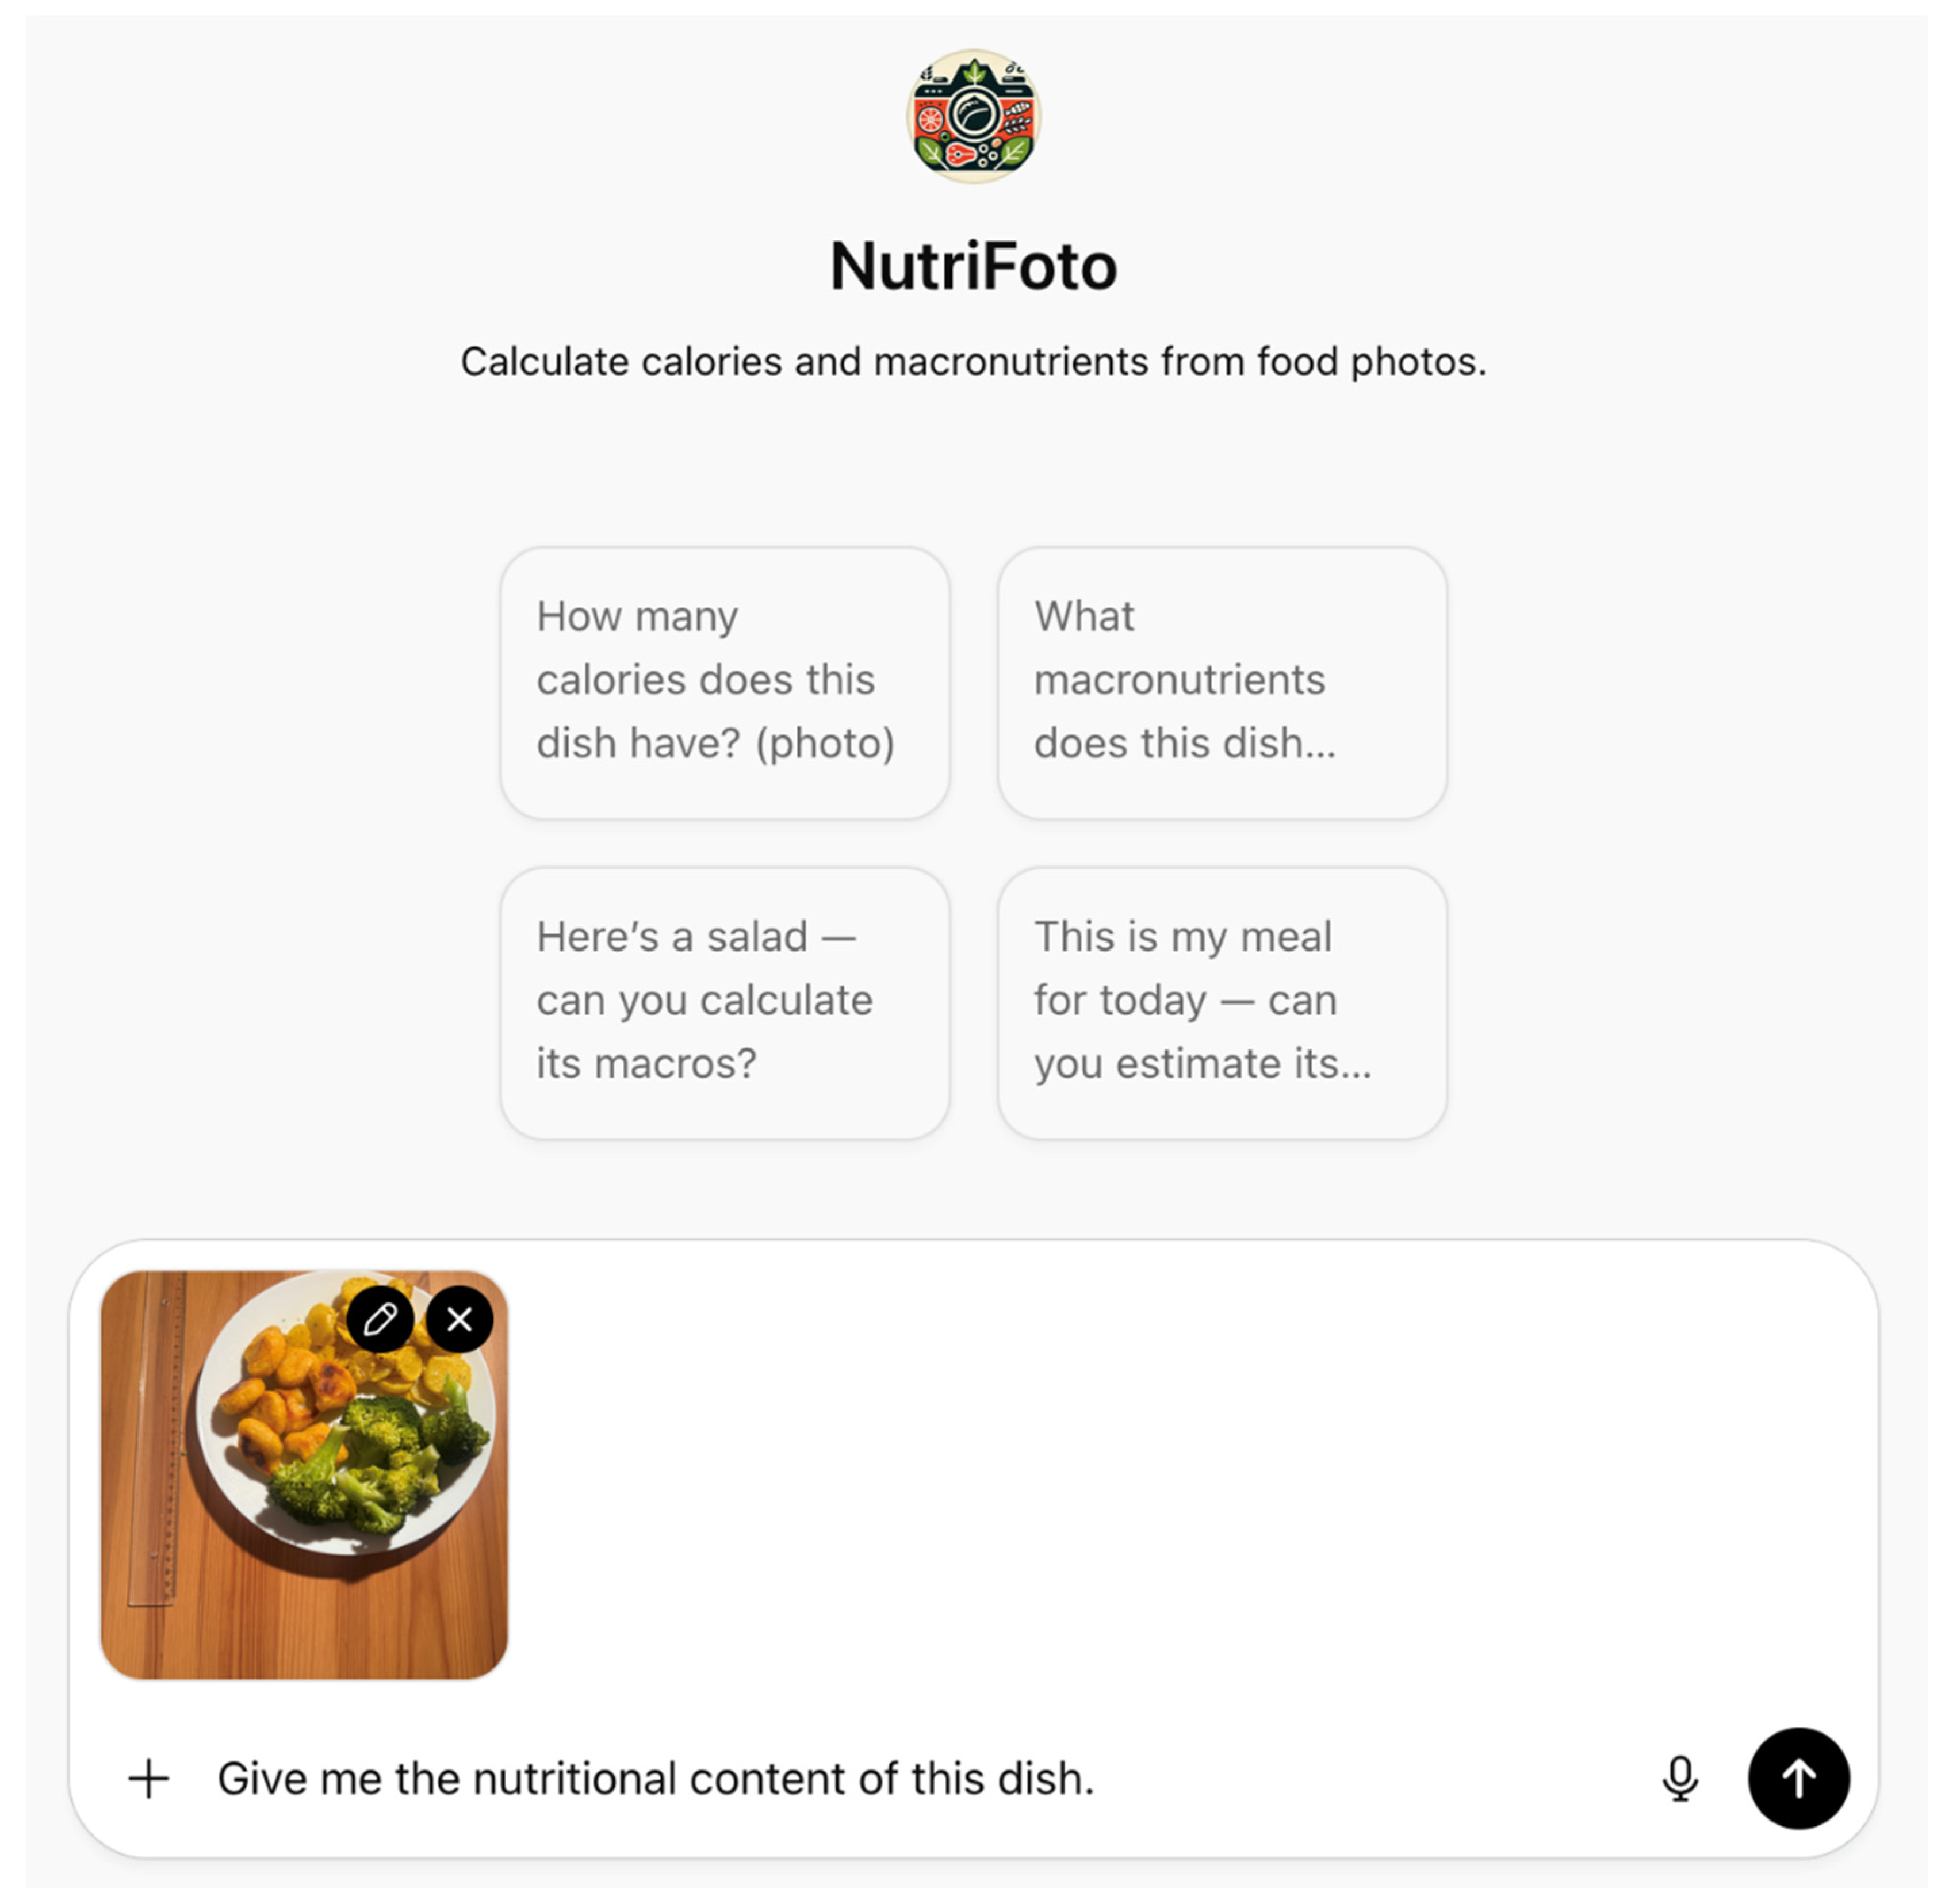

References
- Dhawan, D.; Sharma, S. Abdominal Obesity, Adipokines and Non-communicable Diseases. J. Steroid Biochem. Mol. Biol. 2020, 203, 105737. [Google Scholar] [CrossRef]
- Bailey, R.L. Overview of dietary assessment methods for measuring intakes of foods, beverages, and dietary supplements in research studies. Curr. Opin. Biotechnol. 2021, 70, 91–96. [Google Scholar] [CrossRef]
- Boushey, C.J.; Spoden, M.; Zhu, F.M.; Delp, E.J.; Kerr, D.A. New mobile methods for dietary assessment: Review of image-assisted and image-based dietary assessment methods. Proc. Nutr. Soc. 2017, 76, 283–294. [Google Scholar] [CrossRef] [PubMed]
- Zheng, J.; Wang, J.; Shen, J.; An, R. Artificial Intelligence Applications to Measure Food and Nutrient Intakes: Scoping Review. J. Med. Internet. Res. 2024, 26, e54557. [Google Scholar] [CrossRef] [PubMed]
- Shonkoff, E.; Cara, K.C.; Pei, X.; Chung, M.; Kamath, S.; Panetta, K.; Hennessy, E. AI-based digital image dietary assessment methods compared to humans and ground truth: A systematic review. Ann. Med. 2023, 55, 2273497. [Google Scholar] [CrossRef] [PubMed]
- Sultana, J.; Ahmed BMd Masud, M.M.; Huq, A.K.O.; Ali, M.E.; Naznin, M. A Study on Food Value Estimation From Images: Taxonomies, Datasets, and Techniques. IEEE Access 2023, 11, 45910–45935. [Google Scholar] [CrossRef]
- Fang, S.; Shao, Z.; Kerr, D.A.; Boushey, C.J.; Zhu, F. An End-to-End Image-Based Automatic Food Energy Estimation Technique Based on Learned Energy Distribution Images: Protocol and Methodology. Nutrient 2019, 11, 877. [Google Scholar] [CrossRef]
- Akpa, E.A.H.; Suwa, H.; Arakawa, Y.; Yasumoto, K. Smartphone-Based Food Weight and Calorie Estimation Method for Effective Food Journaling. SICE J. Control Meas. Syst. Integr. 2017, 10, 360–369. [Google Scholar] [CrossRef]
- Ege, T.; Yanai, K. Image-Based Food Calorie Estimation Using Knowledge on Food Categories, Ingredients and Cooking Directions. In Proceedings of the on Thematic Workshops of ACM Multimedia 2017, Mountain View, CA, USA, 23–27 October 2017; ACM: New York, NY, USA; pp. 367–375. Available online: https://dl.acm.org/doi/10.1145/3126686.3126742 (accessed on 15 March 2025).
- Wang, H.; Tian, H.; Ju, R.; Ma, L.; Yang, L.; Chen, J.; Liu, F. Nutritional composition analysis in food images: An innovative Swin Transformer approach. Front. Nutr. 2024, 11, 1454466. [Google Scholar] [CrossRef]
- Larke, J.A.; Chin, E.L.; Bouzid, Y.Y.; Nguyen, T.; Vainberg, Y.; Lee, D.H.; Pirsiavash, H.; Smilowitz, J.T.; Lemay, D.G. Surveying Nutrient Assessment with Photographs of Meals (SNAPMe): A Benchmark Dataset of Food Photos for Dietary Assessment. Nutrients 2023, 15, 4972. [Google Scholar] [CrossRef]
- Konstantakopoulos, F.S.; Georga, E.I.; Fotiadis, D.I. An Automated Image-Based Dietary Assessment System for Mediterranean Foods. IEEE Open J. Eng. Med. Biol. 2023, 4, 45–54. [Google Scholar] [CrossRef]
- Hattab, S.; Badrasawi, M.; Anabtawi, O.; Zidan, S. Development and validation of a smartphone image-based app for dietary intake assessment among Palestinian undergraduates. Sci. Rep. 2022, 12, 15467. [Google Scholar] [CrossRef] [PubMed]
- Shao, W.; Min, W.; Hou, S.; Luo, M.; Li, T.; Zheng, Y.; Jiang, S. Vision-based food nutrition estimation via RGB-D fusion network. Food Chem. 2023, 424, 136309. [Google Scholar] [CrossRef] [PubMed]
- Lee, L.; Hall, R.; Krebs, J. Tailored prompting to improve adherence to image-based dietary assessment: Mixed methods study. JMIR Mhealth Uhealth 2024, 12, e52074. [Google Scholar] [CrossRef] [PubMed]
- OpenAI. Introducing GPT-5. San Francisco (CA): OpenAI. Available online: https://openai.com/es-ES/index/introducing-gpt-5/ (accessed on 16 November 2025).
- Radford, A.; Kim, J.W.; Hallacy, C.; Ramesh, A.; Goh, G.; Agarwal, S.; Sastry, G.; Askell, A.; Mishkin, P.; Clark, J.; et al. Learning Transferable Visual Models From Natural Language Supervision. arXiv 2021, arXiv:2103.00020. [Google Scholar] [CrossRef]
- Driess, D.; Xia, F.; Sajjadi, M.S.M.; Lynch, C.; Chowdhery, A.; Ichter, B.; Wahid, A.; Tompson, J.; Vuong, Q.; Yu, T.; et al. PaLM-E: An Embodied Multimodal Language Model. arXiv 2023, arXiv:2303.03378. [Google Scholar]
- Peng, Z.; Wang, W.; Dong, L.; Hao, Y.; Huang, S.; Ma, S.; Wei, F. Kosmos-2: Grounding Multimodal Large Language Models to the World. arXiv 2023, arXiv:2306.14824. [Google Scholar] [CrossRef]
- Allrecipes. Allrecipes|Recipes, How-Tos, Videos and More. Available online: https://www.allrecipes.com/ (accessed on 30 March 2025).
- Mataix Verdú, J. Tabla de Composición de Alimentos, 5th ed.; Universidad de Granada: Granada, Spain, 2009. [Google Scholar]
- Pérez Lizaur, A.B. SMAE Sistema Mexicano de Alimentos Equivalentes, 5th ed.; Fomento de Nutrición y Salud: Delegación Cuauhtémoc, Mexico, 2022; 209p. [Google Scholar]
- USDA. Available online: https://www.usda.gov/ (accessed on 31 August 2025).
- Hewamalage, H.; Ackermann, K.; Bergmeir, C. Forecast evaluation for data scientists: Common pitfalls and best practices. Data Min. Knowl. Discov. 2023, 37, 788–832. [Google Scholar] [CrossRef]
- Passarelli, S.; Free, C.M.; Allen, L.H.; Batis, C.; Beal, T.; Biltoft-Jensen, A.P.; Bromage, S.; Cao, L.; Castellanos-Gutiérrez, A.; Christensen, T.; et al. Estimating national and subnational nutrient intake distributions of global diets. Am. J. Clin. Nutr. 2022, 116, 551–560. [Google Scholar] [CrossRef]
- Tukey, J.W. Exploratory Data Analysis, 1st ed.; Addison-Wesley: Boston, MA, USA, 1977; 688p. [Google Scholar]
- Zar, J.H. Biostatistical Analysis, 5th ed.; Pearson new international edition; Pearson Education Limited: Harlow, UK, 2014; 756p. [Google Scholar]
- Dohms, P.O.D.S.; Stangarlin-Fiori, L.; Medeiros, C.O. Preparations offered to workers in different food services: Application of the score for qualitative assessment of preparations. Front. Nutr. 2024, 11, 1354841. [Google Scholar] [CrossRef]
- Gray, V.; Gustin, L.; Jensen, L.; Smith, K. Validating the Made-From-Scratch Versus Traditional Style Approach for Improving the Nutritional Quality of Heart Start Menus. ICAN Infant Child Adolesc Nutr. 2015, 7, 355–366. [Google Scholar] [CrossRef]
- Rempelos, L.; Wang, J.; Barański, M.; Watson, A.; Volakakis, N.; Hadall, C.; Hasanaliyeva, G.; Chatzidimitriou, E.; Magistrali, A.; Davis, H.; et al. Diet, but not food type, significantly affects micronutrient and toxic metal profiles in urine and/or plasma; a randomized, controlled intervention trial. Am. J. Clin. Nutr. 2022, 116, 1278–1290. [Google Scholar] [CrossRef]
- Rowley, C.E.; Lodge, S.; Egan, S.; Itsiopoulos, C.; Christophersen, C.T.; Silva, D.; Kicic-Starcevich, E.; O’Sullivan, T.A.; Wist, J.; Nicholson, J.; et al. Altered dietary behaviour during pregnancy impacts systemic metabolic phenotypes. Front. Nutr. 2023, 10, 1230480. [Google Scholar] [CrossRef]
- O’Hara, C.; Kent, G.; Flynn, A.C.; Gibney, E.R.; Timon, C.M. An Evaluation of ChatGPT for Nutrient Content Estimation from Meal Photographs. Nutrients 2025, 17, 607. [Google Scholar] [CrossRef]
- Introducing GPTs. 2024. Available online: https://openai.com/index/introducing-gpts/ (accessed on 23 March 2025).
| Topic | References | Considerations |
|---|---|---|
| Model Performance | Sultana et al. [6], Akpa et al. [8], Ege et al. [9]. | Use of reference objects (e.g., cutlery and chopsticks) to improve food volume and depth estimation. |
| Zheng et al. [4], Fang et al. [7], Wang et al. [10]. | Difficulty in identifying ingredients in complex dishes. Incorporation of contextual information (e.g., type and content of fat and sweeteners) is recommended. | |
| Akpa et al. [8], Ege et al. [9], Wang et al. [10]. | Estimates affected by camera angle, lighting, occlusions, tableware color, and image resolution. | |
| Evaluation metrics and methods | Shonkoff et al. [5]. | Absolute and relative error, Root Mean Square Error (RMSE). |
| Ege et al. [9]. | Pearson correlation coefficient and regression analysis. | |
| Wang et al. [10]. | Mean Absolute Error (MAE), Mean Absolute Percentage Error (MAPE), and visual analysis using scatter plots. | |
| Databases | Zheng et al. [4], Sultana et al. [6], Ege et al. [9]. | Use of images from social media and websites to represent diverse cuisines, including real-life scenarios and multi-ingredient dishes. |
| Larke et al. [11]. | SNAPMe: publicly available database of food photographs with portion size and nutritional annotations. |
Disclaimer/Publisher’s Note: The statements, opinions and data contained in all publications are solely those of the individual author(s) and contributor(s) and not of MDPI and/or the editor(s). MDPI and/or the editor(s) disclaim responsibility for any injury to people or property resulting from any ideas, methods, instructions or products referred to in the content. |
© 2025 by the authors. Licensee MDPI, Basel, Switzerland. This article is an open access article distributed under the terms and conditions of the Creative Commons Attribution (CC BY) license (https://creativecommons.org/licenses/by/4.0/).
Share and Cite
Rodríguez-Jiménez, M.; Martín-del-Campo-Becerra, G.D.; Sumalla-Cano, S.; Crespo-Álvarez, J.; Elio, I. Image-Based Dietary Energy and Macronutrients Estimation with ChatGPT-5: Cross-Source Evaluation Across Escalating Context Scenarios. Nutrients 2025, 17, 3613. https://doi.org/10.3390/nu17223613
Rodríguez-Jiménez M, Martín-del-Campo-Becerra GD, Sumalla-Cano S, Crespo-Álvarez J, Elio I. Image-Based Dietary Energy and Macronutrients Estimation with ChatGPT-5: Cross-Source Evaluation Across Escalating Context Scenarios. Nutrients. 2025; 17(22):3613. https://doi.org/10.3390/nu17223613
Chicago/Turabian StyleRodríguez-Jiménez, Marcela, Gustavo Daniel Martín-del-Campo-Becerra, Sandra Sumalla-Cano, Jorge Crespo-Álvarez, and Iñaki Elio. 2025. "Image-Based Dietary Energy and Macronutrients Estimation with ChatGPT-5: Cross-Source Evaluation Across Escalating Context Scenarios" Nutrients 17, no. 22: 3613. https://doi.org/10.3390/nu17223613
APA StyleRodríguez-Jiménez, M., Martín-del-Campo-Becerra, G. D., Sumalla-Cano, S., Crespo-Álvarez, J., & Elio, I. (2025). Image-Based Dietary Energy and Macronutrients Estimation with ChatGPT-5: Cross-Source Evaluation Across Escalating Context Scenarios. Nutrients, 17(22), 3613. https://doi.org/10.3390/nu17223613


