Association Between Dietary Acid Load and Excess Weight in Adults: A Cross-Sectional Study
Abstract
1. Introduction
2. Materials and Methods
2.1. Data Acquisition and Subjects
2.2. Definition of EW
2.3. Dietary Acid Load Estimations
2.4. Other Variables
2.5. Statistical Analysis
3. Results
3.1. Subject Characteristics
3.2. Association Between DAL and EW Risk
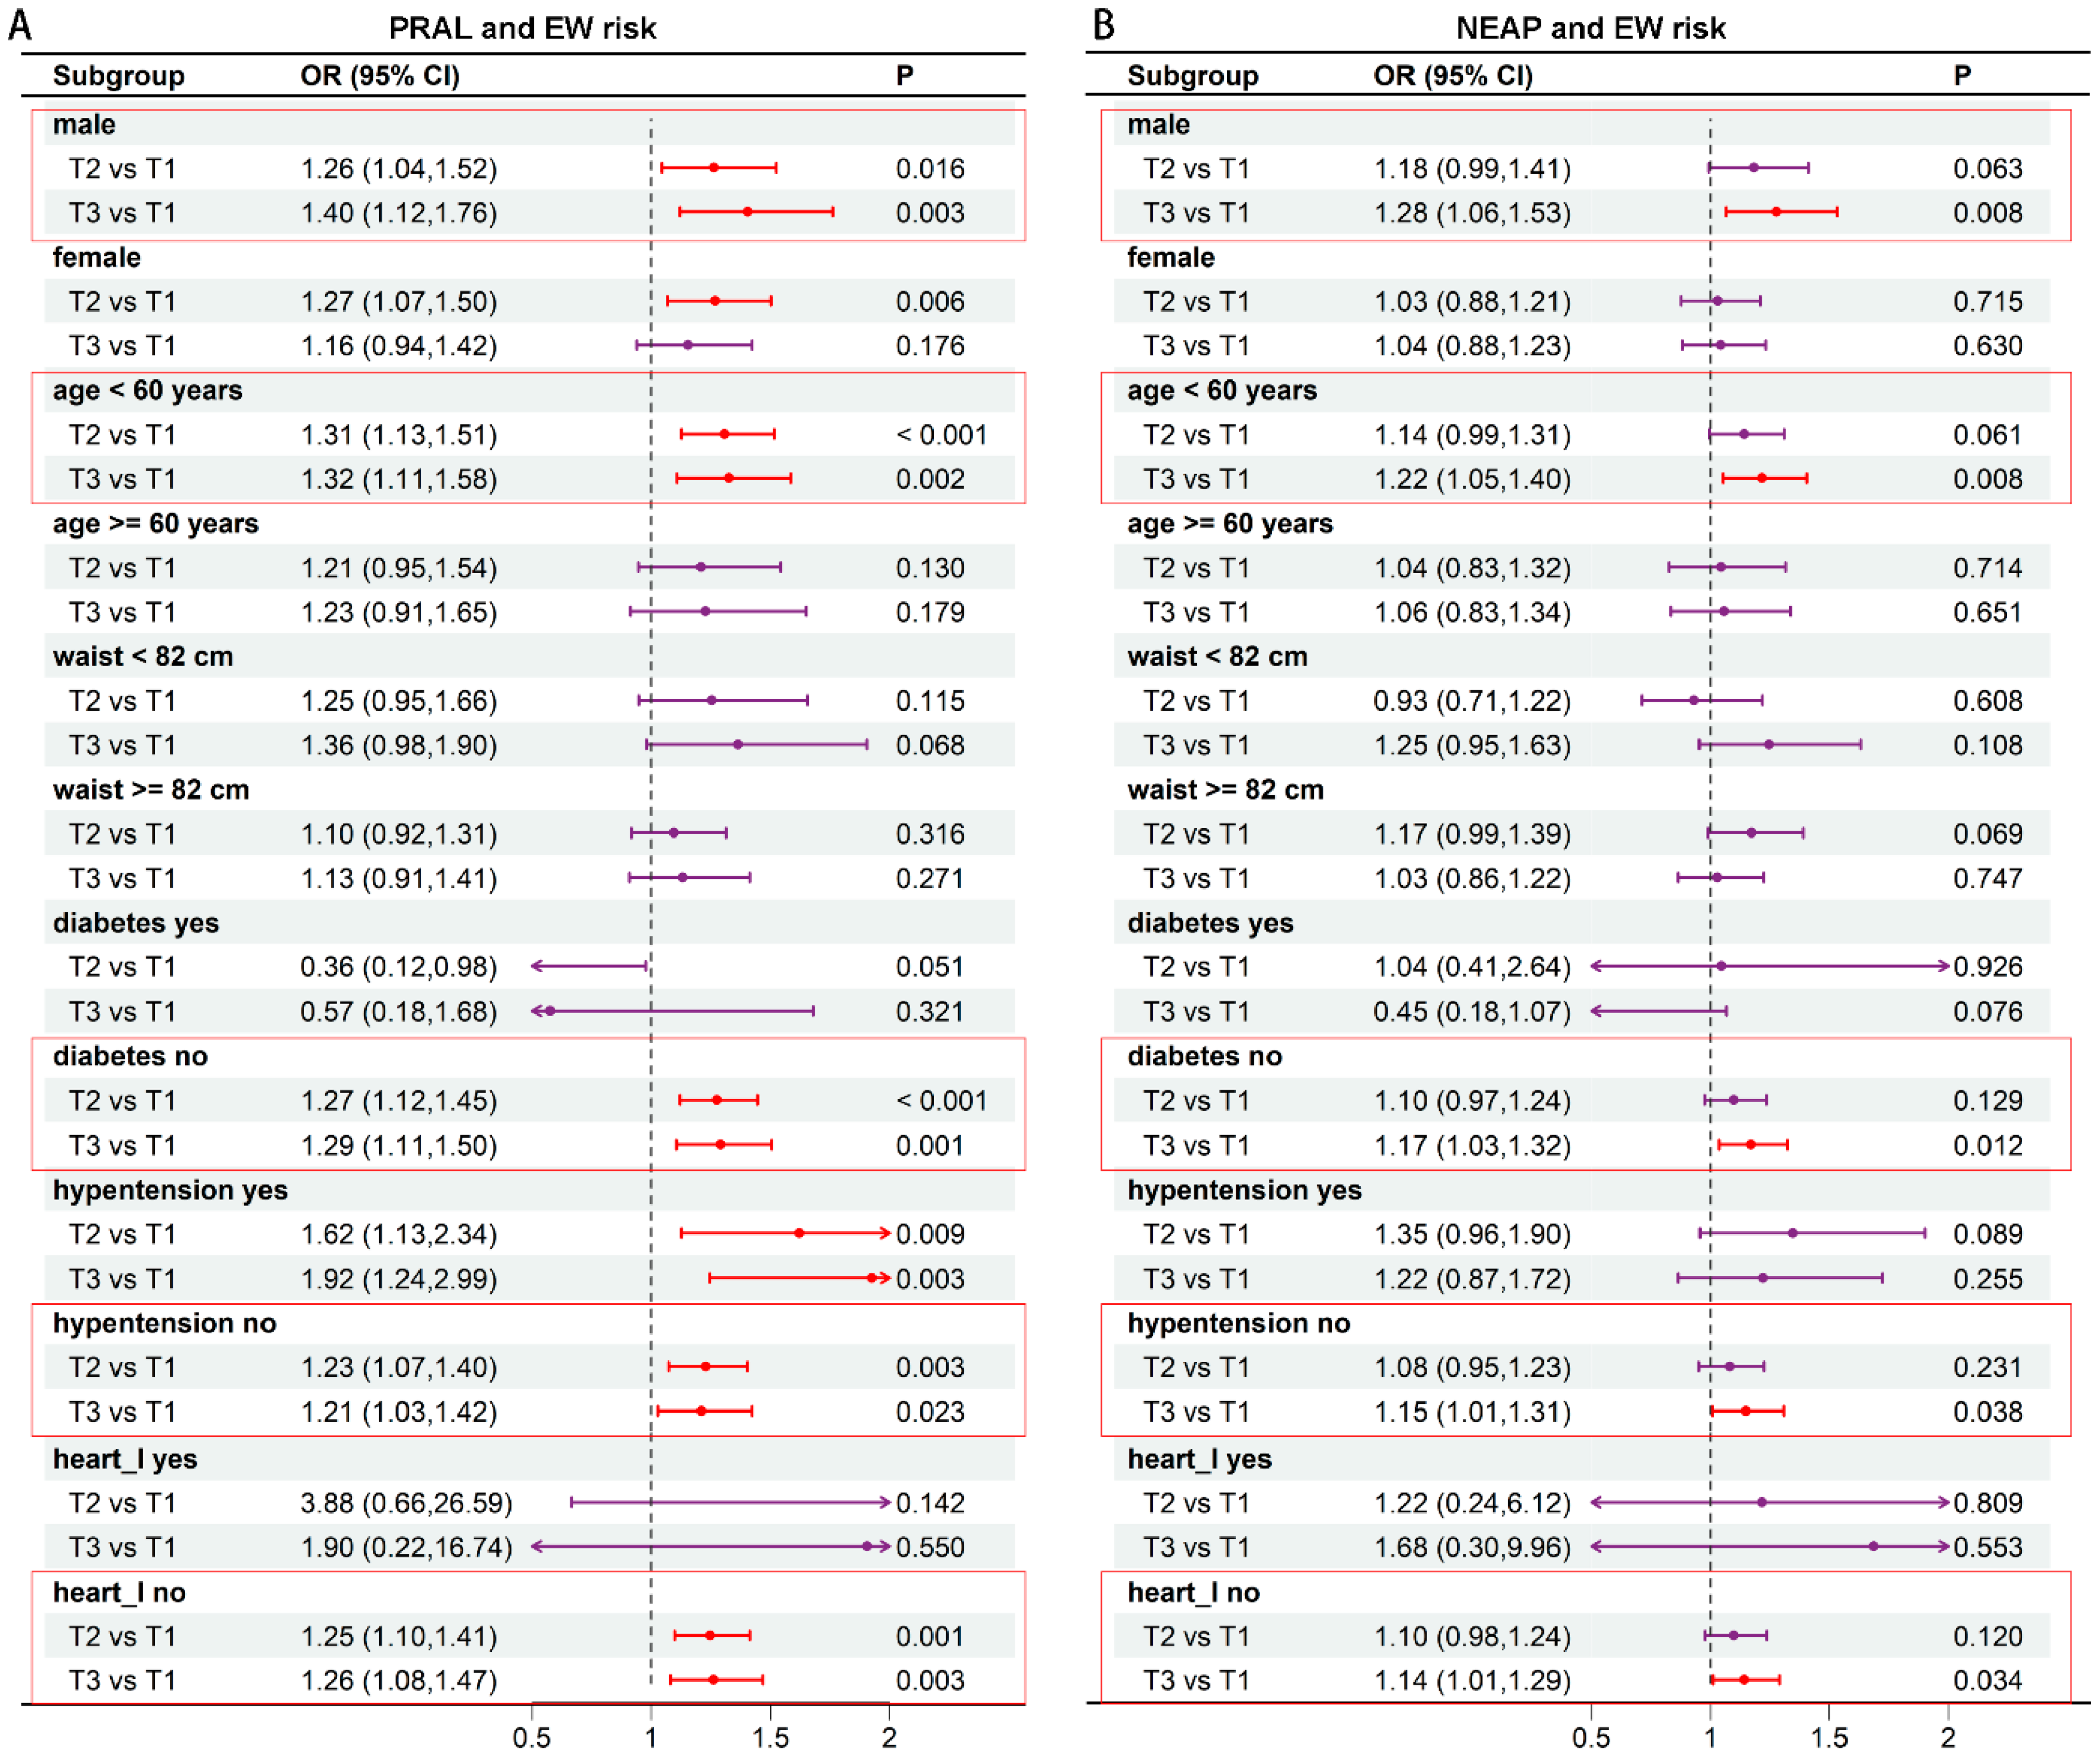
3.3. Subgroup Analysis of the Correlation Between DAL and EW
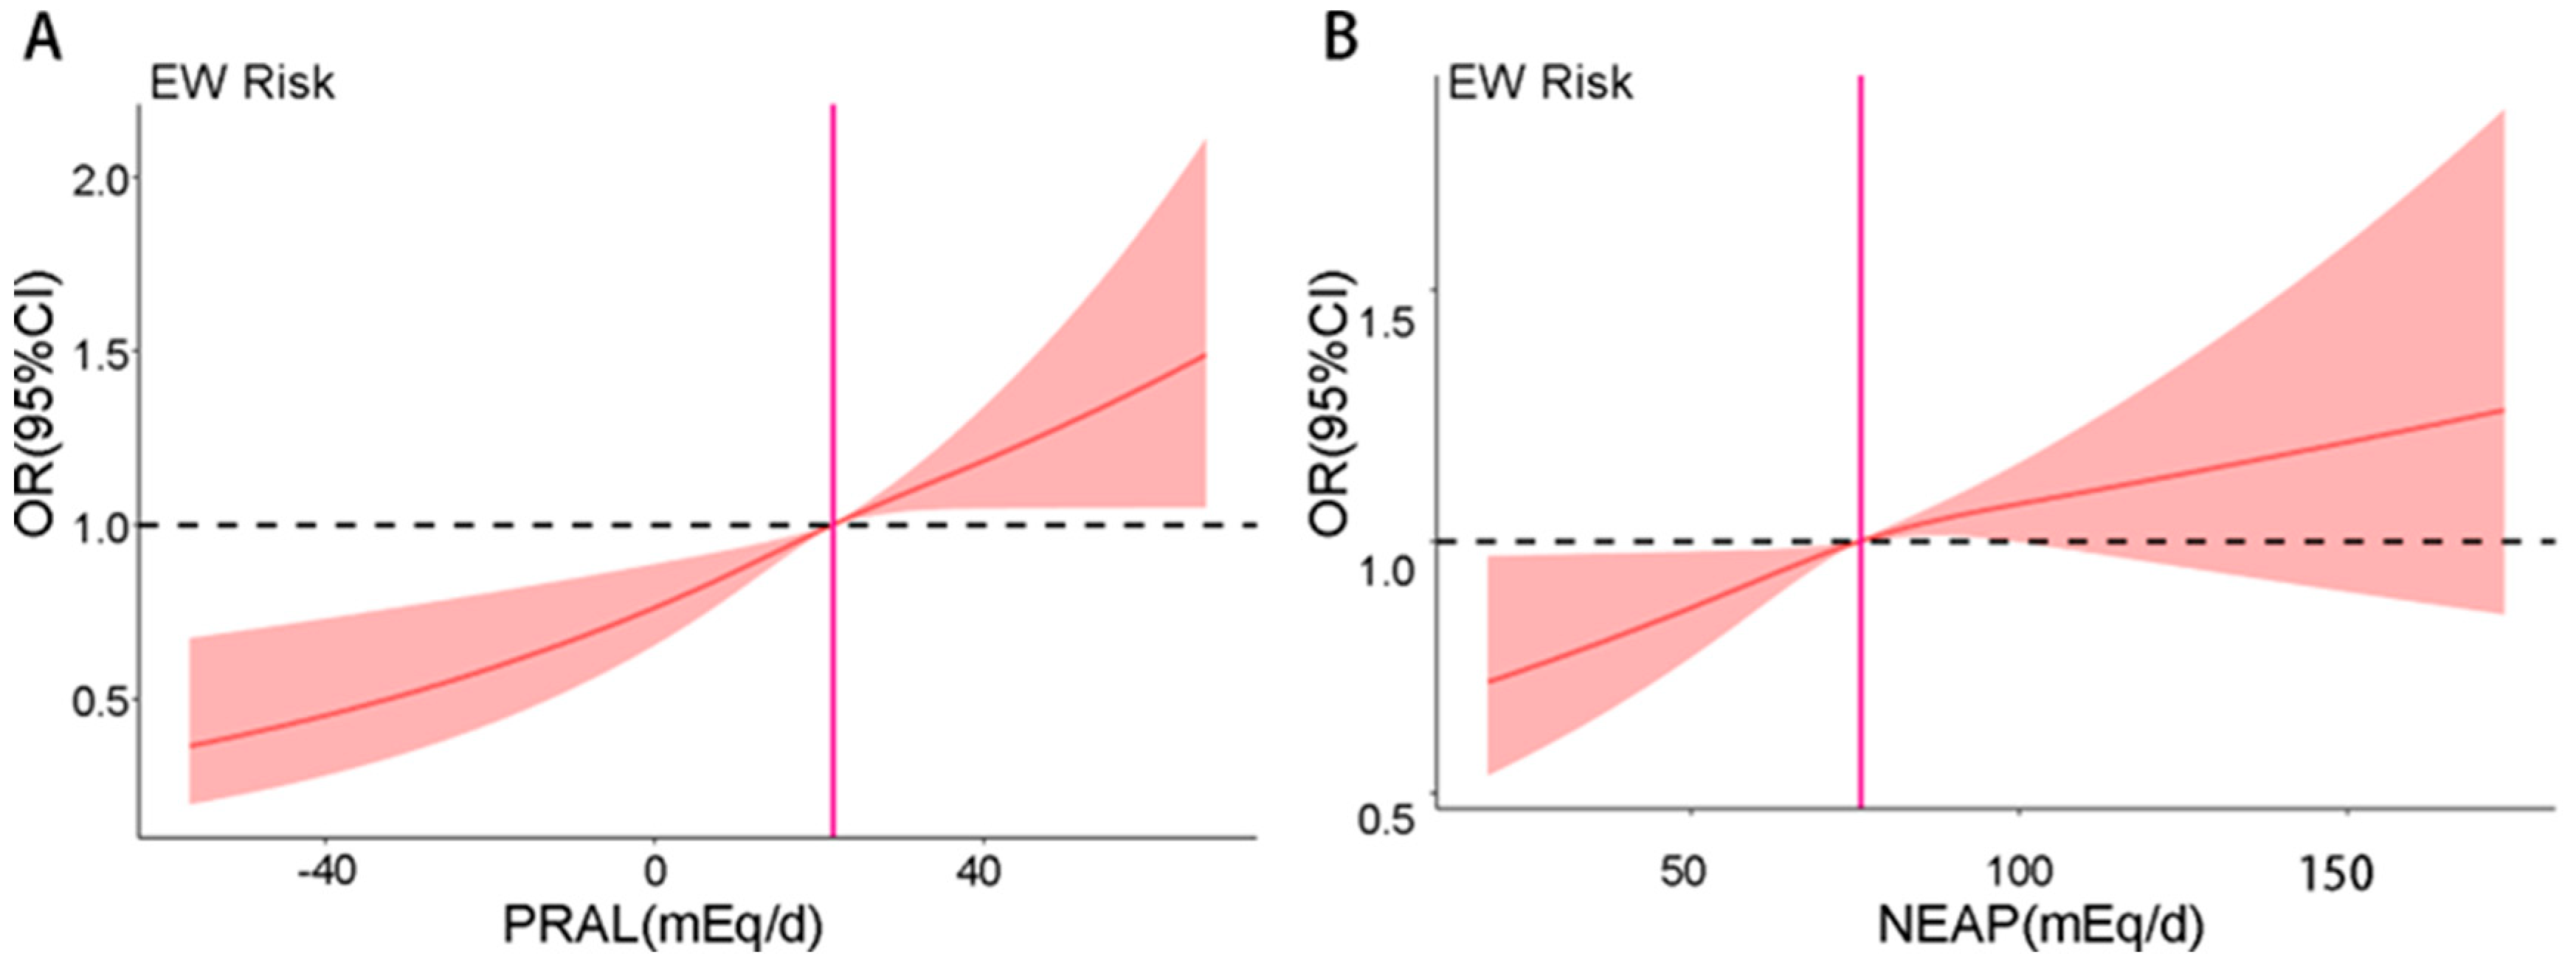
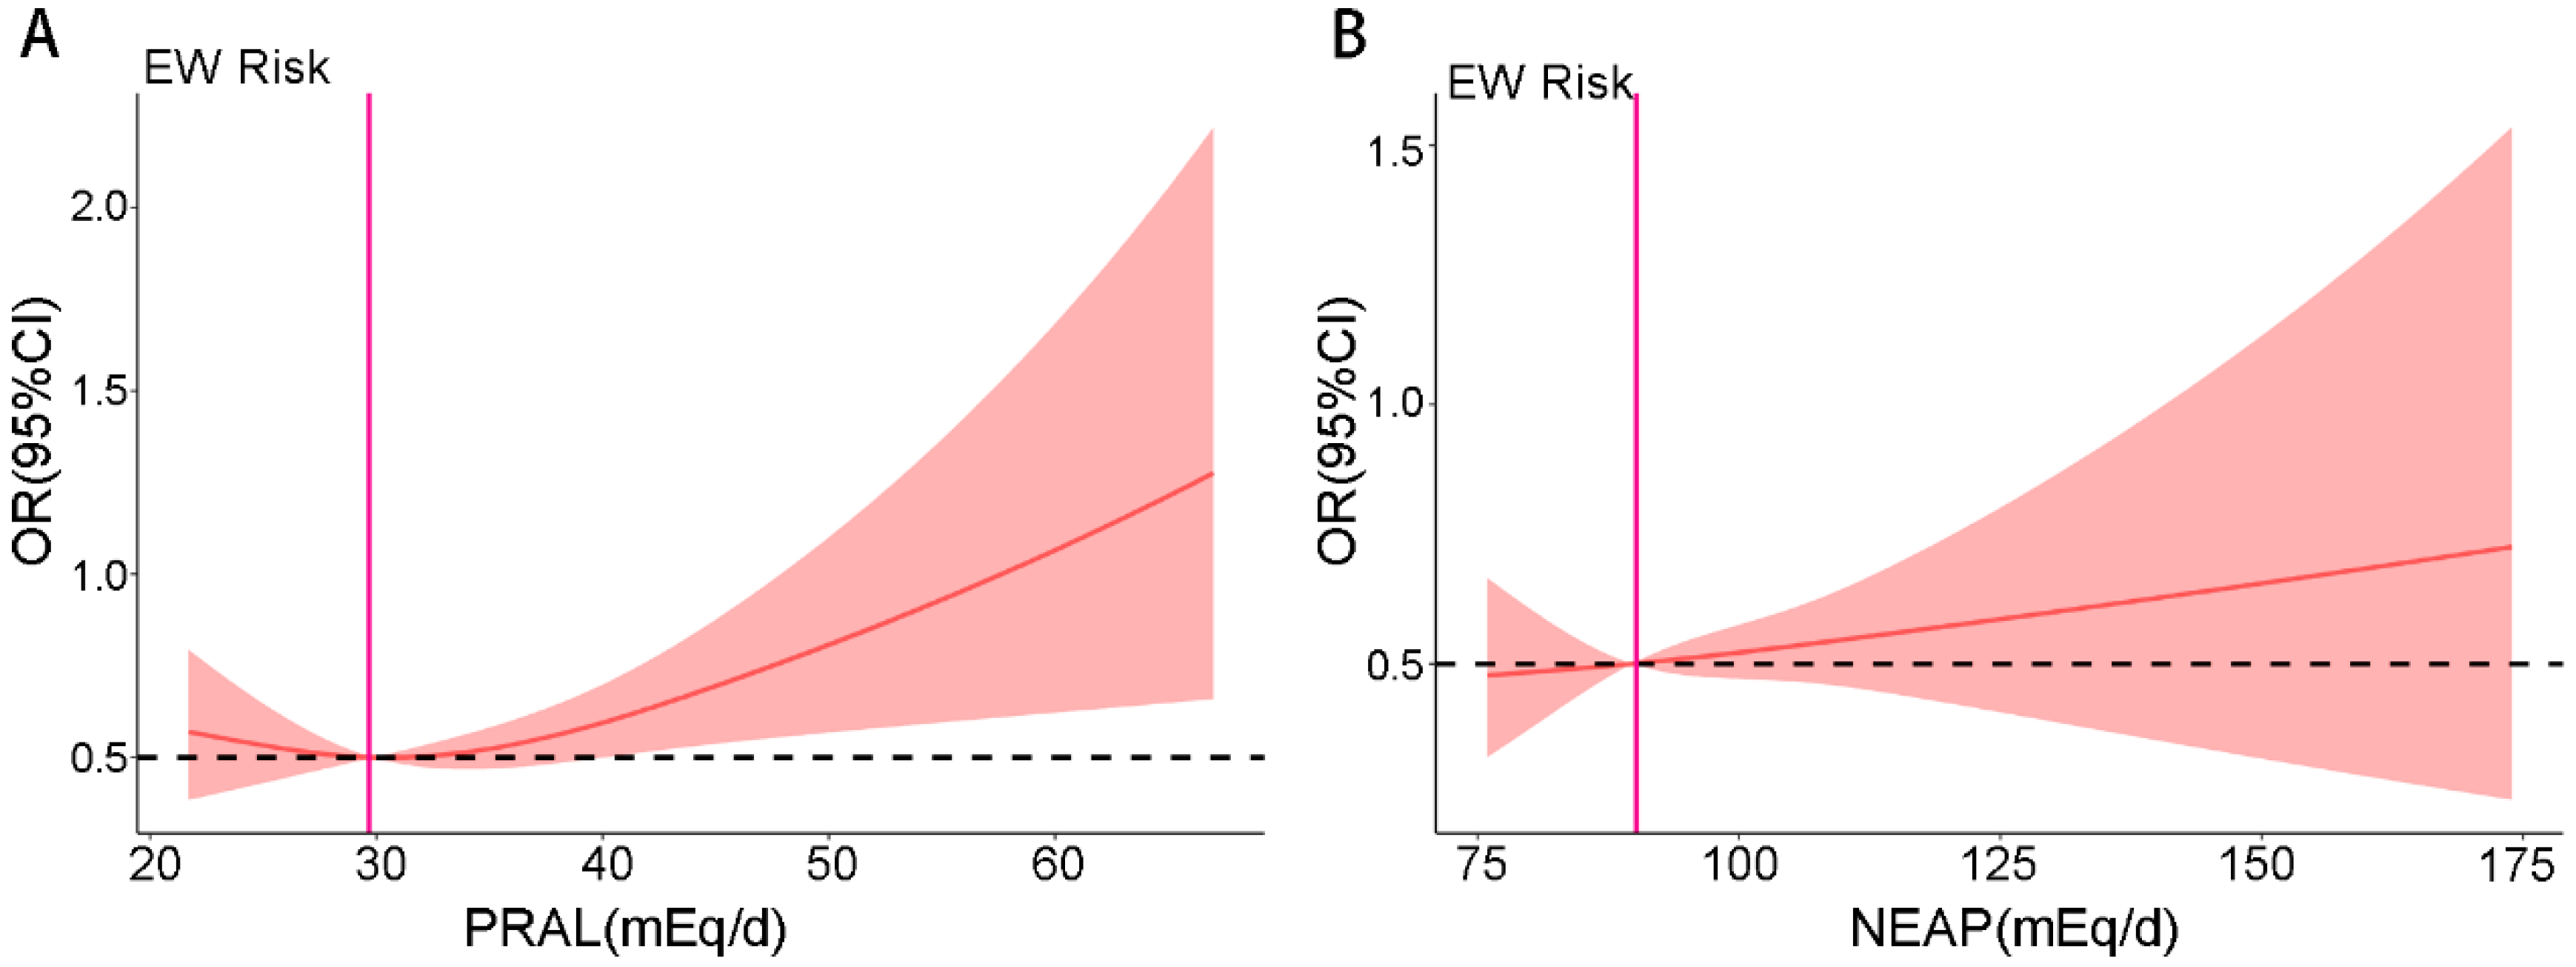
3.4. RCS Analysis of DAL and Risk of EW
3.5. The Association Between Dietary Intake and the Risk of EW
4. Discussion
5. Conclusions
Author Contributions
Funding
Data Availability Statement
Acknowledgments
Conflicts of Interest
Abbreviations
| DAL | Dietary acid load |
| EW | Excess weight |
| PRAL | Potential renal acid load |
| NEAP | Net endogenous acid production |
| RCS | Restricted cubic spline |
| CHNS | China Health and Nutrition Survey |
| BMI | Body Mass Index |
| TC | Total cholesterol |
| LDL-C | Low-density lipoprotein cholesterol |
| HDL-C | High-density lipoprotein cholesterol |
| TGs | Triglycerides |
| eGFR | Estimated glomerular filtration rate |
References
- Nutter, S.; Eggerichs, L.A.; Nagpal, T.S.; Ramos Salas, X.; Chin Chea, C.; Saiful, S.; Ralston, J.; Barata-Cavalcanti, O.; Batz, C.; Baur, L.A.; et al. Changing the global obesity narrative to recognize and reduce weight stigma: A position statement from the World Obesity Federation. Obes. Rev. 2024, 25, e13642. [Google Scholar] [CrossRef]
- Mettananda, C. Global, regional, and national burden of stroke and its risk factors, 1990–2021: A systematic analysis for the Global Burden of Disease Study 2021. Lancet Neurol. 2024, 23, 973–1003. [Google Scholar]
- O’Sullivan, J.N. Demographic delusions: World population growth is exceeding most projections and jeopardising scenarios for sustainable futures. World 2023, 4, 545–568. [Google Scholar] [CrossRef]
- Koliaki, C.; Dalamaga, M.; Liatis, S. Update on the obesity epidemic: After the sudden rise, is the upward trajectory beginning to flatten? Curr. Obes. Rep. 2023, 12, 514–527. [Google Scholar] [CrossRef]
- Dang, J.; Liu, Y.; Cai, S.; Zhong, P.; Shi, D.; Chen, Z.; Zhang, Y.; Dong, Y.; Ma, J.; Song, Y. Secular trend and projection of overweight and obesity among Chinese children and adolescents aged 7–18 years from 1985 to 2019: Rural areas are becoming the focus of investment. Chin. Med. J. 2024, 138, 311–317. [Google Scholar] [CrossRef]
- Osuna-Padilla, I.; Leal-Escobar, G.; Garza-García, C.; Rodríguez-Castellanos, F. Dietary acid load: Mechanisms and evidence of its health repercussions. Nefrol. (Engl. Ed.) 2019, 39, 343–354. [Google Scholar] [CrossRef]
- Sanz, J.M.; Sergi, D.; Colombari, S.; Capatti, E.; Situlin, R.; Biolo, G.; Di Girolamo, F.G.; Lazzer, S.; Šimunič, B.; Pišot, R.; et al. Dietary acid load but not Mediterranean diet adherence score is associated with metabolic and cardiovascular health state: A population observational study from northern Italy. Front. Nutr. 2022, 9, 828587. [Google Scholar] [CrossRef]
- Scialla, J.J.; Anderson, C.A. Dietary acid load: A novel nutritional target in chronic kidney disease? Adv. Chronic Kidney Dis. 2013, 20, 141–149. [Google Scholar] [CrossRef]
- Zhang, M.; Ye, C.; Wang, R.; Zhang, Z.; Huang, X.; Halimulati, M.; Sun, M.; Ma, Y.; Zhang, Z. Association Between Dietary Acid Load and Hyperuricemia in Chinese Adults: Analysis of the China Health and Nutrition Survey (2009). Nutrients 2023, 15, 1806. [Google Scholar] [CrossRef]
- Mangano, K.M.; Walsh, S.J.; Kenny, A.M.; Insogna, K.L.; Kerstetter, J.E. Dietary acid load is associated with lower bone mineral density in men with low intake of dietary calcium. J. Bone Miner. Res. 2014, 29, 500–506. [Google Scholar] [CrossRef]
- Haghighatdoost, F.; Najafabadi, M.M.; Bellissimo, N.; Azadbakht, L. Association of dietary acid load with cardiovascular disease risk factors in patients with diabetic nephropathy. Nutrition 2015, 31, 697–702. [Google Scholar] [CrossRef]
- Han, E.; Kim, G.; Hong, N.; Lee, Y.-h.; Kim, D.W.; Shin, H.J.; Lee, B.-W.; Kang, E.S.; Lee, I.-K.; Cha, B.-S. Association between dietary acid load and the risk of cardiovascular disease: Nationwide surveys (KNHANES 2008–2011). Cardiovasc. Diabetol. 2016, 15, 122. [Google Scholar] [CrossRef]
- Remer, T.; Dimitriou, T.; Manz, F. Dietary potential renal acid load and renal net acid excretion in healthy, free-living children and adolescents. Am. J. Clin. Nutr. 2003, 77, 1255–1260. [Google Scholar] [CrossRef]
- Wang, S.; Fan, X.; Zheng, X.; Xia, P.; Zou, H.; Zhang, Z.; Chen, L. Association between Dietary Acid Load and Chronic Kidney Disease in the Chinese Population: A Comprehensive Analysis of the China Health and Nutrition Survey (2009). Nutrients 2024, 16, 2461. [Google Scholar] [CrossRef]
- Al Sadhan, A.; ElHassan, E.; Altheaby, A.; Al Saleh, Y.; Farooqui, M. Diabetic Ketoacidosis in Patients with End-Stage Kidney Disease: A Review. Oman Med. J. 2021, 36, e241. [Google Scholar] [CrossRef]
- Liu, K.; Yang, Q.; Lang, Y.; Zou, Y.; Yuan, J.; Yang, J.; Ma, J.; Cai, L.; Kong, X.; Yang, F.; et al. Ketogenic Diet, Serum Ketone Bodies and Risk of End-Stage Renal Disease in Patients with Diabetic Kidney Disease: A Multi-Cohort Study. J. Diabetes 2025, 17, e70140. [Google Scholar] [CrossRef]
- Baldini, N.; Avnet, S. The Effects of Systemic and Local Acidosis on Insulin Resistance and Signaling. Int. J. Mol. Sci. 2018, 20, 126. [Google Scholar] [CrossRef]
- Hayata, H.; Miyazaki, H.; Niisato, N.; Yokoyama, N.; Marunaka, Y. Lowered extracellular pH is involved in the pathogenesis of skeletal muscle insulin resistance. Biochem. Biophys. Res. Commun. 2014, 445, 170–174. [Google Scholar] [CrossRef]
- Cronin, P.; Joyce, S.A.; O’Toole, P.W.; O’Connor, E.M. Dietary Fibre Modulates the Gut Microbiota. Nutrients 2021, 13, 1655. [Google Scholar] [CrossRef]
- Ross, F.C.; Patangia, D.; Grimaud, G.; Lavelle, A.; Dempsey, E.M.; Ross, R.P.; Stanton, C. The interplay between diet and the gut microbiome: Implications for health and disease. Nat. Rev. Microbiol. 2024, 22, 671–686. [Google Scholar] [CrossRef]
- Borrell, L.N.; Samuel, L. Body mass index categories and mortality risk in US adults: The effect of overweight and obesity on advancing death. Am. J. Public Health 2014, 104, 512–519. [Google Scholar] [CrossRef]
- Manz, F. History of nutrition and acid-base physiology. Eur. J. Nutr. 2001, 40, 189–199. [Google Scholar] [CrossRef]
- Quade, B.N.; Parker, M.D.; Occhipinti, R. The therapeutic importance of acid-base balance. Biochem. Pharmacol. 2021, 183, 114278. [Google Scholar] [CrossRef]
- Kataya, Y.; Murakami, K.; Kobayashi, S.; Suga, H.; Sasaki, S.; The Three-generation Study of Women on Diets and Health Study Group. Higher dietary acid load is associated with a higher prevalence of frailty, particularly slowness/weakness and low physical activity, in elderly Japanese women. Eur. J. Nutr. 2018, 57, 1639–1650. [Google Scholar] [CrossRef]
- Poupin, N.; Calvez, J.; Lassale, C.; Chesneau, C.; Tomé, D. Impact of the diet on net endogenous acid production and acid–base balance. Clin. Nutr. 2012, 31, 313–321. [Google Scholar] [CrossRef]
- Storz, M.A.; Ronco, A.L.; Hannibal, L. Observational and clinical evidence that plant-based nutrition reduces dietary acid load. J. Nutr. Sci. 2022, 11, e93. [Google Scholar] [CrossRef]
- Abiri, B.; Vafa, M. Dietary restriction, cardiovascular aging and age-related cardiovascular diseases: A review of the evidence. In Reviews on Biomarker Studies in Aging and Anti-Aging Researc; Springer: Cham, Switzerland, 2019; pp. 113–127. [Google Scholar]
- Everitt, A.V.; Hilmer, S.N.; Brand-Miller, J.C.; Jamieson, H.A.; Truswell, A.S.; Sharma, A.P.; Mason, R.S.; Morris, B.J.; Le Couteur, D.G. Dietary approaches that delay age-related diseases. Clin. Interv. Aging 2006, 1, 11–31. [Google Scholar] [CrossRef]
- Akter, S.; Nanri, A.; Mizoue, T.; Noda, M.; Sawada, N.; Sasazuki, S.; Tsugane, S. Dietary acid load and mortality among Japanese men and women: The Japan Public Health Center–Based Prospective Study. Am. J. Clin. Nutr. 2017, 106, 146–154. [Google Scholar] [CrossRef]
- Mozaffari, H.; Namazi, N.; Larijani, B.; Bellissimo, N.; Azadbakht, L. Association of dietary acid load with cardiovascular risk factors and the prevalence of metabolic syndrome in Iranian women: A cross-sectional study. Nutrition 2019, 67, 110570. [Google Scholar] [CrossRef]
- Banerjee, T.; Tucker, K.; Griswold, M.; Wyatt, S.B.; Harman, J.; Young, B.; Taylor, H.; Powe, N.R. Dietary potential renal acid load and risk of albuminuria and reduced kidney function in the Jackson Heart Study. J. Ren. Nutr. 2018, 28, 251–258. [Google Scholar] [CrossRef]
- Jung, C.H.; Lee, M.J.; Kang, Y.M.; Jang, J.E.; Leem, J.; Hwang, J.Y.; Kim, E.H.; Park, J.Y.; Kim, H.K.; Lee, W.J. The risk of incident type 2 diabetes in a Korean metabolically healthy obese population: The role of systemic inflammation. J. Clin. Endocrinol. Metab. 2015, 100, 934–941. [Google Scholar] [CrossRef]
- Toba, K.; Hosojima, M.; Kabasawa, H.; Kuwahara, S.; Murayama, T.; Yamamoto-Kabasawa, K.; Kaseda, R.; Wada, E.; Watanabe, R.; Tanabe, N.; et al. Higher estimated net endogenous acid production with lower intake of fruits and vegetables based on a dietary survey is associated with the progression of chronic kidney disease. BMC Nephrol. 2019, 20, 421. [Google Scholar] [CrossRef]
- Rezazadegan, M.; Mirzaei, S.; Asadi, A.; Akhlaghi, M.; Saneei, P. Association between dietary acid load and metabolic health status in overweight and obese adolescents. Sci. Rep. 2022, 12, 10799. [Google Scholar] [CrossRef]
- Button, K.S.; Ioannidis, J.P.; Mokrysz, C.; Nosek, B.A.; Flint, J.; Robinson, E.S.; Munafò, M.R. Power failure: Why small sample size undermines the reliability of neuroscience. Nat. Rev. Neurosci. 2013, 14, 365–376. [Google Scholar] [CrossRef]
- Adeva, M.M.; Souto, G. Diet-induced metabolic acidosis. Clin. Nutr. 2011, 30, 416–421. [Google Scholar] [CrossRef]
- Carnauba, R.A.; Baptistella, A.B.; Paschoal, V.; Hübscher, G.H. Diet-Induced Low-Grade Metabolic Acidosis and Clinical Outcomes: A Review. Nutrients 2017, 9, 538. [Google Scholar] [CrossRef]
- Shaw, I.; Gregory, K. Acid-base balance: A review of normal physiology. BJA Educ. 2022, 22, 396–401. [Google Scholar] [CrossRef]
- Mulet-Cabero, A.I.; Wilde, P.J. Role of calcium on lipid digestion and serum lipids: A review. Crit. Rev. Food Sci. Nutr. 2023, 63, 813–826. [Google Scholar] [CrossRef]
- Stone, M.S.; Martyn, L.; Weaver, C.M. Potassium Intake, Bioavailability, Hypertension, and Glucose Control. Nutrients 2016, 8, 444. [Google Scholar] [CrossRef]


| Variable | Overall N = 7758 | None EW N = 4686 | EW N = 3072 | p |
|---|---|---|---|---|
| Age | 50.2 (15.0) | 49.5 (15.9) | 51.3 (13.3) | <0.001 |
| Gender | 0.745 | |||
| Female | 4117 (53%) | 2494 (53%) | 1623 (53%) | |
| Male | 3641 (47%) | 2192 (47%) | 1449 (47%) | |
| Education level | <0.001 | |||
| Primary | 3423 (44%) | 2059 (44%) | 1364 (44%) | |
| Middle | 2577 (33%) | 1558 (33%) | 1019 (33%) | |
| High | 887 (11%) | 530 (11%) | 357 (12%) | |
| Vocational | 518 (6.7%) | 330 (7.0%) | 188 (6.1%) | |
| University | 353 (4.6%) | 209 (4.5%) | 144 (4.7%) | |
| Marry | <0.001 | |||
| Single | 450 (5.8%) | 363 (7.7%) | 87 (2.8%) | |
| Married | 6586 (85%) | 3880 (83%) | 2706 (88%) | |
| Other | 722 (9.3%) | 443 (9.5%) | 279 (9.1%) | |
| Location | <0.001 | |||
| Rural | 4773 (62%) | 3031 (65%) | 1742 (57%) | |
| Urban | 2985 (38%) | 1655 (35%) | 1330 (43%) | |
| Alcohol | 2538 (33%) | 1488 (32%) | 1050 (34%) | 0.028 |
| Smoking | 2409 (31%) | 1512 (32%) | 897 (29%) | 0.005 |
| Hip | 94.0 (89.0, 99.1) | 90.6 (87.0, 94.4) | 100.0 (96.0, 104.0) | <0.001 |
| Waist | 82.0 (75.0, 89.9) | 77.0 (72.0, 82.5) | 90.0 (85.0, 96.0) | <0.001 |
| PRAL | 21.5 (13.5, 29.7) | 21.0 (12.8, 29.2) | 22.0 (14.3, 30.5) | <0.001 |
| NEAP | 75.5 (63.4, 89.6) | 75.1 (62.5, 89.3) | 76.4 (64.3, 89.9) | 0.004 |
| Diabetes | 215 (2.8%) | 70 (1.5%) | 145 (4.7%) | <0.001 |
| Hypertension | 1011 (13%) | 419 (9.0%) | 592 (19%) | <0.001 |
| Heart Disease | 72 (0.9%) | 32 (0.7%) | 40 (1.3%) | 0.007 |
| Fraction history | 361 (4.7%) | 198 (4.2%) | 163 (5.3%) | 0.031 |
| Nutrients | Overall (N = 7758) | None-EW (N = 4686) | EW (N = 3072) | p |
|---|---|---|---|---|
| Total Energy (kcal) | 1770.3 (1467.3, 2108.3) | 1762.7 (1459.3, 2097.0) | 1795.3 (1493.7, 2127.0) | 0.030 |
| Protein (g/1000 kcal) | 37.3 (32.6, 43.9) | 37.2 (32.4, 43.8) | 37.6 (33.0, 44.1) | 0.014 |
| Fat (g/1000 kcal) | 25.2 (16.0, 34.1) | 25.0 (15.9, 34.0) | 25.5 (16.1, 34.3) | 0.202 |
| Cholesterol (mg/1000 kcal) | 198.4 (95.7, 318.5) | 196.0 (91.6, 317.3) | 204.0 (103.3, 320.4) | 0.062 |
| Carbohydrates (g/1000 kcal) | 153.1 (131.6, 176.2) | 154.0 (132.8, 176.5) | 151.7 (130.5, 175.4) | 0.063 |
| Fiber (g/1000 kcal) | 5.5 (4.2, 6.3) | 5.5 (4.2, 7.3) | 4.6 (4.2, 5.3) | <0.001 |
| Ca (mg/1000 kcal) | 191.3 (149.1, 257.1) | 191.7 (149.3, 258.7) | 190.2 (148.6, 255.4) | 0.439 |
| P (mg/1000 kcal) | 536.2 (480.1, 602.4) | 532.6 (476.4, 601.2) | 541.9 (487.2, 604.9) | <0.001 |
| K (mg/1000 kcal) | 945.5 (798.1, 1120.9) | 948.7 (798.4, 1123.7) | 937.4 (797.5, 1109.0) | 0.261 |
| Mg (mg/1000 kcal) | 154.1 (132.5, 181.5) | 154.1 (132.4, 181.3) | 154.2 (132.6, 182.0) | 0.404 |
| PRAL Exposure | Model 1 | Model 2 | Model 3 | Model 4 | ||||
|---|---|---|---|---|---|---|---|---|
| OR (95% CI) | p | OR (95% CI) | p | OR (95% CI) | p | OR (95% CI) | p | |
| Tertile 1 (Ref) | 1 | - | 1 | - | 1 | - | 1 | - |
| Tertile 2 | 1.23 (1.10, 1.37) | <0.001 | 1.19 (1.06, 1.33) | 0.003 | 1.20 (1.07, 1.35) | 0.002 | 1.25 (1.11, 1.42) | <0.001 |
| Tertile 3 | 1.24 (1.11, 1.39) | <0.001 | 1.17 (1.04, 1.31) | 0.008 | 1.16 (1.03, 1.31) | 0.011 | 1.27 (1.09, 1.47) | 0.002 |
| p for trend | 0.001 | 0.001 | 0.001 | 0.001 | ||||
| Per 10-unit increase | 1.09 (1.06, 1.13) | <0.001 | 1.07 (1.03, 1.11) | <0.001 | 1.07 (1.03, 1.11) | <0.001 | 1.11 (1.06, 1.16) | <0.001 |
| NEAP Exposure | Model 1 | Model 2 | Model 3 | Model 4 | ||||
|---|---|---|---|---|---|---|---|---|
| OR (95% CI) | p | OR (95% CI) | p | OR (95% CI) | p | OR (95% CI) | p | |
| Tertile 1 (Ref) | 1 | - | 1 | - | 1 | - | 1 | - |
| Tertile 2 | 1.11 (0.99, 1.24) | 0.063 | 1.09 (0.98, 1.23) | 0.125 | 1.10 (0.98, 1.23) | 0.117 | 1.10 (0.98, 1.24) | 0.108 |
| Tertile 3 | 1.16 (1.03, 1.29) | 0.011 | 1.13 (1.01, 1.26) | 0.038 | 1.12 (1.00, 1.26) | 0.05 | 1.15 (1.01, 1.29) | 0.029 |
| p for trend | 0.012 | 0.012 | 0.012 | 0.012 | ||||
| Per 10-unit increase | 1.03 (1.01, 1.06) | 0.004 | 1.03 (1.00, 1.05) | 0.021 | 1.03 (1.00, 1.05) | 0.026 | 1.03 (1.01, 1.06) | 0.012 |
Disclaimer/Publisher’s Note: The statements, opinions and data contained in all publications are solely those of the individual author(s) and contributor(s) and not of MDPI and/or the editor(s). MDPI and/or the editor(s) disclaim responsibility for any injury to people or property resulting from any ideas, methods, instructions or products referred to in the content. |
© 2025 by the authors. Licensee MDPI, Basel, Switzerland. This article is an open access article distributed under the terms and conditions of the Creative Commons Attribution (CC BY) license (https://creativecommons.org/licenses/by/4.0/).
Share and Cite
Wang, S.; Yang, Y.; Lan, M.; Zhang, Z.; Tang, Q. Association Between Dietary Acid Load and Excess Weight in Adults: A Cross-Sectional Study. Nutrients 2025, 17, 3557. https://doi.org/10.3390/nu17223557
Wang S, Yang Y, Lan M, Zhang Z, Tang Q. Association Between Dietary Acid Load and Excess Weight in Adults: A Cross-Sectional Study. Nutrients. 2025; 17(22):3557. https://doi.org/10.3390/nu17223557
Chicago/Turabian StyleWang, Shurui, Yisen Yang, Meijuan Lan, Zhaofeng Zhang, and Qiang Tang. 2025. "Association Between Dietary Acid Load and Excess Weight in Adults: A Cross-Sectional Study" Nutrients 17, no. 22: 3557. https://doi.org/10.3390/nu17223557
APA StyleWang, S., Yang, Y., Lan, M., Zhang, Z., & Tang, Q. (2025). Association Between Dietary Acid Load and Excess Weight in Adults: A Cross-Sectional Study. Nutrients, 17(22), 3557. https://doi.org/10.3390/nu17223557


