Abstract
Background: Metabolic syndrome (MetS) is a rising public health concern in Southern China, with limited evidence available on dietary and metabolic factors. This cross-sectional study employed an interpretable machine learning (ML) approach to identify factors that could inform clinical and community interventions. Methods: Data were obtained from the Guangdong Nutrition Surveys conducted in 2015 and 2022, including sociodemographic information, lifestyle patterns, physical examinations, laboratory measurements and dietary intake information (collected via repeated 24-h dietary recalls). Potentially relevant variables were selected using the Least Absolute Shrinkage and Selection Operator (LASSO) regression and incorporated into seven ML models. Model performance was primarily assessed using the area under the receiver operating characteristic curve (AUC), and the contribution of identified features was interpreted through SHapley Additive exPlanations (SHAP). Results: This analysis included 5593 participants, of whom 1103 were classified as having MetS. After removing collinear features, the ML models retained 19 candidate variables, which were selected through LASSO regression. XGBoost achieved the best performance (AUC: 0.834; F1 score: 0.537) with a misclassification rate of 27.1%. SHAP analysis highlighted body mass index (BMI), age, and uric acid levels as major risk factors, while insoluble dietary fiber, carbohydrate and specific micronutrients exhibited protective associations. Conclusions: Machine learning identified key dietary and metabolic factors of MetS. Integrating these factors into clinical practice and public health initiatives may enhance early detection and support personalized prevention strategies for MetS in Southern China.
1. Introduction
Metabolic syndrome (MetS), defined by a cluster of metabolic abnormalities, including central obesity, hypertension, hyperglycemia, dyslipidemia, and insulin resistance [1,2], significantly elevates the risk of developing type 2 diabetes [3], cardiovascular diseases [4] and stroke [5]. It has become a major global health challenge, affecting approximately one in four adults worldwide [1,6]. In the U.S., MetS prevalence reached 41.8% during 2017–2018 [7], while in China, it was 31.1% among adults aged 20 years and older in 2015–2017 [8], with Southern China seeing an increase from 21.3% in 2010 [9] to 27.4% in 2015–2017 [8]. This increasing trend highlights the urgent need for effective prevention and management strategies within both clinical and community-based healthcare systems.
In China, particularly in southern provinces such as Guangdong, the rapid economic development and shifts in dietary patterns have contributed to the disease burden of MetS. National initiatives, including “Healthy China 2030”, aim to strengthen MetS management in primary care systems, yet their implementation faces significant challenges. A key limitation is the lack of accurate, individualized risk assessment tools, which hinders the identification of high-risk populations.
Dietary improvement is essential for the prevention and management of MetS [1,10], as it influences metabolic processes such as blood pressure regulation, lipid profiles, glucose metabolism, and body fat distribution. Macronutrients [11,12,13] and micronutrients [14,15,16,17] play critical roles in regulating insulin sensitivity, oxidative stress, and lipid metabolism regulation. However, the impact of diet is significantly modulated by regional variations and the complexity of dietary components. The Cantonese (Lingnan) dietary pattern, characterized by high consumption of vegetables, fruits, aquatic products, and light cooking, may offer cardiometabolic benefits, but the optimal nutritional strategy for MetS prevention in this region is remains unclear. Limited research on specific dietary and metabolic factors within this pattern hinders the development of culturally tailored preventive strategies. Traditional analytical methods, such as principal component analysis (PCA) [18], are limited in their ability to capture the complex interactions and nonlinear relationships between diet and metabolism, thereby limiting their ability to support precise population stratification and personalized intervention strategies.
In contrast, machine learning (ML) methods are well-suited to analyzing high-dimensional and complex health data, enabling the detection of nonlinear relationships and variable interactions that are not readily discernible through traditional statistical techniques [19]. This study further incorporates the SHapley Additive exPlanations (SHAP) analysis to enhance model interpretability, thereby transforming the key factors identified by ML into transparent, actionable insights that can support decision-making in real-world healthcare settings.
Building on this foundation, this study aims to systematically identify key dietary and metabolic markers associated with MetS within the dietary patterns of the Lingnan region and to quantify their relative contributions to disease risk. Ultimately, this research seeks to provide primary care institutions in southern China with evidence-based, actionable, and personalized nutrition intervention strategies as well as clinical decision support tools, thereby facilitating the implementation and scalability of precision approaches to the prevention and management of metabolic syndrome in real-world healthcare settings.
2. Materials and Methods
2.1. Data Source and Study Population
This cross-sectional study was based on data from the China National Nutrition Surveys (CNNS), conducted by the Chinese Center for Disease Control and Prevention in 2015 and 2022. Detailed information on the survey design has been previously published [20]. For this analysis, only data from Guangdong Province were included.
Eligible participants were adults aged 18 years or older with complete demographic, dietary, and biochemical data. Pregnant women, lactating mothers, and individuals with implausible energy intakes (<800 kcal/day or >6000 kcal/day for men; <600 kcal/day or >4000 kcal/day for women) were excluded. A total of 5593 individuals were included in the final analysis. The participant selection flowchart is shown in Figure 1. The survey protocols were approved by the Ethics Committee of the Chinese Center for Disease Control and Prevention (Approval Nos. 201519-B and 2022-008), and all participants provided written informed consent. This study was reported in accordance with TRIPOD (the Transparent Reporting of a Multivariable Prediction Model for Individual Prognosis or Diagnosis) statement [21]. The completed checklist is available in Table S1.
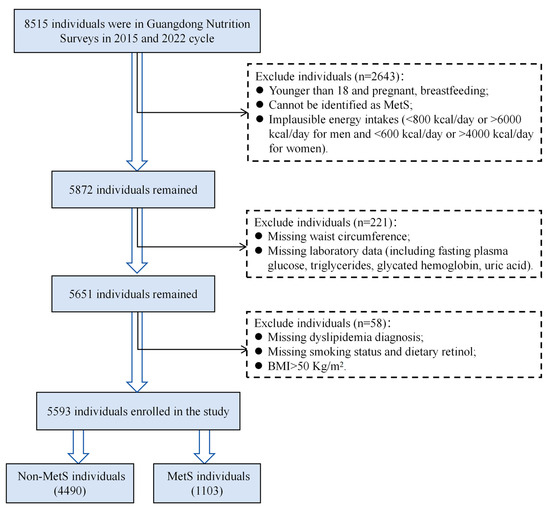
Figure 1.
Flowchart of the study participants screening in the study. BMI, body mass index; MetS, metabolic syndrome.
2.2. Definition of Metabolic Syndrome
MetS was defined in accordance with the Chinese Guideline for the Prevention and Treatment of Type 2 Diabetes (CDS 2020) [22]. Diagnosis required at least three of the following: (1) abdominal obesity: male waist circumference ≥ 90 cm, female waist circumference ≥ 85 cm; (2) hyperglycemia: fasting plasma glucose (FPG) ≥ 6.1 mmol/L or 2 h postprandial blood glucose ≥7.8 mmol/L and/or prior diagnosis and treatment of diabetes; (3) hypertension: blood pressure ≥ 130/85 mmHg and/or confirmed hypertension under treatment; (4) fasting triglyceride (TG) ≥ 1.70 mmol/L; (5) fasting high-density lipoprotein cholesterol (HDL-C) < 1.04 mmol/L.
2.3. Dietary Assessment
Dietary intake was assessed by trained interviewers using a repeated 24 h dietary recall method [23], including one weekend day, to account for day-to-day variability and better estimate usual intake. This method is widely used in large-scale epidemiological studies and national nutrition surveys. To improve accuracy, participants were assisted with food models and standardized portion-size photographs to minimize recall omission and estimation error. Dietary intakes were calculated based on the Chinese Food Composition Table [24]. The average intake over three days was used in all analyses.
2.4. Data Preprocessing and Model Development
To minimize redundancy, variables with correlation coefficients exceeding 0.8 were excluded. The dataset was randomly divided into training (70%) and test (30%) sets. Subsequently, variable selection was performed with the Least Absolute Shrinkage and Selection Operator (LASSO) regression, which applies an L1 penalty to shrink uninformative coefficients toward zero, thereby improving model parsimony and mitigating overfitting.
Class imbalance between MetS and non-MetS groups was addressed in the training set using the Synthetic Minority Oversampling Technique (SMOTE) [25], which generates synthetic minority class samples based on nearest-neighbor interpolation.
Seven machine learning algorithms were employed to construct models: Light Gradient Boosting Machine (LightGBM), Random Forest (RF), Extreme Gradient Boosting (XGBoost), Support Vector Machine (SVM), Logistic Regression (LR), K-nearest neighbors (KNN), and Naïve Bayes (NB). These algorithms were chosen for their complementary strengths. LightGBM utilizes gradient-based sampling and feature bundling to efficiently process large datasets. RF aggregates multiple decision trees to enhance robustness and reduce variance. XGBoost extends gradient boosting with regularization mechanisms for flexibility and speed. SVM identifies optimal separating hyperplanes in high-dimensional space via kernel functions. LR offers interpretability and stability when applied to structured data. KNN classifies instances based on similarity to neighboring observations. NB provides computational efficiency for high-dimensional categorical data. All models were trained using 10-fold cross-validation, and hyperparameters were optimized via grid search to maximize performance while avoiding overfitting.
2.5. Performance of the ML Models
Performance was evaluated by multiple metrics: accuracy, sensitivity, specificity, positive predictive value (PPV), negative predictive value (NPV), F1 score, and classification error rate. The primary criterion for model selection was the area under the receiver operating characteristic curve (AUC). Confusion matrices were constructed to provide detailed classification outcomes, including true positives, true negatives, false positives, and false negatives.
2.6. Interpretability Methods for the Optimal Models
To address the “black-box” nature of ML, the SHAP algorithm was applied to the best-performing model. SHAP assigns each feature a contribution score that reflects its additive effect on model output, enabling both global feature ranking and instance-level interpretability [26].
2.7. Other Covariates
Covariates included sociodemographic variables (age, sex [male/female], residence [urban/rural], education level [primary school or below, junior middle school, senior high school or above]), behavioral factors (smoking status [current vs. non-smoker], alcohol consumption [current vs. non-drinker]), and physical activity level (categorized as mild, moderate, or heavy based on occupation).
Physical examinations were conducted after an overnight fast. Measurements included height, weight, waist circumference, and blood pressure. Height and weight were recorded to the nearest 0.1 cm and 0.1 kg, respectively. Blood pressure was measured three times at 1 min intervals using standardized instruments, and the average of the three readings was used in analysis. Body mass index (BMI) was calculated as weight (kg) divided by height squared (m2).
Venous blood samples (8 mL) were collected to measure FPG, TG, total cholesterol (TC), low-density lipoprotein cholesterol (LDL-C), HDL-C, glycated hemoglobin (HbA1c), and uric acid (UA). All samples were processed under standardized conditions and analyzed in a central laboratory.
2.8. Statistical Analysis
Participant characteristics stratified by MetS status were analyzed using survey-weighted methods. Continuous variables are presented as means ± standard deviations for normally distributed data or medians with interquartile ranges for skewed distributions, while categorical variables are reported as frequencies and percentages. Between-group comparisons were performed using the weighted chi-square test for categorical variables, analysis of variance (ANOVA) for normally distributed continuous variables, and the Kruskal–Wallis H test for non-normally distributed data.
All analyses were conducted in R (version 4.5.1) and Python (version 3.13.5) using established statistical packages. A two-tailed p-value < 0.05 was considered statistically significant.
3. Results
3.1. Characteristics of Participants
A total of 5593 participants were included in the analysis, comprising 4490 (80.3%) individuals without MetS and 1103 (19.7%) with MetS. The baseline characteristics of these participants are shown in Table S2. Participants with MetS were older and exhibited higher BMI, waist circumference, and blood pressure levels (all p < 0.01). Significant differences were also observed in sex, education, and smoking status. Dietary comparisons indicated that the MetS group had lower intakes of carbohydrate, insoluble dietary fiber, and several micronutrients, including biotin, choline, iron, copper, and manganese (all p < 0.05). Biochemical profiles further confirmed the MetS phenotype, showing elevated FPG, HbA1c, TG, and TC as well as reduced HDL-C levels (all p < 0.01). Correlations between dietary and non-dietary variables are illustrated in Figure S1.
3.2. Variables Selection Using LASSO Regression
LASSO regression analysis was performed with 10-fold cross-validation and 1000 iterations to identify the most relevant variables. Figure 2a displays the LASSO coefficient paths, illustrating how coefficients converge toward zero with increasing regularization penalty. The accompanying cross-validation error plot (Figure 2b) shows the mean squared error for each λ values, which was used to select the value that minimizes the prediction error. Ultimately, the optimal λ value was determined to be 0.0464 (Figure 2b), yielding 19 covariates for inclusion in the machine learning models. These included seven clinical and demographic variables (age, sex, education, physical activity, BMI, TC, UA) and 12 dietary variables (insoluble dietary fiber, retinol, carbohydrate, pantothenic acid, biotin, folate, choline, vitamin K, potassium, copper, manganese, iodine).
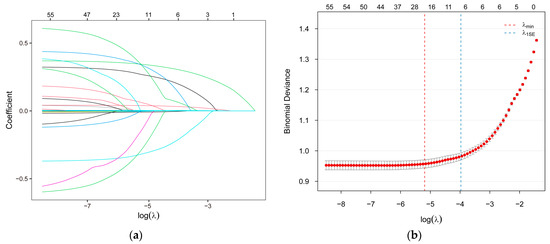
Figure 2.
The LASSO regression process for feature selection. (a) LASSO path plot; (b) LASSO cross-validation error plot. LASSO, the Least Absolute Shrinkage and Selection Operator.
3.3. Model Evaluation and Comparison
Table 1 summarizes the performance metrics of seven machine learning models (XGBoost, LightGBM, LR, SVM, RF, KNN, and NB) on the test set. Among them, the XGBoost model demonstrated superior performance, achieving the highest AUC value (0.834; 95% CI: 0.809–0.856) (Figure S2) and F1 score (0.537). The ROC curve (Figure 3a) indicates that the curve of XGBoost is closest to the upper left corner, demonstrating its outstanding discrimination ability. The confusion matrix (Figure 3b) reveals high sensitivity (0.798) and a high negative predictive value (0.935). Additionally, it maintains a relatively low misclassification rate (27.1%) (Table 1). Consequently, XGBoost model was selected as the optimal model for subsequent interpretability analysis.

Table 1.
Performance comparison of different machine learning models across multiple evaluation metrics.
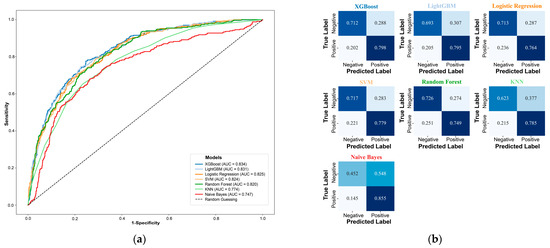
Figure 3.
Evaluation the performance of all machine learning models. (a) ROC curves; (b) Confusion matrices. XGBoost, Extreme Gradient Boosting; LightGBM, Light Gradient Boosting Machine; SVM, Support Vector Machine; KNN, K-nearest neighbors.
3.4. Importance of Features Interpretation Using SHAP
SHAP analysis was applied to interpret the final model’s output. The computation of SHAP values provides a clear and interpretable method for evaluating the importance of individual features in a model. The global explanation provides an overview of the model’s overall functionality. As shown in the SHAP summary bar plot (Figure 4a), feature contributions were ranked by their mean SHAP values in descending order, with BMI, age, and UA identified as the three most influential features in the model. Furthermore, the SHAP summary plot (Figure 4b) visually illustrates the direction and magnitude of each feature’s influence on the model, highlighting BMI, age, and UA as the most robust positive biomarkers. In contrast, higher dietary intakes of retinol, insoluble fiber, carbohydrates, biotin, choline, and manganese were associated with negative SHAP values, indicating potential protective effects against MetS. For individual-level interpretation, specific plots were generated. The SHAP waterfall plot (Figure 4c) for the third participant demonstrates how each feature contributes to the model output for that individual using the XGBoost framework. The actual values of each feature and their corresponding SHAP values in the graph illustrate the extent to which each feature exerts a positive or negative influence on the outcome. For instance, an age of 74 years and a BMI of 23.85 kg/m2 contributed significantly to the outcome with positive SHAP values of +0.93 and +0.32, respectively. Conversely, a UA level of 234 μmol/L and a carbohydrate level of 225.009 g/day were associated with negative contributions, yielding SHAP values of −0.45 and −0.27, respectively. Additionally, SHAP dependence plots (Figure S3) were constructed to visualize the individual contributions of the three most influential features—BMI, age, and UA—ranked by mean SHAP values. The plots revealed that higher BMI, older age, and elevated UA levels were consistently associated with increased SHAP values, suggesting that they may have a positive contribution to MetS.
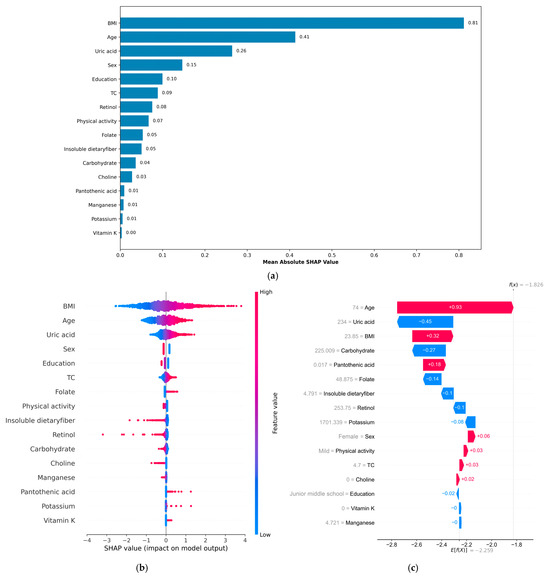
Figure 4.
This is a SHAP analysis on the best machine learning model (XGBoost model) to enhance the interpretability of the result. (a) SHAP summary bar plot; (b) SHAP summary plot; (c) SHAP waterfall plot. BMI, body mass index; TC, total cholesterol; SHAP, Shapley Additive exPlanations.
4. Discussion
The complex interplay between nutritional and metabolic factors and MetS remains inadequately characterized in the Southern Chinese population. To address this knowledge gap, we employed an interpretable machine learning approach—XGBoost—to identify key factors of MetS by integrating a comprehensive set of nutritional and clinical variables. Our analysis revealed a distinct metabolic and dietary intake that differentiate individuals with and without MetS, underscoring the value of multidimensional data integration for understanding this multifaceted condition.
By leveraging SHAP-based interpretability, BMI, age, and UA were identified as the most prominent risk factors, whereas insoluble dietary fiber, carbohydrate, retinol, biotin, choline, and manganese were associated with protective effects. These findings confirm the multifactorial nature of MetS and highlight the crucial role of dietary composition in its pathogenesis and prevention. The XGBoost model demonstrated robust performance in our study, outperforming logistic regression and other tree-based algorithms. This illustrates its capacity to capturing complex, nonlinear relationships inherent in multidimensional health data.
This study adds to the growing body of evidence supporting the application of interpretable machine learning in nutritional epidemiology. While previous studies—including those by Cai et al. [19] and a South Korean cohort investigation [27]—have demonstrated the robust predictive accuracy of XGBoost for MetS, our work focuses specifically on the Lingnan population, which is distinguished by its distinct dietary culture. More importantly, we integrated SHAP analysis to clarify the direction and magnitude of individual feature contributions. This shift from mere factor identification to model interpretability provides actionable insights into modifiable risk factors for MetS within this specific demographic. Our results reinforce the multifactorial etiology of MetS and emphasize the pivotal role of dietary composition in both its development and prevention.
After identifying the key influencing factors through SHAP analysis, we further interpreted the primary contributors by integrating evidence from the literature with regional characteristics. In this study, BMI emerged as the strongest determinant of MetS, a finding consistent with epidemiological data across diverse populations worldwide, including those in Asia [28,29,30], Europe [31], and the United States [32]. The underlying pathophysiological mechanism are well established: excess adiposity, particularly visceral fat, initiates a cascade of metabolic disturbances, positioning obesity as a central target for MetS prevention and intervention. Although BMI has limitations in capturing fat distribution and does not account for the metabolically obese normal-weight (MONW) phenotype [33,34], its high SHAP value in this study underscores its substantial contribution to metabolic dysregulation within the Lingnan population. Advancing age was another dominant factor, aligning with evidence from global cohorts and population-based studies that demonstrate a marked increase in MetS prevalence with aging [7], reflecting the cumulative burden of metabolic burden across the life course.
Notably, UA ranked as the third most influential factor in our analysis, surpassing several conventional risk factors. This result is supported by robust findings from prospective cohort studies, which consistently report an association between elevated UA levels and increased incidence of MetS [35]. Furthermore, genome-wide association studies and Mendelian randomization analyses suggest a potential causal role of uric acid in cardiovascular and metabolic traits [36]. The high prevalence of hyperuricemia in Guangdong—exceeding 20% [37,38]—indicates that local dietary patterns may amplify this risk. The Lingnan region is rich in poultry, and there is a saying that “no chicken, no feast”. “Boiled Chicken Slices”, “Cantonese Roast Goose” and “Chaozhou Foie Gras” are famous Cantonese delicacies. Moreover, the regional diet features high consumption of poultry (164.8 g/day) and aquatic products (57 g/day), both of which are rich in purines and substantially above the national average. Additionally, the traditional practice of preparing slow-cooked soups results in significant purine leaching in the broth, further promoting uric acid production [39]. Mechanistically, hyperuricemia has been shown to contribute to insulin resistance, visceral adiposity, oxidative stress, and endothelial dysfunction—core pathways implicated in MetS pathogenesis [40]. Thus, in this population, both biological mechanisms and distinctive regional dietary habits converge to reinforce UA as a pivotal determinant of MetS.
Dietary and nutritional factors also played a significant role. Insoluble dietary fiber emerged as a consistent protective factor against MetS, consistent with existing evidence linking higher intake to enhanced cardiometabolic profiles [11,41]. Potential mechanisms include improved satiety, modulation of bile acid metabolism, and beneficial effects on gut microbiota, all of which contribute to improved insulin sensitivity and lipid homeostasis [42,43]. Carbohydrate intake was inversely associated with MetS, a relationship likely driven by carbohydrate quality rather than quantity—particularly the consumption of whole grains and high-fiber foods [44,45,46].
In this study, retinol (vitamin A) exhibited a protective association, although its biological effects are complex and may follow a U-shaped dose–response curve, in which both deficiency and excess intake are linked to increased risk, while moderate intake appears to confer potential benefits [47,48]. Our findings support this protective hypothesis, suggesting that the effects may vary according to baseline nutritional status, intake levels, and genetic predispositions. Other micronutrients—biotin, choline, and manganese—also showed inverse associations with MetS. Biotin functions as a coenzyme in key reactions of energy metabolism [49], while choline, which is abundant in regional staples such as fish and soy products, plays a critical role in lipid metabolism and insulin sensitivity [50,51]. Manganese, primarily derived from rice [52] in this population, acts as a cofactor in antioxidant defense systems and mitochondrial energy pathways [53,54]. Collectively, these findings reflect the characteristics of the Lingnan dietary pattern, which emphasizes whole grains, legumes, nuts, and rice-based staples—foods rich in dietary fiber and essential micronutrients. This coherence strengthens the plausibility of our results and highlights the importance of interpreting nutrient–disease relationships within the context of local dietary practices.
This study has several important strengths. First, to our knowledge, this is the first application of interpretable machine learning methods in southern China to integrate demographic, lifestyle, and nutritional-metabolic factors and construct a multi-dimensional framework for identifying potential determinants of MetS. Second, the use of stratified, multistage sampling to obtain a large, representative sample substantially enhances the robustness and regional applicability of the findings. More importantly, the key factors identified—such as BMI, UA, and specific nutrients—can serve as the foundation for developing stratified risk assessment tools, enabling earlier identification of high-risk individuals beyond conventional diagnostic criteria. For instance, individuals with hyperuricemia may benefit from personalized dietary interventions targeting local high-purine food practices, such as the consumption of traditional slow-cooked soups and certain aquatic products. These insights can be integrated into existing chronic disease management systems, providing a practical framework for the precise prevention and management of MetS through patient education, individualized goal setting, and continuous monitoring of intervention outcomes. Ultimately, this approach is expected to reduce the disease burden of metabolic syndrome in this region.
Limitations
Several limitations should be acknowledged. First, the cross-sectional design precludes the establishment of temporal sequence or causality between dietary factors and MetS. Consequently, our findings should be interpreted as hypothesis-generating and require future validation, rather than serving as evidence of causal relationships. Second, dietary intake was assessed using 3-day 24-h recalls—a method prone to recall bias and potentially insufficient for capturing long-term habitual eating patterns—thereby increasing the likelihood of non-differential misclassification of exposures. Although this approach represents an improvement over single-day assessments, future studies should employ more robust dietary assessment methods, such as repeated 24-h recalls combined with food frequency questionnaires (FFQs) and objective nutritional biomarkers (e.g., urinary nitrogen, serum carotenoids), improve measurement precision and support stronger causal inference. Third, the LASSO method was applied for feature selection rather than for controlling confounding; thus, residual confounding from unmeasured genetic, lifestyle (e.g., sleep quality, psychological stress), and environmental factors may still affect the observed associations. Furthermore, while SHAP values offer insight into variable importance, they are based on the assumption of feature independence and do not indicate causal relationships. Persistent multicollinearity among predictors, even after preprocessing, may complicate mechanistic interpretation.
To address these limitations, we recommend that future research utilize longitudinal cohort studies and randomized controlled trials to confirm the causal roles of the identified factors. Additionally, integrating multi-omics data (e.g., genomics, metabolomics) with comprehensive lifestyle and environmental assessments will be critical for elucidating the complex determinants of MetS and advancing the development of personalized prevention strategies.
5. Conclusions
This study applied an interpretable machine learning framework to identify potential related factors of MetS in a Southern Chinese population. The model highlighted the dominant roles of BMI, age, and UA as risk factors, while underscoring the protective effects of insoluble dietary fiber and several micronutrients. These findings emphasize the multifactorial nature of MetS and the importance of integrating both clinical and nutritional data for risk assessment. The results support the development of stratified prevention strategies, such as personalized dietary guidance targeting local purine-rich foods and promoting fiber-rich diets. Future longitudinal studies are warranted to confirm causality and translate these findings into precise clinical and public health interventions.
Supplementary Materials
The following supporting information can be downloaded at https://www.mdpi.com/article/10.3390/nu17213368/s1. Table S1: A complete and transparent report of the TRIPOD checklist for multivariable prediction models for individual prognosis or diagnosis; Table S2: Baseline characteristics of the participants; Figure S1: The correlation coefficients between dietary features and other variables; Figure S2: The AUC Forest plot of model performance selection; Figure S3: The SHAP dependence plot for the top 3 most important features (BMI, age and UA) for the third participant.
Author Contributions
Conceptualization, X.M. and Y.F.; Methodology, X.M., Y.F. and W.W.; Software, X.M. and S.Z.; Formal analysis, X.M., Y.F., S.Z., G.J. and W.W.; Data curation, G.J., P.H. and J.W.; Writing—original draft preparation, X.M. and Y.F.; Writing—review and editing, S.Z., G.J., W.W. and J.W.; Supervision, X.Y., G.J., W.W. and J.P.; Funding acquisition, X.Y., G.J. and W.W. All authors have read and agreed to the published version of the manuscript.
Funding
This research was funded by Talent Support Project of Guangdong Provincial Center for Disease Control and Prevention (2023D336), the Special Support Program of Guangdong Province (2021TX06N107), the National Natural Science Foundation of China (82073599, 82373600 and 81874276), National Key Research and Development Program of the Ministry of Science and Technology (2018YFC1314100), and the GDMPA Project of Scientific and Technological Innovation (2022ZDZ09).
Institutional Review Board Statement
The study was conducted in accordance with the Declaration of Helsinki, and approved by the Ethics Committee of the Chinese Center for Disease Control and Prevention (Approval No. 201519-B, approval date: June 2015 and 2022-008, approval date: 28 January 2022).
Informed Consent Statement
Informed consent was obtained from all subjects involved in the study.
Data Availability Statement
The original contributions presented in the study are included in the article; further inquiries can be directed to the corresponding author. The data are not publicly available according to the National Institute for Nutrition and Health and the Chinese Center for Disease Control and Prevention.
Acknowledgments
The authors are grateful to all participants who took part in the China Nutrition and Health Surveillance. The authors also thank the Guangdong nutrition survey team in the China National Nutrition Surveys.
Conflicts of Interest
The authors declare no conflicts of interest.
Abbreviations
| AUC | the area under the ROC curve |
| BMI | body mass index |
| CER | Classification Error Rate |
| CDS 2020 | Chinese Guideline for the Prevention and Treatment of Type 2 Diabetes |
| CNNS | China National Nutrition Surveys |
| DBP | diastolic blood pressure |
| FFQs | food frequency questionnaires |
| FPG | fasting plasma glucose |
| HbA1c | glycated hemoglobin |
| HDL-C | high-density lipoprotein cholesterol |
| KNN | K-nearest neighbors |
| LASSO | The Least Absolute Shrinkage and Selection Operator |
| LDL-C | low-density lipoprotein cholesterol |
| LightGBM | Light Gradient Boosting Machine |
| LR | Logistic Regression |
| MetS | metabolic syndrome |
| MONW | metabolically obese normal weight |
| ML | machine learning |
| NB | Naïve Bayes |
| NPV | negative predictive value |
| PCA | principal component analysis |
| PPV | positive predictive value |
| RF | Random Forest |
| SBP | systolic blood pressure |
| SHAP | Shapley Additive exPlanations |
| SMOTE | Synthetic Minority Oversampling Technique |
| SVM | Support Vector Machine |
| TC | total cholesterol |
| TG | triglycerides |
| TRIPOD | Transparent Reporting of a Multivariable Prediction Model for Individual Prognosis or Diagnosis |
| UA | uric acid |
| XGBoost | Extreme Gradient Boosting |
References
- Neeland, I.J.; Lim, S.; Tchernof, A.; Gastaldelli, A.; Rangaswami, J.; Ndumele, C.E.; Powell-Wiley, T.M.; Després, J.-P. Metabolic syndrome. Nat. Rev. Dis. Primers 2024, 10, 77. [Google Scholar] [CrossRef] [PubMed]
- Hamooya, B.M.; Siame, L.; Muchaili, L.; Masenga, S.K.; Kirabo, A. Metabolic syndrome: Epidemiology, mechanisms, and current therapeutic approaches. Front. Nutr. 2025, 12, 1661603. [Google Scholar] [CrossRef]
- Amouzegar, A.; Honarvar, M.; Masoumi, S.; Khalili, D.; Azizi, F.; Mehran, L. Trajectory patterns of metabolic syndrome severity score and risk of type 2 diabetes. J. Transl. Med. 2023, 21, 750. [Google Scholar] [CrossRef]
- Ramezankhani, A.; Azizi, F.; Hadaegh, F. Gender differences in changes in metabolic syndrome status and its components and risk of cardiovascular disease: A longitudinal cohort study. Cardiovasc. Diabetol. 2022, 21, 227. [Google Scholar] [CrossRef]
- Moghadam-Ahmadi, A.; Soltani, N.; Ayoobi, F.; Jamali, Z.; Sadeghi, T.; Jalali, N.; Vakilian, A.; Lotfi, M.A.; Khalili, P. Association between metabolic syndrome and stroke: A population based cohort study. BMC Endocr. Disord. 2023, 23, 131. [Google Scholar] [CrossRef]
- Noubiap, J.J.; Nansseu, J.R.; Lontchi-Yimagou, E.; Nkeck, J.R.; Nyaga, U.F.; Ngouo, A.T.; Tounouga, D.N.; Tianyi, F.L.; Foka, A.J.; Ndoadoumgue, A.L.; et al. Geographic distribution of metabolic syndrome and its components in the general adult population: A meta-analysis of global data from 28 million individuals. Diabetes Res. Clin. Pr. 2022, 188, 109924. [Google Scholar] [CrossRef] [PubMed]
- Liang, X.; Or, B.; Tsoi, M.F.; Cheung, C.L.; Cheung, B.M.Y. Prevalence of metabolic syndrome in the United States National Health and Nutrition Examination Survey 2011–18. Postgrad. Med. J. 2023, 99, 985–992. [Google Scholar] [CrossRef]
- Yao, F.; Bo, Y.; Zhao, L.; Li, Y.; Ju, L.; Fang, H.; Piao, W.; Yu, D.; Lao, X. Prevalence and Influencing Factors of Metabolic Syndrome among Adults in China from 2015 to 2017. Nutrients 2021, 13, 4475. [Google Scholar] [CrossRef] [PubMed]
- Lao, X.Q.; Ma, W.J.; Sobko, T.; Zhang, Y.H.; Xu, Y.J.; Xu, X.J.; Yu, D.M.; Nie, S.P.; Cai, Q.M.; Wei, X.L.; et al. Dramatic escalation in metabolic syndrome and cardiovascular risk in a Chinese population experiencing rapid economic development. BMC Public Health 2014, 14, 983. [Google Scholar] [CrossRef]
- Ambroselli, D.; Masciulli, F.; Romano, E.; Catanzaro, G.; Besharat, Z.M.; Massari, M.C.; Ferretti, E.; Migliaccio, S.; Izzo, L.; Ritieni, A.; et al. New Advances in Metabolic Syndrome, from Prevention to Treatment: The Role of Diet and Food. Nutrients 2023, 15, 640. [Google Scholar] [CrossRef]
- Guo, H.; Ding, J.; Liang, J.; Zhang, Y. Associations of Whole Grain and Refined Grain Consumption With Metabolic Syndrome. A Meta-Analysis of Observational Studies. Front. Nutr. 2021, 8, 695620. [Google Scholar] [CrossRef]
- Tappia, P.S.; Shah, A.K. Role of Macronutrients in Human Health and Disease. In Biomedical Translational Research: From Disease Diagnosis to Treatment; Springer: Berlin/Heidelberg, Germany, 2022; pp. 477–491. [Google Scholar] [CrossRef]
- Yang, W.; Jiang, W.; Guo, S. Regulation of Macronutrients in Insulin Resistance and Glucose Homeostasis during Type 2 Diabetes Mellitus. Nutrients 2023, 15, 4671. [Google Scholar] [CrossRef]
- Li, K.; Liu, C.; Kuang, X.; Deng, Q.; Zhao, F.; Li, D. Effects of Multivitamin and Multimineral Supplementation on Blood Pressure: A Meta-Analysis of 12 Randomized Controlled Trials. Nutrients 2018, 10, 1018. [Google Scholar] [CrossRef]
- Beydoun, M.A.; Chen, X.; Jha, K.; Beydoun, H.A.; Zonderman, A.B.; Canas, J.A. Carotenoids, vitamin A, and their association with the metabolic syndrome: A systematic review and meta-analysis. Nutr. Rev. 2019, 77, 32–45. [Google Scholar] [CrossRef]
- Das, S.; Choudhuri, D. Dietary calcium regulates the risk renal injury in high fat diet induced obese rats by regulating renal lipid metabolism, oxidative stress and inflammation. Arch. Physiol. Biochem. 2022, 128, 1039–1049. [Google Scholar] [CrossRef]
- Sun, Q.; Fan, Z.; Yao, F.; Zhao, X.; Jiang, M.; Yang, M.; Mao, M.; Yang, C. Association of dietary and circulating antioxidant vitamins with metabolic syndrome: An observational and Mendelian randomization study. Front. Endocrinol. 2024, 15, 1446719. [Google Scholar] [CrossRef] [PubMed]
- Mazidi, M.; Pennathur, S.; Afshinnia, F. Link of dietary patterns with metabolic syndrome: Analysis of the National Health and Nutrition Examination Survey. Nutr. Diabetes 2017, 7, e255. [Google Scholar] [CrossRef] [PubMed]
- Cai, C.; Li, H.; Zhang, L.; Li, J.; Duan, S.; Fang, Z.; Li, C.; Chen, H.; Alharbi, M.; Ye, L.; et al. Machine Learning Identification of Nutrient Intake Variations across Age Groups in Metabolic Syndrome and Healthy Populations. Nutrients 2024, 16, 1659. [Google Scholar] [CrossRef] [PubMed]
- He, Y.; Zhao, W.; Zhang, J.; Zhao, L.; Yang, Z.; Huo, J.; Yang, L.; Wang, J.; He, L.; Sun, J.; et al. Data Resource Profile: China National Nutrition Surveys. Int. J. Epidemiol. 2019, 48, 368. [Google Scholar] [CrossRef]
- Collins, G.S.; Reitsma, J.B.; Altman, D.G.; Moons, K.G. Transparent reporting of a multivariable prediction model for individual prognosis or diagnosis (TRIPOD): The TRIPOD statement. BMJ 2015, 350, g7594. [Google Scholar] [CrossRef]
- Chinese Elderly Type 2 Diabetes Prevention and Treatment of Clinical Guidelines Writing Group; Geriatric Endocrinology and Metabolism Branch of Chinese Geriatric Society; Geriatric Endocrinology and Metabolism Branch of Chinese Geriatric Health Care Society; Geriatric Professional Committee of Beijing Medical Award Foundation; National Clinical Medical Research Center for Geriatric Diseases (PLA General Hospital); Tian, H.; Li, C.; Ji, L. Clinical guidelines for prevention and treatment of type 2 diabetes mellitus in the elderly in China (2022 edition). Zhonghua Nei Ke Za Zhi 2022, 61, 12–50. [Google Scholar] [CrossRef]
- Niezen, S.; Mehta, M.; Jiang, Z.G.; Tapper, E.B. Coffee Consumption Is Associated With Lower Liver Stiffness: A Nationally Representative Study. Clin. Gastroenterol. Hepatol. 2022, 20, 2032–2040.e6. [Google Scholar] [CrossRef]
- Yang, Y.X. Chinese Food Composition Table; Peking University Medical Press: Beijing, China, 2009. [Google Scholar]
- Dablain, D.; Krawczyk, B.; Chawla, N.V. DeepSMOTE: Fusing Deep Learning and SMOTE for Imbalanced Data. IEEE Trans. Neural Netw. Learn. Syst. 2023, 34, 6390–6404. [Google Scholar] [CrossRef]
- Chen, H.; Lundberg, S.M.; Lee, S.I. Explaining a series of models by propagating Shapley values. Nat. Commun. 2022, 13, 4512. [Google Scholar] [CrossRef]
- Lee, S.; Lee, H.; Choi, J.R.; Koh, S.B. Development and Validation of Prediction Model for Risk Reduction of Metabolic Syndrome by Body Weight Control: A Prospective Population-based Study. Sci. Rep. 2020, 10, 10006. [Google Scholar] [CrossRef] [PubMed]
- Tang, X.; Liu, Q. Prediction of the development of metabolic syndrome by the Markov model based on a longitudinal study in Dalian City. BMC Public Health 2018, 18, 707. [Google Scholar] [CrossRef] [PubMed]
- De Silva, S.T.; Niriella, M.A.; Ediriweera, D.S.; Kottahachchi, D.; Kasturiratne, A.; de Silva, A.P.; Dassanayaka, A.S.; Pathmeswaran, A.; Wickramasinghe, R.; Kato, N.; et al. Incidence and risk factors for metabolic syndrome among urban, adult Sri Lankans: A prospective, 7-year community cohort, follow-up study. Diabetol. Metab. Syndr. 2019, 11, 66. [Google Scholar] [CrossRef]
- Rahmawati, N.D.; Andriani, H.; Wirawan, F.; Farsia, L.; Waits, A.; Karim Taufiqurahman, K.A. Body mass index as a dominant risk factor for metabolic syndrome among indonesian adults: A 6-year prospective cohort study of non-communicable diseases. BMC Nutr. 2024, 10, 43. [Google Scholar] [CrossRef]
- Kotsis, V.; Jordan, J.; Micic, D.; Finer, N.; Leitner, D.R.; Toplak, H.; Tokgozoglu, L.; Athyros, V.; Elisaf, M.; Filippatos, T.D.; et al. Obesity and cardiovascular risk: A call for action from the European Society of Hypertension Working Group of Obesity, Diabetes and the High-risk Patient and European Association for the Study of Obesity: Part A: Mechanisms of obesity induced hypertension, diabetes and dyslipidemia and practice guidelines for treatment. J. Hypertens. 2018, 36, 1427–1440. [Google Scholar] [CrossRef] [PubMed]
- Shi, T.H.; Wang, B.; Natarajan, S. The Influence of Metabolic Syndrome in Predicting Mortality Risk Among US Adults: Importance of Metabolic Syndrome Even in Adults With Normal Weight. Prev. Chronic Dis. 2020, 17, E36. [Google Scholar] [CrossRef]
- Cătoi, A.F.; Parvu, A.E.; Andreicut, A.D.; Mironiuc, A.; Crăciun, A.; Cătoi, C.; Pop, I.D. Metabolically Healthy versus Unhealthy Morbidly Obese: Chronic Inflammation, Nitro-Oxidative Stress, and Insulin Resistance. Nutrients 2018, 10, 1199. [Google Scholar] [CrossRef]
- Tsatsoulis, A.; Paschou, S.A. Metabolically Healthy Obesity: Criteria, Epidemiology, Controversies, and Consequences. Curr. Obes. Rep. 2020, 9, 109–120. [Google Scholar] [CrossRef] [PubMed]
- Chen, T.S.; Mi, N.N.; Lao, H.Y.; Wang, C.Y.; Lo, W.L.A.; Mao, Y.R.; Tang, Y.; Pei, Z.; Yuan, J.Q.; Huang, D.F. Investigating the nexus of metabolic syndrome, serum uric acid, and dementia risk: A prospective cohort study. BMC Med. 2024, 22, 115. [Google Scholar] [CrossRef]
- Cho, C.; Kim, B.; Kim, D.S.; Hwang, M.Y.; Shim, I.; Song, M.; Lee, Y.C.; Jung, S.H.; Cho, S.K.; Park, W.Y.; et al. Large-scale cross-ancestry genome-wide meta-analysis of serum urate. Nat. Commun. 2024, 15, 3441. [Google Scholar] [CrossRef]
- Huang, J.; Ma, Z.F.; Zhang, Y.; Wan, Z.; Li, Y.; Zhou, H.; Chu, A.; Lee, Y.Y. Geographical distribution of hyperuricemia in mainland China: A comprehensive systematic review and meta-analysis. Glob. Health Res. Policy 2020, 5, 52. [Google Scholar] [CrossRef]
- Zhang, M.; Zhu, X.; Wu, J.; Huang, Z.; Zhao, Z.; Zhang, X.; Xue, Y.; Wan, W.; Li, C.; Zhang, W.; et al. Prevalence of Hyperuricemia Among Chinese Adults: Findings From Two Nationally Representative Cross-Sectional Surveys in 2015–16 and 2018–19. Front. Immunol. 2021, 12, 791983. [Google Scholar] [CrossRef]
- Wu, M.; Zhang, W.; Shen, X.; Wang, W. Simultaneous Determination of Purines and Uric Acid in Chinese Chicken Broth Using TFA/FA Hydrolysis Coupled with HPLC-VWD. Foods 2021, 10, 2814. [Google Scholar] [CrossRef] [PubMed]
- Raya-Cano, E.; Vaquero-Abellan, M.; Molina-Luque, R.; De Pedro-Jimenez, D.; Molina-Recio, G.; Romero-Saldana, M. Association between metabolic syndrome and uric acid: A systematic review and meta-analysis. Sci. Rep. 2022, 12, 18412. [Google Scholar] [CrossRef]
- Chen, J.P.; Chen, G.C.; Wang, X.P.; Qin, L.; Bai, Y. Dietary Fiber and Metabolic Syndrome: A Meta-Analysis and Review of Related Mechanisms. Nutrients 2017, 10, 24. [Google Scholar] [CrossRef] [PubMed]
- Brownlee, I.A.; Chater, P.I.; Pearson, J.P.; Wilcox, M.D. Dietary fibre and weight loss: Where are we now? Food Hydrocoll. 2017, 68, 186–191. [Google Scholar] [CrossRef]
- Ariyarathna, P.; Mizera, P.; Walkowiak, J.; Dziedzic, K. Physicochemical and Functional Properties of Soluble and Insoluble Dietary Fibers in Whole Grains and Their Health Benefits. Foods 2025, 14, 2447. [Google Scholar] [CrossRef]
- Reynolds, A.; Mann, J.; Cummings, J.; Winter, N.; Mete, E.; Te Morenga, L. Carbohydrate quality and human health: A series of systematic reviews and meta-analyses. Lancet 2019, 393, 434–445. [Google Scholar] [CrossRef]
- Majdi, M.; Imani, H.; Bazshahi, E.; Hosseini, F.; Djafarian, K.; Lesani, A.; Akbarzade, Z.; Shab-Bidar, S. Habitual- and Meal-Specific Carbohydrate Quality Index and Their Relation to Metabolic Syndrome in a Sample of Iranian Adults. Front. Nutr. 2022, 9, 763345. [Google Scholar] [CrossRef]
- Ying, T.; Zheng, J.; Kan, J.; Li, W.; Xue, K.; Du, J.; Liu, Y.; He, G. Effects of whole grains on glycemic control: A systematic review and dose-response meta-analysis of prospective cohort studies and randomized controlled trials. Nutr. J. 2024, 23, 47. [Google Scholar] [CrossRef]
- Qorbani, M.; Seif, E.; Heshmat, R.; Ghonbalani, Z.N.; Basiry, P.; Kazemian, E.; Kelishadi, R. Association of Serum Retinol Concentrations With Metabolic Syndrome Components in Iranian Children and Adolescents: The CASPIAN-V Study. Front. Nutr. 2022, 9, 807634. [Google Scholar] [CrossRef] [PubMed]
- Sun, Q.; Guo, J. Associations between serum retinol and all-cause mortality among adults with prediabetes and diabetes: A cohort study. PLoS ONE 2024, 19, e0297552. [Google Scholar] [CrossRef] [PubMed]
- Zhang, Y.; Ding, Y.; Fan, Y.; Xu, Y.; Lu, Y.; Zhai, L.; Wang, L. Influence of biotin intervention on glycemic control and lipid profile in patients with type 2 diabetes mellitus: A systematic review and meta-analysis. Front. Nutr. 2022, 9, 1046800. [Google Scholar] [CrossRef]
- Taesuwan, S.; Vermeylen, F.; Caudill, M.A.; Cassano, P.A. Relation of choline intake with blood pressure in the National Health and Nutrition Examination Survey 2007–2010. Am. J. Clin. Nutr. 2019, 109, 648–655. [Google Scholar] [CrossRef]
- Virtanen, J.K.; Tuomainen, T.P.; Voutilainen, S. Dietary intake of choline and phosphatidylcholine and risk of type 2 diabetes in men: The Kuopio Ischaemic Heart Disease Risk Factor Study. Eur. J. Nutr. 2020, 59, 3857–3861. [Google Scholar] [CrossRef] [PubMed]
- Zhou, B.; Su, X.; Su, D.; Zeng, F.; Wang, M.H.; Huang, L.; Huang, E.; Zhu, Y.; Zhao, D.; He, D.; et al. Dietary intake of manganese and the risk of the metabolic syndrome in a Chinese population. Br. J. Nutr. 2016, 116, 853–863. [Google Scholar] [CrossRef]
- Jomova, K.; Makova, M.; Alomar, S.Y.; Alwasel, S.H.; Nepovimova, E.; Kuca, K.; Rhodes, C.J.; Valko, M. Essential metals in health and disease. Chem. Biol. Interact. 2022, 367, 110173. [Google Scholar] [CrossRef] [PubMed]
- Yang, K.; Cui, X.; Hu, Y.; Feng, X.; Chen, W.; Zhang, W.; Zhang, L.; Li, S.; Hu, Y.; Li, T.; et al. Dietary manganese supplementation decreases hepatic lipid deposition by regulating gene expression and enzyme activity involved in lipid metabolism in the liver of broilers. J. Anim. Sci. 2024, 102, skae235. [Google Scholar] [CrossRef] [PubMed]
Disclaimer/Publisher’s Note: The statements, opinions and data contained in all publications are solely those of the individual author(s) and contributor(s) and not of MDPI and/or the editor(s). MDPI and/or the editor(s) disclaim responsibility for any injury to people or property resulting from any ideas, methods, instructions or products referred to in the content. |
© 2025 by the authors. Licensee MDPI, Basel, Switzerland. This article is an open access article distributed under the terms and conditions of the Creative Commons Attribution (CC BY) license (https://creativecommons.org/licenses/by/4.0/).