Assessing Appetite–Validation of a Picture-Based Appetite Assessment Tool for Children Aged 6–9 Years—A Pilot Study
Abstract
1. Introduction
1.1. Main Objective
1.2. Secondary Objectives
- To determine whether participants can accurately rate hunger levels that correspond to the hunger levels of the child in a story (Part 1)
- To evaluate the correlation between post-lunch hunger levels and ratings on the PBAA scale (Part 2)
- To assess the alignment between hunger levels after lunch, using the PBAA rating and the type of food, and calorie intake of self-selected snacks (measurable by the researchers) (Part 3)
- To assess the alignment between hunger levels using the PBAA rating and the type of food, and calorie intake after eating self-selected snacks (measurable by the researchers) (Part 3)
- To verify whether participants who report higher or no change in hunger levels after meals (Parts 2 and 3) genuinely feel as indicated by their responses
- To examine potential sex and age differences in scale comprehension
1.3. Research Hypotheses
- Participants will rate hunger levels in alignment with hunger and satiety descriptions in the story.
- Participants will report lower hunger levels after eating lunch.
- Participants will report lower hunger levels after consuming self-selected snack portions (measurable by the researcher).
- Participants who will not report lower hunger levels after meals (Parts 2 and 3) will genuinely feel as indicated by their responses
- There will be no significant sex or age differences in scale comprehension.
2. Methods
2.1. Study Population
2.2. Research Procedure
2.3. Research Parts
2.3.1. Preliminary Sessions
- Part 1: Story-based satiety assessment
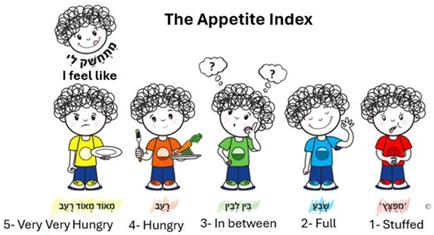
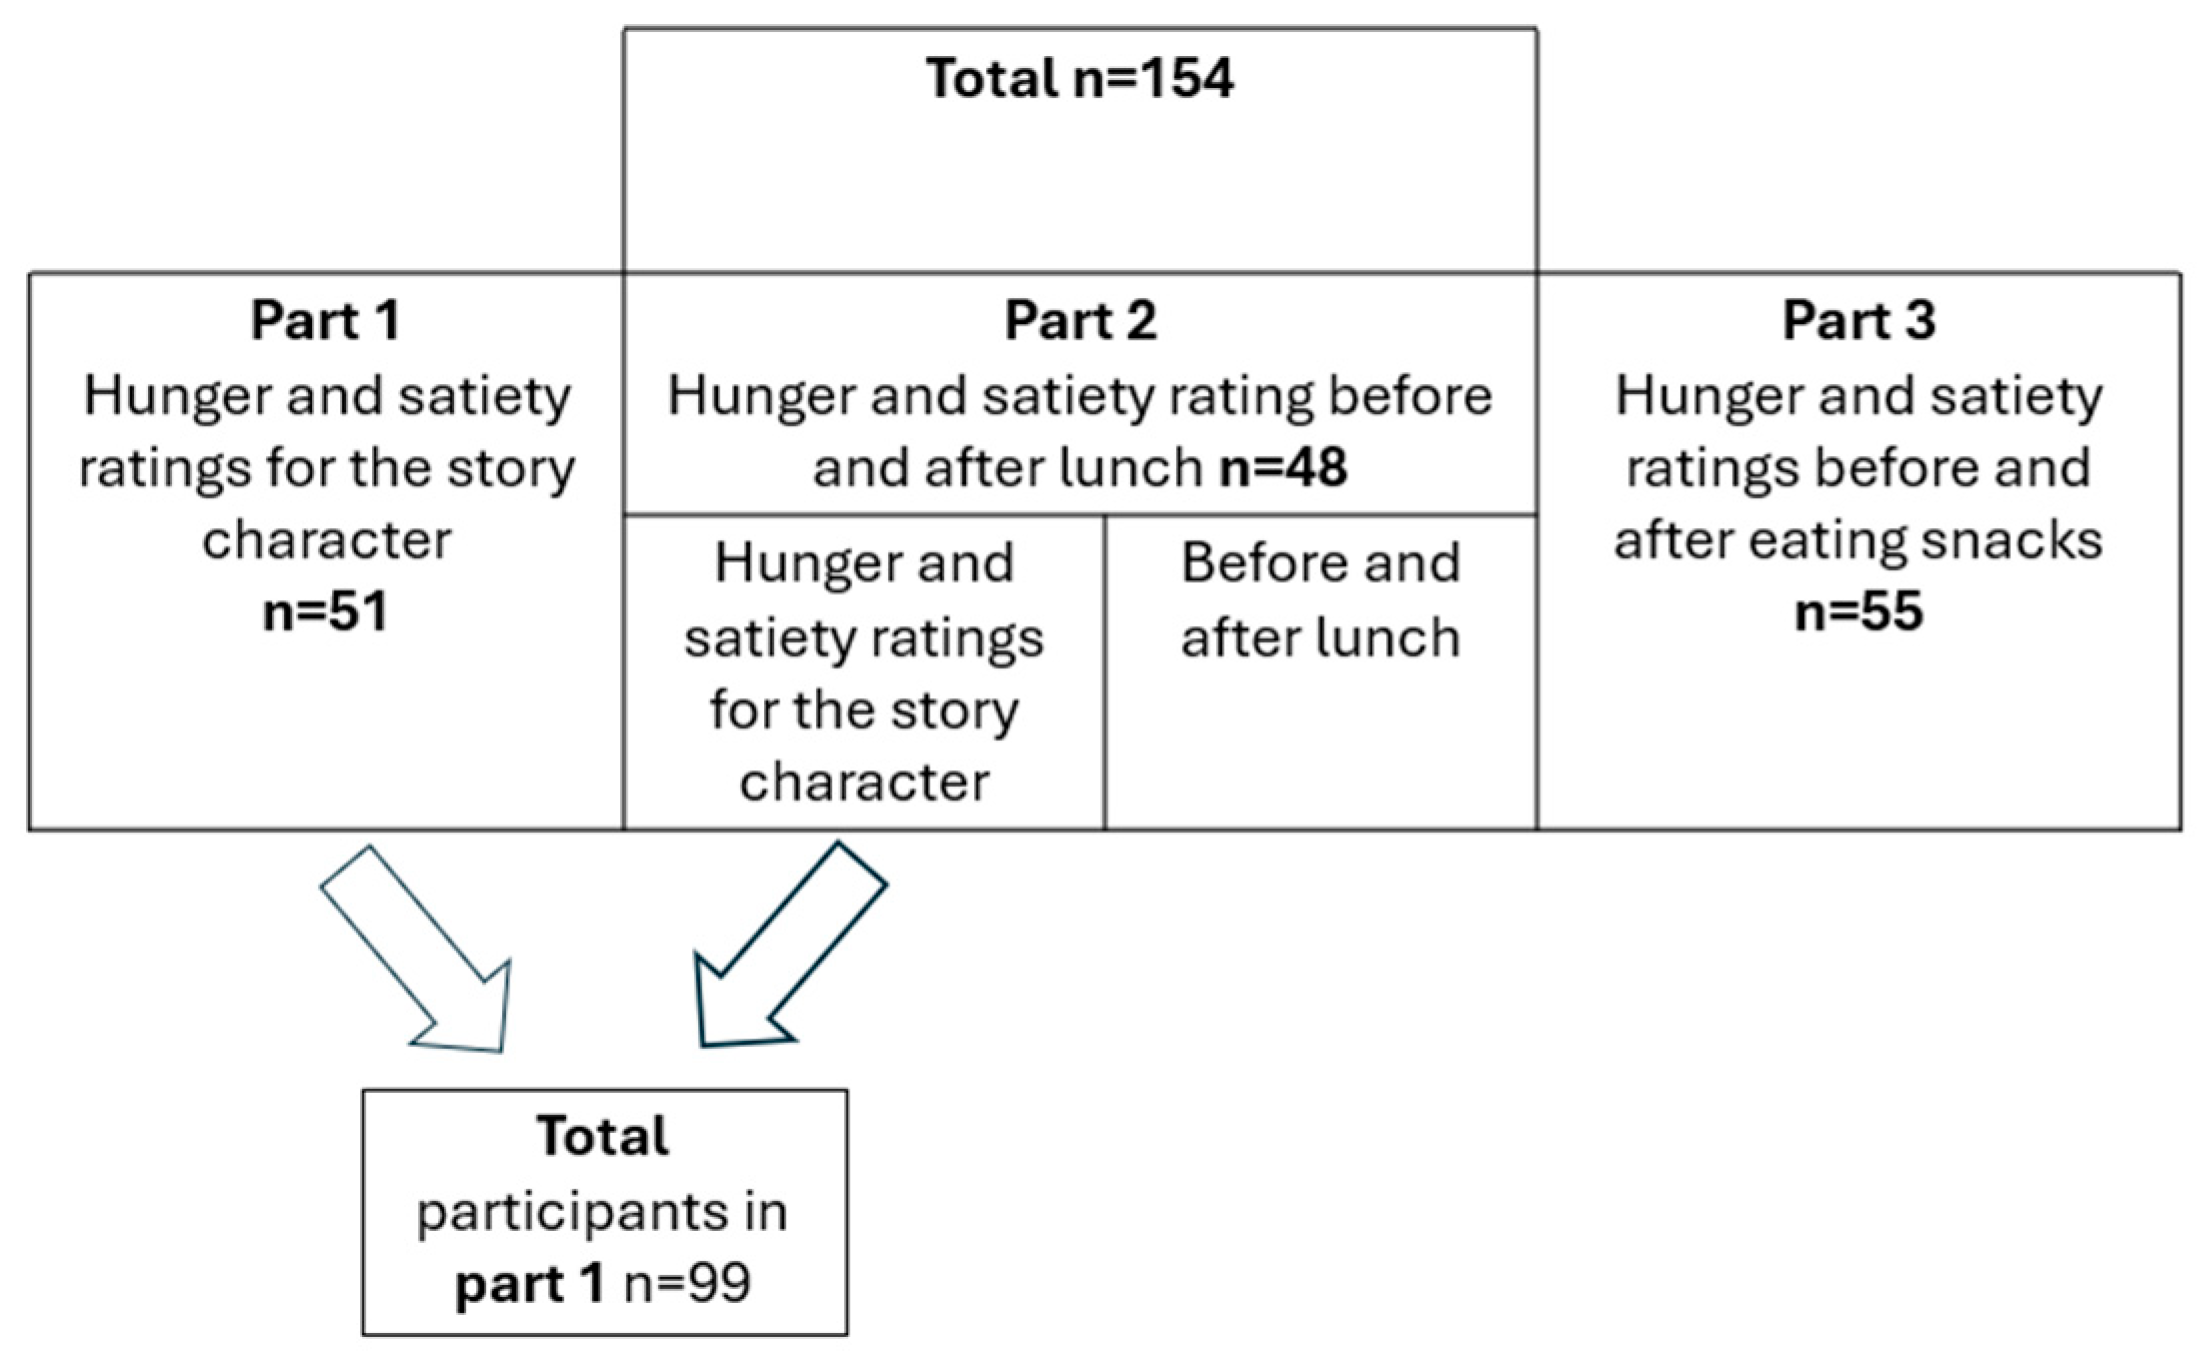
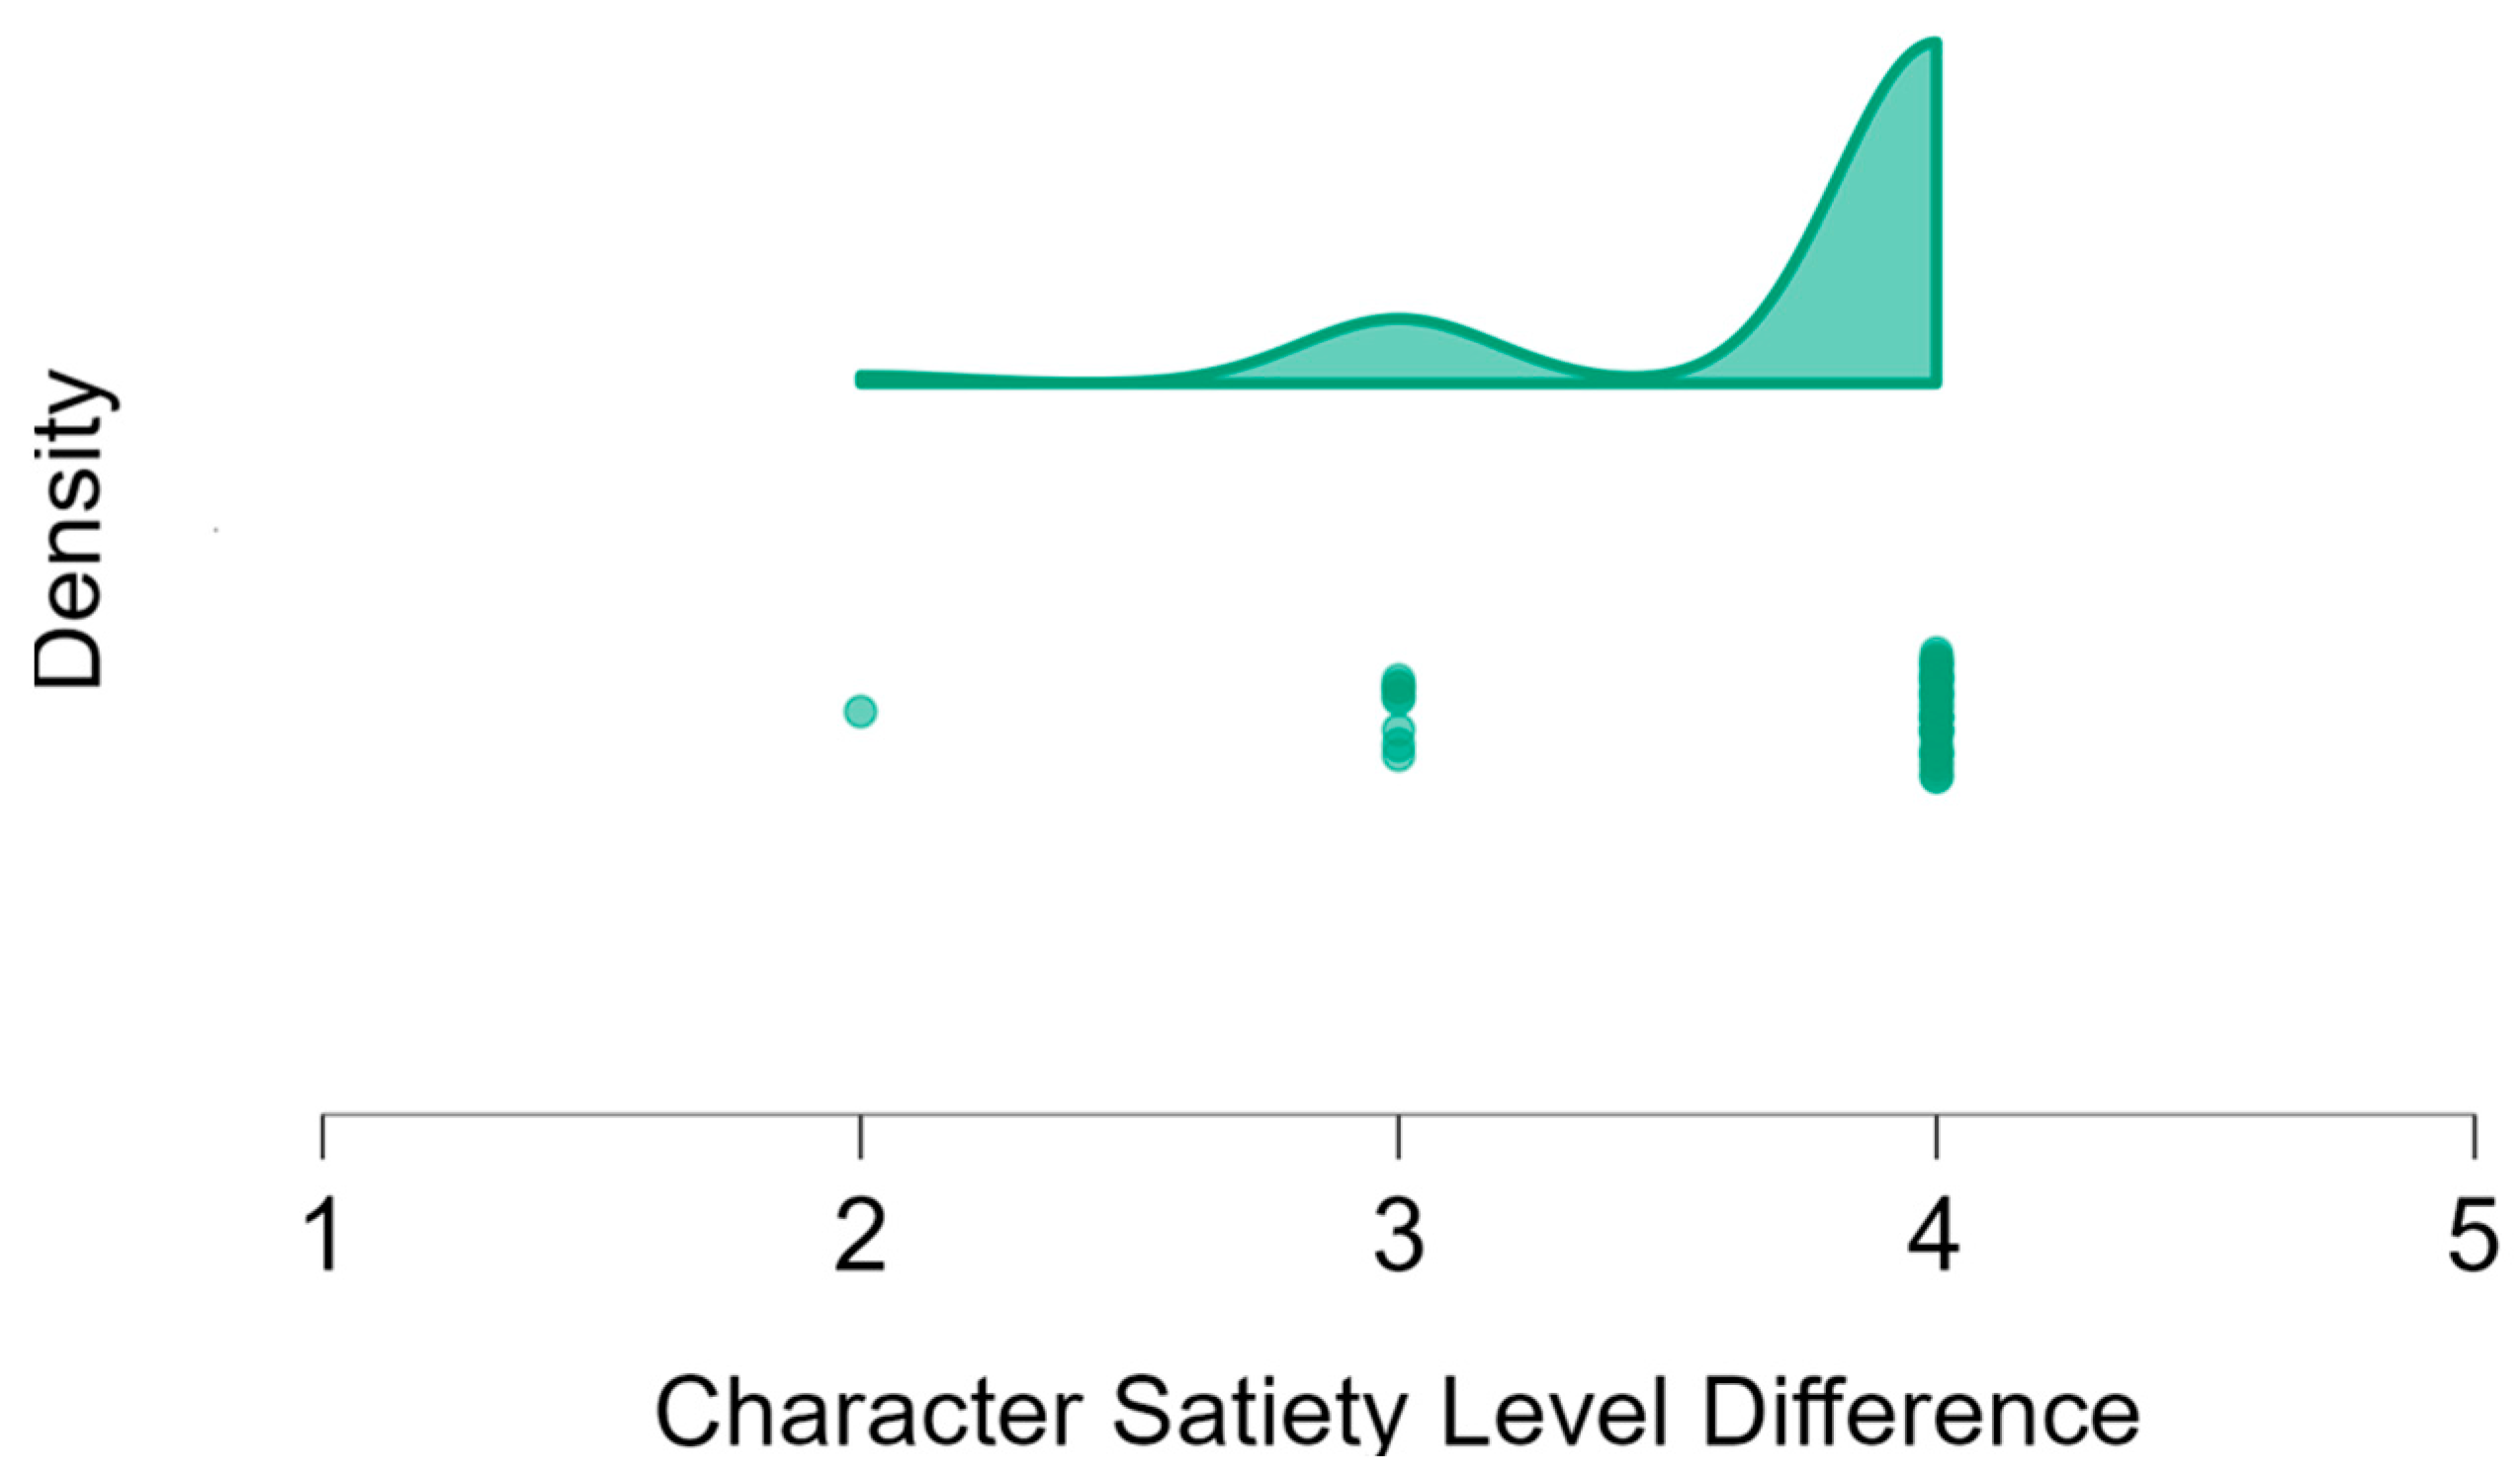
- Fifty-one children met individually with one of 2 study researchers, for 10 min in a quiet space in the community center. The PBAA scale was presented, and the researcher confirmed comprehension by asking “How hungry or full does this character seem to you?” while pointing to each character on the scale. Accuracy in identifying the character’s satiety level served as a gold standard for validating the scale’s concurrent validity (Appendix A), as the children were expected to experience greater satiety after the meal. Such responses would serve as concurrent validation of the research tool.
- Part 2: Lunch-based satiety assessment
- Forty-eight children were assessed upon arriving at the after-school program in the community center and before consuming lunch. The scale and its ratings were explained to the children.
- The researcher read a story to the children, and they were then asked to indicate the level of hunger or satiety of the character in the story as well as their own hunger levels using the scale. For the story comprehension analysis, data from the two parts, 1 and 2, were combined. Because the story component, instructions, and scoring procedures were identical and the samples were mutually exclusive, pooling was appropriate to strengthen the validity assessment while maintaining independent observations.
- Lunch was offered for all the children at the same time, and was identical for all of them (fixed menu of the municipal after-school program for children aged 6–9).
- Post-lunch, children rated their hunger levels again on the scale. If a child rated their hunger like or higher than their ratings before eating, the researcher ensured the child understood the question and verified that the response reflected the child’s true feelings.
- Part 3: Snack-based satiety assessment
- Fifty-five children met individually with the researcher after lunch at the community center. The researcher introduced the PBAA scale to the participants and confirmed their comprehension by asking them “How hungry or sated does the character in the scale seem to be?” for each character.
- Children rated their own hunger levels using the scale.
- Each child was offered a selection of 200 g of apple slices, 200 g of carrot sticks, 200 g of meringue candies, 150 g of jam-filled cookies, 70 g of rice cakes, and 80 g of pretzel sticks (snack options considered to be minimally harmful).
- The child was left alone with the snacks for 10 min, while the researcher stood behind the door, during which time they had been told they could eat freely.
- After 10 min, the researcher returned, removed the snacks, discussed the child’s snack preferences, and two minutes later asked them to rate their hunger again on the scale. If the child rated their hunger similar to or higher than before eating, the researcher ensured they understood the question.
- The association between hunger levels before and after eating snacks was measured according to calories consumed, and food preferences were assessed.
2.3.2. Research Tools
- A rating scale containing pictures of boys (for the boys) or girls (for the girls), comprising a series of five illustrations depicting children with varying amounts of food in their “belly.” The pictures show differently colored children, each with a circle filled to a different level (representing the amount of food) located at the center of their body. These visualizations aim to represent feelings of hunger, ranging from 5 (“very very hungry”) to 1 (“stuffed”). The facial expressions of the illustrated children vary to reflect their hunger levels, and each figure is accompanied by a written description of their hunger levels in Hebrew for children who can read.
- Parent questionnaire.
- Narrative about a child in different states of hunger.
- Measured the quantity of snacks.
2.4. Data Analysis
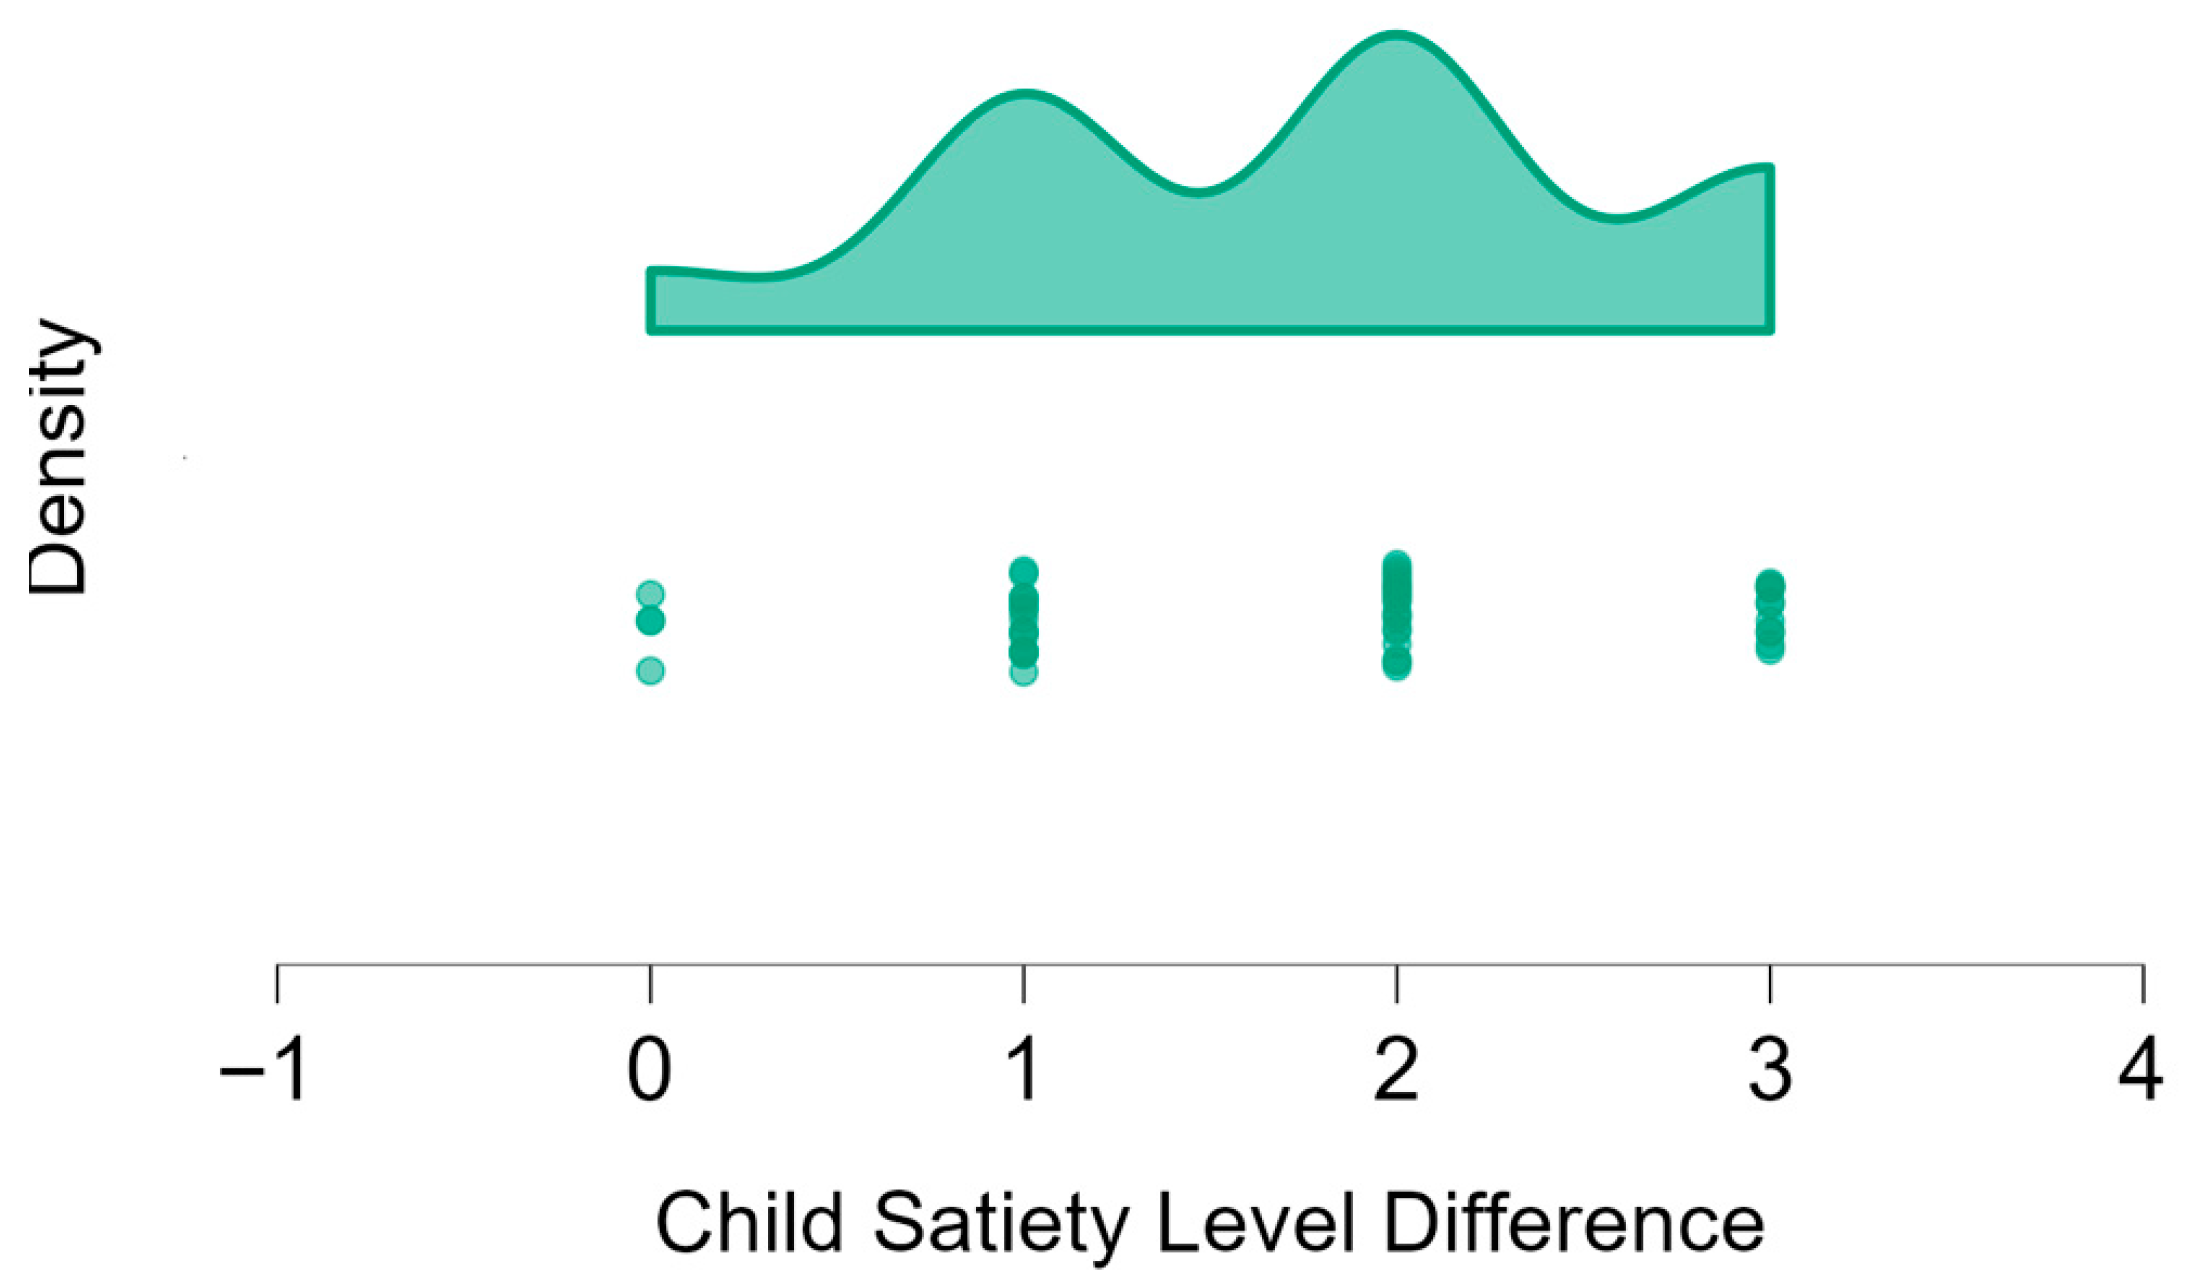
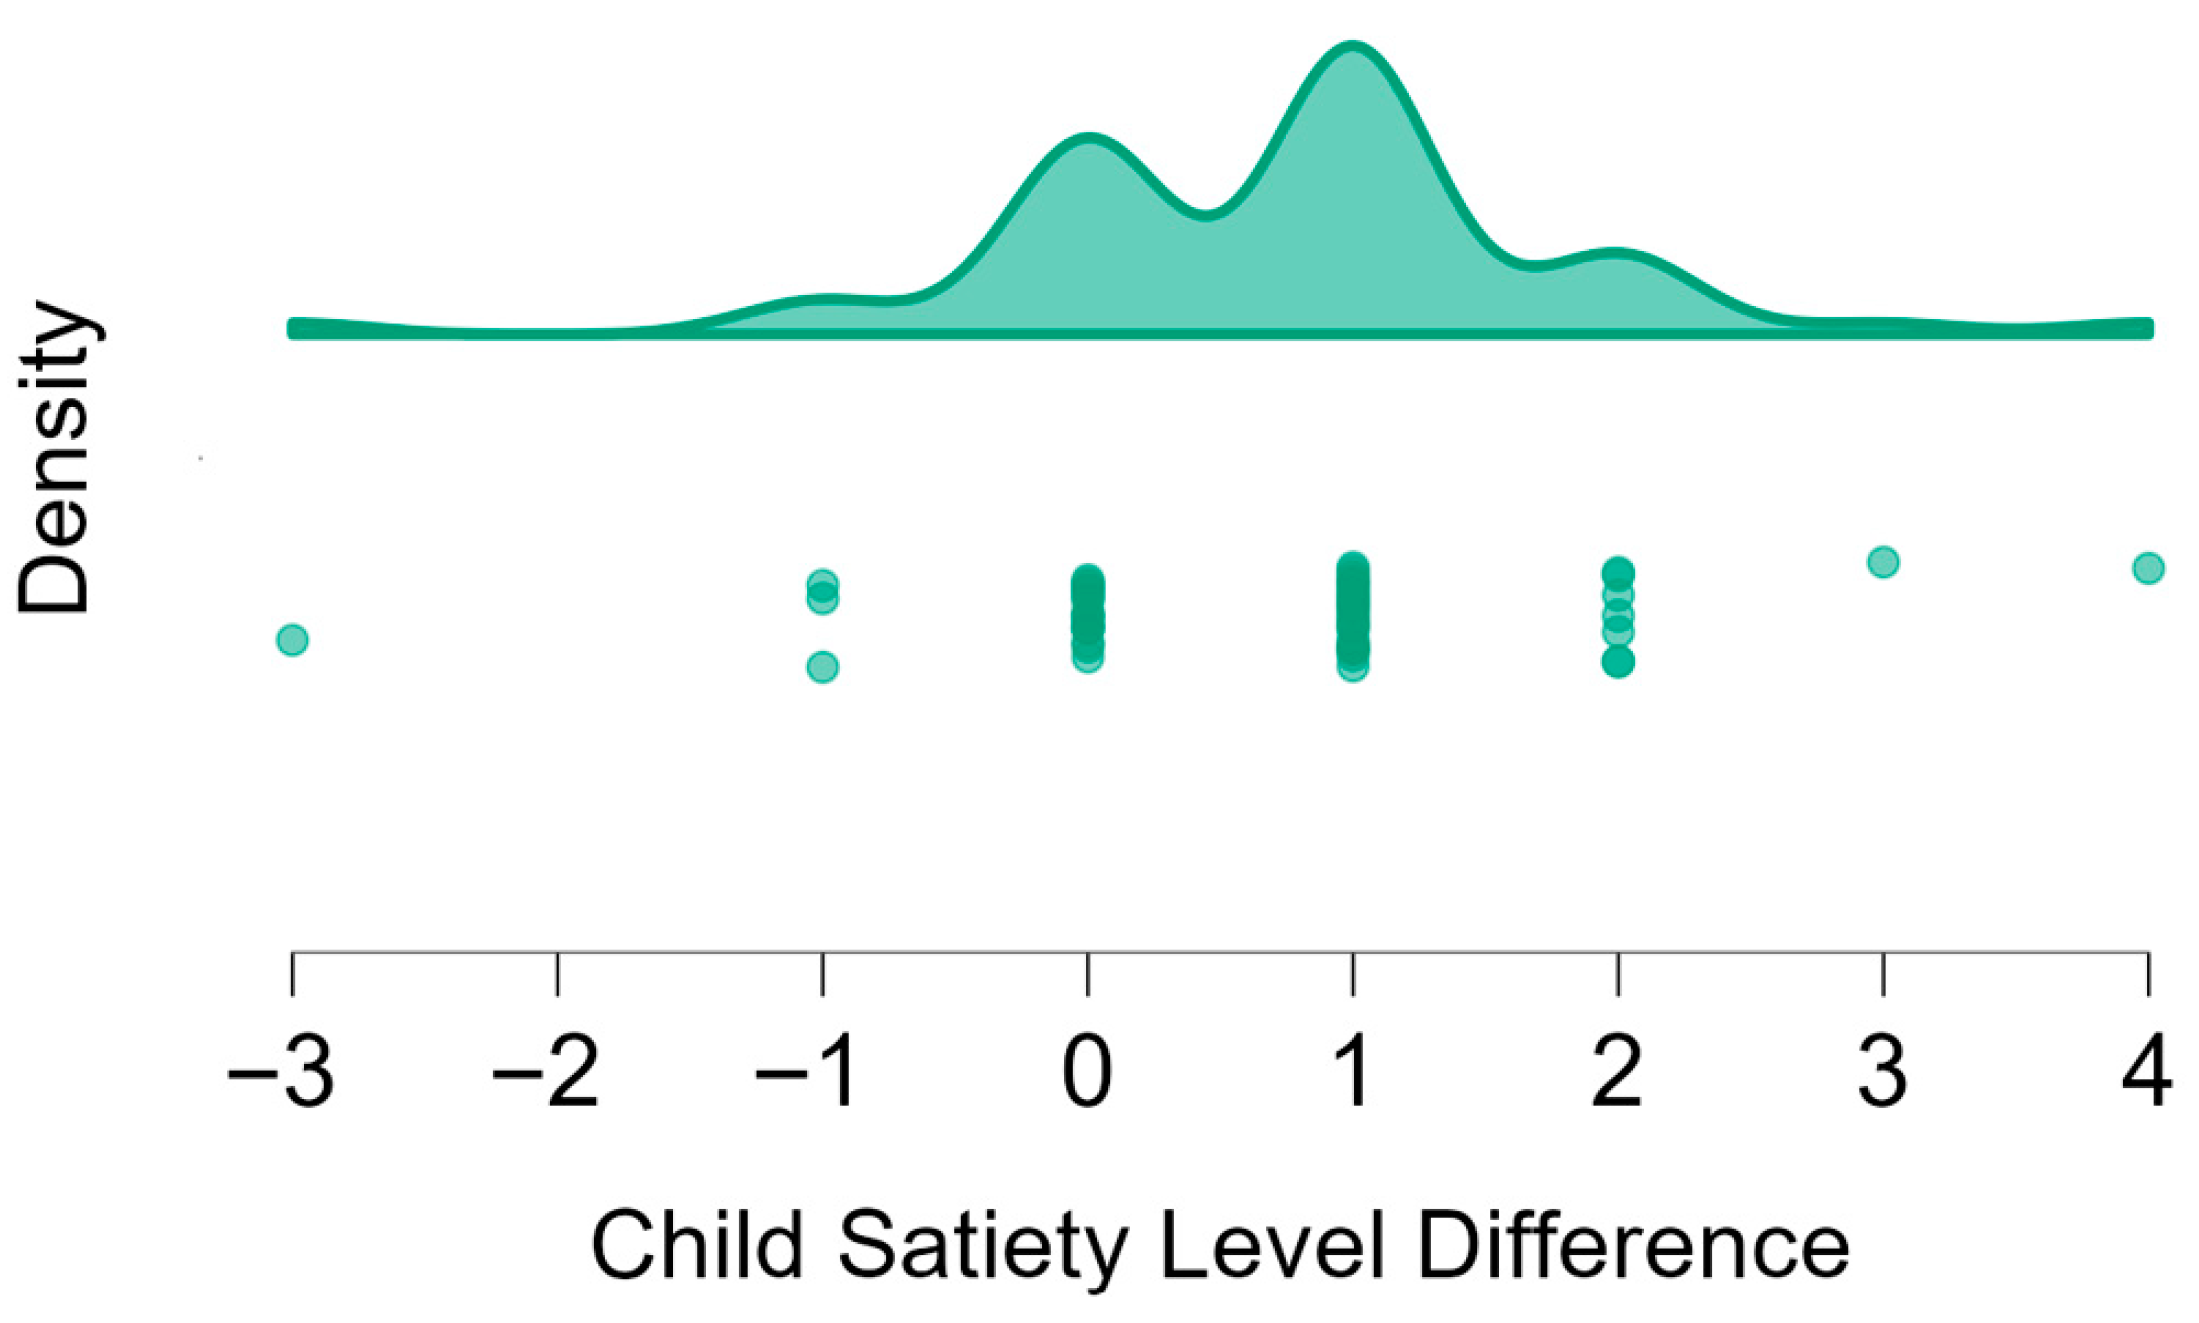
- A Wilcoxon signed rank test was applied for dependent samples to assess whether a significant difference existed in children’s ratings of the hunger/satiety levels of a character in the story at two points in time—before and after a meal (Part 1). In Part 2, a Wilcoxon signed rank test was implemented to examine differences in each child’s personal hunger ratings pre- and post- lunch.
- A Mann-Whitney U test for independent samples was used to evaluate whether sex influenced children’s ratings of hunger for the character in the story, both pre- and post-meal, as well as their own hunger perceptions before and after a meal.
- Spearman rank correlation [ρ] analyses were conducted to determine whether a child’s age impacted their accuracy in assessing the hunger levels of the character before and after a meal, as well as their self-reported hunger levels before and following lunch. No correction for multiple comparisons was applied, consistent with the pilot design and the limited number of planned comparisons.
3. Results
3.1. Part 1: Hunger and Satiety Ratings for the Story Character
3.2. Part 2: Hunger and Satiety Rating Before and After Lunch
3.3. Part 3: Hunger and Satiety Ratings Before and After Eating Snacks
4. Discussion
5. Conclusions
Author Contributions
Funding
Institutional Review Board Statement
Informed Consent Statement
Data Availability Statement
Acknowledgments
Conflicts of Interest
Abbreviations
| PBAA | Picture-Based Appetite Assessment |
| BMI | Body Mass Index |
| WHO | World Health Organization |
| SD | Standard Deviation |
| VAS | Visual Analogue Scale |
| CEBQ | Children’s Eating Behavior Questionnaire |
| JASP | Journal Usage Statistics Portal |
| ρ | Spearman rank correlation |
| Mdn | Median |
| IQR | Interquartile range |
Appendix A. The Appetite Index
Appendix B. The Story in English Version
Appendix C. The Story in Hebrew
References
- Field, A.E.; Cook, N.R.; Gillman, M.W. Weight status in childhood as a predictor of becoming overweight or hypertensive in early adulthood. Obes. Res. 2005, 13, 163–169. [Google Scholar] [CrossRef] [PubMed]
- WHO. WHO Aρnthro Survey Analyser and Other Tools. Available online: https://www.who.int/tools/child-growth-standards/software (accessed on 27 December 2024).
- NCD Risk Factor Collaboration (NCD-RisC). Worldwide trends in body-mass index, underweight, overweight, and obesity from 1975 to 2016: A pooled analysis of 2416 population-based measurement studies in 128.9 million children, adolescents, and adults. Lancet 2017, 390, 2627–2642. [Google Scholar] [CrossRef]
- World Health Organization. Obesity and Overweight. Available online: https://www.who.int/news-room/fact-sheets/detail/obesity-and-overweight (accessed on 16 October 2025).
- Bass, R.; Eneli, I. Severe childhood obesity: An under-recognised and growing health problem. Postgrad. Med. J. 2015, 91, 639–645. [Google Scholar] [CrossRef]
- Chung, Y.L.; Rhie, Y.J. Severe obesity in children and adolescents: Metabolic effects, assessment, and treatment. J. Obes. Metab. Syndr. 2021, 30, 326–335. [Google Scholar] [CrossRef]
- Francis, L.A.; Susman, E.J. Self-regulation and rapid weight gain in children from age 3 to 12 years. Arch. Pediatr. Adolesc. Med. 2009, 163, 297–302. [Google Scholar] [CrossRef] [PubMed]
- Anderson, G.H.; Hunschede, S.; Akilen, R.; Kubant, R. Physiology of food intake control in children. Adv. Nutr. 2016, 7, 232S–240S. [Google Scholar] [CrossRef]
- Mikkilä, V.; Räsänen, L.; Raitakari, O.T.; Pietinen, P.; Viikari, J. Consistent dietary patterns identified from childhood to adulthood: The cardiovascular risk in Young Finns Study. Br. J. Nutr. 2005, 93, 923–931. [Google Scholar] [CrossRef]
- Danielsson, P.; Kowalski, J.; Ekblom, Ö.; Marcus, C. Response of severely obese children and adolescents to behavioral treatment. Arch. Pediatr. Adolesc. Med. 2012, 166, 1103–1108. [Google Scholar] [CrossRef]
- Keller, K.L.; Assur, S.A.; Torres, M.; Lofink, H.E.; Thornton, J.C.; Faith, M.S.; Kissileff, H.R. Potential of an analog scaling device for measuring fullness in children: Development and preliminary testing. Appetite 2006, 47, 233–243. [Google Scholar] [CrossRef]
- Shields, B.J.; Palermo, T.M.; Powers, J.D.; Grewe, S.D.; Smith, G.A. Predictors of a child’s ability to use a visual analogue scale. Child Care Health Dev. 2003, 29, 281–290. [Google Scholar] [CrossRef] [PubMed]
- Wardle, J.; Guthrie, C.A.; Sanderson, S.; Rapoport, L. Development of the Children’s Eating Behaviour Questionnaire. J. Child Psychol. Psychiatry 2001, 42, 963–970. [Google Scholar] [CrossRef]
- Albuquerque, G.; Lopes, C.; Durão, C.; Severo, M.; Moreira, P.; Oliveira, A. Dietary patterns at 4 years old: Association with appetite-related eating behaviours in 7 year-old children. Clin. Nutr. 2018, 37, 189–194. [Google Scholar] [CrossRef]
- Sinopoulou, V.; Harrold, J.; Halford, J. Meaning and assessment of satiety in childhood. In The ECOG’s eBook on Child and Adolescent Obesity; Frelut, M.L., Ed.; European Childhood Obesity Group: Brussels, Belgium, 2015. [Google Scholar]
- Friedman, M.I.; Ulrich, P.; Mattes, R.D. A figurative measure of subjective hunger sensations. Appetite 1999, 32, 395–404. [Google Scholar] [CrossRef] [PubMed]
- Triador, L.; Colin-Ramirez, E.; Mackenzie, M.L.; Tomaszewski, E.; Shah, K.; Gulayets, H.; Field, C.J.; Mager, D.R.; Haqq, A.M. A two-component pictured-based appetite assessment tool is capable of detecting appetite sensations in younger children: A pilot study. Nutr. Res. 2021, 89, 45–55. [Google Scholar] [CrossRef] [PubMed]
- Bennett, C.; Blissett, J. Measuring hunger and satiety in primary school children. Validation of a new picture rating scale. Appetite 2014, 78, 40–48. [Google Scholar] [CrossRef]
- Toni, A.T.; Girma, T.; Hetherington, M.M.; Gonzales, G.B.; Forde, C.G. Appetite and childhood malnutrition: A narrative review identifying evidence gaps between clinical practice and research. Appetite 2025, 207, 107866. [Google Scholar] [CrossRef]
- Adler Institute. Available online: https://machon-adler.co.il/en/ (accessed on 4 July 2025).
- Central Bureau of Statistics. Central Bureau of Statistics Home. Available online: https://www.cbs.gov.il/en/cbsNewBrand/Pages/default.aspx (accessed on 4 July 2025).
- Hammond, L.; Morello, O.; Kucab, M.; Totosy de Zepetnek, J.O.; Lee, J.J.; Doheny, T.; Bellissimo, N. Predictive validity of image-based motivation-to-eat visual analogue scales in normal weight children and adolescents aged 9–14 years. Nutrients 2022, 14, 636. [Google Scholar] [CrossRef]
- Monteiro, C.A.; Cannon, G.; Levy, R.B.; Moubarac, J.C.; Louzada, M.L.; Rauber, F.; Khandpur, N.; Cediel, G.; Neri, D.; Martinez-Steele, E.; et al. Ultra-processed foods: What they are and how to identify them. Public Health Nutr. 2019, 22, 936–941. [Google Scholar] [CrossRef]
- Cooke, L.J.; Wardle, J. Age and gender differences in children’s food preferences. Br. J. Nutr. 2005, 93, 741–746. [Google Scholar] [CrossRef]
- Grzymisławska, M.; Puch, E.A.; Zawada, A.; Grzymisławski, M. Do nutritional behaviors depend on biological sex and cultural gender? Adv. Clin. Exp. Med. 2020, 29, 165–172. [Google Scholar] [CrossRef] [PubMed]
- Cheng, Y.; Wu, X. The relationship between SES and reading comprehension in Chinese: A mediation model. Front. Psychol. 2017, 8, 672. [Google Scholar] [CrossRef] [PubMed]
| Participants | n (%) | Mdn (IQR) | Before/After * | p-Value | |||
|---|---|---|---|---|---|---|---|
| All | Rated 5 Before Meal | Rated 1 After Meal | Before Meal | After Meal | |||
| All | 99 (100) | 96 (97.0) | 84 (84.8) | 5 (0) | 1 (0) | 8.55 | <0.001 |
| Boys | 49 (45.5) | 46 (93.9) | 41 (83.7) | 5 (0) | 1 (0) | 5.97 | <0.001 |
| Girls | 50 (55.5) | 50 (100.0) | 43 (86.0) | 5 (0) | 1 (0) | ** | |
| Participants | n (%) | Rating Before Lunch Mean ± SD | Rating After Lunch Mean ± SD | Mdn (IQR) | Z * | p-Value | |
|---|---|---|---|---|---|---|---|
| Before Lunch | After Lunch | ||||||
| All | 46(100) | 4.02 ± 0.33 | 2.20 ± 0.89 | 4 (1) | 2 (0) | 5.71 | <0.001 |
| Boys | 20(43.5) | 4.10 ± 0.31 | 1.90 ± 0.91 | 4 (1.3) | 2 (0) | 3.82 | <0.001 |
| Girls | 26(56.5) | 3.96 ± 0.34 | 2.42 ± 0.81 | 4 (1) | 2 (0) | 4.27 | <0.001 |
| Participants | n (%) | Rating Pre-Snacks Mean ± SD | Rating After Snacks Mean ± SD | Mdn (IQR) | Z * | p-Value | |
|---|---|---|---|---|---|---|---|
| Before | After | ||||||
| All | 55(100) | 4.04 ± 0.69 | 3.31 ± 0.84 | 4 (1) | 3 (1) | 4.21 | <0.001 |
| Boys | 25(45.5) | 3.96 ± 0.94 | 3.40 ± 0.77 | 4 (1) | 4 (0) | 2.22 | 0.019 |
| Girls | 30(55.5) | 4.10 ± 0.40 | 3.20 ± 0.89 | 4 (1) | 3 (0) | 3.72 | <0.001 |
| Statistical Parameter | Snack Type (Grams) | Total Caloric Intake (Kcal) | |||||
|---|---|---|---|---|---|---|---|
| Apples | Carrots | Breakfast Cereals | Jam-Filled Cookies | Rice Crispies | Salty Sticks | ||
| Mean | 5.5 | 2.7 | 68.7 | 93.7 | 25.1 | 32.2 | 233.4 |
| SD | 11.5 | 5.3 | 142.7 | 110.6 | 33 | 46.2 | 197.2 |
Disclaimer/Publisher’s Note: The statements, opinions and data contained in all publications are solely those of the individual author(s) and contributor(s) and not of MDPI and/or the editor(s). MDPI and/or the editor(s) disclaim responsibility for any injury to people or property resulting from any ideas, methods, instructions or products referred to in the content. |
© 2025 by the authors. Licensee MDPI, Basel, Switzerland. This article is an open access article distributed under the terms and conditions of the Creative Commons Attribution (CC BY) license (https://creativecommons.org/licenses/by/4.0/).
Share and Cite
Eilat-Adar, S.; Zeevi, Y.; Shaked, E.; Rabih, Y.; Zach, S. Assessing Appetite–Validation of a Picture-Based Appetite Assessment Tool for Children Aged 6–9 Years—A Pilot Study. Nutrients 2025, 17, 3347. https://doi.org/10.3390/nu17213347
Eilat-Adar S, Zeevi Y, Shaked E, Rabih Y, Zach S. Assessing Appetite–Validation of a Picture-Based Appetite Assessment Tool for Children Aged 6–9 Years—A Pilot Study. Nutrients. 2025; 17(21):3347. https://doi.org/10.3390/nu17213347
Chicago/Turabian StyleEilat-Adar, Sigal, Yoav Zeevi, Efrat Shaked, Yael Rabih, and Sima Zach. 2025. "Assessing Appetite–Validation of a Picture-Based Appetite Assessment Tool for Children Aged 6–9 Years—A Pilot Study" Nutrients 17, no. 21: 3347. https://doi.org/10.3390/nu17213347
APA StyleEilat-Adar, S., Zeevi, Y., Shaked, E., Rabih, Y., & Zach, S. (2025). Assessing Appetite–Validation of a Picture-Based Appetite Assessment Tool for Children Aged 6–9 Years—A Pilot Study. Nutrients, 17(21), 3347. https://doi.org/10.3390/nu17213347


