Article

Isorhamnetin Exhibits Hypoglycemic Activity and Targets PI3K/AKT and COX-2 Pathways in Type 1 Diabetes

1
School of Public Health, Fujian Medical University, Fuzhou 350005, China
2
Key Laboratory of Functional and Clinical Translational Medicine, Xiamen Medical College, Universities of Fujian Province, Xiamen 361005, China
*
Author to whom correspondence should be addressed.
These authors contributed equally to this work.
Nutrients 2025, 17(20), 3201; https://doi.org/10.3390/nu17203201 (registering DOI)
Submission received: 26 August 2025 / Revised: 1 October 2025 / Accepted: 9 October 2025 / Published: 11 October 2025
(This article belongs to the Special Issue Hypoglycemic Properties and Pathways of Natural Substances)

Abstract

Background: Isorhamnetin (ISO), a dietary O-methylated flavonol, was evaluated for hypoglycemic activity and mechanism in a streptozotocin (STZ) model of type 1 diabetes. Methods: We conducted untargeted plasma metabolomics (ESI±), network integration and docking, and measured pancreatic PI3K, phosphorylated AKT, and COX-2; INS-1 β cells challenged with the PI3K inhibitor LY294002 were used to assess viability, intracellular ROS, and PI3K phosphorylation. Results: ISO lowered fasting glycemia, increased circulating insulin, improved dyslipidemia by reducing low-density lipoprotein cholesterol (LDL-C), and preserved islet architecture. Untargeted plasma metabolomics (ESI±) indicated broad remodeling with enrichment of arachidonic-, linoleic-, starch/sucrose- and glycerophospholipid pathways. Network integration and docking prioritized targets converging on PI3K/AKT and COX-2/eicosanoid signaling. Consistently, in pancreatic tissue, ISO increased PI3K, phosphorylated AKT, and reduced COX-2. In INS-1 beta cells challenged with the PI3K inhibitor LY294002, ISO improved viability, decreased intracellular ROS, and partially restored PI3K phosphorylation at 4 µM. Conclusions: Together, these data indicate that ISO exerts hypoglycemic effects while supporting β-cell integrity through activation of PI3K/AKT and tempering of COX-2–linked lipid-mediator pathways. ISO therefore emerges as a food-derived adjunct candidate for autoimmune diabetes, and the work motivates targeted lipidomics and in vivo pathway interrogation in future studies.

1. Introduction

Type 1 diabetes mellitus (T1DM) arises from autoimmune β-cell destruction, producing absolute insulin deficiency and sustained hyperglycemia [1]. Even with modern insulin regimens, durable control is difficult, and complications remain common, which motivates adjunct strategies that stabilize metabolism and protect islet tissue. Against this backdrop, identifying adjunct antihyperglycemic agents remains a priority—not to replace insulin in T1DM, but to complement it, blunt glycemic excursions, and mitigate complications. Major antihyperglycemic drug classes include insulin and, more broadly for diabetes care, metformin, sulfonylureas, thiazolidinediones, α-glucosidase inhibitors, GLP-1 receptor agonists, DPP-4 inhibitors, and SGLT2 inhibitors; however, most non-insulin agents were developed for T2DM and have limited or risk-laden use in T1DM (e.g., ketosis risk with SGLT2 inhibitors).
Isorhamnetin (ISO; 3′-O-methylquercetin) is a dietary flavonol present in Hippophae rhamnoides and Ginkgo biloba and edible plants such as onions and tomatoes, which have been used in traditional diets/remedies with reported antihyperglycemic effects, making ISO a plausible food-derived candidate [2,3]. Beyond its provenance, ISO has been linked to improvements in glucose and lipid handling [2,4]. Mechanistic reports point to several nodes relevant to diabetes: activation of phosphoinositide 3-kinase (PI3K)/AKT [5], engagement of nuclear factor erythroid 2–related factor 2 (Nrf2) with possible AMP-activated protein kinase (AMPK) participation [6], attenuation of cyclooxygenase-2 (COX-2) with implications for arachidonic-acid-derived mediators [7], and promotion of glucose transporter 4 (GLUT4) trafficking in skeletal muscle [4]. These actions support evaluating ISO as an adjunct in insulin-deficient settings.
What remains unclear is whether such effects translate to insulin-deficient diabetes and, specifically, whether ISO can support β-cell integrity via PI3K/AKT while moderating COX-2/eicosanoid signaling in an integrated manner [8,9]. Here, we evaluate ISO in an STZ-induced T1DM model and combine plasma metabolomics with network analysis and β-cell assays to map pathway involvement in the pancreas, focusing on PI3K/AKT and COX-2–linked axes [5,7,10,11]. Given ISO’s occurrence in commonly consumed plants, the findings may inform food-derived strategies for β-cell support [2,3].
We adopted a discovery-to-validation strategy: untargeted plasma metabolomics to nominate pathways, followed by network integration and targeted validation in the pancreas and β-cells under PI3K blockade (LY294002), with weekly fasting blood-glucose trajectories complementing endpoint measures. Our primary objective was to determine whether isorhamnetin (ISO) ameliorates hyperglycemia and preserves islet architecture in an STZ-induced T1DM model; secondarily, we sought to identify ISO-modulated pathways and validate key signals using pharmacological PI3K inhibition as a mechanistic probe. Importantly, this study was prospectively designed as a mechanism-focused investigation of β-cell support, not a head-to-head pharmacological efficacy trial of an antihyperglycemic agent.

2. Materials and Methods

2.1. Reagents and Chemicals

Isorhamnetin (ISO; ≥98% by HPLC; Shanghai Macklin Biochemical Co., Ltd., Shanghai, China; Cat. No. I811872, commercial standard, not a plant extract) was dissolved in DMSO to prepare a 100 mM stock and was stored at −20 °C, protected from light. For intraperitoneal (i.p.) dosing, working solutions contained 2% DMSO and 20% PEG-400 in PBS; the dose volume was 10 mL/kg. Streptozotocin (STZ, Shanghai Macklin Biochemical Co.) was freshly prepared on ice in 0.1 M sodium-citrate buffer (pH 4.5) and used within 15 min. Dexamethasone (DXM; Solarbio Life Sciences, Beijing, China) was prepared according to the manufacturer’s instructions. LC–MS-grade acetonitrile, methanol, and formic acid were used for metabolomics. Antibodies: P-PI3K (p85 Tyr458/p55 Tyr199; ZenBio, Durham, NC, USA, Cat#310164); PI3K (p85α; Cell Signaling Technology, Danvers, MA, USA, Cat#4292S); COX-2 (Proteintech, Rosemont, IL, USA, Cat#12375-1-AP); BCL-2 (HUABIO, Cambridge, MA, USA, Cat#ET1702-53); PTGER2 (HUABIO, Cat#HA721380); AKT1/2/3 (HUABIO, Cat#ET1609-51); phospho-AKT (Ser473; HUABIO, Cat#ET1607-73); β-actin (HUABIO, Cat#ET1701-80). Secondary antibodies: HRP-conjugated secondary antibodies (HUABIO). Standard reagents (BCA, DCFH-DA, CCK-8, RPMI-1640, trypsin, penicillin–streptomycin) were used as indicated.

2.2. Animals and Experimental Design

Specific-pathogen-free male C57BL/6 mice (6–8 weeks, ~20 g) were housed at 22–25 °C, 45–55% humidity, 12 h light/dark, with standard chow and water ad libitum (3–5 per cage, environmental enrichment). Only males were used to reduce estrous-cycle–related variability in this STZ model. All procedures were approved by the Animal Ethics Committee of Xiamen Medical College (No. 20240207015; 7 February 2024) and followed ARRIVE guidelines.
Mice were block-randomized by computer (n = 10 per group) into Normal (PBS + PBS), T1DM (STZ 50 mg/kg + PBS), DXM (STZ 50 mg/kg + DXM 10 mg/kg), L-ISO (STZ 50 mg/kg + ISO 20 mg/kg), and H-ISO (STZ 50 mg/kg + ISO 40 mg/kg). Streptozotocin (STZ) is a β-cell–selective nitrosourea transported by GLUT2 that induces DNA alkylation and oxidative stress, causing insulin deficiency and persistent hyperglycemia. We therefore used STZ to generate an insulin-deficient T1DM model in which ISO could be tested, providing a predefined disease background against which ISO’s effects on glycemia and islet morphology could be prospectively evaluated. Dexamethasone (DXM) was included as a mechanistic anti-inflammatory comparator (COX-2/arachidonate repression), not as a glucose-lowering positive control.
After a 1-week acclimation (W−1 to W0), diabetes was induced with STZ i.p. once daily for 7 days during W0–W1 (08:00–10:00). Pharmacological interventions started at W0 and continued once daily for 14 days (W0–W2): ISO (20 or 40 mg/kg) or DXM (10 mg/kg), all given i.p. Following the treatment window, animals were observed drug-free from W2 to W7 to assess durability of effects, and tissues were collected at W7.
Outcome schedule and inclusion criteria. FBG was measured weekly from W0 to W7 after a 12 h fast (baseline, during induction/treatment, and throughout drug-free follow-up). Diabetes induction required FBG ≥ 11.1 mmol/L on two measurements after a 12 h fast. Unless otherwise specified, W0–W7 refers to study week counted from W0. Each group initially included 10 animals (n = 10), all monitored for FBG, body weight, and survival. All surviving mice at W7 were analyzed for biochemical indices and organ weights. For histological assessment, three pancreata per group were randomly selected for sectioning and morphometric analysis (≥20 islets per animal). For Western blot validation, pancreatic tissue from three animals per group (n = 3) was used.

2.3. Biochemical and Histological Analyses

At W7, mice were fasted 12 h and anesthetized with isoflurane (3–5% induction; 1–2% maintenance) on a warming pad. Blood was collected by cardiac puncture; serum was stored at −80 °C. FBG was measured by the glucose-oxidase method with a handheld meter; serum insulin (INS) was quantified by enzyme-linked immunosorbent assay (ELISA). Liver and kidney were weighed to compute organ indices, defined as organ index (%) = organ weight (g)/body weight (g) × 100; the liver index used the whole liver weight, and the renal index used the combined weight of both kidneys. Pancreata were fixed in 4% paraformaldehyde, embedded in paraffin, sectioned at 3 µm and stained with hematoxylin and eosin (H&E). Morphometry used 5 sections per pancreas (150 µm apart), ≥20 islets per animal, and two blinded raters in ImageJ v1.53t.

2.4. Untargeted Metabolomics

Plasma (100 µL) was extracted with methanol (1:4, v/v), vortexed 30 s, ultrasonicated 10 min, incubated at 4 °C for 1 h and centrifuged (15,000 g, 10 min). Supernatants were dried under nitrogen and reconstituted in acetonitrile–water (1:1, v/v; 100 µL), then analyzed by LC–MS on a Xevo G2-XS QToF with an ACQUITY UPLC BEH C18 column (2.1 mm × 50 mm, 1.8 µm). Mobile phases: 0.01% formic acid in water (A) and acetonitrile (B); gradient 0–1 min 10% B, 1–7.5 min 10–65% B, 7.5–10.5 min 65–100% B, 10.5–12 min 100–10% B; 0.4 mL/min; 1 µL injection. Data were acquired in MSe mode with settings: m/z 50–1200; spray 2.85 kV; source 400 °C; leucine-enkephalin lock mass (m/z 556.2771 for ESI+, and 554.2615 for ESI−). Injections were randomized; blanks were interleaved; and a pooled QC was run every ten injections.
Raw files (MassLynx 4.1) were processed in Progenesis QI (alignment tolerances 10 ppm/0.2 min; adducts +H/−H). Features present in blanks (≥20% of sample intensity) or with quality-control relative standard deviation (QC-RSD) > 30% were removed. Data were normalized by probabilistic quotient normalization (PQN). Statistics (PCA, OPLS-DA, volcano plots) and KEGG pathway enrichment were conducted in MetaboAnalyst 6.0 with Benjamini–Hochberg false discovery rate (FDR) control (q < 0.05). Model validity was checked by 7-fold cross-validation, CV-ANOVA (p < 0.01) and 1000 permutations.

2.5. Network Pharmacology and Molecular Docking

Putative ISO targets were retrieved from SwissTargetPrediction (probability ≥ 0.1), and PharmMapper (max conformers = 300; pharmacophore models with pKd ≥ 6.0); STRING v11.5 PPI networks were built at confidence ≥ 0.7. T1DM-associated genes were compiled from GeneCards (relevance ≥ 1), OMIM and TTD. Queries were performed in May 2025; target names were de-duplicated and standardized via UniProt. Overlapping targets were submitted to STRING v11.5 (Homo sapiens; confidence ≥ 0.7) to build the protein–protein interaction (PPI) network and analyzed in Cytoscape 3.9.0 (CentiScape). Gene Ontology (GO), Kyoto Encyclopedia of Genes and Genomes (KEGG), and Reactome enrichment were performed in DAVID and Reactome, with Benjamini–Hochberg FDR < 0.05 considered significant.
For docking, ISO was prepared in its protonation state at pH 7.4. Representative human structures (resolution ≤ 3.0 Å) for hub proteins (e.g., AKT1, PTGS2, PPARG, EGFR, ESR1, SRC) were obtained from the RCSB Protein Data Bank (PDB). The CB-DOCK2 server predicted binding cavities.

2.6. Western Blotting

Pancreatic tissue or INS-1 cells were lysed in radioimmunoprecipitation assay (RIPA) with phenylmethylsulfonyl fluoride (PMSF) and phosphatase inhibitors. Protein was quantified by BCA. Equal amounts (10–20 µg) were separated by SDS–PAGE (10–12%) and transferred to polyvinylidene difluoride (PVDF). Membranes were blocked (5% milk/TBST, 1 h, RT), incubated with primary antibodies (1:1000; β-actin 1:5000) overnight at 4 °C, then with HRP-conjugated secondary antibodies (1:5000) for 1 h. Chemiluminescence was captured on a ChemStudio 515 imaging system (Analytik Jena, Germany) within the linear range; densitometry (ImageJ) was normalized to β-actin, which did not differ across groups. Each “n” denotes a biological replicate; for pancreatic Western blots, n = 3 animals per group.

2.7. Cell-Based Assays

INS-1 β-cells (RRID: CVCL_0351; authenticated, mycoplasma-free) were maintained in RPMI-1640 with 10% FBS, 1% penicillin–streptomycin and 50 µM β-mercaptoethanol at 37 °C, 5% CO2 in a humidified incubator. Cells (2 × 10⁴ per well) were seeded in 96-well plates 24 h before treatment. LY294002 (5, 10, 15 µM) was applied for 24 h with or without ISO (1, 2, 4 µM). For clarity, the experimental groups were: Vehicle (0.1% DMSO); ISO 1 µM; ISO 2 µM; ISO 4 µM; LY294002 5 µM (LY5); LY294002 10 µM (LY10); LY294002 15 µM (LY15); LY5 + ISO1; LY5 + ISO2; LY5 + ISO4; LY10 + ISO1; LY10 + ISO2; LY10 + ISO4; LY15 + ISO1; LY15 + ISO2; LY15 + ISO4. All conditions were matched for final DMSO (≤0.1%). Unless otherwise indicated in figure legends, panels illustrating PI3K blockade use LY294002 at 10 µM (LY10). Viability was measured by Cell Counting Kit-8 (CCK-8) at 450 nm. Intracellular ROS was assessed with 10 µM 2′,7′-dichlorodihydrofluorescein diacetate (DCFH-DA) (30 min, 37 °C, dark) with excitation/emission at 488/525 nm, and ROS signals were normalized to per-well viability. Each condition included ≥3 biological replicates (independent passages), each with 3 technical wells.

2.8. Statistical Analysis

Data are reported as mean ± SEM unless otherwise stated. Comparisons between two or more groups used parametric or non-parametric tests as appropriate. Normality and homoscedasticity were assessed using Shapiro–Wilk and Levene tests. Analyses then followed assumption-based branches: if data were normal with equal variances, Student’s t-test or one-way ANOVA with Tukey’s post hoc was used; if data were non-normal, Mann–Whitney U or Kruskal–Wallis with Dunn’s post hoc was used; if variances were unequal, Welch’s t-test or Welch’s ANOVA with Games–Howell was used. Exact p-values are reported where space permits. For multiple endpoints, Holm–Šidák adjustment was applied; for metabolomics, FDR was controlled at q < 0.05. Orthogonal partial least squares–discriminant analysis (OPLS-DA) models were validated by 7-fold cross-validation, cross-validation analysis of variance (CV-ANOVA) (p < 0.01) and 1000 permutations.

2.9. Prespecified Endpoints and Dose Rationale

Primary endpoint: fasting blood glucose (FBG). Secondary endpoints: serum insulin, LDL-C/HDL-C, liver/kidney indices, and relative islet area. Mechanistic endpoints: plasma metabolomics (arachidonic-acid, linoleic-acid, glycerophospholipid and carbohydrate pathways), pancreatic PI3K/AKT and COX-2 proteins, and β-cell assays under PI3K inhibition (LY294002) evaluating viability and intracellular ROS. Dose and route rationale: ISO was administered i.p. at 20 or 40 mg/kg for 14 days to minimize exposure variability from oral absorption and to remain within commonly used in vivo ranges aligned with PI3K/AKT and eicosanoid-linked mechanisms. The dosing vehicle contained 2% DMSO and 20% PEG-400 in PBS.

3. Results

3.1. ISO Improves Glycemic Control, Lipid Profile, and Islet Integrity in T1DM Mice

In STZ-induced diabetic mice, marked metabolic disturbances were observed versus Normal, including significant weight loss (p < 0.0001) and elevated fasting blood glucose (FBG; p < 0.0001). Weekly FBG trajectories (Figure 1B) from W0 to W7 showed sustained hyperglycemia in T1DM; ISO showed a delayed but significant effect, first evident at W6 in L-ISO and W7 in H-ISO, with L-ISO providing the more consistent control. At the W7 endpoint, ISO significantly lowered FBG (L-ISO p < 0.01; H-ISO p < 0.05) and increased plasma insulin in L-ISO (p < 0.05; Figure 1B,C). Lipid profiling confirmed elevated LDL-C and reduced HDL-C in T1DM mice; ISO reduced LDL-C (L-ISO p < 0.01; H-ISO p < 0.05), while HDL-C showed a non-significant upward trend (Figure 1D,E). Organ indices were altered: the T1DM group exhibited an increased liver index versus Normal (p < 0.0001) and an increased renal index (p < 0.001); ISO mitigated these changes, with L-ISO reducing both indices and H-ISO improving the renal index (Figure 1F,G). Histology (Figure 1H,I) showed that T1DM islets were shrunken with disorganized cords, whereas ISO preserved islet size and contour and improved cellularity. Dexamethasone (DXM) was included as a mechanistic anti-inflammatory comparator (COX-2/arachidonate repression), not as an antihyperglycemic positive control.

3.2. ISO Modulates Metabolic Profiles and Key Pathways in T1DM

Untargeted metabolomics detected 4260 and 3908 ion features in ESI+ and ESI modes, respectively (Tables S1 and S2). Annotation with the Human Metabolome Database (HMDB) yielded putative identities for 255 metabolites (ESI+) and 288 (ESI). Principal-component analysis (PCA) showed groupwise shifts with partial separation among Normal, T1DM, and T1DM+L-ISO, indicating systemic metabolic remodeling under disease and treatment (Figure 2A). Supervised OPLS-DA further achieved clear discrimination in both ion modes for Normal vs. T1DM and for T1DM vs. T1DM+L-ISO, with permutation testing (1000 runs) supporting model robustness (R2Y and Q2 both high, no overfitting; Figure 2B).
Comparing T1DM with T1DM+L-ISO, volcano analysis identified 79 differential metabolites (p < 0.05, fold change > 1.5), including 40 down- and 39 up-regulated features after ISO treatment (Figure 2C). The top-25 VIP (variable importance in projection) heatmap confirmed broad reversal of T1DM-disrupted patterns (Figure 2D). KEGG pathway enrichment (FDR q < 0.05) highlighted arachidonic-acid, linoleic-acid, starch/sucrose and glycerophospholipid metabolism as major ISO-responsive routes (Figure 2E), pathways closely linked to inflammatory signaling and energy homeostasis. Putative biomarkers with AUC > 0.8 are summarized in Table 1 (e.g., porphobilinogen, 20-carboxy-LTB4, 6-keto-PGF1α, 15-deoxy-Δ12,14-PGJ2).

3.3. Network Pharmacology and Molecular Docking Highlight PI3K/AKT as a Central ISO Target

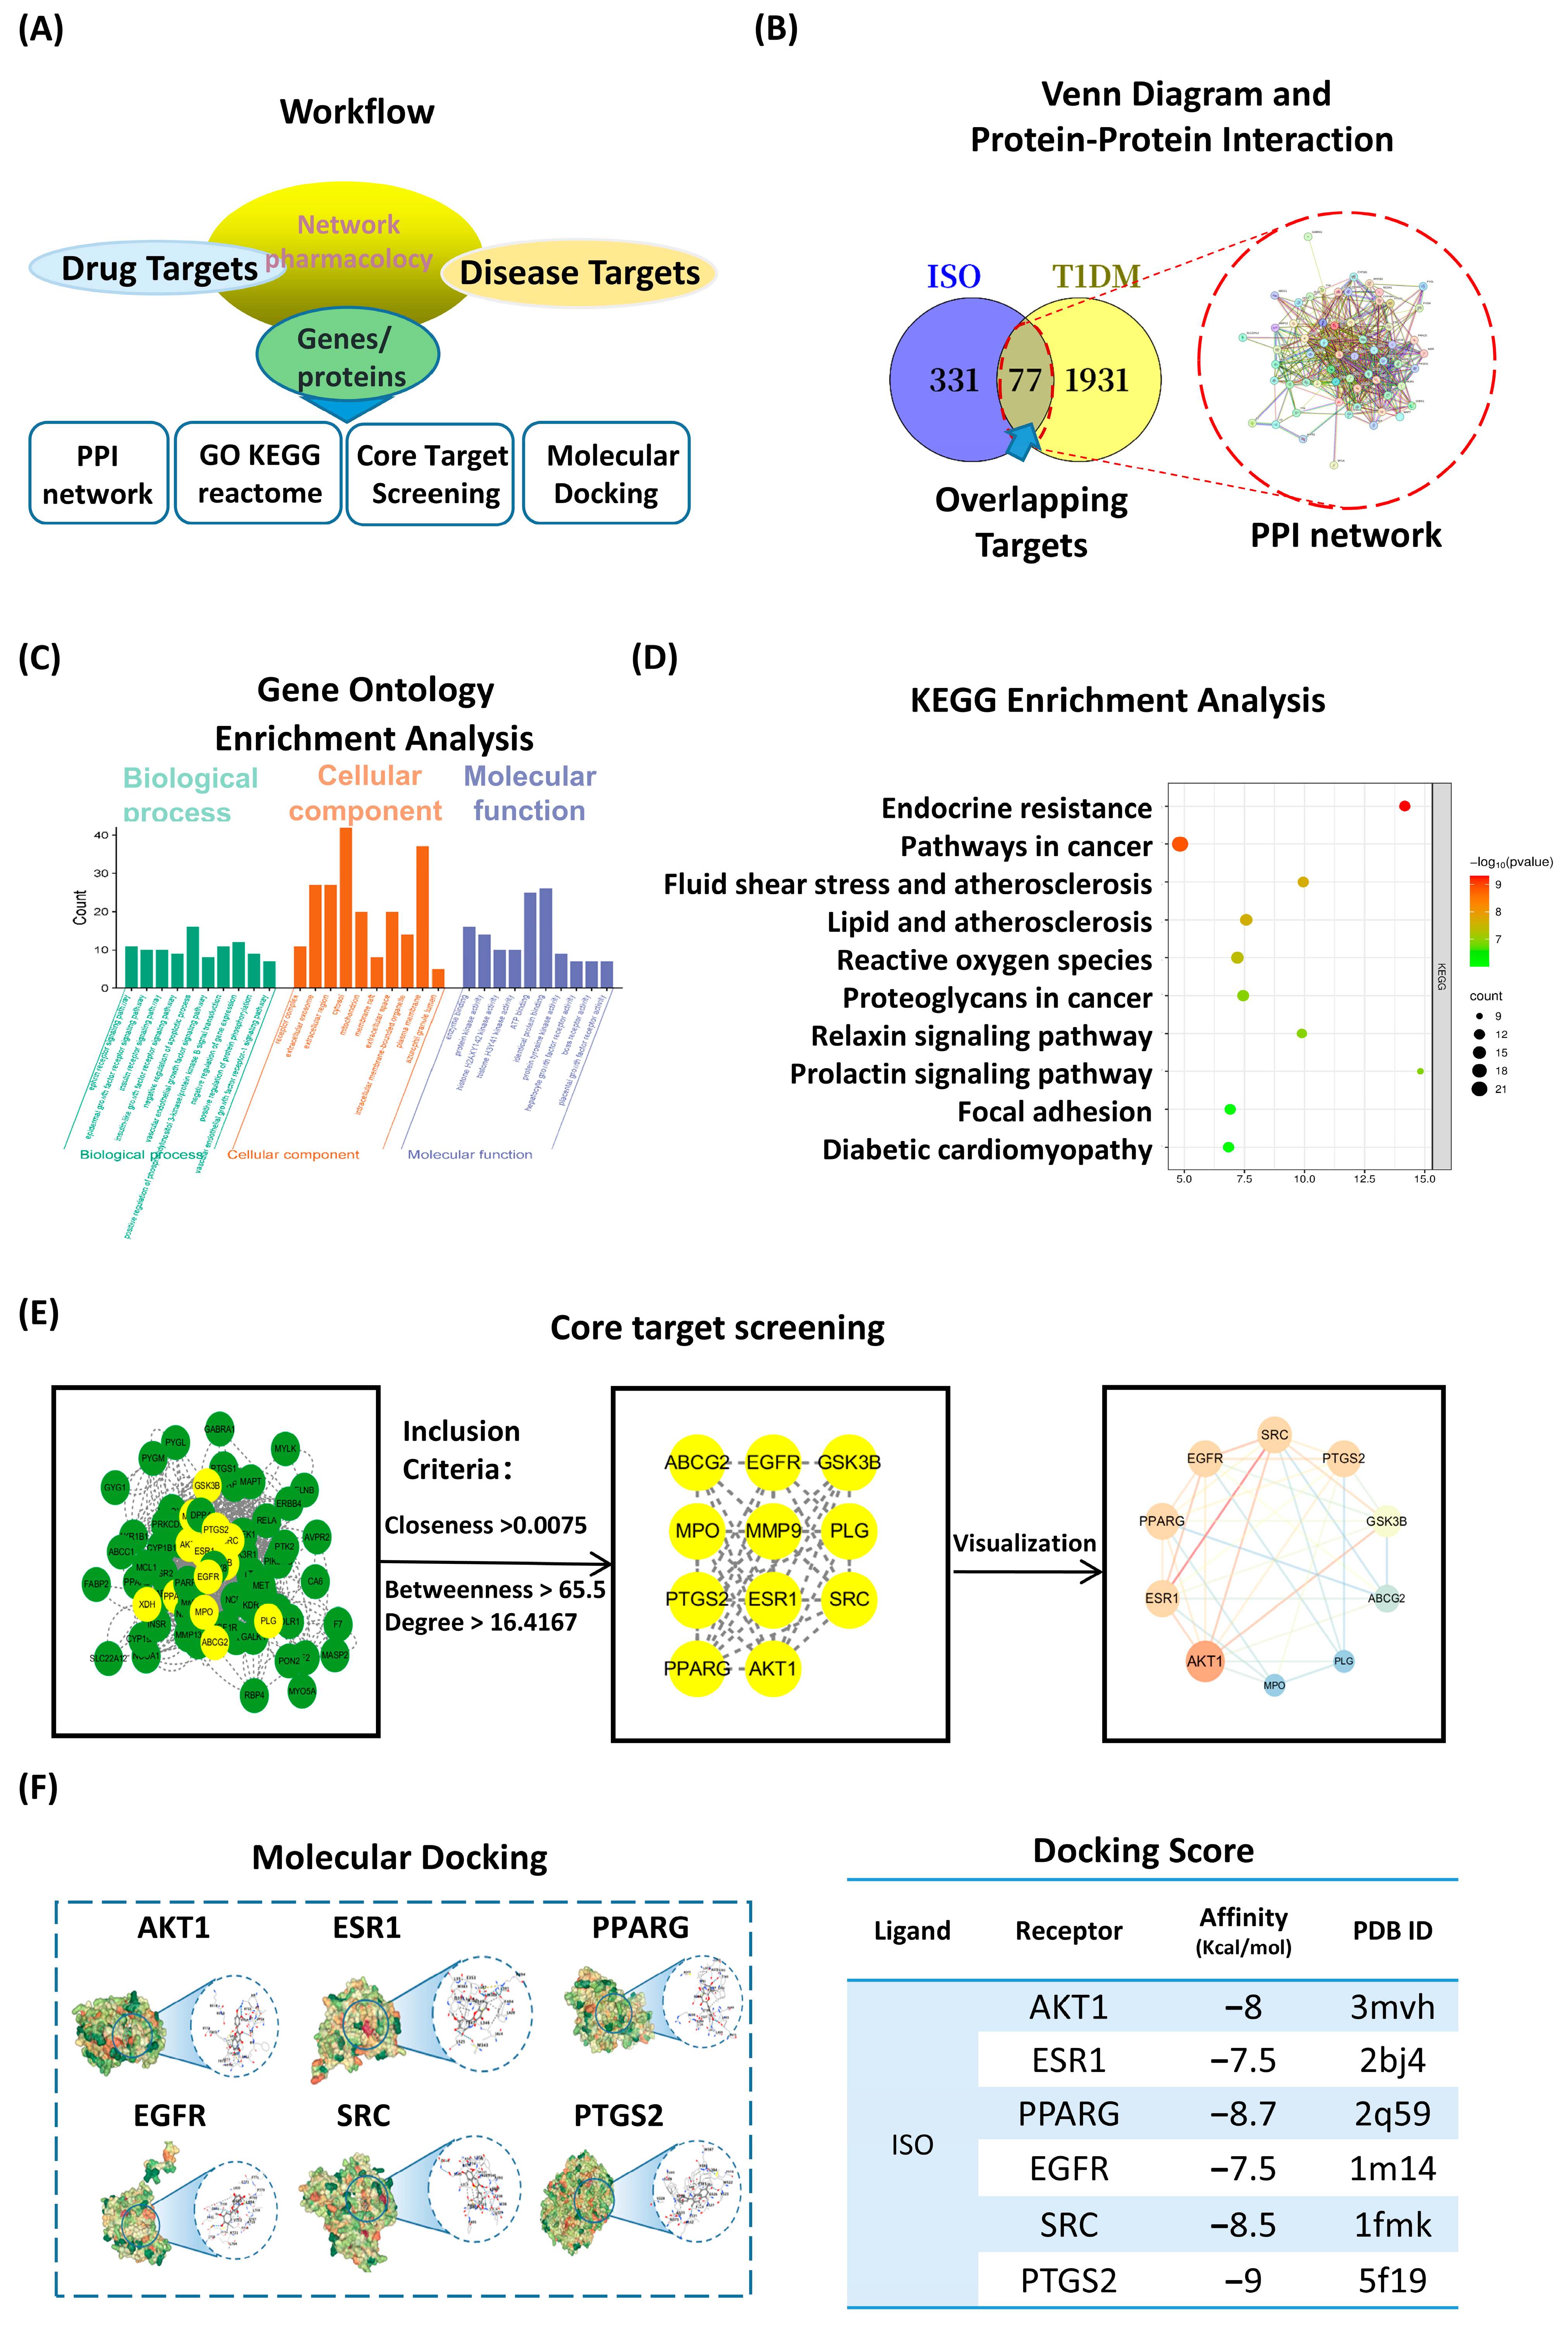
Network pharmacology workflow integrated compound and disease targets (Figure 3A). We collected 331 putative ISO targets and 1931 T1DM-associated genes; their intersection yielded 77 overlapping targets (Figure 3B). The STRING PPI network (72 nodes, 591 edges) indicated substantial interconnectivity. Gene Ontology (GO) enrichment implicated insulin-receptor signaling and positive regulation of PI3K/AKT (BP), receptor complexes/extracellular vesicles (CC), and kinase/ATP binding (MF) (Figure 3C). KEGG pathway enrichment highlighted endocrine resistance, fluid shear stress and atherosclerosis, chemical carcinogenesis—reactive oxygen species, proteoglycans in cancer, relaxin/prolactin signaling, focal adhesion, and diabetic cardiomyopathy—pathways that converge on PI3K/AKT nodes (Figure 3D).
Topological screening (degree > 16.4, betweenness > 65.5, closeness > 0.0075) identified 12 hubs, including AKT1, PTGS2, PPARG, EGFR, ESR1 and SRC (Figure 3E). Docking supported favorable interactions with these hubs (−7.5 to −9.0 kcal/mol), consistent with stable binding poses (Figure 3F). These network-pharmacology and docking results are hypothesis-generating and guided targeted validation (Table 2).

3.4. ISO Coordinates Gene–Metabolite Networks to Regulate Inflammation and Cell Survival

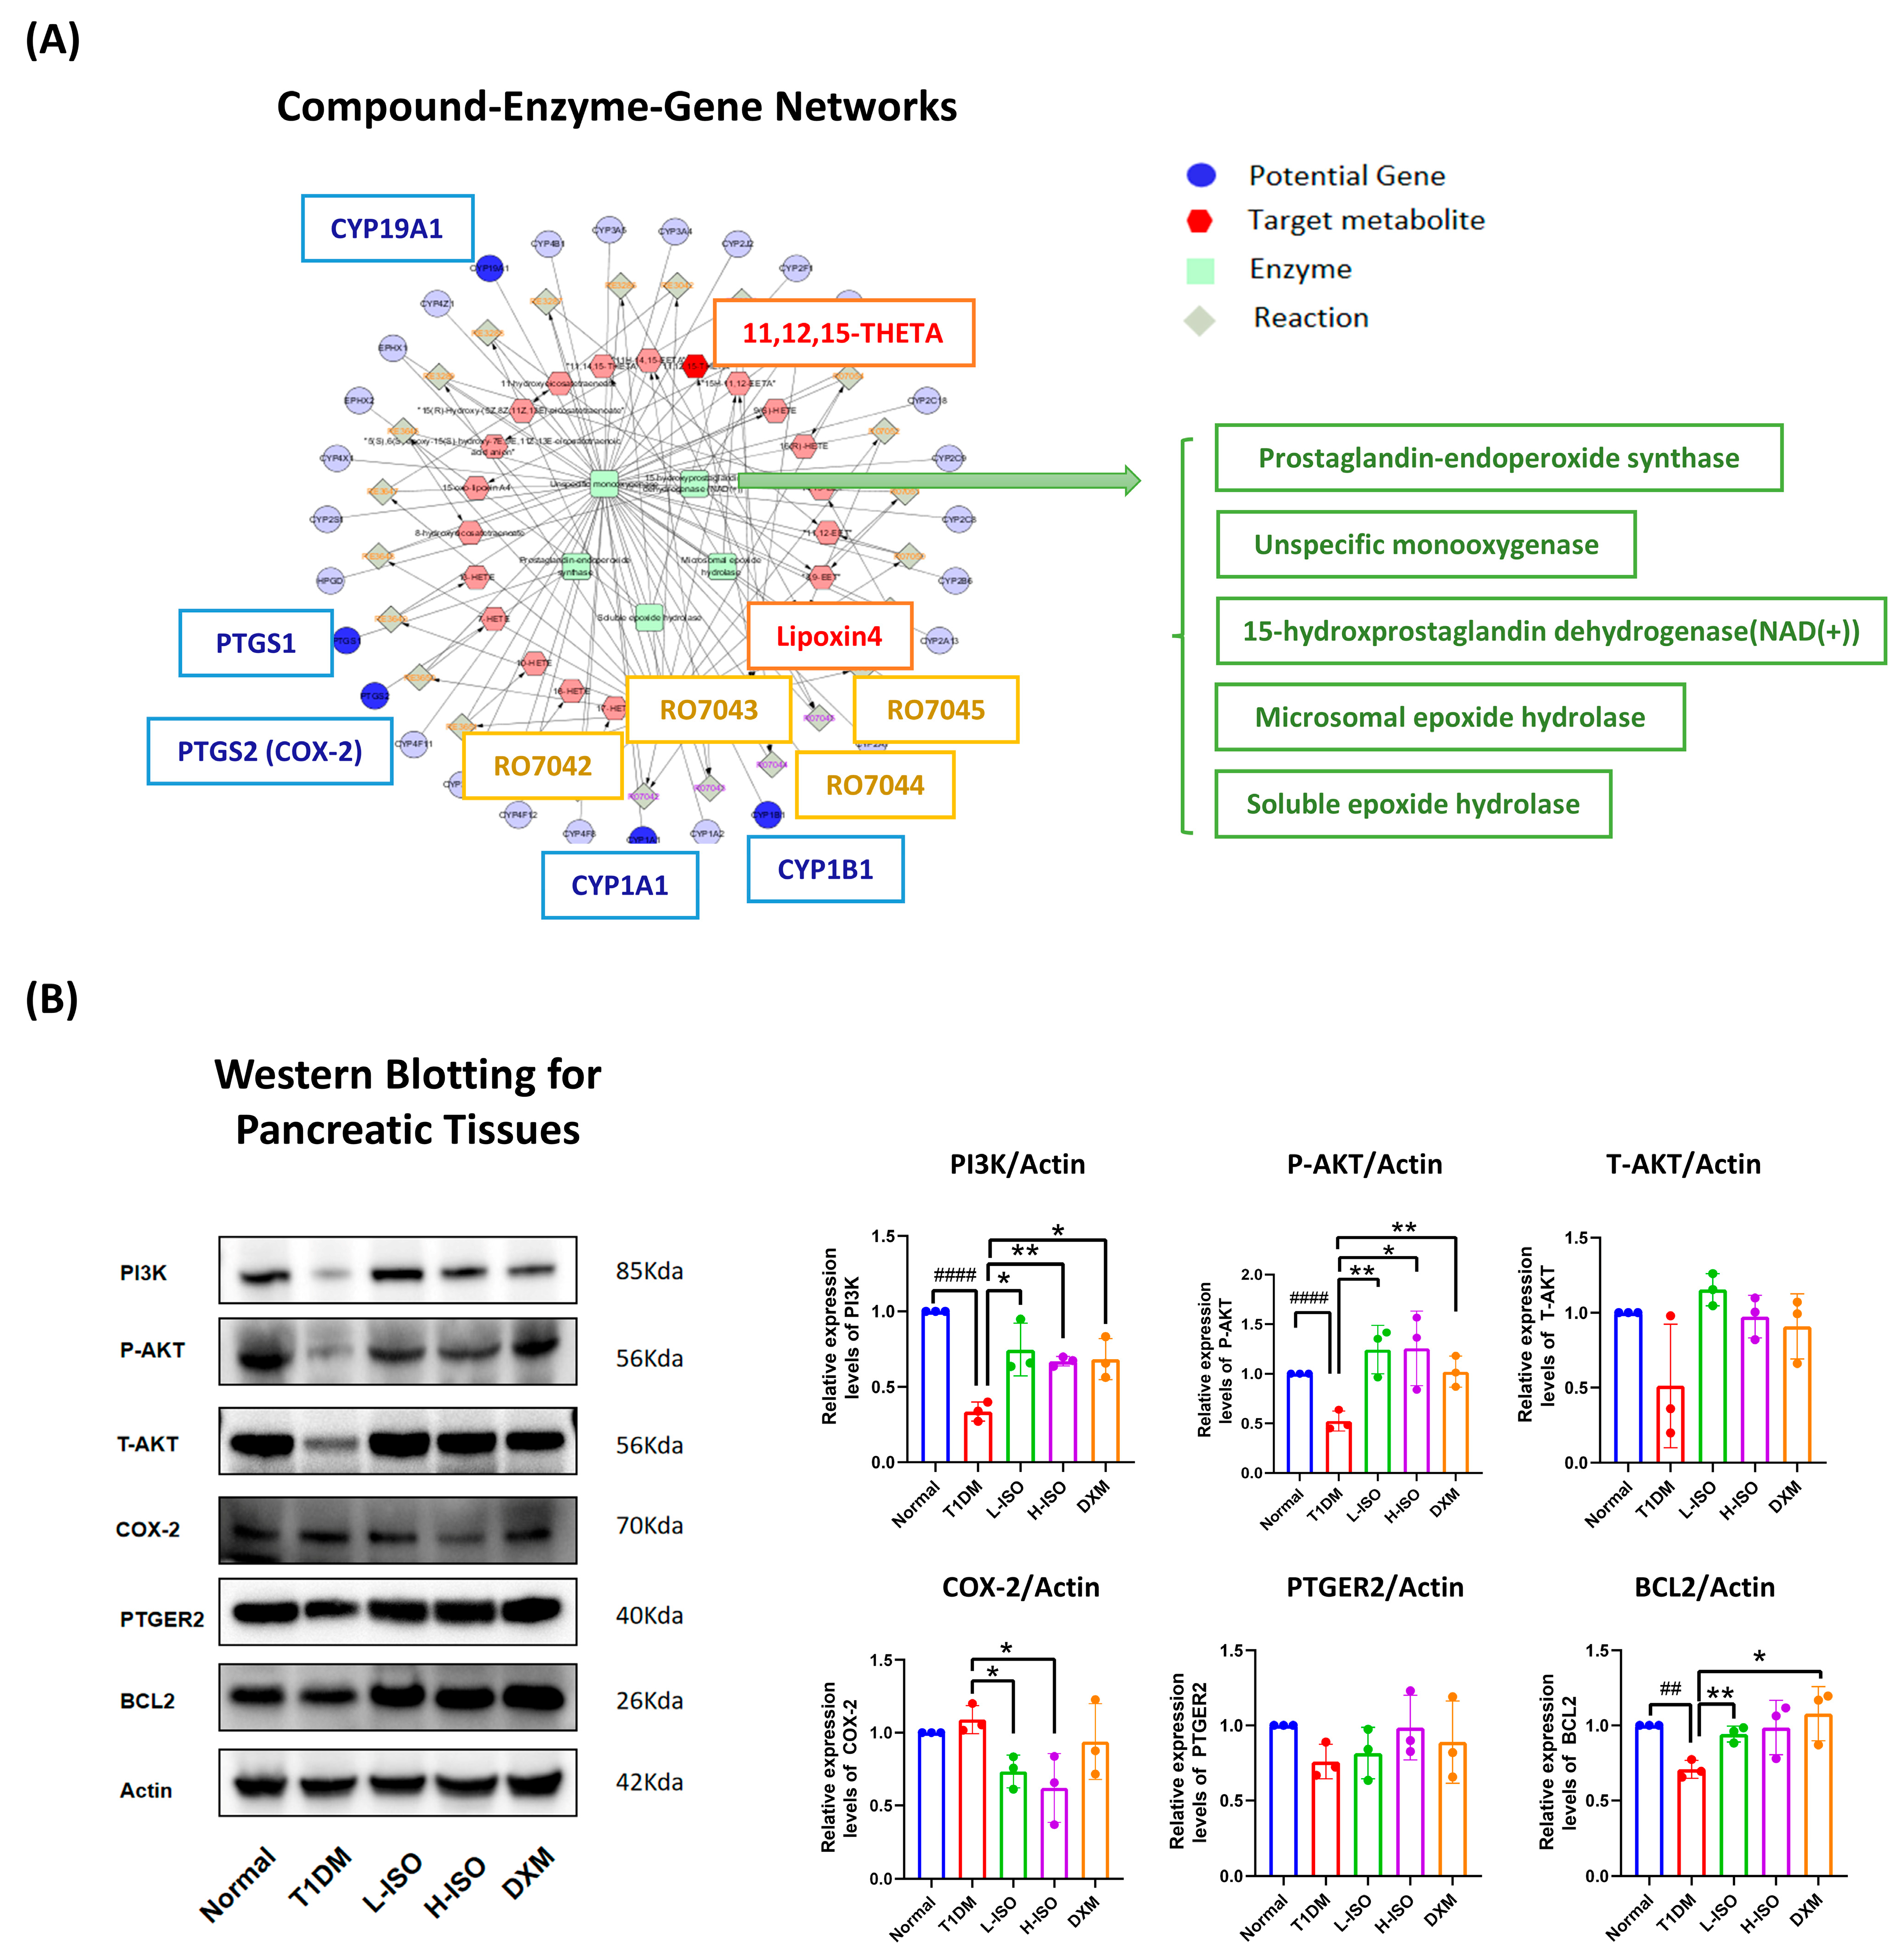
To integrate metabolomic and network-pharmacologic insights, we constructed a compound–reaction–enzyme–gene network (Figure 4A; Supplementary Figure S1; Tables S3 and S4), linking ISO-responsive plasma metabolites to candidate targets via enzymes and reactions. A representative subnetwork enriched for arachidonic-acid–related nodes highlighted connections between eicosanoid metabolism and cell-survival signaling.
In pancreatic tissue, T1DM significantly reduced PI3K, P-AKT, and BCL-2 (p < 0.0001, p < 0.0001, p < 0.01 vs. Normal). L-ISO increased PI3K (p < 0.05) and P-AKT (p < 0.01) and lowered COX-2 (p < 0.05) relative to T1DM. H-ISO similarly elevated PI3K (p < 0.01) and P-AKT (p < 0.05) and reduced COX-2 (p < 0.05). T-AKT and PTGER2 exhibited upward but non-significant trends. Dexamethasone (DXM) produced a comparable profile, increasing PI3K, P-AKT, and BCL-2 (p < 0.05, p < 0.01, p < 0.05). These data align with network-level predictions and support ISO-mediated activation of PI3K/AKT alongside suppression of COX-2.

3.5. ISO Protects INS-1 β Cells from LY294002-Induced Dysfunction by Enhancing Viability, Reducing ROS, and Supporting PI3K/AKT Signaling

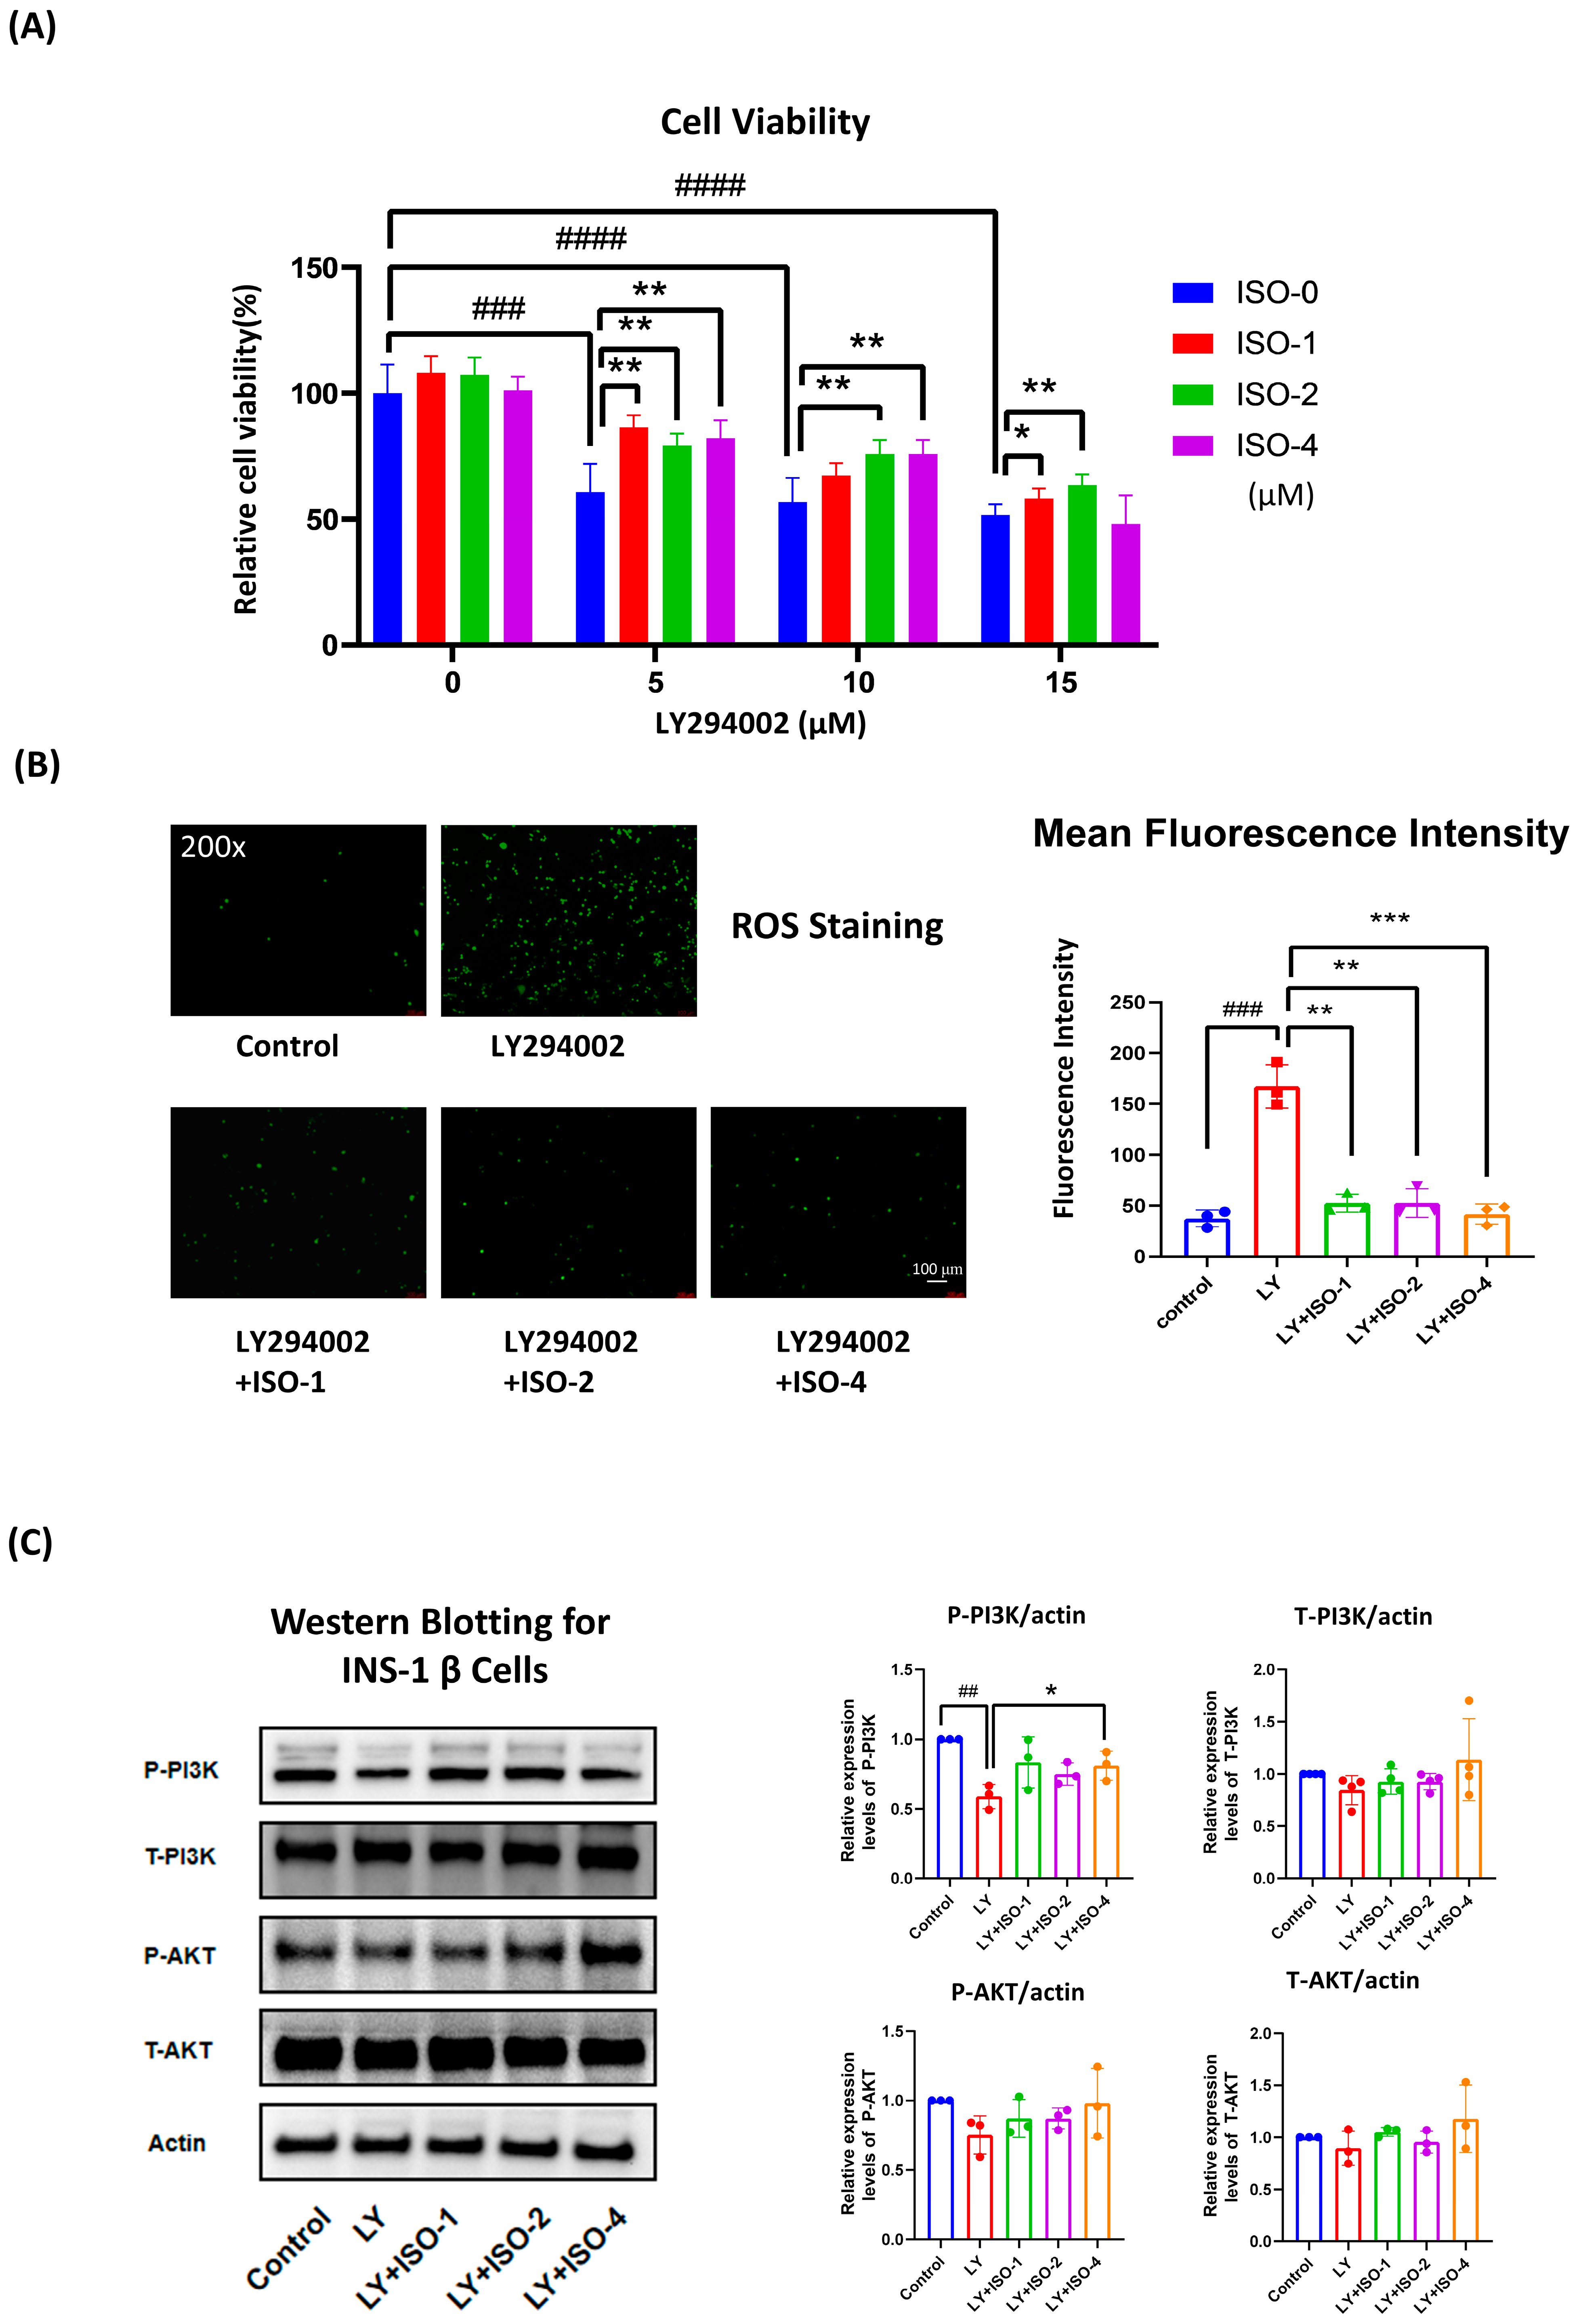
To assess the protective effects of ISO in pancreatic β cells, we established an injury model using the PI3K inhibitor LY294002. As shown in Figure 5A, LY294002 significantly reduced INS-1 viability in a dose-dependent manner (5, 10, and 15 µM; p < 0.001, p < 0.0001, and p < 0.0001, respectively). Co-treatment with ISO (1, 2, or 4 µM) improved viability in a concentration- and stress-dependent fashion. Under 5 µM LY, all ISO doses significantly restored viability (p < 0.01, p < 0.01, p < 0.01). At 10 µM LY, ISO at 2 and 4 µM remained effective (p < 0.01), while at 15 µM LY, 1 and 2 µM ISO were protective (p < 0.05 and p < 0.01, respectively).
ROS imaging (Figure 5B) showed that LY294002 markedly increased intracellular oxidative stress (p < 0.001), which was significantly reduced by ISO at all concentrations (p < 0.01), indicating an antioxidant effect. Western blotting (Figure 5C) showed suppression of P-PI3K by LY294002 (p < 0.01); ISO at 4 µM significantly reversed this reduction (p < 0.05), with lower doses showing mild recovery. Total PI3K, P-AKT, and T-AKT displayed slight, non-significant increases with ISO. Collectively, ISO counteracts PI3K inhibition–induced dysfunction by enhancing viability, attenuating ROS, and supporting PI3K/AKT pathway activity.

4. Discussion

Isorhamnetin (ISO) alleviates hyperglycemia in STZ-induced T1DM, lowers LDL-C, increases plasma insulin (L-ISO), and preserves islet morphology (significant in L-ISO; Figure 1). This dose–response pattern is compatible with a biphasic (hormetic) window. At lower exposure, ISO preferentially supports PI3K/AKT signaling and tempers COX-2–eicosanoid activity, whereas higher exposure may reach pathway saturation and introduce off-target/redox liabilities, blunting net benefit. Non-linear exposure after i.p. dosing of a poorly water-soluble flavonol could further contribute (e.g., variable absorption/distribution despite matched vehicle). Consistent with this, L-ISO achieved steadier glycemic control in vivo and restored P-PI3K at 4 µM in INS-1 cells, while H-ISO did not confer additional advantages. Future work will include PK/PD profiling and a finer dose grid (10–60 mg/kg) to delineate the therapeutic window and separate pharmacodynamic from exposure-driven effects. Untargeted metabolomics indicates broad remodeling with enrichment of arachidonic-acid, linoleic-acid, starch/sucrose and glycerophospholipid pathways (Figure 2). Network pharmacology highlights AKT1, PTGS2, PPARG, EGFR, ESR1 and SRC as hubs, with docking supporting favorable ISO binding (Figure 3). Mechanistically, ISO supports PI3K/AKT signaling in pancreatic tissue (increased P-AKT) and reduces COX-2 (Figure 4), and in INS-1 cells counters LY294002-induced dysfunction by improving viability, lowering ROS and restoring P-PI3K at 4 µM (Figure 5). Contextualization with recent literature: studies have shown that ISO and related flavonols can modulate glucose homeostasis, β-cell stress responses, and inflammatory eicosanoid signaling in metabolic and diabetic models; our findings extend these observations to an insulin-deficient STZ model and connect the phenotypes to a PI3K/AKT–COX-2/eicosanoid framework [5,8,9]. Network-pharmacology and docking findings are hypothesis-generating and were used to guide targeted validation rather than to claim direct target engagement in vivo.
The PI3K/AKT pathway is a canonical survival axis in β-cells. Genetic activation of Akt1 enlarges β-cells, enhances proliferation, and limits apoptosis, thereby expanding β-cell mass in independent transgenic models [12,13]. Complementary loss-of-function evidence shows that deleting class-IA PI3K subunits impairs insulin secretion and β-cell performance, whereas re-expression of constitutively active Akt normalizes these defects—highlighting that PI3K signals converge on AKT to maintain β-cell fitness [14]. At the cellular level, glucose promotes β-cell survival via PI3K/AKT; pharmacologic PI3K inhibition abolishes glucose-induced Akt phosphorylation and cytoprotection, while constitutively active Akt rescues survival under stress [15]. In this context, our data—ISO elevating pancreatic P-AKT in vivo and partially restoring P-PI3K and viability in LY294002-challenged INS-1 cells—support a model in which ISO preserves β-cell integrity primarily by sustaining PI3K/AKT signaling. These observations are consistent with recent reports underscoring PI3K/AKT as a central survival node in β-cells and a tractable target of flavonols in vivo [16,17].
Our metabolomics enrichment in arachidonic-acid and glycerophospholipid pathways, together with reduced pancreatic COX-2 and a trend toward higher PTGER2, suggests a reset of eicosanoid tone in ISO-treated mice (Figure 2 and Figure 4). In pancreatic islets, COX-2-derived PGE2 signals through receptor-specific routes with divergent consequences: EP3 (PTGER3) is induced in diabetic islets and suppresses cAMP/GSIS, thereby impairing β-cell function [18], whereas EP4 engagement promotes β-cell survival; accordingly, EP3 blockade augments survival and proliferation in mouse and human islets ex vivo [19]. Upstream lipid-liberating enzymes couple this axis to secretion—Group X secretory phospholipase A2 increases PGE2 and depresses GSIS via a COX-2/EP3-dependent mechanism, reversible by a COX-2 inhibitor or EP3 antagonist [20]. In human islets, PGE2-synthetic enzymes are elevated and positively correlate with markers of β-cell function/mass in nondiabetic obesity, indicating pathway activity in human tissue and context-dependent effects dictated by receptor balance [21]. Together with prior evidence that PTGS2–PTGER2/4 signaling can protect against STZ injury in vivo [22], these observations support a model in which ISO attenuates COX-2 and may shift signaling toward EP2/EP4, relieve EP3-Gi–cAMP inhibition while favoring survival pathways, aligning with improved islet architecture and β-cell signaling. Recent studies likewise link the COX-2/EP-receptor balance to β-cell function and survival, supporting the idea that modulation of EP3–Gi while favoring EP2/EP4 contributes to improved islet outcomes [21,23,24,25].
β-cells are highly vulnerable to reactive oxygen/nitrogen species, and here ISO lowered intracellular ROS across doses in INS-1 cells (Figure 5B). Isorhamnetin is known to activate the Keap1–Nrf2 antioxidant program and induce canonical targets (e.g., HO-1, NQO1) [6]. In β-cells specifically, genetic gain- and loss-of-function studies show that Nrf2 restrains oxidative damage, preserves insulin secretion, and expands functional β-cell mass in vivo and in human islet xenografts [26,27]. Mechanistically, PI3K/AKT and Nrf2 likely cooperate: AKT inhibits GSK-3β, a kinase that promotes Fyn-dependent nuclear export/degradation of Nrf2; thus, AKT activation stabilizes nuclear Nrf2 and sustains antioxidant transcription [28,29]. Taken together, ISO’s simultaneous enhancement of PI3K/AKT signaling and suppression of ROS supports a framework in which Nrf2-mediated cytoprotection amplifies the β-cell survival benefits conferred by PI3K/AKT, consistent with the improved glycemia and islet morphology observed in vivo. This integrated PI3K/AKT–Nrf2–eicosanoid view provides a coherent mechanistic basis for ISO’s β-cell protection and aligns with recent preclinical evidence [27,30].
This study has several limitations. First, although ISO increased pancreatic P-AKT in vivo and restored P-PI3K under LY294002 in INS-1 cells, causal attribution to the PI3K/AKT axis in the animal model remains inferential; in vivo perturbation (e.g., pharmacological or genetic) would strengthen mechanistic certainty [10,12,13,14,15]. Second, the eicosanoid arm was inferred from untargeted metabolomics plus COX-2 down-regulation; targeted lipidomics of prostaglandins/leukotrienes (e.g., PGE2, 15-deoxy-Δ12,14-PGJ2, 6-keto-PGF1α) and receptor-level modulation would directly anchor the COX-2–PTGER axis to outcomes [7,11,18,19,20,21,22]. Third, dosing used a short, 14-day i.p. regimen; pharmacokinetics, tissue exposure, and oral bioavailability/formulation remain to be defined, despite the dietary occurrence of ISO [2,3,5]. Fourth, our apoptosis panel was limited: beyond a small BCL-2 change, we did not measure other BCL-2 family regulators (e.g., MCL-1, BAX, BCL-XL) or cleaved caspase-3; future work will include these targets in WB/IHC to determine whether ISO shifts the apoptotic balance. Fifth, we did not quantify peri-islet immune infiltrates or profile T-cell subsets; future work will include IHC/flow cytometry of CD3, CD4 (Th), CD8 (Tc), Foxp3 (Treg), and TCRγδ T cells, together with myeloid markers (F4/80, CD68), to map ISO-related immune changes. Additionally, dynamic glycemic readouts (OGTT/IPGTT) and an in vivo insulin-treated pharmacological positive control were not included; an independent validation cohort will incorporate these elements alongside exposure profiling and dose-window mapping to strengthen translational inference [31,32,33,34].
In summary, our data position ISO as a potential adjunct to insulin therapy by attenuating hyperglycemia while supporting β-cell integrity. Mechanistically, the discovery-to-validation sequence converges on PI3K/AKT activation together with COX-2/eicosanoid tempering, a combination linked to improved islet survival and inflammatory tone. We did not perform dynamic glycemia testing (OGTT/IPGTT) in the present study; an independent validation cohort will include these indices together with an insulin-treated benchmark to compare translational efficacy.

5. Conclusions

Isorhamnetin ameliorates hyperglycemia and dyslipidemia, improves plasma insulin, and preserves islet architecture in STZ-induced T1DM, while being associated with metabolite remodeling enriched for arachidonic- and glycerophospholipid-linked pathways. Multi-layer analyses support a dual-axis mechanism in the pancreas: support of PI3K/AKT signaling and attenuation of COX-2-dependent lipid-mediator signaling complemented by antioxidant support, consistent with Nrf2 engagement. Together, these findings position ISO as a food-derived adjunct of β-cell resilience and inflammatory tone, warranting targeted lipidomics, in vivo pathway testing, and the inclusion of dynamic glycemic indices with an insulin benchmark in a validation cohort, as well as oral-formulation studies to advance translational potential.

Supplementary Materials

The following supporting information can be downloaded at: https://www.mdpi.com/article/10.3390/nu17203201/s1, Figure S1: Full compound–enzyme–gene network; Figure S2: Docking interaction details; Table S1: LC–MS/MS compounds (positive mode); Table S2: LC–MS/MS compounds (negative mode); Table S3: Node table for the compound–reaction–enzyme–gene network; Table S4: Edge table for the compound–reaction–enzyme–gene network.

Author Contributions

Conceptualization, L.L. and J.L.; investigation, L.L., J.L. and J.R.; writing—original draft preparation, L.L.; writing—review and editing, J.Y.; supervision, J.Y.; funding acquisition, J.Y. All authors have read and agreed to the published version of the manuscript.

Funding

This work was supported by the Natural Science Foundation of Fujian Province, China (Grant No. 2022D024) and the Xiamen Municipal Health Commission Guiding Project (Grant No. 3502Z20244ZD1151).

Institutional Review Board Statement

The animal study protocol was approved by the Institutional Animal Care and Use Committee (Ethics Committee) of Xiamen Medical College, China (protocol code 20240207015; date of approval: 7 February 2024).

Informed Consent Statement

Not applicable.

Data Availability Statement

The original contributions presented in this study are included in the article/Supplementary Materials. Further inquiries can be directed to the corresponding author.

Acknowledgments

The authors sincerely thank the Metabolomics Platform of Xiamen Medical College for their technical support in LC-MS/MS acquisition and data processing.

Conflicts of Interest

The authors declare no conflicts of interest.

Abbreviations

The following abbreviations are used in this manuscript:
AKTprotein kinase B
AMPKAMP-activated protein kinase
CCK-8Cell Counting Kit-8
COX-2cyclooxygenase-2
CV-ANOVAcross-validation analysis of variance
DCFH-DA2′,7′-dichlorodihydrofluorescein diacetate
DXMdexamethasone
EPE-prostanoid (prostaglandin E2 receptor)
ESIelectrospray ionization
FDRfalse discovery rate
FBGfasting blood glucose
GOGene Ontology
GSK-3βglycogen synthase kinase-3 beta
HDL-Chigh-density lipoprotein cholesterol
HO-1heme oxygenase-1
ISOisorhamnetin
KEGGKyoto Encyclopedia of Genes and Genomes
LC–MSliquid chromatography–mass spectrometry
LDL-Clow-density lipoprotein cholesterol
Nrf2nuclear factor erythroid 2–related factor 2
OPLS-DAorthogonal partial least squares–discriminant analysis
PDBProtein Data Bank
PI3Kphosphoinositide 3-kinase
PGE2prostaglandin E2
PTGER2prostaglandin E receptor 2 (EP2)
QC-RSDquality-control relative standard deviation
ROSreactive oxygen species
STZstreptozotocin
T1DMtype 1 diabetes mellitus
UPLCultra-performance liquid chromatography

References

  1. Ogle, G.D.; Wang, F.; Haynes, A.; Gregory, G.A.; King, T.W.; Deng, K.; Dabelea, D.; James, S.; Jenkins, A.J.; Li, X.; et al. Global Type 1 Diabetes Prevalence, Incidence, and Mortality Estimates 2025: Results from the International Diabetes Federation Atlas, 11th Edition, and the T1D Index Version 3.0. Diabetes Res. Clin. Pract. 2025, 225, 112277. [Google Scholar] [CrossRef]
  2. Gong, G.; Guan, Y.-Y.; Zhang, Z.-L.; Rahman, K.; Wang, S.-J.; Zhou, S.; Luan, X.; Zhang, H. Isorhamnetin: A Review of Pharmacological Effects. Biomed. Pharmacother. 2020, 128, 110301. [Google Scholar] [CrossRef]
  3. Ferreres, F.; Taveira, M.; Pereira, D.M.; Valentão, P.; Andrade, P.B. Tomato (Lycopersicon esculentum) Seeds: New Flavonols and Cytotoxic Effect. J. Agric. Food Chem. 2010, 58, 2854–2861. [Google Scholar] [CrossRef] [PubMed]
  4. Jiang, H.; Yamashita, Y.; Nakamura, A.; Croft, K.D.; Ashida, H. Quercetin and Its Metabolite Isorhamnetin Promote Glucose Uptake through Different Signalling Pathways in Myotubes. Sci. Rep. 2019, 9, 2690. [Google Scholar] [CrossRef] [PubMed]
  5. Mao, Y.; Zha, Y.; Zang, Y.; Gao, Y.; Sun, J.; Liu, Y.; Wang, Z.; Wei, Z.; Wang, M.; Yang, Y. Isorhamnetin Improves Diabetes-Induced Erectile Dysfunction in Rats through Activation of the PI3K/AKT/eNOS Signaling Pathway. Biomed. Pharmacother. 2024, 177, 116987. [Google Scholar] [CrossRef] [PubMed]
  6. Yang, J.H.; Shin, B.Y.; Han, J.Y.; Kim, M.G.; Wi, J.E.; Kim, Y.W.; Cho, I.J.; Kim, S.C.; Shin, S.M.; Ki, S.H. Isorhamnetin Protects against Oxidative Stress by Activating Nrf2 and Inducing the Expression of Its Target Genes. Toxicol. Appl. Pharmacol. 2014, 274, 293–301. [Google Scholar] [CrossRef]
  7. Seo, K.; Yang, J.H.; Kim, S.C.; Ku, S.K.; Ki, S.H.; Shin, S.M. The Antioxidant Effects of Isorhamnetin Contribute to Inhibit COX-2 Expression in Response to Inflammation: A Potential Role of HO-1. Inflammation 2014, 37, 712–722. [Google Scholar] [CrossRef]
  8. Alqudah, A.; Qnais, E.Y.; Wedyan, M.A.; Altaber, S.; Bseiso, Y.; Oqal, M.; AbuDalo, R.; Alrosan, K.; Alrosan, A.Z.; Bani Melhim, S.; et al. Isorhamnetin Reduces Glucose Level, Inflammation, and Oxidative Stress in High-Fat Diet/Streptozotocin Diabetic Mice Model. Molecules 2023, 28, 502. [Google Scholar] [CrossRef]
  9. Lei, J.; Yang, J.; Bao, C.; Lu, F.; Wu, Q.; Wu, Z.; Lv, H.; Zhou, Y.; Liu, Y.; Zhu, N.; et al. Isorhamnetin: What Is the In Vitro Evidence for Its Antitumor Potential and Beyond? Front. Pharmacol. 2024, 15, 1309178. [Google Scholar] [CrossRef]
  10. Camaya, I.; Donnelly, S.; O’Brien, B. Targeting the PI3K/Akt Signaling Pathway in Pancreatic β-Cells to Enhance Their Survival and Function: An Emerging Therapeutic Strategy for Type 1 Diabetes. J. Diabetes 2022, 14, 247–260. [Google Scholar] [CrossRef]
  11. Luo, P.; Wang, M.-H. Eicosanoids, β-Cell Function, and Diabetes. Prostaglandins Other Lipid Mediat. 2011, 95, 1–10. [Google Scholar] [CrossRef]
  12. Tuttle, R.L.; Gill, N.S.; Pugh, W.; Lee, J.P.; Koeberlein, B.; Furth, E.E.; Polonsky, K.S.; Naji, A.; Birnbaum, M.J. Regulation of Pancreatic Beta-Cell Growth and Survival by the Serine/Threonine Protein Kinase Akt1/PKBα. Nat. Med. 2001, 7, 1133–1137. [Google Scholar] [CrossRef]
  13. Bernal-Mizrachi, E.; Wen, W.; Stahlhut, S.; Welling, C.M.; Permutt, M.A. Islet β-Cell Expression of Constitutively Active Akt1/PKBα Induces Striking Hypertrophy, Hyperplasia, and Hyperinsulinemia. J. Clin. Investig. 2001, 108, 1631–1638. [Google Scholar] [CrossRef] [PubMed]
  14. Kaneko, K.; Ueki, K.; Takahashi, N.; Hashimoto, S.; Okamoto, M.; Awazawa, M.; Okazaki, Y.; Ohsugi, M.; Inabe, K.; Umehara, T.; et al. Class IA Phosphatidylinositol 3-Kinase in Pancreatic β Cells Controls Insulin Secretion by Multiple Mechanisms. Cell Metab. 2010, 12, 619–632. [Google Scholar] [CrossRef] [PubMed]
  15. Srinivasan, S.; Bernal-Mizrachi, E.; Ohsugi, M.; Permutt, M.A. Glucose Promotes Pancreatic Islet β-Cell Survival through a PI 3-Kinase/Akt-Signaling Pathway. Am. J. Physiol. Endocrinol. Metab. 2002, 283, E784–E793. [Google Scholar] [CrossRef] [PubMed]
  16. Kalai, F.Z.; Boulaaba, M.; Ferdousi, F.; Isoda, H. Effects of Isorhamnetin on Diabetes and Its Associated Complications: A Review of In Vitro and In Vivo Studies and a Post Hoc Transcriptome Analysis of Involved Molecular Pathways. Int. J. Mol. Sci. 2022, 23, 704. [Google Scholar] [CrossRef]
  17. Song, C.; Zheng, W.; Song, C.; Zhou, H.; Yao, J. Protective Effects of Food-Derived Kaempferol on Pancreatic β-Cells in Type 1 Diabetes Mellitus. Foods 2024, 13, 3797. [Google Scholar] [CrossRef]
  18. Kimple, M.E.; Keller, M.P.; Rabaglia, M.R.; Pasker, R.L.; Neuman, J.C.; Truchan, N.A.; Brar, H.K.; Attie, A.D. Prostaglandin E2 Receptor, EP3, Is Induced in Diabetic Islets and Negatively Regulates Glucose- and Hormone-Stimulated Insulin Secretion. Diabetes 2013, 62, 1904–1912. [Google Scholar] [CrossRef] [PubMed]
  19. Carboneau, B.A.; Allan, J.A.; Townsend, S.E.; Kimple, M.E.; Breyer, R.M.; Gannon, M. Opposing Effects of Prostaglandin E2 Receptors EP3 and EP4 on Mouse and Human β-Cell Survival and Proliferation. Mol. Metab. 2017, 6, 548–559. [Google Scholar] [CrossRef]
  20. Shridas, P.; Zahoor, L.; Forrest, K.J.; Layne, J.D.; Webb, N.R. Group X Secretory Phospholipase A2 Regulates Insulin Secretion through a Cyclooxygenase-2-Dependent Mechanism. J. Biol. Chem. 2014, 289, 27410–27417. [Google Scholar] [CrossRef]
  21. Truchan, N.A.; Fenske, R.J.; Sandhu, H.K.; Weeks, A.M.; Patibandla, C.; Wancewicz, B.; Pabich, S.; Reuter, A.; Harrington, J.M.; Brill, A.L.; et al. Human Islet Expression Levels of Prostaglandin E2 Synthetic Enzymes, But Not Prostaglandin EP3 Receptor, Are Positively Correlated with Markers of β-Cell Function and Mass in Nondiabetic Obesity. ACS Pharmacol. Transl. Sci. 2021, 4, 1338–1348. [Google Scholar] [CrossRef]
  22. Vennemann, A.; Gerstner, A.; Kern, N.; Ferreiros Bouzas, N.; Narumiya, S.; Maruyama, T.; Nüsing, R.M. PTGS-2–PTGER2/4 Signaling Pathway Partially Protects from Diabetogenic Toxicity of Streptozotocin in Mice. Diabetes 2012, 61, 1879–1887. [Google Scholar] [CrossRef] [PubMed]
  23. Yasui-Kato, M.; Patlada, S.; Yokode, M.; Kamei, K.; Minami, M. EP4 Signalling Is Essential for Controlling Islet Inflammation by Causing a Shift in Macrophage Polarization in Obesity/Type 2 Diabetes. Diab. Vasc. Dis. Res. 2020, 17, 1479164120945675. [Google Scholar] [CrossRef] [PubMed]
  24. Martin Vázquez, E.; Cobo-Vuilleumier, N.; Araujo Legido, R.; Marín-Cañas, S.; Nola, E.; Dorronsoro, A.; López Bermudo, L.; Crespo, A.; Romero-Zerbo, S.Y.; García-Fernández, M.; et al. NR5A2/LRH-1 Regulates the PTGS2–PGE2–PTGER1 Pathway Contributing to Pancreatic Islet Survival and Function. iScience 2022, 25, 104345. [Google Scholar] [CrossRef]
  25. Neuman, J.C.; Reuter, A.; Carbajal, K.A.; Schaid, M.D.; Kelly, G.; Connors, K.; Kaiser, C.; Krause, J.; Hurley, L.D.; Olvera, A.; et al. The Prostaglandin E2 EP3 Receptor Has Disparate Effects on Islet Insulin Secretion and Content in β-Cells in a High-Fat Diet–Induced Mouse Model of Obesity. Am. J. Physiol. Endocrinol. Metab. 2024, 326, E567–E576. [Google Scholar] [CrossRef] [PubMed]
  26. Yagishita, Y.; Fukutomi, T.; Sugawara, A.; Kawamura, H.; Takahashi, T.; Pi, J.; Uruno, A.; Yamamoto, M. Nrf2 Protects Pancreatic β-Cells from Oxidative and Nitrosative Stress in Diabetic Model Mice. Diabetes 2014, 63, 605–618. [Google Scholar] [CrossRef]
  27. Baumel-Alterzon, S.; Katz, L.S.; Brill, G.; Jean-Pierre, C.; Li, Y.; Tse, I.; Biswal, S.; Garcia-Ocaña, A.; Scott, D.K. Nrf2 Regulates β-Cell Mass by Suppressing β-Cell Death and Promoting β-Cell Proliferation. Diabetes 2022, 71, 989–1011. [Google Scholar] [CrossRef]
  28. Jain, A.K.; Jaiswal, A.K. GSK-3β Acts Upstream of Fyn Kinase in Regulation of Nuclear Export and Degradation of NF-E2–Related Factor 2. J. Biol. Chem. 2007, 282, 16502–16510. [Google Scholar] [CrossRef]
  29. Chen, X.; Liu, Y.; Zhu, J.; Lei, S.; Dong, Y.; Li, L.; Jiang, B.; Tan, L.; Wu, J.; Yu, S.; et al. GSK-3β Downregulates Nrf2 in Cultured Cortical Neurons and in a Rat Model of Cerebral Ischemia–Reperfusion. Sci. Rep. 2016, 6, 20196. [Google Scholar] [CrossRef]
  30. Wen, X.; Tang, S.; Wan, F.; Zhong, R.; Chen, L.; Zhang, H. The PI3K/Akt–Nrf2 Signaling Pathway and Mitophagy Synergistically Mediate Hydroxytyrosol to Alleviate Intestinal Oxidative Damage. Int. J. Biol. Sci. 2024, 20, 4258–4276. [Google Scholar] [CrossRef]
  31. Benedé-Ubieto, R.; Estévez-Vázquez, O.; Ramadori, P.; Cubero, F.J.; Nevzorova, Y.A. Guidelines and Considerations for Metabolic Tolerance Tests in Mice. Diabetes Metab. Syndr. Obes. 2020, 13, 439–450. [Google Scholar] [CrossRef] [PubMed]
  32. Small, L.; Ehrlich, A.; Iversen, J.; Ashcroft, S.P.; Trošt, K.; Moritz, T.; Hartmann, B.; Holst, J.J.; Treebak, J.T.; Zierath, J.R.; et al. Comparative Analysis of Oral and Intraperitoneal Glucose Tolerance Tests in Mice. Mol. Metab. 2022, 57, 101440. [Google Scholar] [CrossRef] [PubMed]
  33. Al Rijjal, D.; Wheeler, M.B. A Protocol for Studying Glucose Homeostasis and Islet Function in Mice. STAR Protoc. 2022, 3, 101171. [Google Scholar] [CrossRef]
  34. Hu, L.; Luo, Y.; Yang, J.; Cheng, C. Botanical Flavonoids: Efficacy, Absorption, Metabolism and Advanced Pharmaceutical Technology for Improving Bioavailability. Molecules 2025, 30, 1184. [Google Scholar] [CrossRef] [PubMed]
Figure 1. ISO improves glycemia, lipid profile, and islet morphology in STZ-induced T1DM mice. (A) Weekly body weight and (B) weekly fasting blood-glucose (FBG) trajectories from W0 to W7; the treatment window (W0–W2) is shaded. Hashes (#) denote comparisons versus Normal, asterisks (*) denote comparisons versus T1DM; symbols are plotted on the colored line of the contrasted group. (C) Plasma insulin at the W7 endpoint. (D,E) Serum LDL-C and HDL-C. (F,G) Liver and kidney indices. (H) Representative pancreatic H&E sections (200× and 400×). (I) Relative islet area at W7. Data are mean ± SEM (n = 10 per group). * p < 0.05, ** p < 0.01, *** p < 0.001, **** p < 0.0001 vs. T1DM; # p < 0.05, ### p < 0.001, #### p < 0.0001 vs. Normal.
Nutrients 17 03201 g001
Figure 2. ISO reprograms the plasma metabolome of diabetic mice. (A) PCA score plots (ESI+/ESI) for Normal (pink), T1DM (green), and T1DM + L-ISO (blue). (B) OPLS-DA score plots for pairwise models: Normal vs. T1DM (left) and T1DM vs. T1DM + L-ISO (right); adjacent histograms show permutation-test Q2 distributions (1000 permutations), with the downward arrow marking the observed (non-permuted) Q2; of the original model. (C) Volcano plot for T1DM vs. T1DM + L-ISO (p < 0.05, |fold change| > 1.5). (D) Heatmap of the top-25 VIP metabolites (same comparison). (E) KEGG pathway enrichment of differential metabolites; bubble size indicates metabolite count and color denotes −log10(p). Analyses were performed in MetaboAnalyst 6.0.
Nutrients 17 03201 g002
Figure 3. ISO targets the PI3K/AKT axis according to network-pharmacology and molecular-docking analyses. (A) Workflow: ISO and T1DM targets were collected and integrated via PPI construction, enrichment analysis, topological screening, and docking. (B) Venn diagram showing 77 overlapping targets; inset, STRING PPI network (72 nodes, 591 edges). (C) GO enrichment (top 10 terms for BP/CC/MF). (D) KEGG enrichment bubble plot; bubble size indicates gene count and color denotes −log10(p). (E) Core-target screening based on topology (closeness > 0.0075; betweenness > 65.5; degree > 16.4) with the interaction subnetwork. (F) Docking to six hubs (AKT1, ESR1, PPARG, EGFR, SRC, PTGS2); representative poses (left) and binding affinities (kcal/mol) with PDB IDs (right). Corresponding 2D interaction diagrams are provided in Supplementary Figure S2.
Nutrients 17 03201 g003
Figure 4. ISO integrates metabolite and gene networks to modulate inflammatory and survival signaling. (A) Simplified compound–enzyme–gene subnetwork focused on the arachidonic-acid/eicosanoid axis, highlighting key ISO-linked hubs and metabolites (e.g., PTGS2/COX-2, CYP1A1/1B1, CYP19A1, 11,12,15-THETA, lipoxin A4). Labels are enlarged for legibility; nodes are color-coded by four concentric layers. The full network and parameter settings are provided in Supplementary Figure S1 (vector file); the underlying data are available as Supplementary Tables S3 and S4 (node and edge tables, CSV). (B) Western blot validation of PI3K, phospho-AKT (P-AKT), total AKT (T-AKT), BCL-2, COX-2, and PTGER2 in pancreatic tissue. Bar graphs show band intensities normalized to actin (mean ± SEM, n = 3). Significance codes: * p < 0.05, ** p < 0.01 (vs. T1DM); ## p < 0.01, #### p < 0.0001 (vs. Normal). Colored dots over each bar denote individual biological replicates (n = 3); dot colors match the corresponding bar colors.
Nutrients 17 03201 g004
Figure 5. ISO protects INS-1 β-cells from PI3K inhibition–induced damage. (A) Cell viability (CCK-8) after 24 h co-treatment with LY294002 (0, 5, 10, 15 µM) and ISO (0, 1, 2, 4 µM). (B) Intracellular ROS visualized by DCFH-DA (representative micrographs) and quantified. (C) Western blot of PI3K/AKT signaling: phospho-PI3K (P-PI3K), total PI3K (T-PI3K), phospho-AKT (P-AKT), and total AKT (T-AKT), with β-actin as the loading control. Bars show densitometry normalized to actin (mean ± SEM, n = 3). * p < 0.05, ** p < 0.01, *** p < 0.001 vs. LY-only; ## p < 0.01, ### p < 0.001, #### p < 0.0001 vs. untreated Control. Colored dots overlaid on bars denote individual biological replicates (n = 3).
Nutrients 17 03201 g005
Table 1. Key metabolites altered by ISO treatment in T1DM mice (T1DM+L-ISO vs. T1DM comparison; ESI+/ESI).
DescriptionESI Modem/zRetention Time (min)HMDB IDKEGG IDPubChem IDAUCp ValueFold Change (log2)
Porphobilinogenpositive227.10481.28 HMDB0000245C0093110210.97 0.00026 −2.5903
20-Carboxy-leukotriene B4negative365.19830.92 HMDB0006059C0595052808770.91 0.00138 1.2271
Cinnamic acidpositive149.05900.77 HMDB0000567C1043853729540.91 0.00000 −0.4465
Sphinganinepositive302.30611.80 HMDB0000269C00836914860.90 0.00007 0.5605
6-keto-prostaglandin F1αpositive371.23673.47 HMDB0002886C0596152808880.89 0.00001 −0.8282
Tetrahydrobiopterinpositive242.12021.45 HMDB0000027C00272442570.88 0.00133 −2.8345
3-(Methylthio)-1-propanolpositive107.05101.08 HMDB0031716C08249104480.86 0.00023 0.4962
Glycerol 3-phosphatenegative171.00700.80 HMDB0000126C000934391620.85 0.00243 −0.7937
Citric acidnegative191.02010.75 HMDB0000094C001583110.85 0.00003 0.5885
Pyridoxal 5’-phosphatepositive248.03501.13 HMDB0001491C0001810510.85 0.00007 −0.9147
15-Deoxy-d-12,14-PGJ2positive317.20953.24 HMDB0005079C1471753112110.84 0.00001 −2.1549
PE(20:4(5Z,8Z,11Z,14Z)/18:0)negative766.53854.30 HMDB0009387C00350529246440.84 0.00154 −0.3945
Uric acidnegative167.02160.73 HMDB0000289C0036611750.83 0.00010 −0.6480
N6,N6,N6-Trimethyl-L-lysinepositive189.16101.00 HMDB0001325C037934401200.81 0.00027 0.9815
Suberic acidnegative173.08290.22 HMDB0000893C08278104570.81 0.00041 −0.7202
Retinoyl β-glucuronidepositive477.24010.84 HMDB0003141C1106152818770.81 0.00035 −0.8292
12,13-DiHOMEnegative313.23741.25 HMDB0004705C14829253208700.80 0.00025 0.64733
Note. AUC, area under the ROC curve; m/z, mass-to-charge ratio; HMDB, Human Metabolome Database; KEGG, Kyoto Encyclopedia of Genes and Genomes; PubChem ID, compound identifier in PubChem. “Positive/negative” denote electrospray-ionization mode. Fold change is log2(ISO/T1DM); negative values indicate lower abundance in ISO relative to T1DM (downregulation by ISO).
Table 2. Top 10 Reactome pathways enriched by overlapping ISO–T1DM targets.
Pathway Namep ValueFDRPathway Identifier
Interleukin-4 and Interleukin-13 signaling8.22 × 10−147.88 × 10⁻¹¹R-HSA-6785807
Negative regulation of the PI3K/AKT network7.45 × 10−133.57 × 10⁻¹⁰R-HSA-199418
PI3K/AKT Signaling in Cancer3.25 × 10−121.04 × 10⁻⁹R-HSA-2219528
PI5P, PP2A and IER3 Regulate PI3K/AKT Signaling5.30 × 10−121.27 × 10⁻⁹R-HSA-6811558
Extra-nuclear estrogen signaling6.66 × 10−121.27 × 10⁻⁹R-HSA-9009391
Signaling by Receptor Tyrosine Kinases2.10 × 10−113.33 × 10⁻⁹R-HSA-9006934
ESR-mediated signaling2.14 × 10−102.94 × 10⁻⁸R-HSA-8939211
PIP3 activates AKT signaling4.85 × 10−105.53 × 10⁻⁸R-HSA-1257604
Intracellular signaling by second messengers5.21 × 10−105.53 × 10⁻⁸R-HSA-9006925
Constitutive Signaling by Aberrant PI3K in Cancer7.75 × 10−107.36 × 10⁻⁸R-HSA-2219530
Note. Pathways are ranked by ascending p value; FDR denotes Benjamini–Hochberg-adjusted values; “Pathway identifier” lists the Reactome stable IDs.
Disclaimer/Publisher’s Note: The statements, opinions and data contained in all publications are solely those of the individual author(s) and contributor(s) and not of MDPI and/or the editor(s). MDPI and/or the editor(s) disclaim responsibility for any injury to people or property resulting from any ideas, methods, instructions or products referred to in the content.