

A Preliminary Study of Nutrients Related to the Risk of Relative Energy Deficiency in Sport (RED-S) in Top-Performing Female Amateur Triathletes: Results from a Nutritional Assessment

 , ,
, ,  , and
, and
Abstract
1. Introduction
2. Materials and Methods
2.1. Participants
2.2. Dietary Assessment
2.3. Resting Energy Expenditure
2.4. Exercise Energy Expenditure
2.5. Physical Activity Level, Total Energy Expenditure
2.6. Low Energy Availability in Females Questionnaire
2.7. Statistical Analysis
3. Results
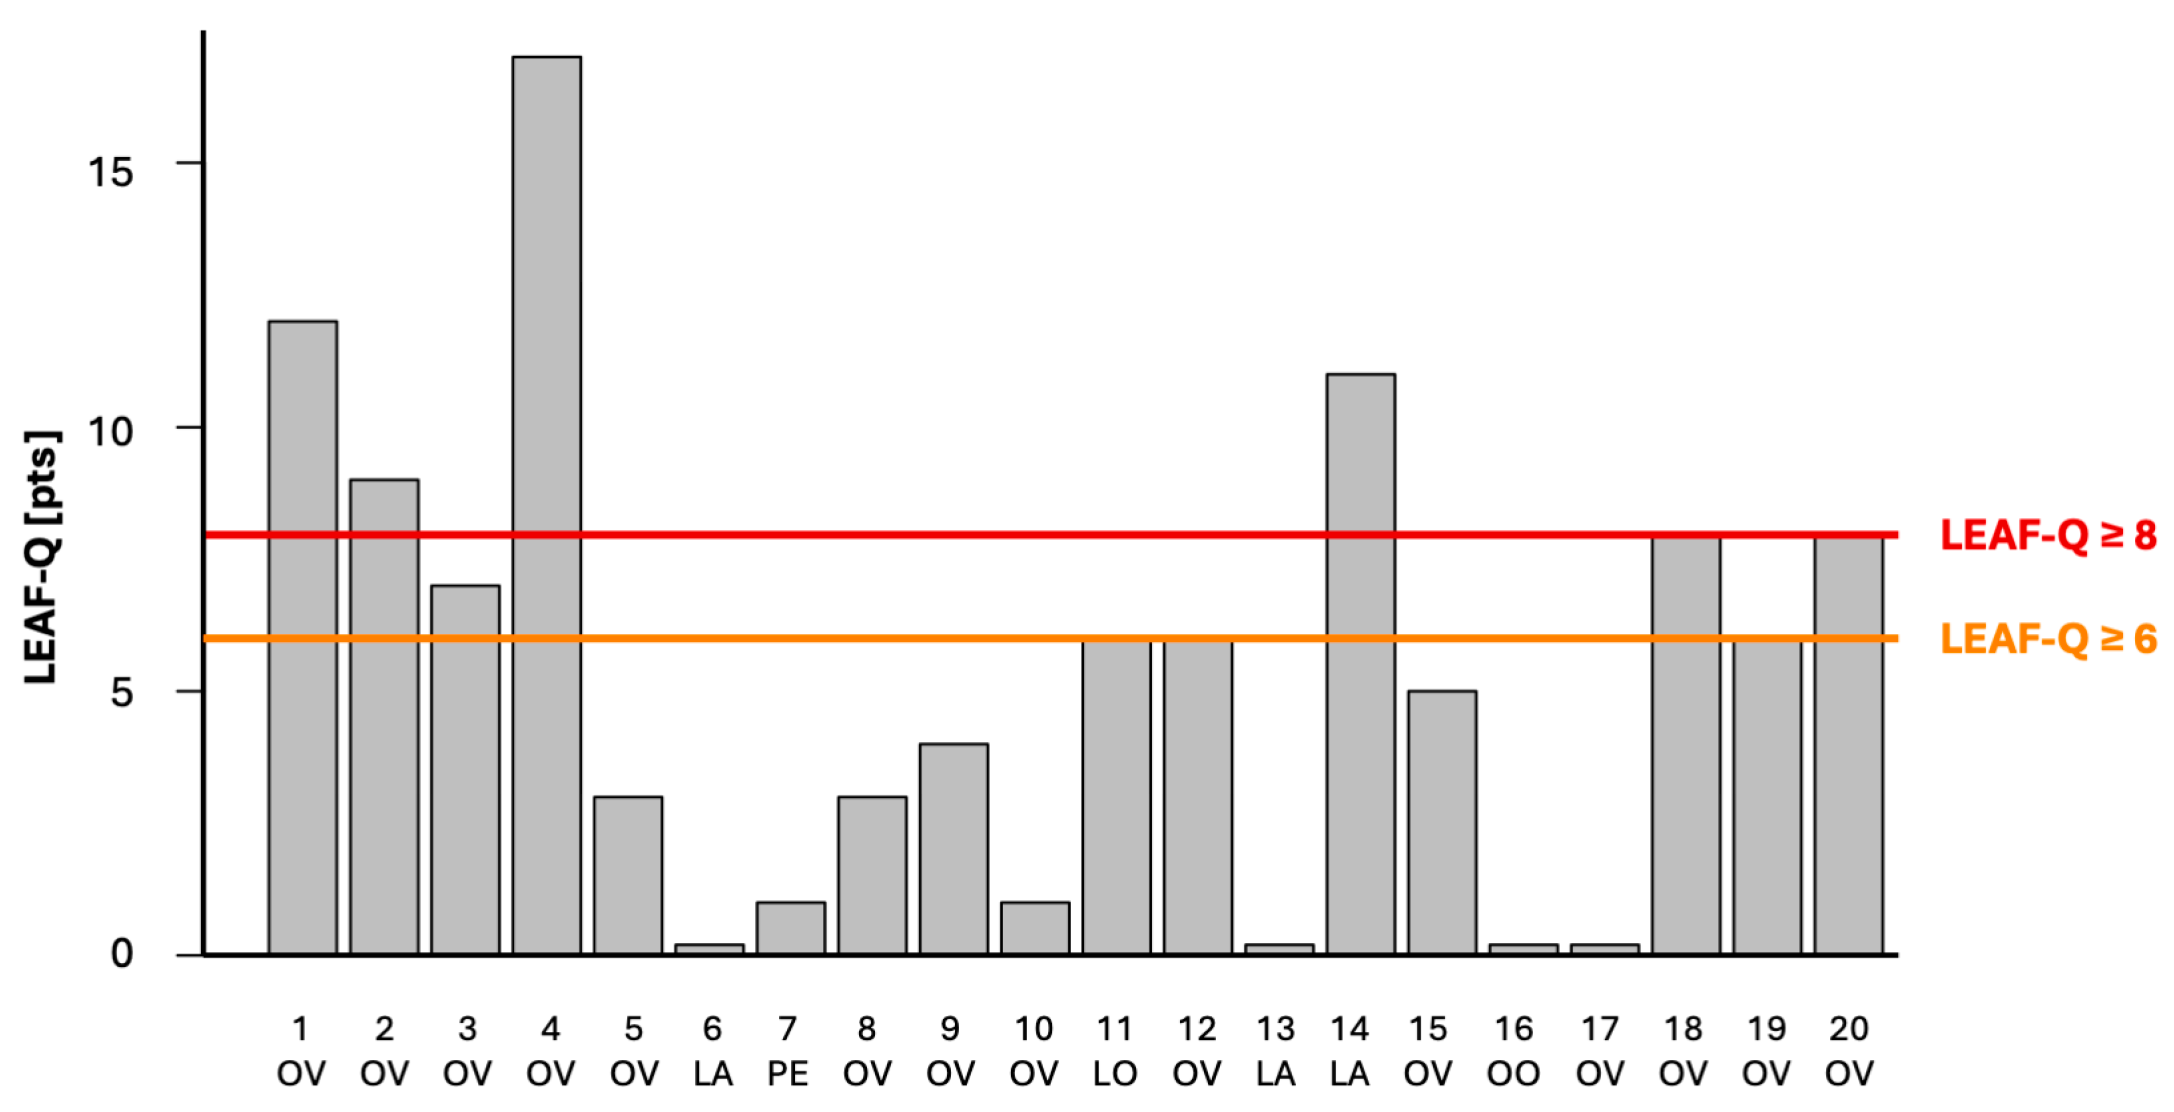
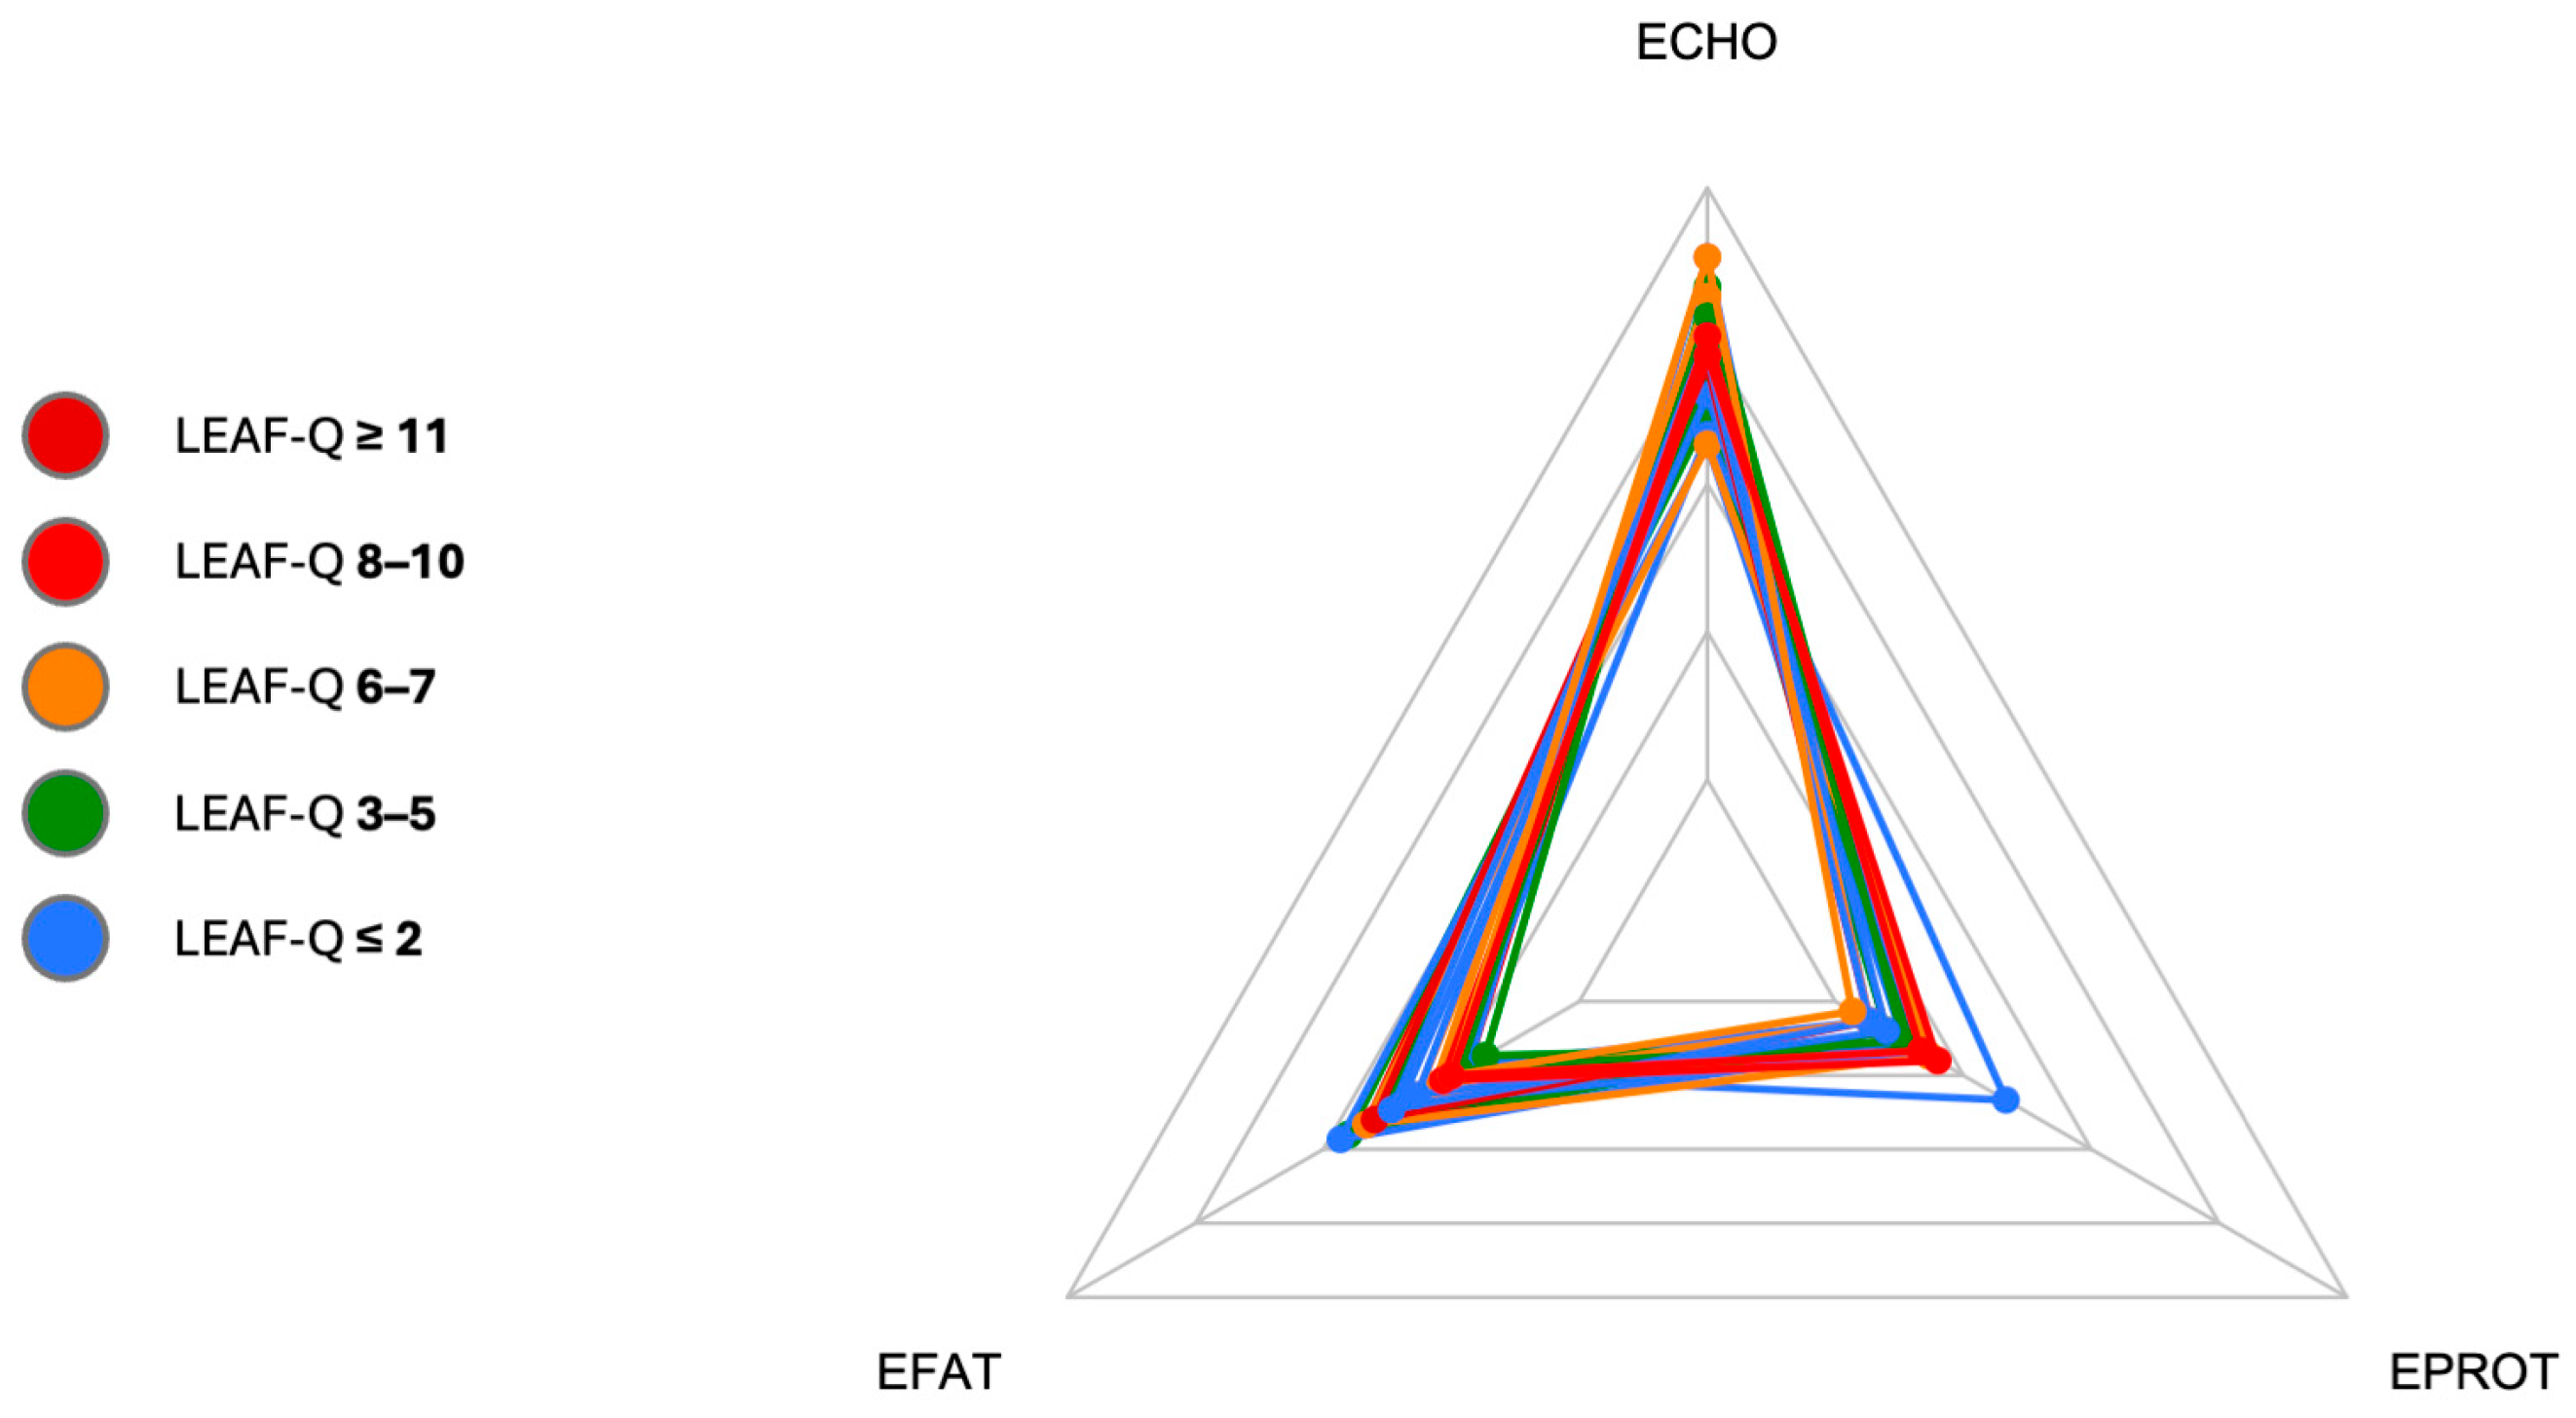
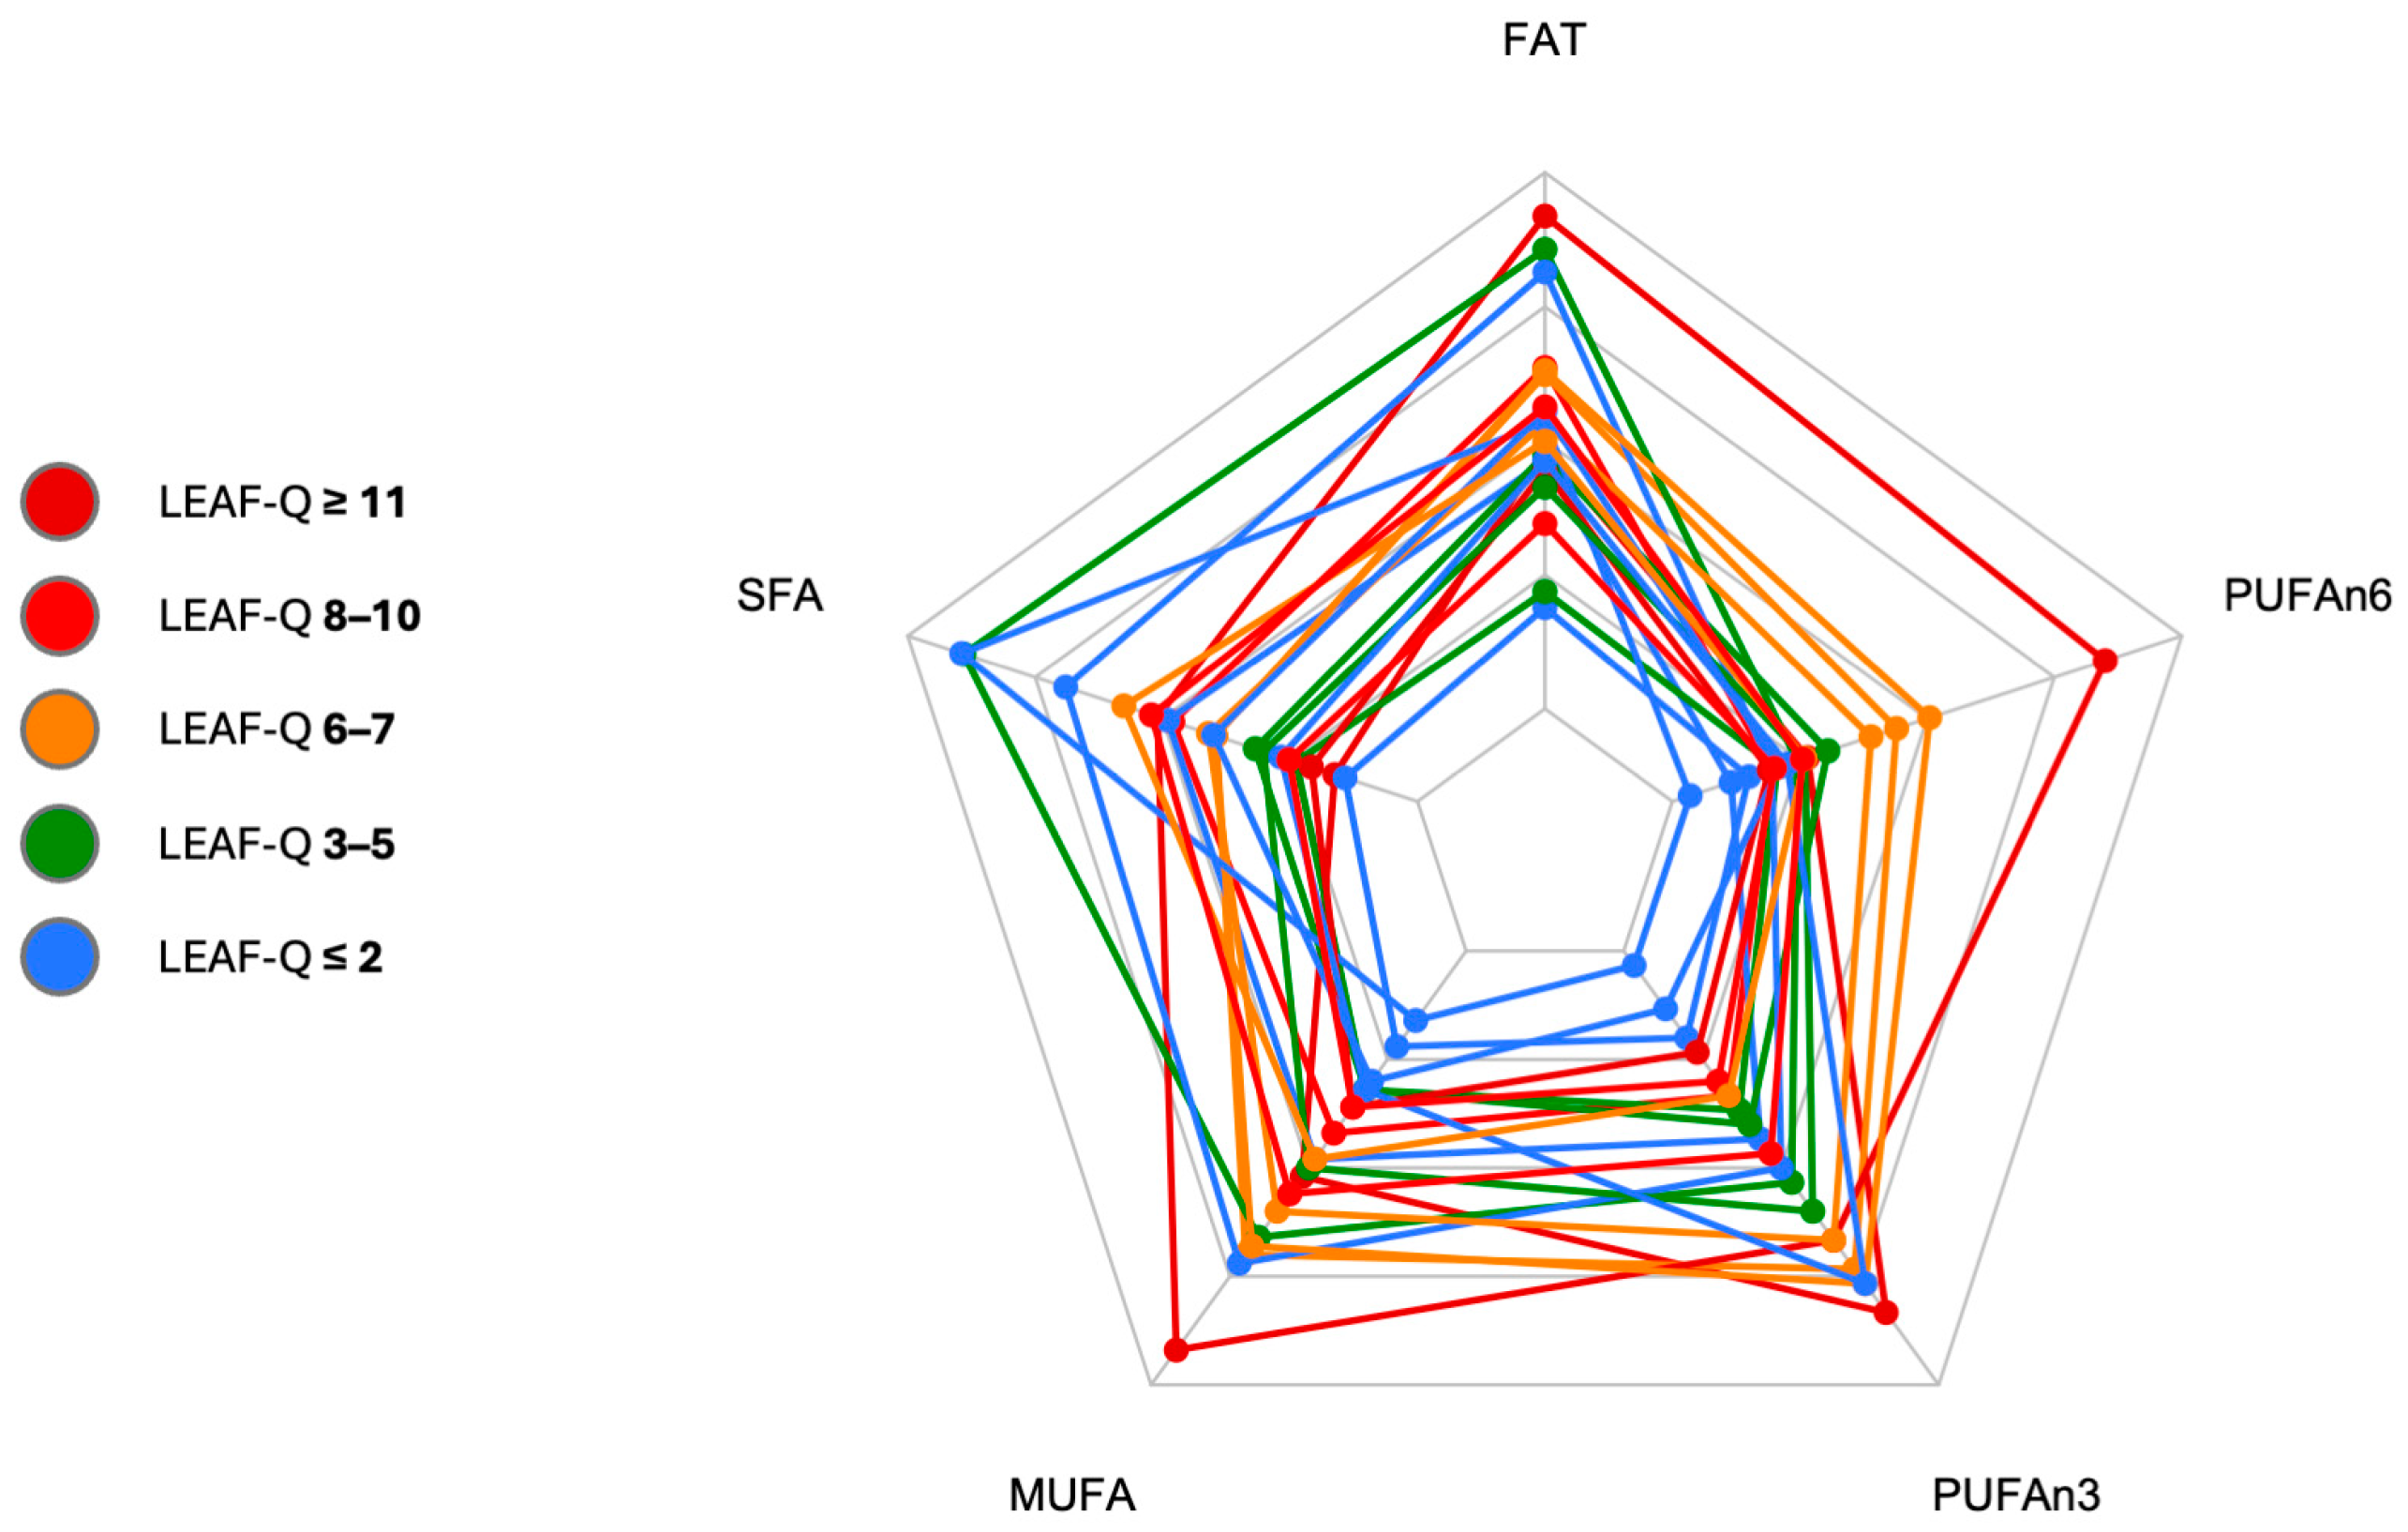
3.1. Low Energy Availability in Females Questionnaire Scores
3.2. Energy Assessment
3.3. Training Load
3.4. Dietary Intake of Macronutrients
3.4.1. Carbohydrates
3.4.2. Protein
3.4.3. Fat
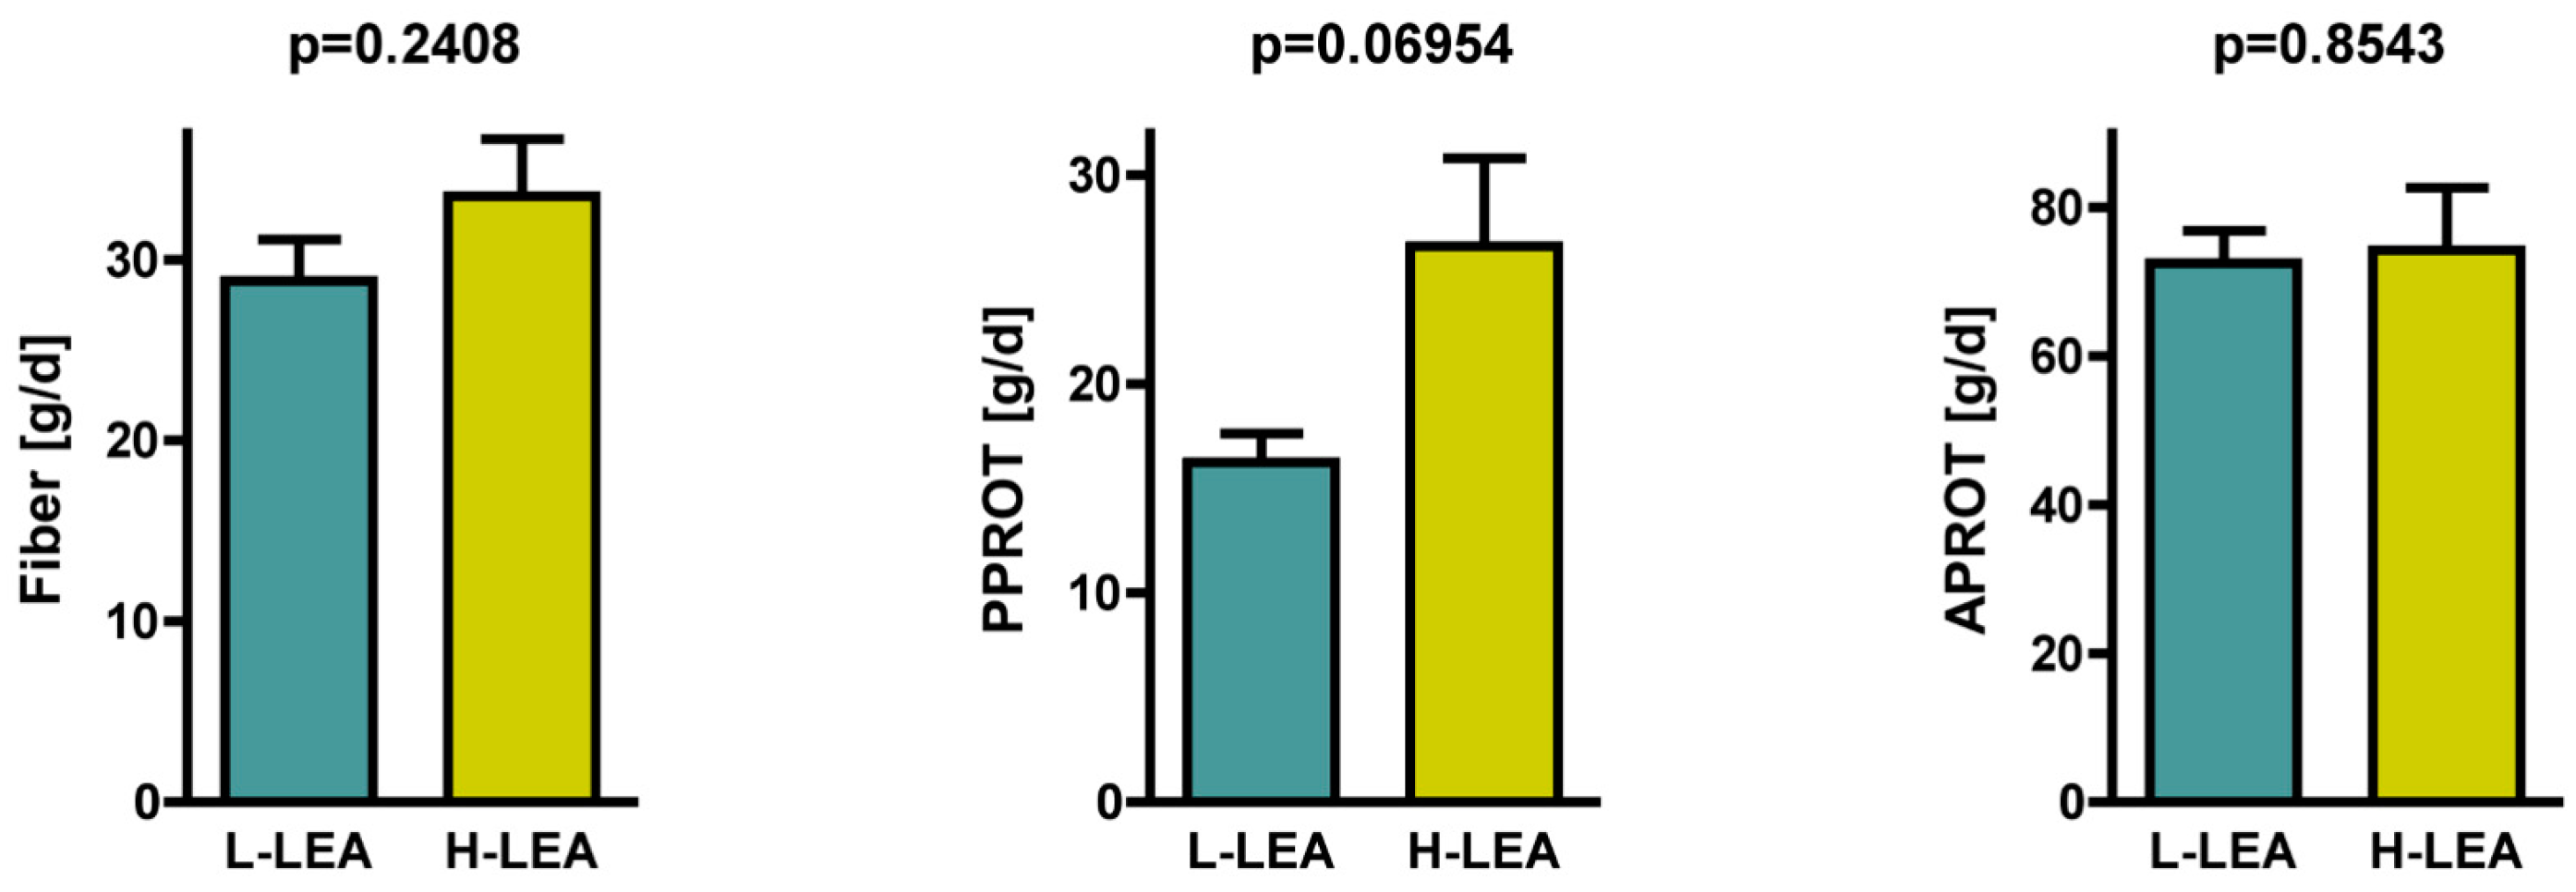
3.5. Fiber Intake
3.6. Dietary Intake of Micronutrients—Iron and Calcium
4. Discussion
Limitations
5. Conclusions
Author Contributions
Funding
Institutional Review Board Statement
Informed Consent Statement
Data Availability Statement
Acknowledgments
Conflicts of Interest
References
- Yeager, K.K.; Agostini, R.; Nattiv, A.; Drinkwater, B. The female athlete triad: Disordered eating, amenorrhea, osteoporosis. Med. Sci. Sports Exerc. 1993, 25, 775–777. [Google Scholar] [CrossRef] [PubMed]
- Mountjoy, M.; Sundgot-Borgen, J.; Burke, L.; Carter, S.; Constantini, N.; Lebrun, C.; Meyer, N.; Sherman, R.; Steffen, K.; Budgett, R.; et al. The IOC consensus statement: Beyond the Female Athlete Triad-Relative Energy Deficiency in Sport (RED-S). Br. J. Sports Med. 2014, 48, 491–497. [Google Scholar] [CrossRef] [PubMed]
- Mountjoy, M.; Ackerman, K.E.; Bailey, D.M.; Burke, L.M.; Constantini, N.; Hackney, A.C.; Heikura, I.A.; Melin, A.; Pensgaard, A.M.; Stellingwerff, T.; et al. 2023 International Olympic Committee’s (IOC) consensus statement on Relative Energy Deficiency in Sport (REDs). Br. J. Sports Med. 2024, 57, 1073–1097. [Google Scholar] [CrossRef]
- Jeukendrup, A.E.; Areta, J.L.; Van Genechten, L.; Langan-Evans, C.; Pedlar, C.R.; Rodas, G.; Sale, C.; Walsh, N.P. Does Relative Energy Deficiency in Sport (REDs) Syndrome Exist? Sports Med. 2024, 54, 2793–2816. [Google Scholar] [CrossRef]
- Scheer, V.; Tiller, N.B.; Doutreleau, S.; Khodaee, M.; Knechtle, B.; Pasternak, A.; Rojas-Valverde, D. Potential Long-Term Health Problems Associated with Ultra-Endurance Running: A Narrative Review. Sports Med. 2022, 52, 725–740. [Google Scholar] [CrossRef]
- Tiller, N.B.; Elliott-Sale, K.J.; Knechtle, B.; Wilson, P.B.; Roberts, J.D.; Millet, G.Y. Do Sex Differences in Physiology Confer a Female Advantage in Ultra-Endurance Sport? Sports Med. 2021, 51, 895–915. [Google Scholar] [CrossRef] [PubMed]
- Zaryski, C.; Smith, D.J. Training Principles and Issues for Ultra-endurance Athletes. Curr. Sports Med. Rep. 2005, 4, 165–170. [Google Scholar] [CrossRef] [PubMed]
- Knechtle, B.; Valero, D.; Villiger, E.; Thuany, M.; Andrade, M.S.; Cuk, I.; Nikolaidis, P.T.; Rosemann, T.; Weiss, K. Sex difference in IRONMAN age group triathletes. PLoS ONE 2024, 19, e0311202. [Google Scholar] [CrossRef] [PubMed]
- Lieberman, J.L.; De Souza, M.J.; Wagstaff, D.A.; Williams, N.I. Menstrual Disruption with Exercise Is Not Linked to an Energy Availability Threshold. Med. Sci. Sports Exerc. 2018, 50, 551–561. [Google Scholar] [CrossRef]
- Williams, N.I.; Leidy, H.J.; Hill, B.R.; Lieberman, J.L.; Legro, R.S.; De Souza, M.J. Magnitude of daily energy deficit predicts frequency but not severity of menstrual disturbances associated with exercise and caloric restriction. Am. J. Physiol. Endocrinol. Metab. 2015, 308, E29–E39. [Google Scholar] [CrossRef]
- Watkins, R.A.; Guillen, R.V. Primary Care Considerations for the Pediatric Endurance Athlete. Curr. Rev. Musculoskelet. Med. 2024, 17, 76–82. [Google Scholar] [CrossRef]
- Bentley, D.J.; Millet, G.P.; Vleck, V.E.; McNaughton, L.R. Specific aspects of contemporary triathlon: Implications for physiological analysis and performance. Sports Med. 2002, 32, 345–359. [Google Scholar] [CrossRef] [PubMed]
- Kimber, N.E.; Ross, J.J.; Mason, S.L.; Speedy, D.B. Energy balance during an ironman triathlon in male and female triathletes. Int. J. Sport Nutr. Exerc. Metab. 2002, 12, 47–62. [Google Scholar] [CrossRef] [PubMed]
- Melin, A.; Tornberg, A.B.; Skouby, S.; Faber, J.; Ritz, C.; Sjödin, A.; Sundgot-Borgen, J. The LEAF questionnaire: A screening tool for the identification of female athletes at risk for the female athlete triad. Br. J. Sports Med. 2014, 48, 540–545. [Google Scholar] [CrossRef]
- Henninger, K.; Pritchett, K.; Brooke, N.K.; Dambacher, L. Low Energy Availability, Disordered Eating, Exercise Dependence, and Fueling Strategies in Trail Runners. Int. J. Exerc. Sci. 2024, 16, 1471–1486. [Google Scholar] [CrossRef] [PubMed]
- Laughlin, G.A.; Yen, S.S. Nutritional and Endocrine-Metabolic Aberrations in Amenorrheic Athletes. J. Clin. Endocrinol. Metab. 1996, 81, 4301–4309. [Google Scholar] [CrossRef]
- Perry, A.C.; Crane, L.S.; Applegate, B.; Marquez-Sterling, S.; Signorile, J.F.; Miller, P.C. Nutrient intake and psychological and physiological assessment in eumenorrheic and amenorrheic female athletes: A preliminary study. Int. J. Sport Nutr. 1996, 6, 3–13. [Google Scholar] [CrossRef] [PubMed]
- Lebenstedt, M.; Platte, P.; Pirke, K.M. Reduced resting metabolic rate in athletes with menstrual disorders. Med. Sci. Sports Exerc. 1999, 31, 1250–1256. [Google Scholar] [CrossRef] [PubMed]
- Schaal, K.; Van Loan, M.D.; Casazza, G.A. Reduced catecholamine response to exercise in amenorrheic athletes. Med. Sci. Sports Exerc. 2011, 43, 34–43. [Google Scholar] [CrossRef] [PubMed]
- Melin, A.; Tornberg, Å.B.; Skouby, S.; Møller, S.S.; Faber, J.; Sundgot-Borgen, J.; Sjödin, A. Low-energy density and high fiber intake are dietary concerns in female endurance athletes. Scand. J. Med. Sci. Sports 2016, 26, 1060–1071. [Google Scholar] [CrossRef]
- Gomez-Merino, D.; Drogou, C.; Guezennec, C.Y.; Burnat, P.; Bourrilhon, C.; Tomaszewski, A.; Milhau, S.; Chennaoui, M. Comparison of systemic cytokine responses after a long distance triathlon and a 100-km run: Relationship to metabolic and inflammatory processes. Eur. Cytokine Netw. 2006, 17, 117–124. [Google Scholar] [PubMed]
- Szponar, L.; Wolnicka, K.; Rychlik, E. Album Fotografii Produktów i Potraw [Album of Photographs of Food Products and Dishes]; National Food and Nutrition Institute: Warsaw, Poland, 2000. [Google Scholar]
- Roza, A.M.; Shizgal, H.M. The Harris Benedict equation reevaluated: Resting energy requirements and the body cell mass. Am. J. Clin. Nutr. 1984, 40, 168–182. [Google Scholar] [CrossRef] [PubMed]
- Food and Agriculture Organization of the United Nations/World Health Organization/United Nations University (FAO/WHO/UNU). Human Energy Requirements: Report of a Joint FAO/WHO/UNU Expert Consultation; FAO: Rome, Italy, 2001. [Google Scholar]
- Kunachowicz, H.; Przygoda, B.; Nadolna, I.; Iwanow, K. Tabele Składu i Wartości Odżywczej Żywności [Tables of Composition and Nutritional Value of Food]; PZWL: Warsaw, Poland, 2020. [Google Scholar]
- Witkoś, J.; Błażejewski, G.; Gierach, M. The Low Energy Availability in Females Questionnaire (LEAF-Q) as a Useful Tool to Identify Female Triathletes at Risk for Menstrual Disorders Related to Low Energy Availability. Nutrients 2023, 15, 650. [Google Scholar] [CrossRef] [PubMed]
- Jeukendrup, A.E. Nutrition for endurance sports: Marathon, triathlon, and road cycling. J. Sports Sci. 2011, 29 (Suppl. S1), S91–S99. [Google Scholar] [CrossRef] [PubMed]
- Burke, L.M.; van Loon, L.J.C.; Hawley, J.A. Postexercise muscle glycogen resynthesis in humans. J. Appl. Physiol. 2017, 122, 1055–1067. [Google Scholar] [CrossRef]
- Thomas, D.T.; Erdman, K.A.; Burke, L.M. Position of the Academy of Nutrition and Dietetics, Dietitians of Canada, and the American College of Sports Medicine: Nutrition and Athletic Performance. J. Acad. Nutr. Diet. 2016, 116, 501–528. [Google Scholar] [CrossRef]
- Nogueira, J.A.; Da Costa, T.H. Nutrient intake and eating habits of triathletes on a Brazilian diet. Int. J. Sport Nutr. Exerc. Metab. 2004, 14, 684–697. [Google Scholar] [CrossRef]
- Houltham, S.D.; Rowlands, D.S. A snapshot of nitrogen balance in endurance-trained women. Appl. Physiol. Nutr. Metab. 2014, 39, 219–225. [Google Scholar] [CrossRef] [PubMed]
- Phillips, S.M.; Van Loon, L.J. Dietary protein for athletes: From requirements to optimum adaptation. J. Sports Sci. 2011, 29, S29–S38. [Google Scholar] [CrossRef]
- McColl, T.J.; Clarke, D.C. Kinetic modeling of leucine-mediated signaling and protein metabolism in human skeletal muscle. iScience 2024, 27, 108634. [Google Scholar] [CrossRef]
- U.S. Department of Agriculture, Agricultural Research Service. FoodData Central. Available online: https://fdc.nal.usda.gov/ (accessed on 30 September 2024).
- Gilani, G.S.; Xiao, C.W.; Cockell, K.A. Impact of antinutritional factors in food proteins on the digestibility of protein and the bioavailability of amino acids and on protein quality. Br. J. Nutr. 2012, 108, S315–S332. [Google Scholar] [CrossRef] [PubMed]
- Kaur, L.; Mao, B.; Beniwal, A.S.; Abhilasha; Kaur, R.; Chian, F.M.; Singh, J. Alternative proteins vs. animal proteins: The influence of structure and processing on their gastro-small intestinal digestion. Trends Food Sci. Technol. 2022, 122, 275–286. [Google Scholar] [CrossRef]
- Zackova, M.; Skobisová, E.; Urbánková, E.; Jezek, P. Activating omega-6 polyunsaturated fatty acids and inhibitory purine nucleotides are high affinity ligands for novel mitochondrial uncoupling proteins UCP2 and UCP3. J. Biol. Chem. 2003, 278, 20761–20769. [Google Scholar] [CrossRef]
- Della Guardia, L.; Luzi, L.; Codella, R. Muscle-UCP3 in the regulation of energy metabolism. Mitochondrion 2024, 76, 101872. [Google Scholar] [CrossRef]
- Livingstone, K.M.; Sexton-Dhamu, M.J.; Pendergast, F.J.; Worsley, A.; Brayner, B.; McNaughton, S.A. Energy-dense dietary patterns high in free sugars and saturated fat and associations with obesity in young adults. Eur. J. Nutr. 2022, 61, 1595–1607. [Google Scholar] [CrossRef] [PubMed]
- Ioniță-Mîndrican, C.-B.; Ziani, K.; Mititelu, M.; Oprea, E.; Neacșu, S.M.; Moroșan, E.; Dumitrescu, D.-E.; Roșca, A.C.; Drăgănescu, D.; Negrei, C. Therapeutic Benefits and Dietary Restrictions of Fiber Intake: A State of the Art Review. Nutrients 2022, 14, 2641. [Google Scholar] [CrossRef] [PubMed]
- Salleh, S.N.; Fairus, A.A.H.; Zahary, M.N.; Bhaskar Raj, N.; Mhd Jalil, A.M. Unravelling the Effects of Soluble Dietary Fibre Supplementation on Energy Intake and Perceived Satiety in Healthy Adults: Evidence from Systematic Review and Meta-Analysis of Randomised-Controlled Trials. Foods 2019, 8, 15. [Google Scholar] [CrossRef]
- Duan, G.; Li, J.; Duan, Y.; Zheng, C.; Guo, Q.; Li, F.; Zheng, J.; Yu, J.; Zhang, P.; Wan, M.; et al. Mitochondrial Iron Metabolism: The Crucial Actors in Diseases. Molecules 2023, 28, 29. [Google Scholar] [CrossRef]
- Institute of Medicine (US) Panel on Micronutrients. Iron. In Dietary Reference Intakes for Vitamin A, Vitamin K, Arsenic, Boron, Chromium, Copper, Iodine, Iron, Manganese, Molybdenum, Nickel, Silicon, Vanadium, and Zinc; The National Academies Press: Washington, DC, USA, 2001. [Google Scholar] [CrossRef]
- Beard, J.; Tobin, B. Iron status and exercise. Am. J. Clin. Nutr. 2000, 72, 594–597. [Google Scholar] [CrossRef]
- Alaunyte, I.; Stojceska, V.; Plunkett, A. Iron and the female athlete: A review of dietary treatment methods for improving iron status and exercise performance. J. Int. Soc. Sports Nutr. 2015, 12, 38. [Google Scholar] [CrossRef] [PubMed]
- Domínguez, R.; Sánchez-Oliver, A.J.; Mata-Ordoñez, F.; Feria-Madueño, A.; Grimaldi-Puyana, M.; López-Samanes, Á.; Pérez-López, A. Effects of an Acute Exercise Bout on Serum Hepcidin Levels. Nutrients 2018, 10, 209. [Google Scholar] [CrossRef]
- Nemeth, E.; Ganz, T. The role of hepcidin in iron metabolism. Acta Haematol. 2009, 122, 78–86. [Google Scholar] [CrossRef] [PubMed]
- Sale, C.; Elliott-Sale, K.J. Nutrition and Athlete Bone Health. Sports Med. 2019, 49, 139–151. [Google Scholar] [CrossRef] [PubMed]
- Dressendorfer, R.H.; Petersen, S.R.; Lovshin, S.E.; Keen, C.L. Mineral metabolism in male cyclists during high-intensity endurance training. Int. J. Sport Nutr. Exerc. Metab. 2002, 12, 63–72. [Google Scholar] [CrossRef]
- Ross, A.C.; Taylor, C.L.; Yaktine, A.L.; Del Valle, H.B.; Institute of Medicine (US) Committee to Review Dietary Reference Intakes for Vitamin D and Calcium. Dietary Reference Intakes for Calcium and Vitamin D; National Academies Press (US): Washington, DC, USA, 2011. [Google Scholar]
- Jarosz, M.; Rychlik, E.; Stoś, K.; Charzewska, J. Normy Żywienia dla Populacji Polski i ich Zastosowanie [Nutrition Standards for the Polish Population and Its Application]; NIZP-PZH: Warsaw, Poland, 2020. Available online: https://ncez.pzh.gov.pl/wp-content/uploads/2021/03/normy_zywienia_2020web.pdf (accessed on 29 September 2024).
- De Souza, M.J.; West, S.L.; Jamal, S.A.; Hawker, G.A.; Gundberg, C.M.; Williams, N.I. The presence of both an energy deficiency and estrogen deficiency exacerbate alterations of bone metabolism in exercising women. Bone 2008, 43, 140–148. [Google Scholar] [CrossRef] [PubMed]
- Pentyala, S.; Mysore, P.; Pentyala, S.; Rahman, A.; Urbanczyk, K.; Tumillo, T.; Khan, S. Osteoporosis in Female Athletes. Int. J. Clin. Ther. Diag. 2013, 1, 5–11. [Google Scholar] [CrossRef]


| Variable | Mean | SD |
|---|---|---|
| Age | 37.8 | 9.00 |
| Height [cm] | 169.8 | 5.48 |
| Body mass [kg] | 62.3 | 7.72 |
| BMI [kg/m2] | 21.6 | 2.03 |
| Training load [h/week] 1 | 11.0 | 3.76 |
| Training session [min/d] 2 | 84.3 | 25.4 |
| Participant | Diet | Triathlon * | LEAF-Q Injuries | LEAF-Q Gastrointestinal Symptoms | LEAF-Q Menstrual Function | LEAF-Q [pts] |
|---|---|---|---|---|---|---|
| 1 | OV | IM | 4 | 5 | 3 | 12 |
| 2 | OV | IM | 2 | 6 | 1 | 9 |
| 3 | OV | 1/2 IM | 0 | 0 | 7 | 7 |
| 4 | OV | 1/2 IM | 1 | 4 | 12 | 17 |
| 5 | OV | DIM | 0 | 0 | 3 | 3 |
| 6 | LA | 1/2 IM | 0 | 0 | 0 | 0 |
| 7 | PE | IM | 0 | 1 | 0 | 1 |
| 8 | OV | 1/2 IM | 0 | 0 | 3 | 3 |
| 9 | OV | DIM | 2 | 2 | 0 | 4 |
| 10 | OV | 1/4 IM | 0 | 0 | 1 | 1 |
| 11 | LO | 1/4 IM | 0 | 2 | 4 | 6 |
| 12 | OV | 1/2 IM | 0 | 6 | 0 | 6 |
| 13 | LA | 1/2 IM | 0 | 3 | 0 | 0 |
| 14 | LA | 1/2 IM | 4 | 3 | 4 | 11 |
| 15 | OV | 1/2 IM | 0 | 5 | 0 | 5 |
| 16 | OO | 1/4 IM | 0 | 0 | 0 | 0 |
| 17 | OV | 1/4 IM | 0 | 0 | 0 | 0 |
| 18 | OV | IM | 0 | 1 | 7 | 8 |
| 19 | OV | 1/4 IM | 2 | 0 | 4 | 6 |
| 20 | OV | 1/2 IM | 0 | 3 | 5 | 8 |
| Variable | L-LEA * | H-LEA * | Cohen’s d | Effect Size | 95% CI | p 1 |
|---|---|---|---|---|---|---|
| REE [kcal] | 1382.8 ± 94.4 | 1390 ± 87.9 | 0.079 | negligible | −0.86, 1.02 | 0.8619 |
| aTEE [kcal/d] | 2436 ± 219 | 2532 ± 247 | 0.414 | small | −0.54, 1.36 | 0.7302 |
| rTEE [kcal/kg/d] | 39.86 ± 4.37 | 40.49 ± 3.34 | 0.163 | negligible | −0.78, 1.10 | 0.7205 |
| aEI [kcal/d] | 1946 ± 362 | 2204 ± 442 | 0.640 | medium | −0.32, 1.60 | 0.1697 |
| rEI [kcal/kg/d] | 32.2 ± 7.88 | 35.45 ± 8.21 | 0.403 | small | −0.55, 1.35 | 0.3793 |
| aED [kcal/d] | −490.1 ± 456 | −328.7 ± 492 | 0.340 | small | −0.61, 1.29 | 0.4564 |
| rED [kcal/kg/d] | −7.65 ± 7.23 | −5.04 ± 8.05 | 0.341 | small | −0.61, 1.29 | 0.4552 |
| rED [%] | −19.24 ± 18.2 | −12.26 ± 19.9 | 0.366 | small | −0.58, 1.31 | 0.4234 |
| Variable | L-LEA * | H-LEA * | Cohen’s d | Effect Size | 95% CI | p 1 |
|---|---|---|---|---|---|---|
| Age | 37.5 ± 7.04 | 38.1 ± 11.01 | 0.065 | negligible | −0.87, 1.00 | 0.8862 |
| Height [cm] | 170.1 ± 6.42 | 169.5 ± 4.69 | −0.107 | negligible | −1.05, 0.83 | 0.8142 |
| Body mass [kg] | 61.7 ± 8.14 | 62.9 ± 7.67 | 0.152 | negligible | −0.79, 1.09 | 0.7382 |
| BMI [kg/m2] | 21.24 ± 1.88 | 21.87 ± 2.23 | 0.306 | small | −0.64, 1.25 | 0.5032 |
| Training load [h/week] 2 | 12.5 ± 4.79 | 9.5 ± 1.35 | −0.852 | large | −1.83, 0.13 | 0.0374 |
| Training session [min/d] 3 | 88.4 ± 33.5 | 80.2 ± 14.3 | −0.318 | small | −1.26, 0.62 | 0.7620 |
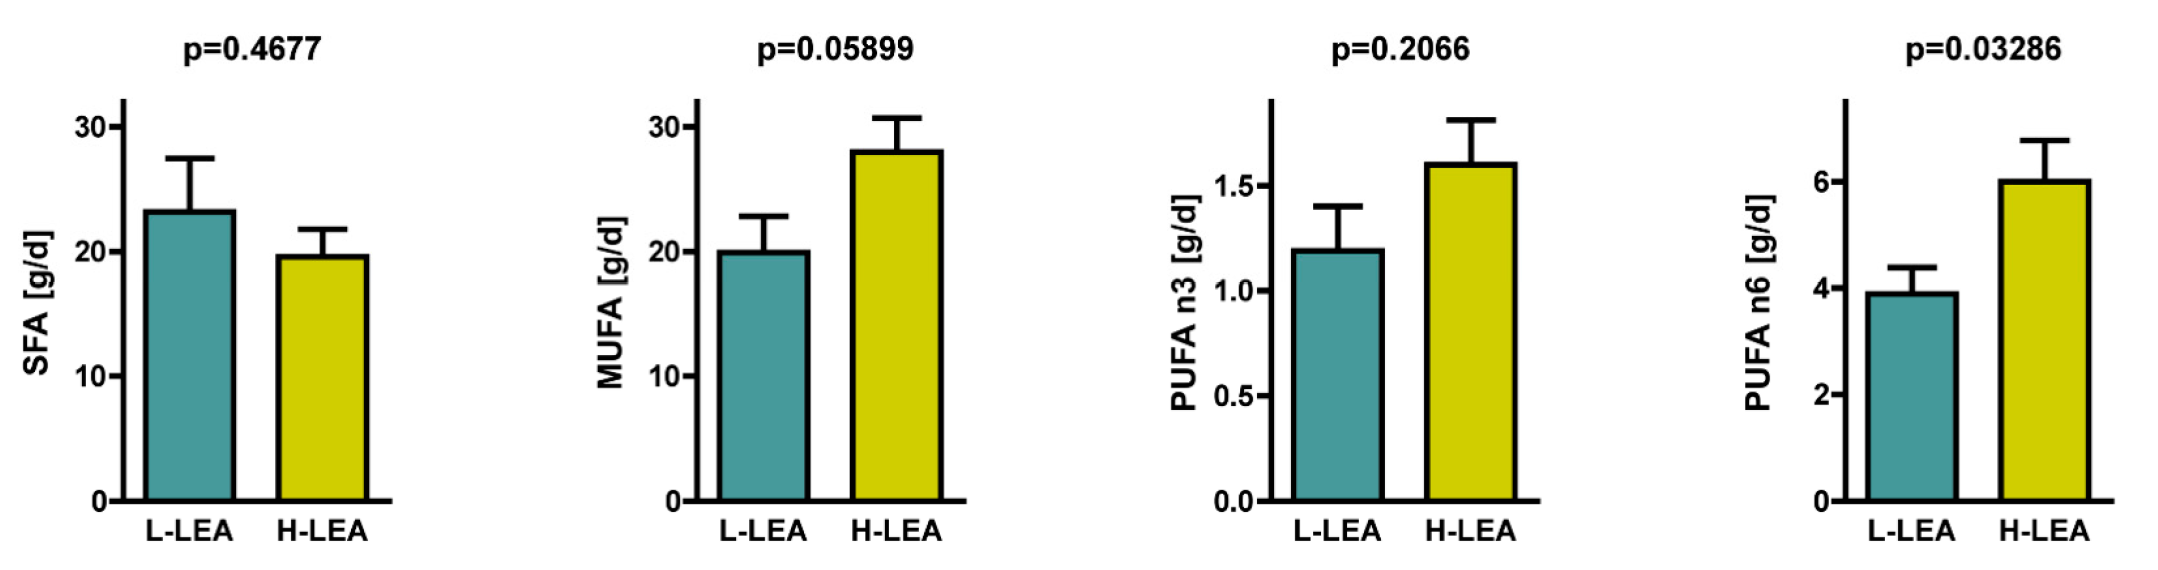
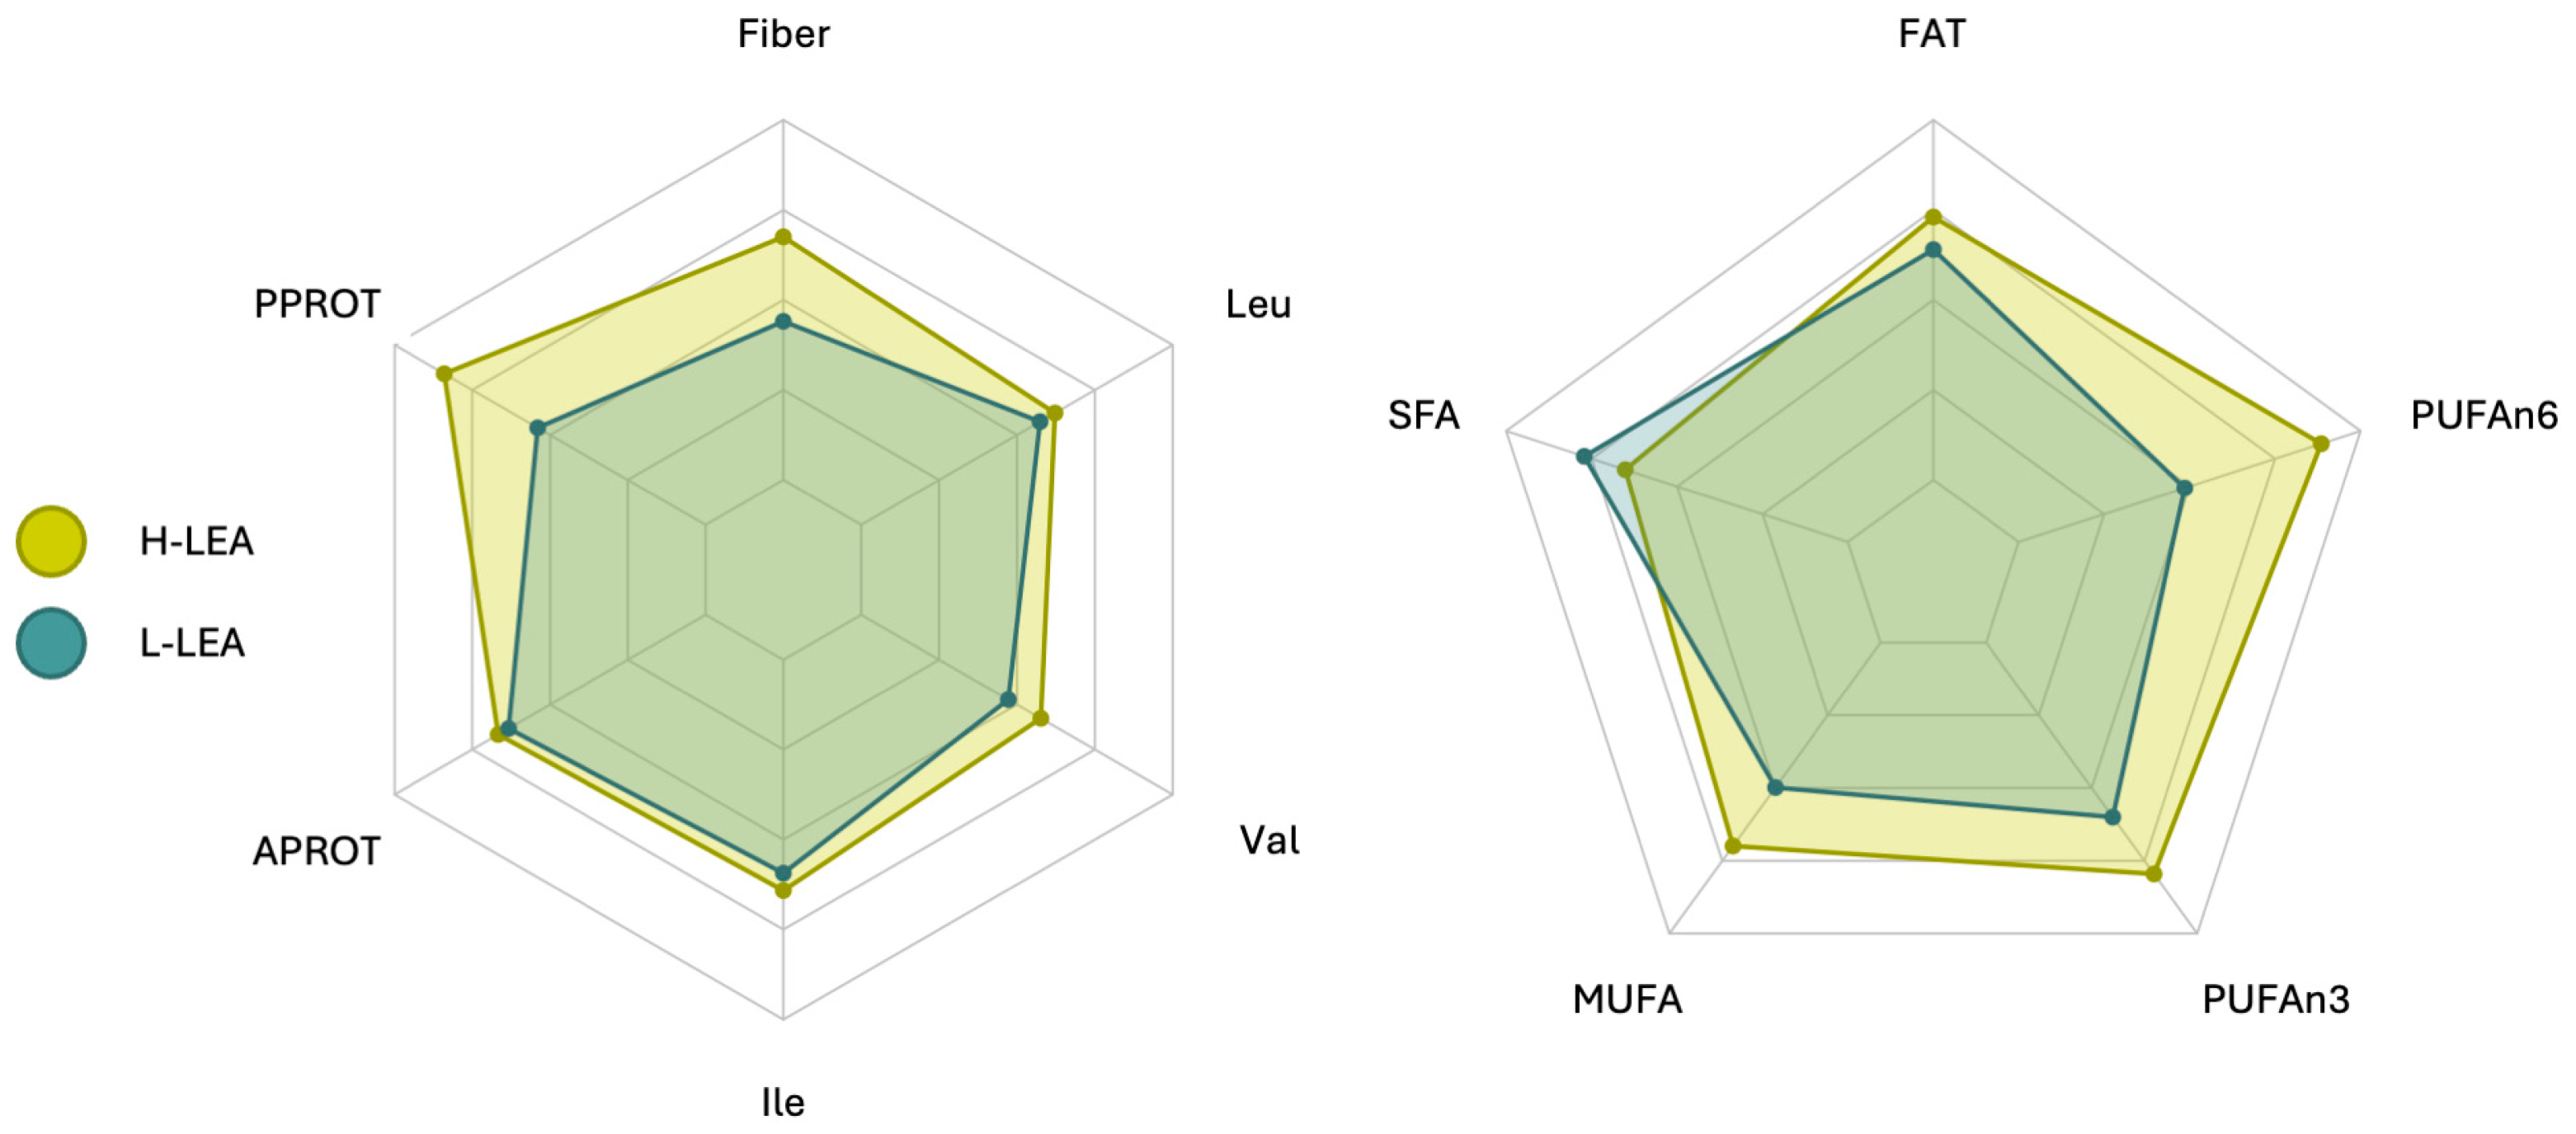
| Variable | L-LEA * | H-LEA * | Cohen’s d | Effect Size | 95% CI | p 1 |
|---|---|---|---|---|---|---|
| Fiber [g/d] | 28.8 ± 7.2 | 33.5 ± 9.9 | 0.54 | medium | −0.41, 1.50 | 0.2408 |
| Plant PROT [g/d] | 16.2 ± 4.4 | 26.6 ± 13.3 | 1.04 | large | 0.04, 2.05 | 0.0563 |
| PUFA [g/d] | 8.2 ± 2.2 | 12.2 ± 4.7 | 1.09 | large | 0.09, 2.10 | 0.0115 |
| PUFAn6 [g/d] | 3.9 ± 1.5 | 7.1 ± 4.1 | 1.02 | large | 0.03, 2.02 | 0.0329 |
| PUFAn3 [g/d] | 1.2 ± 0.7 | 1.6 ± 0.7 | 0.59 | medium | −0.37, 1.55 | 0.2066 |
| MUFA [g/d] | 19.9 ± 9.2 | 28.0 ± 8.6 | 0.90 | large | −0.08, 1.89 | 0.0590 |
| SFA [g/d] | 23.2 ± 13.6 | 19.6 ± 7.1 | −0.33 | small | −1.28, 0.61 | 0.4677 |
Disclaimer/Publisher’s Note: The statements, opinions and data contained in all publications are solely those of the individual author(s) and contributor(s) and not of MDPI and/or the editor(s). MDPI and/or the editor(s) disclaim responsibility for any injury to people or property resulting from any ideas, methods, instructions or products referred to in the content. |
© 2025 by the authors. Licensee MDPI, Basel, Switzerland. This article is an open access article distributed under the terms and conditions of the Creative Commons Attribution (CC BY) license (https://creativecommons.org/licenses/by/4.0/).
Share and Cite
Langa, D.; Naczyk, M.; Szymczak, R.K.; Karbowska, J.; Kochan, Z. A Preliminary Study of Nutrients Related to the Risk of Relative Energy Deficiency in Sport (RED-S) in Top-Performing Female Amateur Triathletes: Results from a Nutritional Assessment. Nutrients 2025, 17, 208. https://doi.org/10.3390/nu17020208
Langa D, Naczyk M, Szymczak RK, Karbowska J, Kochan Z. A Preliminary Study of Nutrients Related to the Risk of Relative Energy Deficiency in Sport (RED-S) in Top-Performing Female Amateur Triathletes: Results from a Nutritional Assessment. Nutrients. 2025; 17(2):208. https://doi.org/10.3390/nu17020208
Chicago/Turabian StyleLanga, Dorota, Marta Naczyk, Robert K. Szymczak, Joanna Karbowska, and Zdzislaw Kochan. 2025. "A Preliminary Study of Nutrients Related to the Risk of Relative Energy Deficiency in Sport (RED-S) in Top-Performing Female Amateur Triathletes: Results from a Nutritional Assessment" Nutrients 17, no. 2: 208. https://doi.org/10.3390/nu17020208
APA StyleLanga, D., Naczyk, M., Szymczak, R. K., Karbowska, J., & Kochan, Z. (2025). A Preliminary Study of Nutrients Related to the Risk of Relative Energy Deficiency in Sport (RED-S) in Top-Performing Female Amateur Triathletes: Results from a Nutritional Assessment. Nutrients, 17(2), 208. https://doi.org/10.3390/nu17020208