
Associations Between Serum Gut-Derived Tryptophan Metabolites and Cardiovascular Health Markers in Adolescents with Obesity

 ,
, 

 , and
, and
Abstract
1. Introduction
2. Materials and Methods
2.1. Subjects
2.2. Anthropometry and Body Composition
2.3. Markers of Cardiometabolic, Vascular, and Platelet Health
2.3.1. Blood Pressure
2.3.2. Cardiorespiratory Fitness
2.3.3. Blood Analytes
2.3.4. Two-Hour Oral Glucose Tolerance Test
2.3.5. Platelet Mitochondria Respiration by High-Resolution Respirometry
2.3.6. Intrahepatic Triglyceride Content
2.3.7. Flow Mediated Dilation
2.4. Indole Metabolites Analysis
2.4.1. Materials and Reagents
2.4.2. Quantification of Tryptophan Metabolites
2.5. Dietary Intake and Medical History Questionnaire
2.6. Statistical Analysis
3. Results
3.1. Subject Characteristics
3.2. Correlation of Dietary Intake, Physical Activity, and Use of Medications and Supplements with Serum Concentrations of Gut-Derived Tryptophan Metabolites
3.3. Metabolic Profile of Adolescents
3.4. Correlation Between Subject Characteristics and Serum Levels of Gut-Derived Trp Metabolites (Table 2)

| Variable | IAAld | IA | IAld | ILA | IAA | IPA | IS | Indole |
|---|---|---|---|---|---|---|---|---|
| rho | rho | rho | rho | rho | rho | rho | rho | |
| Age | −0.50 ** | −0.19 | 0.07 | −0.12 | −0.26 | −0.09 | 0.04 | 0.04 |
| Male sex | 0.21 | 0.43 * | 0.28 | 0.64 *** | 0.14 | 0.18 | 0.38 | 0.11 |
| Non-Hispanic ethnicity | −0.15 | −0.10 | −0.35 | 0.03 | −0.41 * | −0.19 | −0.34 | −0.46 ** |
| FMIZ | −0.09 | −0.25 | −0.15 | −0.16 | −0.25 | −0.30 | −0.31 | −0.40 * |
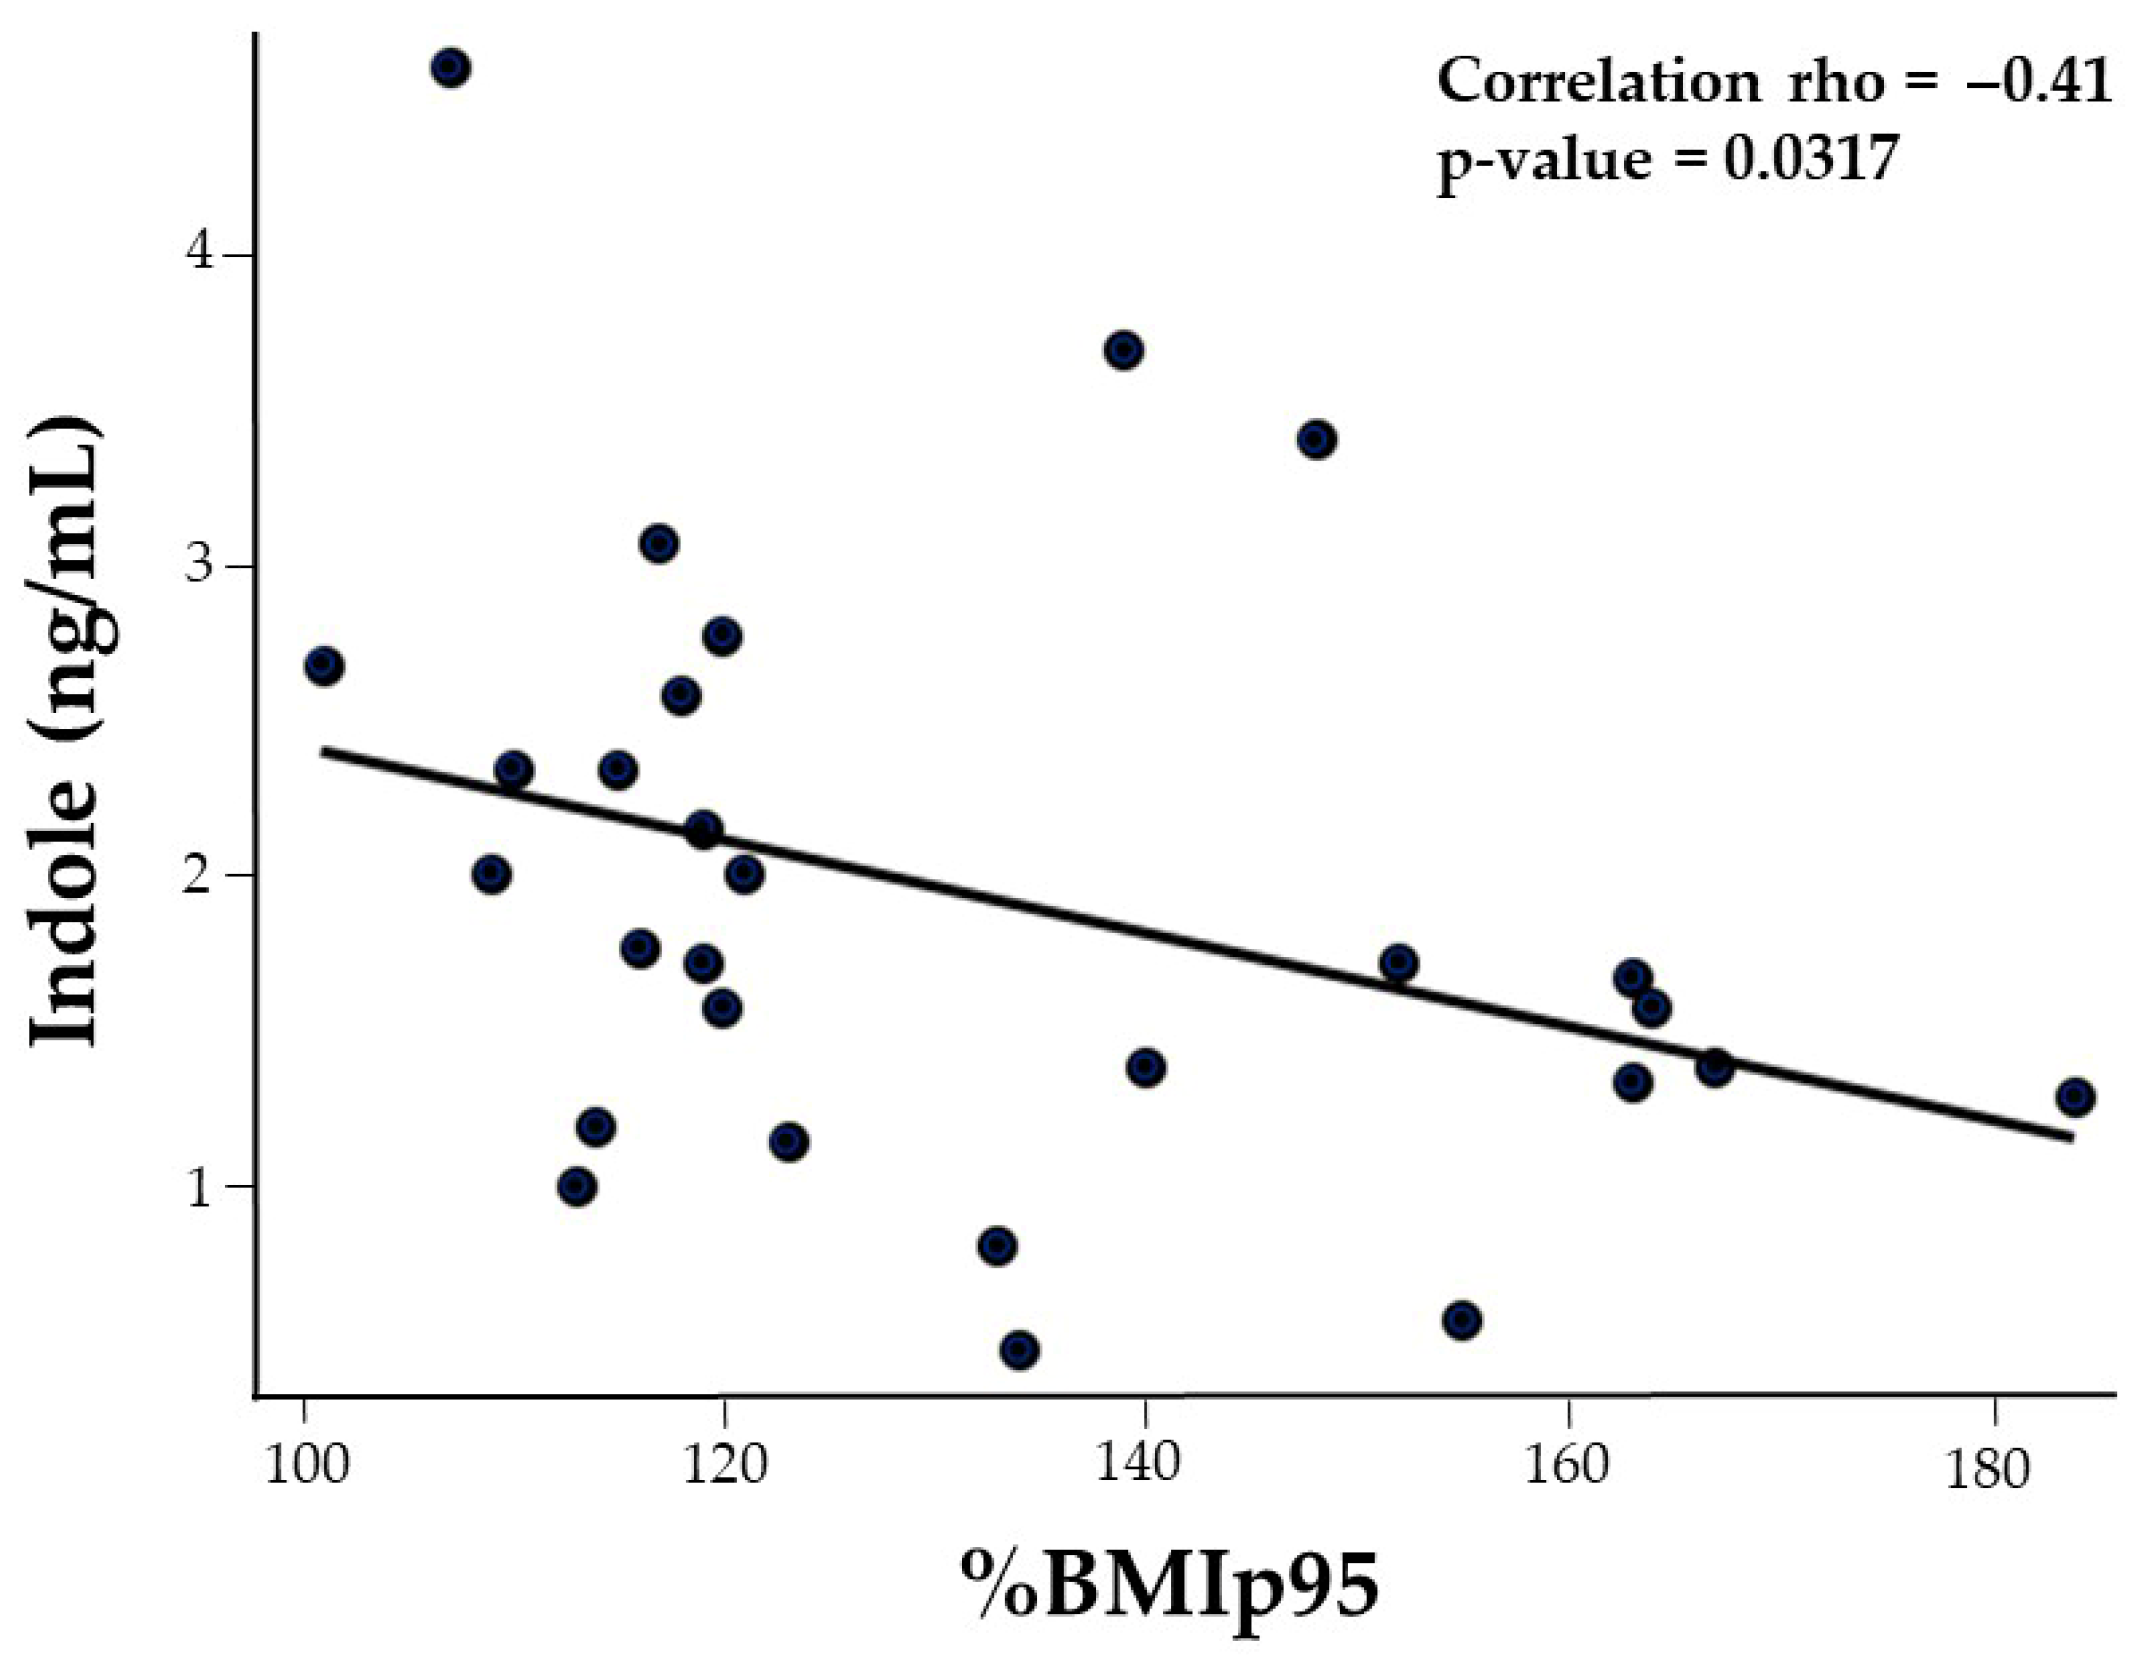
| BMIp95 | 0.17 | −0.10 | −0.13 | −0.29 | −0.22 | −0.43 * | −0.14 | −0.41 * |
| SBP | 0.24 | 0.04 | 0.03 | 0.18 | −0.10 | −0.17 | 0.05 | 0.12 |
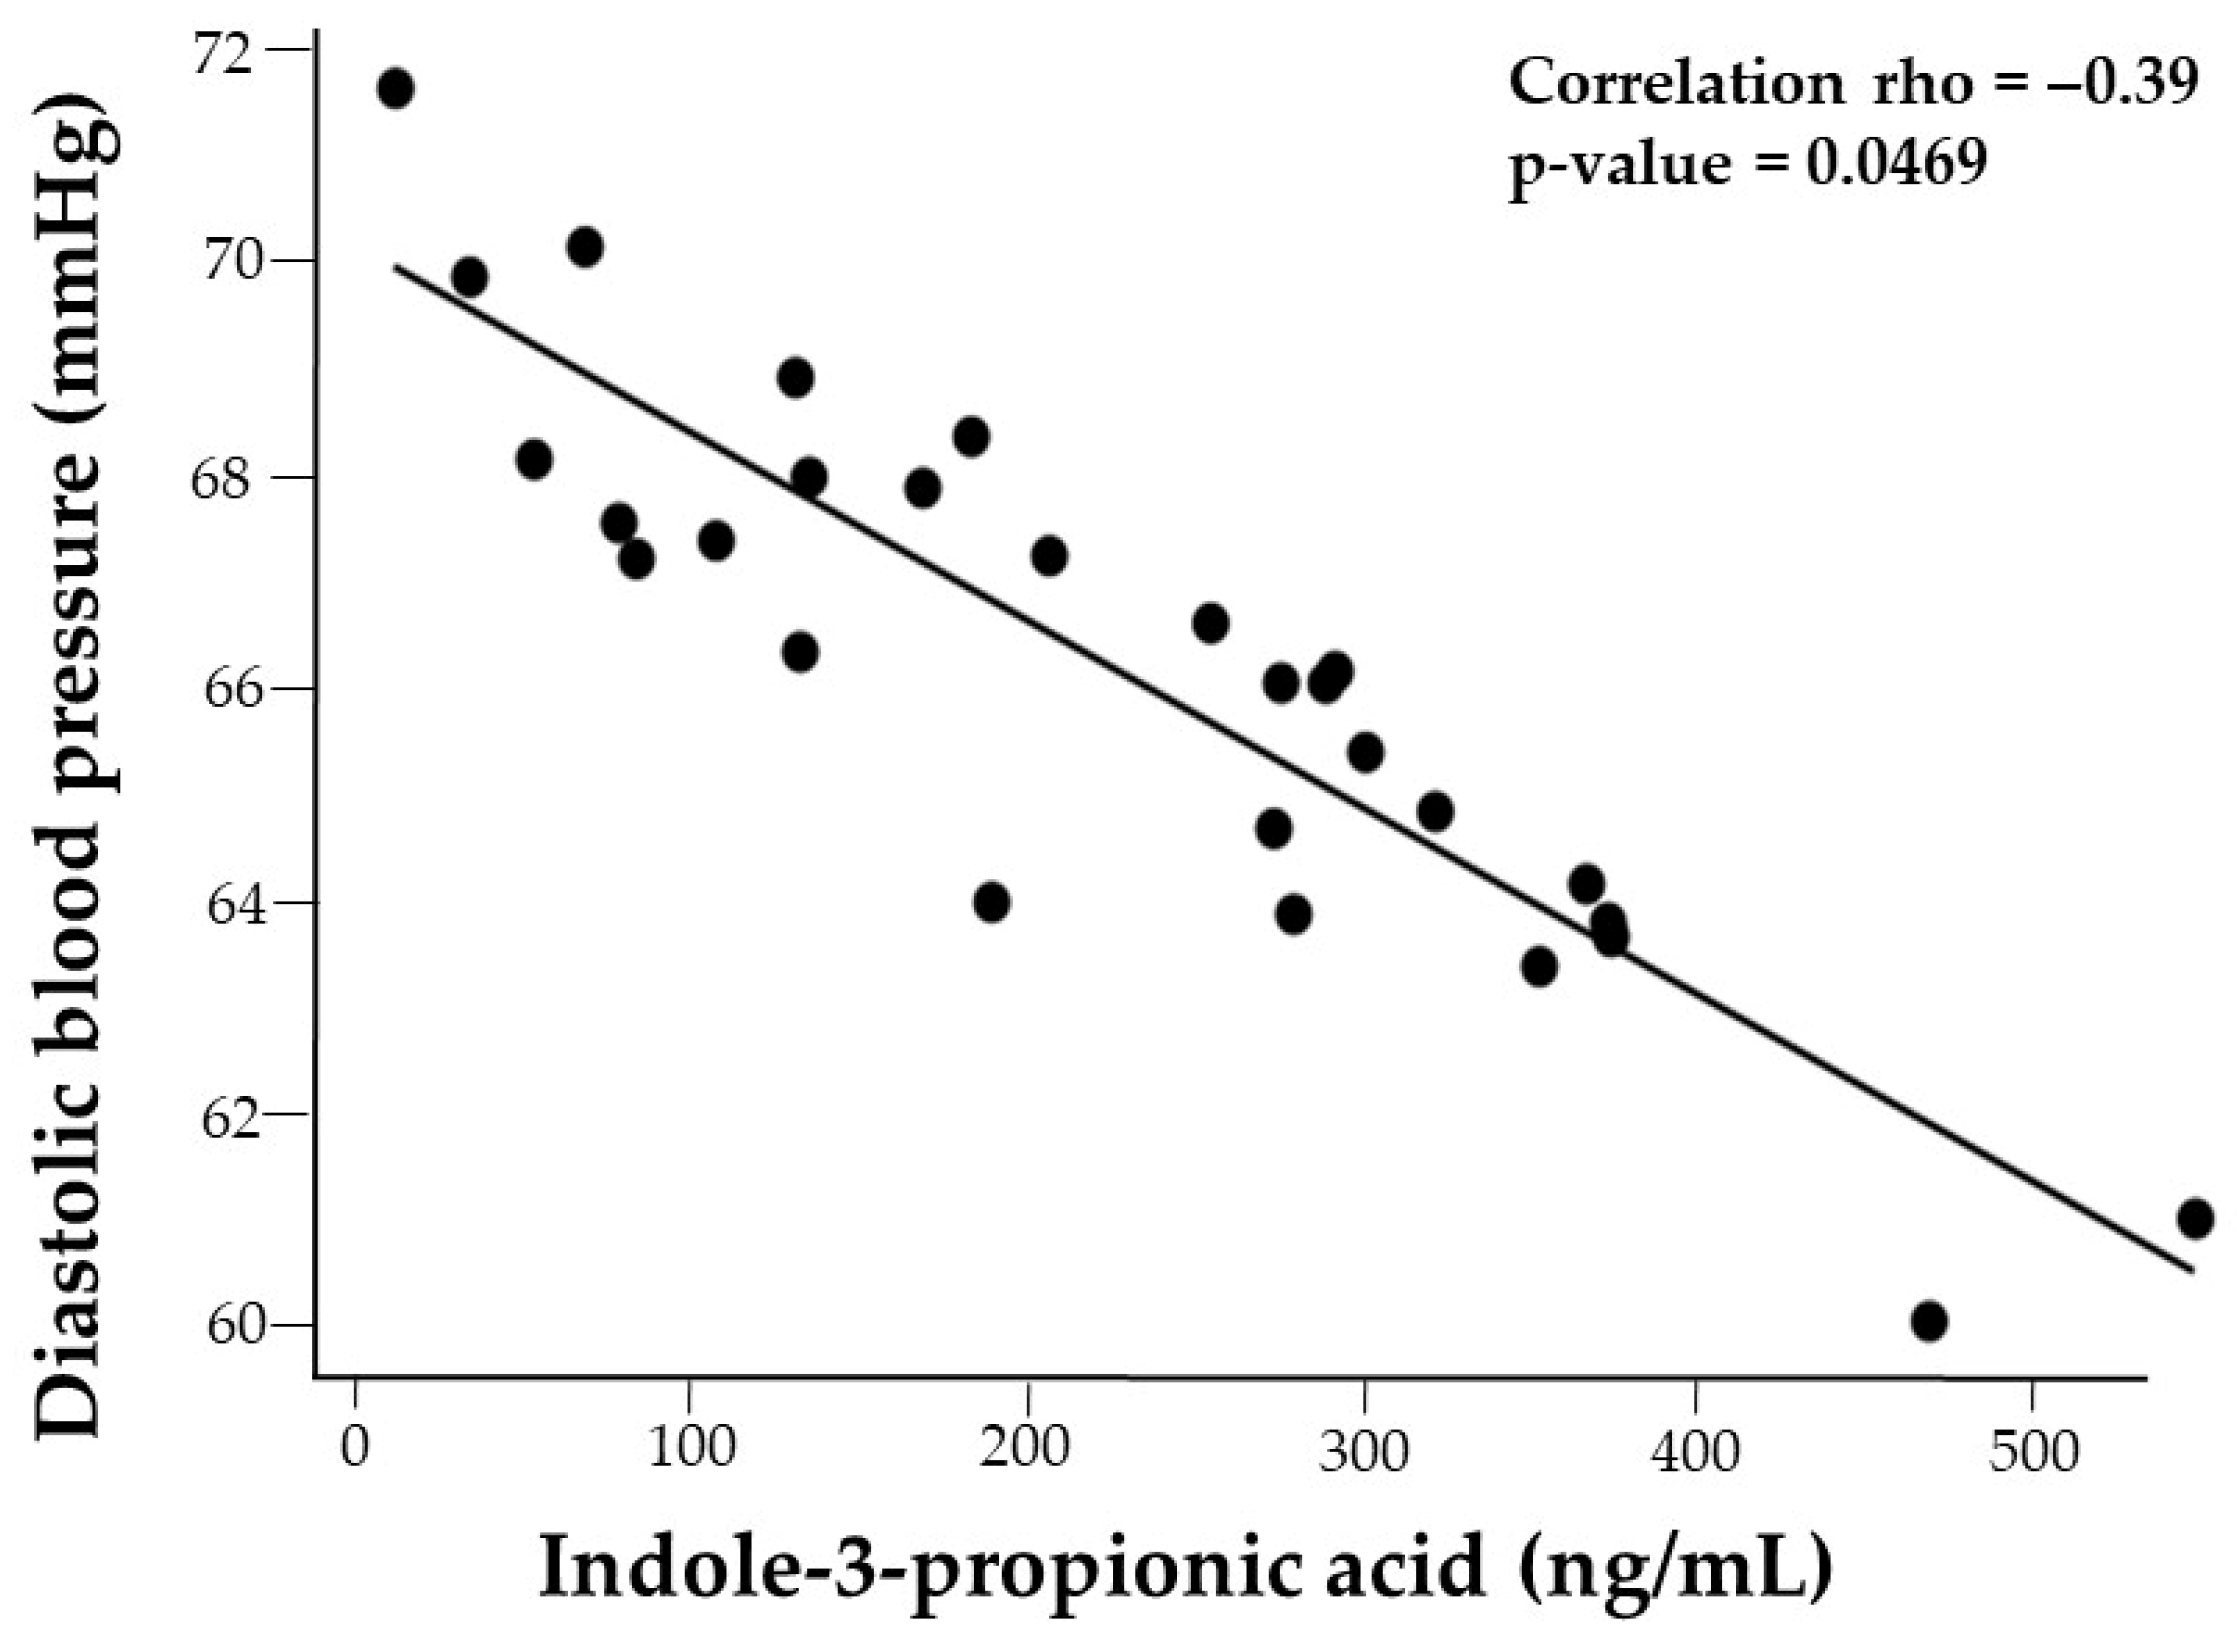
| DBP | 0.17 | −0.27 | −0.15 | −0.25 | 0.09 | −0.36 | −0.15 | −0.02 |
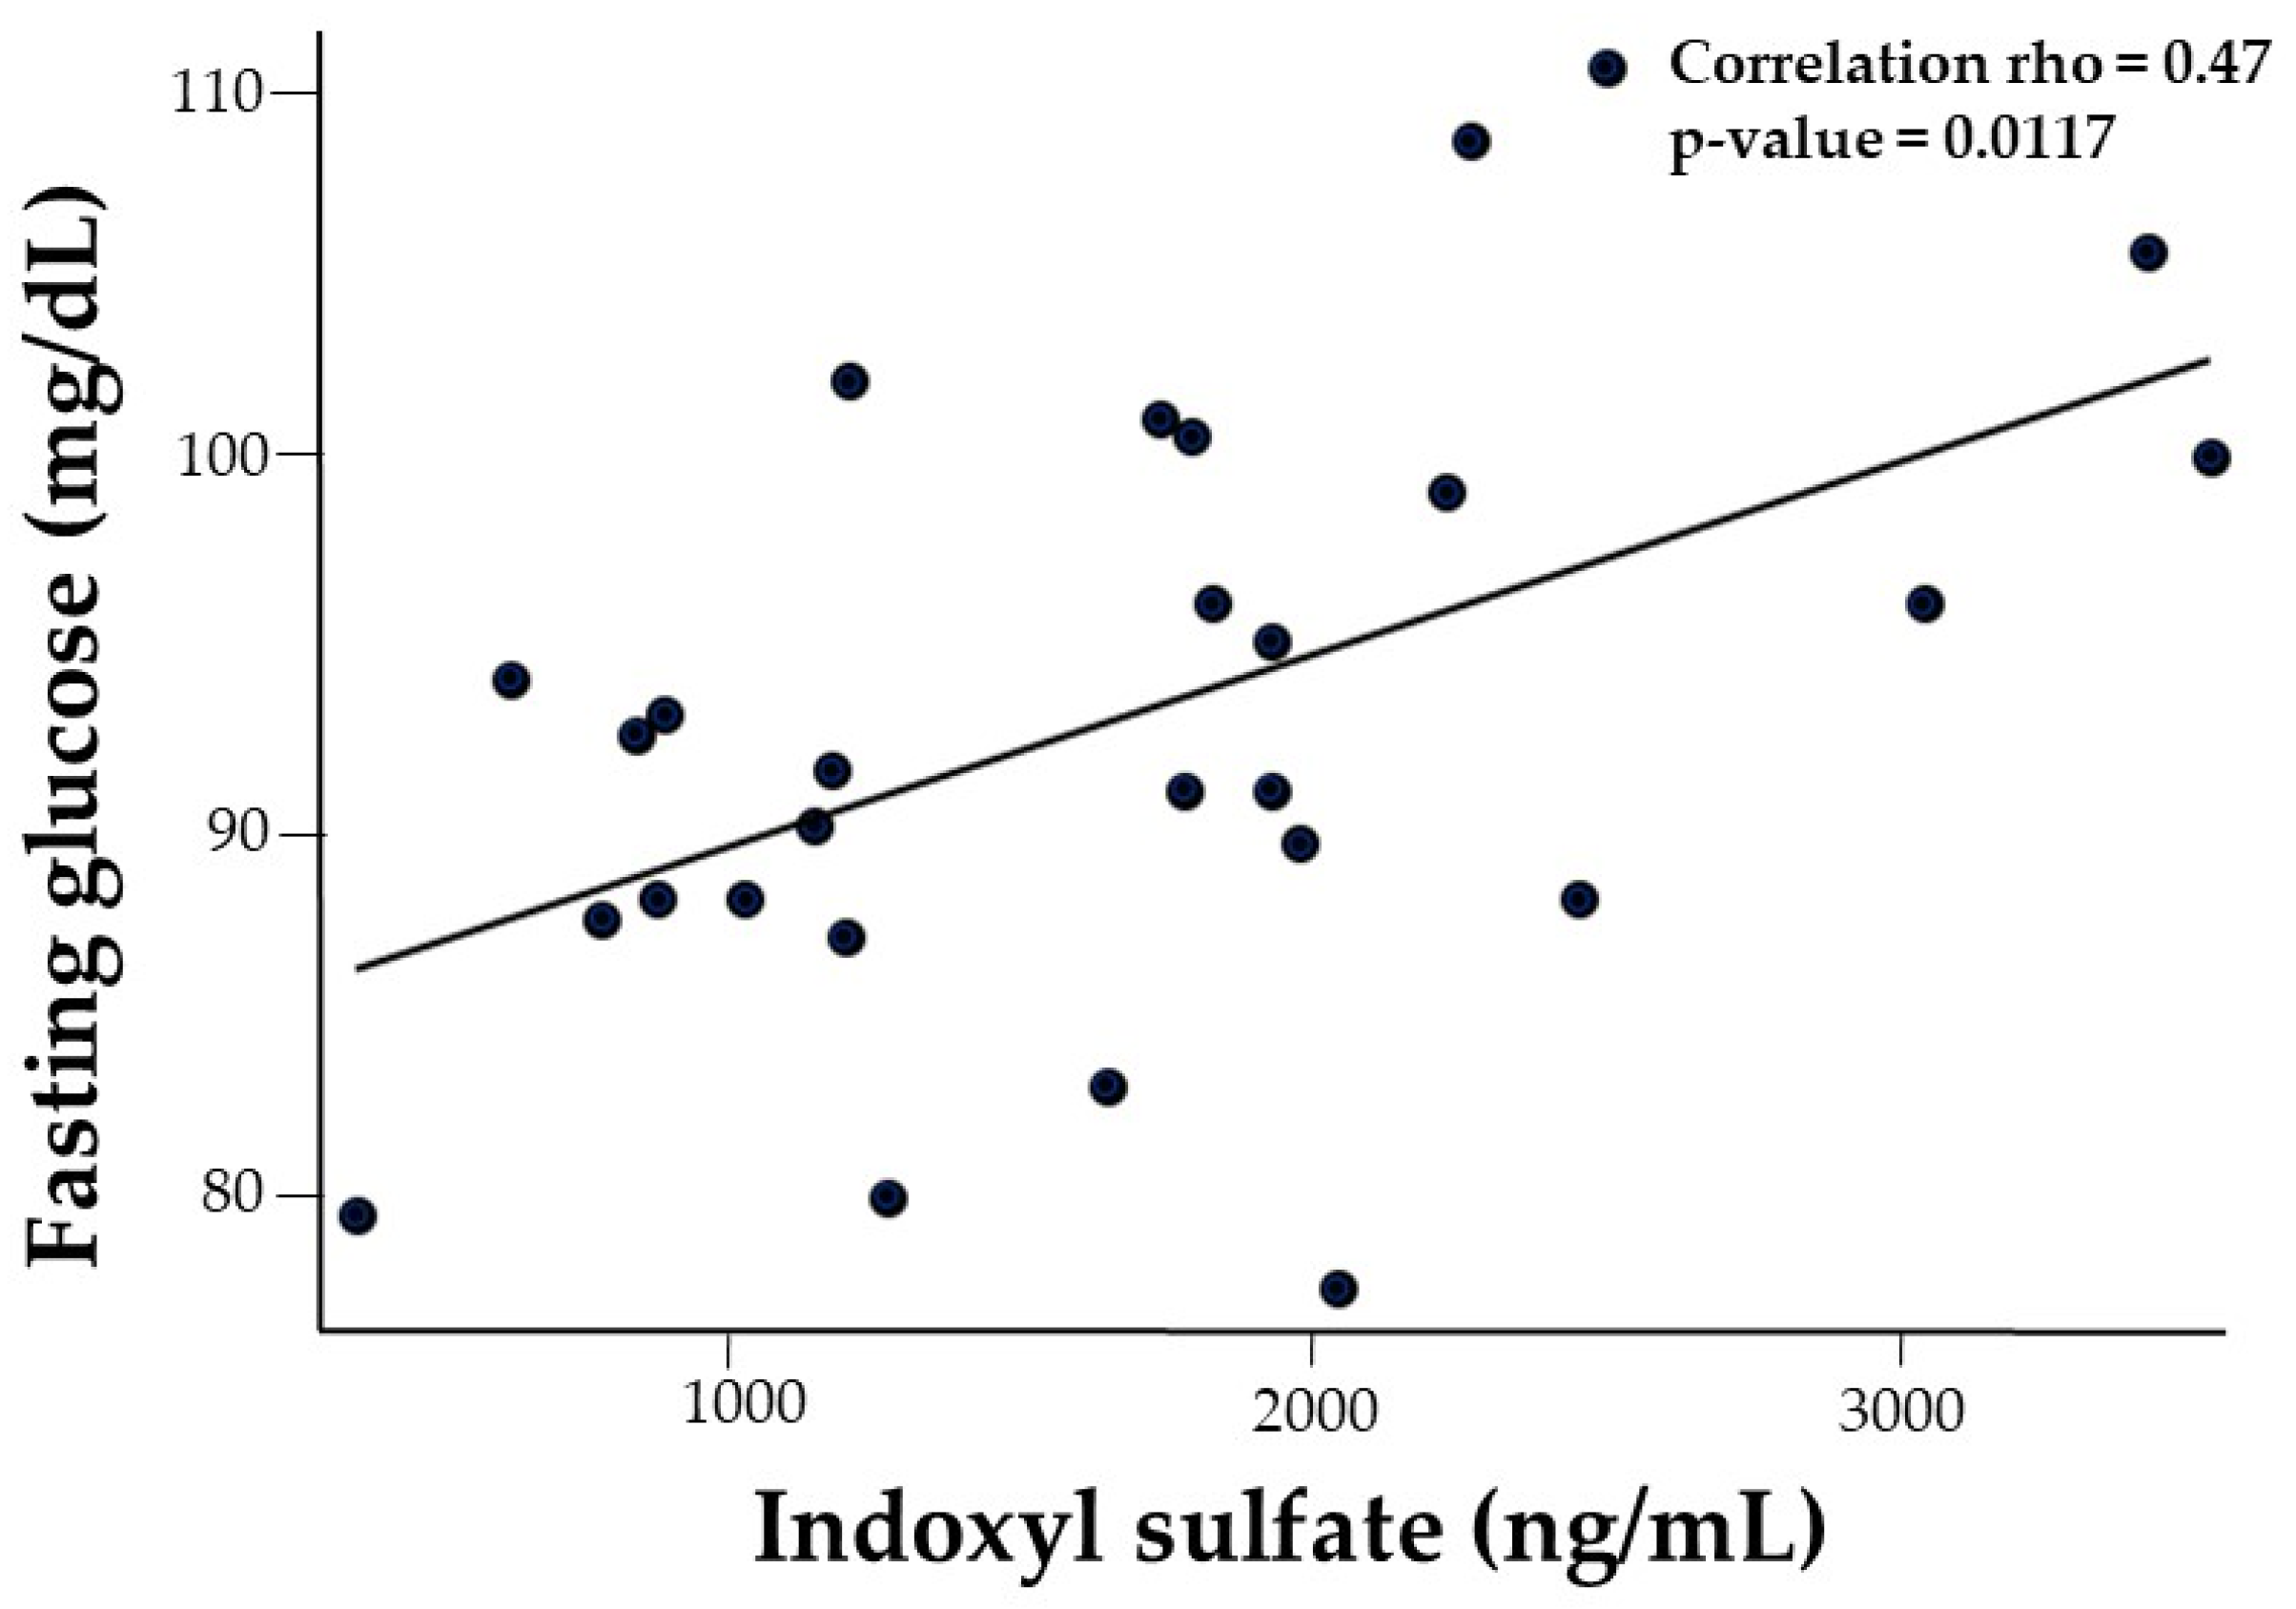
| Fasting glucose | 0.14 | 0.30 | 0.04 | 0.02 | −0.11 | −0.02 | 0.47 ** | −0.24 |
| 2 h glucose | 0.45 * | 0.03 | 0.13 | 0.07 | −0.08 | −0.17 | 0.19 | −0.28 |
| HOMA-IR | −0.05 | −0.24 | 0.30 | −0.10 | −0.02 | −0.16 | 0.33 | −0.12 |
| VO2 peak | 0.18 | 0.25 | 0.36 * | 0.24 | 0.64 *** | 0.29 | −0.01 | 0.34 |
| IHTG | 0.13 | 0.07 | 0.38 * | 0.04 | 0.43 * | 0.02 | 0.23 | 0.26 |
| TC | −0.30 | −0.35 | −0.64 *** | −0.46 * | −0.57 ** | −0.36 * | −0.20 | −0.34 |
| TG | 0.06 | −0.22 | 0.18 | −0.04 | 0.00 | −0.03 | 0.03 | 0.03 |
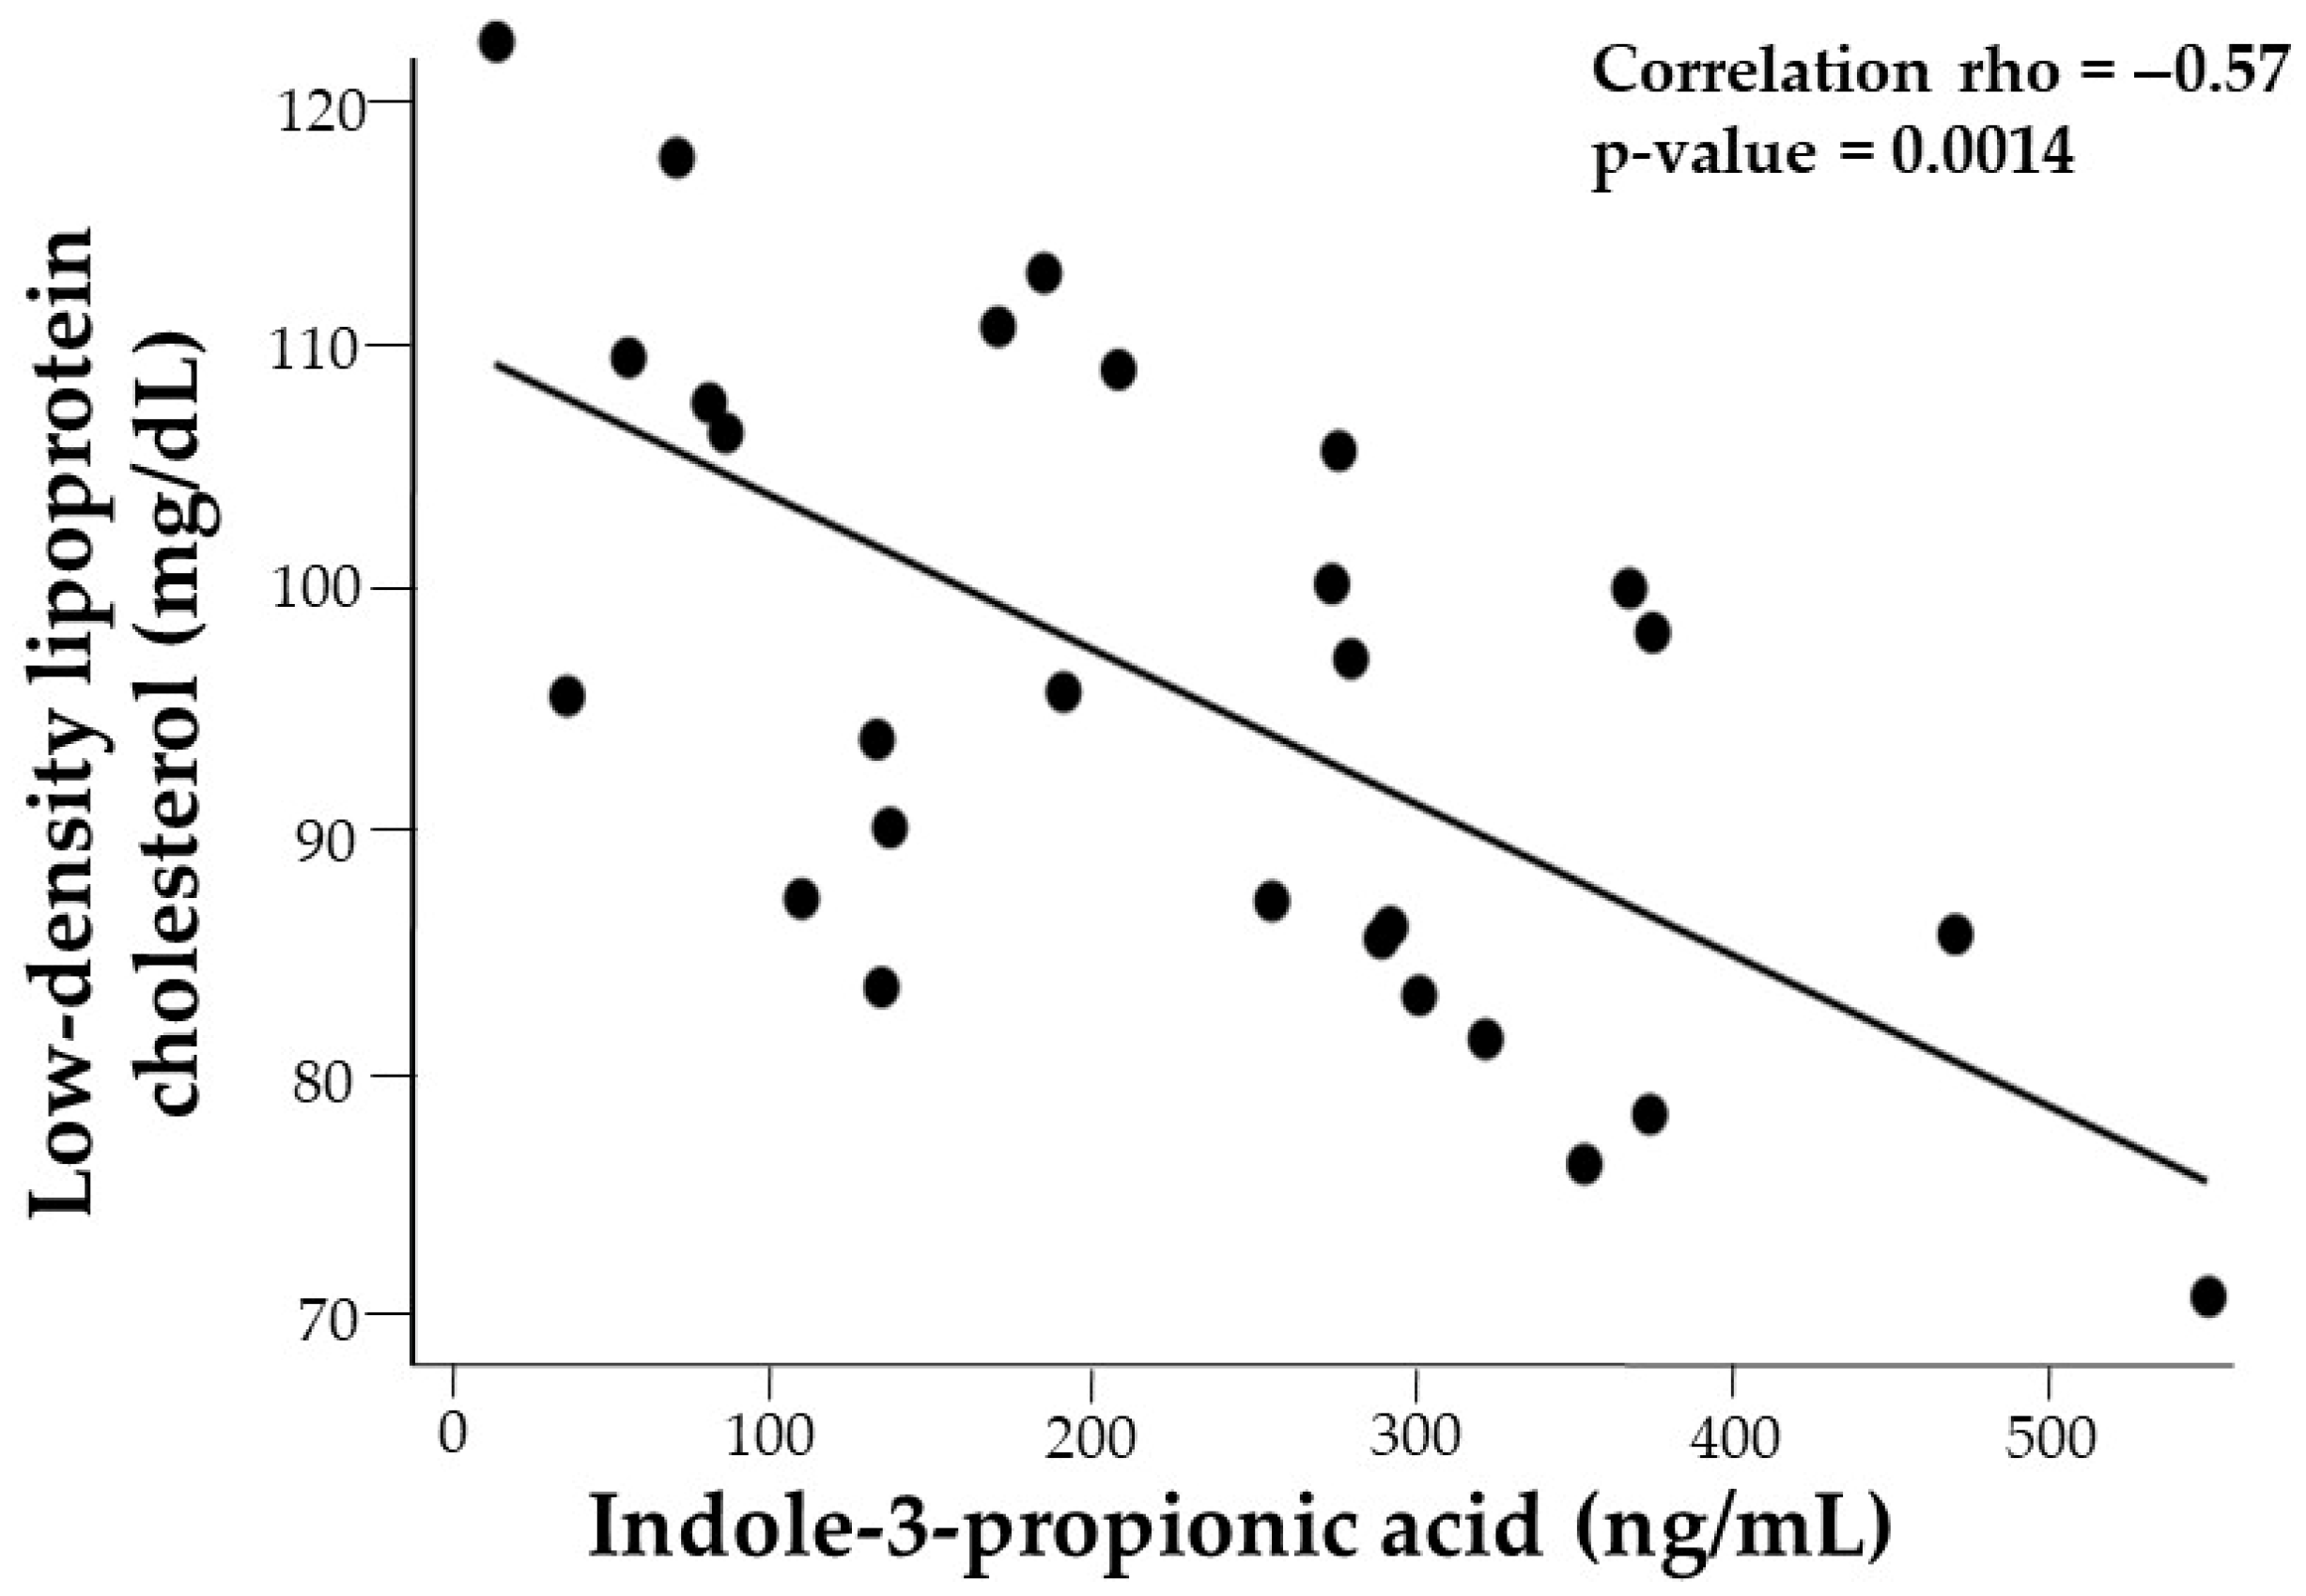
| LDL-C | −0.29 | −0.33 | −0.62 *** | −0.58 ** | −0.53 ** | −0.39 * | −0.30 | −0.28 |
| Leptin | −0.14 | −0.31 | −0.18 | −0.44 * | −0.22 | −0.28 | −0.36 | −0.24 |
| Adiponectin | 0.06 | −0.07 | 0.13 | 0.13 | 0.08 | 0.08 | −0.06 | 0.30 |
| Platelet SRC | 0.14 | 0.32 | 0.28 | 0.46 * | 0.20 | 0.10 | 0.53 ** | −0.03 |
| FMD | 0.23 | 0.29 | −0.38 * | 0.17 | −0.10 | −0.05 | −0.11 | −0.34 |
| Tryptophan Metabolites (ng/mL) | n = 28 Total | n = 15 Boys | n = 13 Girls | p Value |
|---|---|---|---|---|
| IAAld | 6.3 ± 5.9 | 7.9 ± 7.4 | 4.9 ± 4.1 | 0.2788 |
| IAA | 493.3 ± 347.4 | 475.0 ± 195.0 | 509.2 ± 446.8 | 0.4752 |
| IA | 11.7 ± 6.9 | 14.6 ± 8.5 | 9.1 ± 4.1 | 0.0270 |
| IAld | 2.1 ± 0.8 | 2.4 ± 1.0 | 1.8 ± 0.5 | 0.1464 |
| ILA | 187.0 ± 48.1 | 218.4 ± 39.2 | 159.79 ± 37.83 | 0.0008 |
| IPA | 227.2 ± 136.1 | 251.9 ± 139.6 | 205.70 ± 134.04 | 0.3450 |
| IS | 1713.2 ± 805.1 | 2053.3 ± 876.5 | 1418.36 ± 625.33 | 0.0503 |
| Indole | 1.9 ± 1.0 | 2.1 ± 1.2 | 1.81 ± 0.63 | 0.5961 |
3.5. Correlation of Cardiometabolic, Vascular, and Platelet Health Markers with Gut-Derived Trp Metabolites (Table 2)
3.5.1. Diastolic Blood Pressure
3.5.2. Fasting Serum Glucose and Oral Glucose Tolerance Test
3.5.3. Fasting Serum Lipids
3.5.4. Adipocytokines
3.5.5. Platelet Function: Spare Respiratory Capacity (SRC)
3.5.6. Cardiorespiratory Capacity (VO2 peak)
3.5.7. Flow-Mediated Dilation
4. Discussion
5. Conclusions
Author Contributions
Funding
Institutional Review Board Statement
Informed Consent Statement
Data Availability Statement
Acknowledgments
Conflicts of Interest
References
- WHO. Cardiovascular Diseases (CVDs). Available online: https://www.who.int/news-room/fact-sheets/detail/cardiovascular-diseases-(cvds) (accessed on 15 January 2025).
- Hong, Y.M. Atherosclerotic cardiovascular disease beginning in childhood. Korean Circ. J. 2010, 40, 1–9. [Google Scholar] [CrossRef]
- Centers for Disease Control and Prevention. Helping Young Children Thrive, Healty Practices in the Early Care and Education (EC) Setting: CDC. 2022. Available online: https://www.cdc.gov/early-care-education/about/helping-young-children-thrive.html#:~:text=CDC%20works%20in%20partnership%20with,comprehensive%20Farm%20to%20ECE%20initiatives (accessed on 2 February 2025).
- Hadi, H.A.; Carr, C.S.; Al Suwaidi, J. Endothelial dysfunction: Cardiovascular risk factors, therapy, and outcome. Vasc. Health Risk Manag. 2005, 1, 183–198. [Google Scholar]
- Tziomalos, K.; Athyros, V.G.; Karagiannis, A.; Mikhailidis, D.P. Endothelial dysfunction in metabolic syndrome: Prevalence, pathogenesis and management. Nutr. Metab. Cardiovasc. Dis. 2010, 20, 140–146. [Google Scholar] [CrossRef]
- Liu, B.N.; Liu, X.T.; Liang, Z.H.; Wang, J.H. Gut microbiota in obesity. World J. Gastroenterol. 2021, 27, 3837–3850. [Google Scholar] [CrossRef] [PubMed]
- Janssen, A.W.; Kersten, S. The role of the gut microbiota in metabolic health. FASEB J. 2015, 29, 3111–3123. [Google Scholar] [CrossRef] [PubMed]
- Lischka, J.; Schanzer, A.; Baumgartner, M.; de Gier, C.; Greber-Platzer, S.; Zeyda, M. Tryptophan Metabolism Is Associated with BMI and Adipose Tissue Mass and Linked to Metabolic Disease in Pediatric Obesity. Nutrients 2022, 14, 286. [Google Scholar] [CrossRef] [PubMed]
- Melhem, N.J.; Taleb, S. Tryptophan: From Diet to Cardiovascular Diseases. Int. J. Mol. Sci. 2021, 22, 9904. [Google Scholar] [CrossRef]
- Gao, K.; Mu, C.L.; Farzi, A.; Zhu, W.Y. Tryptophan Metabolism: A Link Between the Gut Microbiota and Brain. Adv. Nutr. 2020, 11, 709–723. [Google Scholar] [CrossRef]
- Hu, H.J.; Park, S.G.; Jang, H.B.; Choi, M.K.; Park, K.H.; Kang, J.H.; Park, S.I.; Lee, H.-J.; Cho, S.-H. Obesity Alters the Microbial Community Profile in Korean Adolescents. PLoS ONE 2015, 10, e0134333. [Google Scholar] [CrossRef]
- Paeslack, N.; Mimmler, M.; Becker, S.; Gao, Z.; Khuu, M.P.; Mann, A.; Malinarich, F.; Regen, T.; Reinhardt, C. Microbiota-derived tryptophan metabolites in vascular inflammation and cardiovascular disease. Amino Acids 2022, 54, 1339–1356. [Google Scholar] [CrossRef]
- Min, B.H.; Devi, S.; Kwon, G.H.; Gupta, H.; Jeong, J.J.; Sharma, S.P.; Won, S.M.; Oh, K.K.; Yoon, S.J.; Park, H.J.; et al. Gut microbiota-derived indole compounds attenuate metabolic dysfunction-associated steatotic liver disease by improving fat metabolism and inflammation. Gut Microbes 2024, 16, 2307568. [Google Scholar] [CrossRef]
- Abildgaard, A.; Elfving, B.; Hokland, M.; Wegener, G.; Lund, S. The microbial metabolite indole-3-propionic acid improves glucose metabolism in rats, but does not affect behaviour. Arch. Physiol. Biochem. 2018, 124, 306–312. [Google Scholar] [CrossRef] [PubMed]
- Wang, Y.C.; Koay, Y.C.; Pan, C.; Zhou, Z.; Tang, W.; Wilcox, J.; Li, X.S.; Zagouras, A.; Marques, F.; Allayee, H.; et al. Indole-3-Propionic Acid Protects Against Heart Failure With Preserved Ejection Fraction. Circ. Res. 2024, 134, 371–389. [Google Scholar] [CrossRef] [PubMed]
- Sehgal, R.; Ilha, M.; Vaittinen, M.; Kaminska, D.; Männistö, V.; Kärjä, V.; Tuomainen, M.; Hanhineva, K.; Romeo, S.; Pajukanta, P.; et al. Indole-3-Propionic Acid, a Gut-Derived Tryptophan Metabolite, Associates with Hepatic Fibrosis. Nutrients 2021, 13, 3509. [Google Scholar] [CrossRef]
- Tobisch, B.; Blatniczky, L.; Barkai, L. Cardiometabolic risk factors and insulin resistance in obese children and adolescents: Relation to puberty. Pediatr. Obes. 2015, 10, 37–44. [Google Scholar] [CrossRef] [PubMed]
- Stierman, B.; Afful, J.; Carroll, M.D.; Chen, T.-C.; Davy, O.; Fink, S.; Fryar, C.D.; Gu, Q.; Hales, C.M.; Hughes, J.P.; et al. National Health and Nutrition Examination Survey 2017–March 2020 Prepandemic Data Files—Development of Files and Prevalence Estimates for Selected Health Outcomes. Natl. Health Stat. Rep. 2021, 158, 4. Available online: https://stacks.cdc.gov/view/cdc/106273 (accessed on 15 April 2025).
- Tas, E.; Landes, R.D.; Diaz, E.C.; Bai, S.; Ou, X.; Buchmann, R.; Na, X.; Muzumdar, R.; Børsheim, E.; Dranoff, J.A. Effects of short-term supervised exercise training on liver fat in adolescents with obesity: A randomized controlled trial. Obesity 2023, 31, 2740–2749. [Google Scholar] [CrossRef]
- CDC. Child and Teen BMI Calculator: U.S. Centers for Disease Control and Prevention. Available online: https://www.cdc.gov/bmi/child-teen-calculator/index.html (accessed on 16 January 2025).
- Hampl, S.E.; Hassink, S.G.; Skinner, A.C.; Armstrong, S.C.; Barlow, S.E.; Bolling, C.F.; Edwards, K.C.A.; Eneli, I.; Hamre, R.; Joseph, M.M.; et al. Executive Summary: Clinical Practice Guideline for the Evaluation and Treatment of Children and Adolescents with Obesity. Pediatrics 2023, 151, e2022060641. [Google Scholar] [CrossRef]
- Weber, D.R.; Moore, R.H.; Leonard, M.B.; Zemel, B.S. Fat and lean BMI reference curves in children and adolescents and their utility in identifying excess adiposity compared with BMI and percentage body fat. Am. J. Clin. Nutr. 2013, 98, 49–56. [Google Scholar] [CrossRef]
- Flynn, J.T.; Kaelber, D.C.; Baker-Smith, C.M.; Blowey, D.; Carroll, A.E.; Daniels, S.R.; de Ferranti, S.D.; Dionne, J.M.; Falkner, B.; Flinn, S.K.; et al. Clinical Practice Guideline for Screening and Management of High Blood Pressure in Children and Adolescents. Pediatrics 2017, 140, e20171904. [Google Scholar] [CrossRef]
- Howard, T.; Grosel, J. Updated guidelines for lipid screening in children and adolescents. JAAPA 2015, 28, 30–36. [Google Scholar] [CrossRef]
- Walkowiak, B.; Kesy, A.; Michalec, L. Microplate reader—A convenient tool in studies of blood coagulation. Thromb Res. 1997, 87, 95–103. [Google Scholar] [CrossRef] [PubMed]
- Robertson, R.J.; Goss, F.L.; Boer, N.F.; Peoples, J.A.; Foreman, A.J.; Dabayebeh, I.M.; Millich, N.B.; Balasekaran, G.; Riechman, S.E.; Gallagher, J.D.; et al. Children’s OMNI scale of perceived exertion: Mixed gender and race validation. Med. Sci. Sports Exerc. 2000, 32, 452–458. [Google Scholar] [CrossRef] [PubMed]
- Vos, M.B.; Abrams, S.H.; Barlow, S.E.; Caprio, S.; Daniels, S.R.; Kohli, R.; Mouzaki, M.; Sathya, P.; Schwimmer, J.B.; Sundaram, S.S.; et al. NASPGHAN Clinical Practice Guideline for the Diagnosis and Treatment of Nonalcoholic Fatty Liver Disease in Children: Recommendations from the Expert Committee on NAFLD (ECON) and the North American Society of Pediatric Gastroenterology, Hepatology and Nutrition (NASPGHAN). J. Pediatr. Gastroenterol. Nutr. 2017, 64, 319–334. [Google Scholar] [PubMed]
- Wu, C.S.; Muthyala, S.D.V.; Klemashevich, C.; Ufondu, A.U.; Menon, R.; Chen, Z.; Devaraj, S.; Jayaraman, A.; Sun, Y. Age-dependent remodeling of gut microbiome and host serum metabolome in mice. Aging 2021, 13, 6330–6345. [Google Scholar] [CrossRef]
- McGee, J.S.; Huttenhower, C. Of mice and men and women: Sexual dimorphism of the gut microbiome. Int. J. Womens Dermatol. 2021, 7, 533–538. [Google Scholar] [CrossRef]
- Couch, C.A.; Ament, Z.; Patki, A.; Kijpaisalratana, N.; Bhave, V.; Jones, A.C.; Armstrong, N.D.; Cushman, M.; Kimberly, W.T.; Irvin, M.R. Sex-Associated Metabolites and Incident Stroke, Incident Coronary Heart Disease, Hypertension, and Chronic Kidney Disease in the REGARDS Cohort. J. Am. Heart Assoc. 2024, 13, e032643. [Google Scholar] [CrossRef]
- Chen, Y.Y.; Chen, G.C.; Abittan, N.; Xing, J.; Mossavar-Rahmani, Y.; Sotres-Alvarez, D.; Mattei, J.; Daviglus, M.; Isasi, C.R.; Hu, F.B.; et al. Healthy dietary patterns and risk of cardiovascular disease in US Hispanics/Latinos: The Hispanic Community Health Study/Study of Latinos (HCHS/SOL). Am. J. Clin. Nutr. 2022, 116, 920–927. [Google Scholar] [CrossRef]
- Borrello, K.; Lim, U.; Park, S.Y.; Monroe, K.R.; Maskarinec, G.; Boushey, C.J.; Wilkens, L.R.; Randolph, T.W.; Le Marchand, L.; Hullar, M.A.; et al. Dietary Intake Mediates Ethnic Differences in Gut Microbial Composition. Nutrients 2022, 14, 660. [Google Scholar] [CrossRef]
- Menni, C.; Hernandez, M.M.; Vital, M.; Mohney, R.P.; Spector, T.D.; Valdes, A.M. Circulating levels of the anti-oxidant indoleproprionic acid are associated with higher gut microbiome diversity. Gut Microbes 2019, 10, 688–695. [Google Scholar] [CrossRef]
- Hu, Y.; Li, J.; Wang, B.; Zhu, L.; Li, Y.; Ivey, K.L.; Lee, K.H.; Eliassen, A.H.; Chan, A.; Huttenhower, C.; et al. Interplay between diet, circulating indolepropionate concentrations and cardiometabolic health in US populations. Gut 2023, 72, 2260–2271. [Google Scholar] [CrossRef] [PubMed]
- Chen, Y.; Lin, R.; Luo, Q.; Liu, T.; Li, X.; Zheng, D.; Su, S.; Huang, J.; Huang, Y.; Chen, M.; et al. ACSM2B rs73530508 polymorphism affects susceptibility to esophageal cancer by regulating indolepropionic acid levels. Cancer Pathog. Ther. 2025, 3, 244–252. [Google Scholar] [CrossRef]
- Wu, W.; Zhang, L.; Xia, B.; Tang, S.; Liu, L.; Xie, J.; Zhang, H. Bioregional Alterations in Gut Microbiome Contribute to the Plasma Metabolomic Changes in Pigs Fed with Inulin. Microorganisms 2020, 8, 111. [Google Scholar] [CrossRef]
- Teunis, C.J.; Stroes, E.S.G.; Boekholdt, S.M.; Wareham, N.J.; Murphy, A.J.; Nieuwdorp, M.; Hazen, S.L.; Hanssen, N.M.J. Tryptophan metabolites and incident cardiovascular disease: The EPIC-Norfolk prospective population study. Atherosclerosis 2023, 387, 117344. [Google Scholar] [CrossRef]
- Cason, C.A.; Dolan, K.T.; Sharma, G.; Tao, M.; Kulkarni, R.; Helenowski, I.B.; Doane, B.M.; Avram, M.J.; McDermott, M.M.; Chang, E.B.; et al. Plasma microbiome-modulated indole- and phenyl-derived metabolites associate with advanced atherosclerosis and postoperative outcomes. J. Vasc. Surg. 2018, 68, 1552–1562.e7. [Google Scholar] [CrossRef]
- Xue, H.; Chen, X.; Yu, C.; Deng, Y.; Zhang, Y.; Chen, S.; Chen, X.; Chen, K.; Yang, Y.; Ling, W. Gut Microbially Produced Indole-3-Propionic Acid Inhibits Atherosclerosis by Promoting Reverse Cholesterol Transport and Its Deficiency Is Causally Related to Atherosclerotic Cardiovascular Disease. Circ. Res. 2022, 131, 404–420. [Google Scholar] [CrossRef]
- Opdebeeck, B.; Maudsley, S.; Azmi, A.; De Mare, A.; De Leger, W.; Meijers, B.; Verhulst, A.; Evenepoel, P.; D’Haese, P.C.; Neven, E. Indoxyl Sulfate and p-Cresyl Sulfate Promote Vascular Calcification and Associate with Glucose Intolerance. J. Am. Soc. Nephrol. 2019, 30, 751–766. [Google Scholar] [CrossRef] [PubMed]
| Variables | n = 28 | Boys n = 13 | Girls n = 15 | p Value |
|---|---|---|---|---|
| Age, (years) | 15.5 ± 1.4 | 15.7 ± 1.5 | 15.4 ± 1.4 | 0.6954 |
| BMI, (kg/m2) | 36 ± 6.4 | 34.2 ± 5.8 | 38.8 ± 6.4 | 0.0503 |
| BMI Category, n (%) | 0.0459 | |||
| Class I | 12 (43) | 8 (62) | 4 (27) | 0.0678 |
| Class II | 7 (25) | 3 (23) | 4 (27) | 0.0462 |
| Class III | 9 (32) | 2 (15) | 7 (46) | 0.0826 |
| FMIZ | 1.78 ± 0.38 | 1.6 ± 0.38 | 1.9 ± 0.4 | 0.1532 |
| Race—Ethnicity, n (%) | ||||
| HW | 14 (50) | 8 (62) | 6 (40) | |
| NHW | 3 (11) | 3 (23) | 0 (0) | |
| NHB | 11 (39) | 2 (15) | 9 (60) | |
| Liver fat, (%) | 6 ± 4.30 (Range: 1.10–18.56) | 7 ± 3.46 | 5 ± 4.98 | 0.1020 |
| MASLD, n (%) | 13 (46) | 8 (61) | 5 (33) | 0.1617 |
| HW | 10 (71) | 6 (46) | 4 (27) | |
| NHW | 1 (7) | 0 (0) | 0 (0) | |
| NHB | 2 (18) | 2 (15) | 1 (6) | |
| HBP, n (%) | 16 (57) | 7 (54) | 9 (60) | 0.7700 |
| HW | 9 (53) | 5 (38) | 4 (27) | |
| NHW | 1 (6) | 1 (8) | 0 (0) | |
| NHB | 6 (55) | 1(8) | 5 (33) | |
| HBP and NAFLD, n (%) | 8 (29) | 4 (31) | 4 (27) | 0.8139 |
| HW | 7 (41) | 4 (31) | 3 (21) | |
| NHW | 0 (0) | 0 (0) | 0 (0) | |
| NHB | 1 (9) | 0 (0) | 1 (6) | |
| Systolic blood pressure, (mmHg) | 121 ± 7 | 120 ± 6 | 121 ± 8 | 0.8355 |
| Diastolic blood pressure, (mmHg) | 66 ± 7 | 63 ± 8 | 69 ± 7 | 0.0283 |
| Fasting glucose, (mg/dL) | 93 ± 8 | 97 ± 7 | 90 ± 8 | 0.0339 |
| Impaired fasting glucose, n (%) | 7 (25) | 5 (38) | 2 (13) | |
| OGTT, 2 hr serum glucose, (mg/dL) | 121 ± 30 | 116 ± 29 | 112 ± 27 | 0.1970 |
| Impaired glucose tolerance, n (%) | 6 (21) | 6 (21) | 6 (21) | 0.1326 |
| HOMA-IR | 8.95 ± 6.34 | 8.95 ± 6.34 | 8.95 ± 6.34 | 0.8719 |
| Total cholesterol, (mg/dL) | 150 ± 27 | 137 ± 20 | 162 ± 28 | 0.0270 |
| LDL-C, (mg/dL) | 96 ± 21 | 85 ± 14 | 105 ± 21 | 0.0057 |
| Triglycerides, (mg/dL) | 111 ± 47 | 107 ± 34 | 114 ± 57 | 0.9449 |
| VO2 peak (ml∙min−1∙kg−1 LBM) | 40 ± 7.01 | 43 ± 7.8 | 38 ± 5.4 | 0.0503 |
| Physical activity, n (%) | 0.0060 | |||
| No exercise | 13 (46) | 3 (23) | 10 (67) | 0.0235 |
| <3 days/week | 10 (36) | 5 (38) | 5 (33) | 0.7815 |
| ≥3 days/week | 5 (18) | 5 (38) | 0 (0) | 0.0093 |
Disclaimer/Publisher’s Note: The statements, opinions and data contained in all publications are solely those of the individual author(s) and contributor(s) and not of MDPI and/or the editor(s). MDPI and/or the editor(s) disclaim responsibility for any injury to people or property resulting from any ideas, methods, instructions or products referred to in the content. |
© 2025 by the authors. Licensee MDPI, Basel, Switzerland. This article is an open access article distributed under the terms and conditions of the Creative Commons Attribution (CC BY) license (https://creativecommons.org/licenses/by/4.0/).
Share and Cite
Rivera, J.E.; Lan, R.; Ferruzzi, M.G.; Børsheim, E.; Tas, E.; Diaz, E.C. Associations Between Serum Gut-Derived Tryptophan Metabolites and Cardiovascular Health Markers in Adolescents with Obesity. Nutrients 2025, 17, 2430. https://doi.org/10.3390/nu17152430
Rivera JE, Lan R, Ferruzzi MG, Børsheim E, Tas E, Diaz EC. Associations Between Serum Gut-Derived Tryptophan Metabolites and Cardiovascular Health Markers in Adolescents with Obesity. Nutrients. 2025; 17(15):2430. https://doi.org/10.3390/nu17152430
Chicago/Turabian StyleRivera, Jeny E., Renny Lan, Mario G. Ferruzzi, Elisabet Børsheim, Emir Tas, and Eva C. Diaz. 2025. "Associations Between Serum Gut-Derived Tryptophan Metabolites and Cardiovascular Health Markers in Adolescents with Obesity" Nutrients 17, no. 15: 2430. https://doi.org/10.3390/nu17152430
APA StyleRivera, J. E., Lan, R., Ferruzzi, M. G., Børsheim, E., Tas, E., & Diaz, E. C. (2025). Associations Between Serum Gut-Derived Tryptophan Metabolites and Cardiovascular Health Markers in Adolescents with Obesity. Nutrients, 17(15), 2430. https://doi.org/10.3390/nu17152430