
A Low-Sugar Flavored Beverage Improves Fluid Intake in Children During Exercise in the Heat

 ,
,  , ,
, , 
Abstract
1. Introduction
2. Materials and Methods
2.1. Study Design
2.2. Participants
2.3. Intervention
2.4. Outcomes
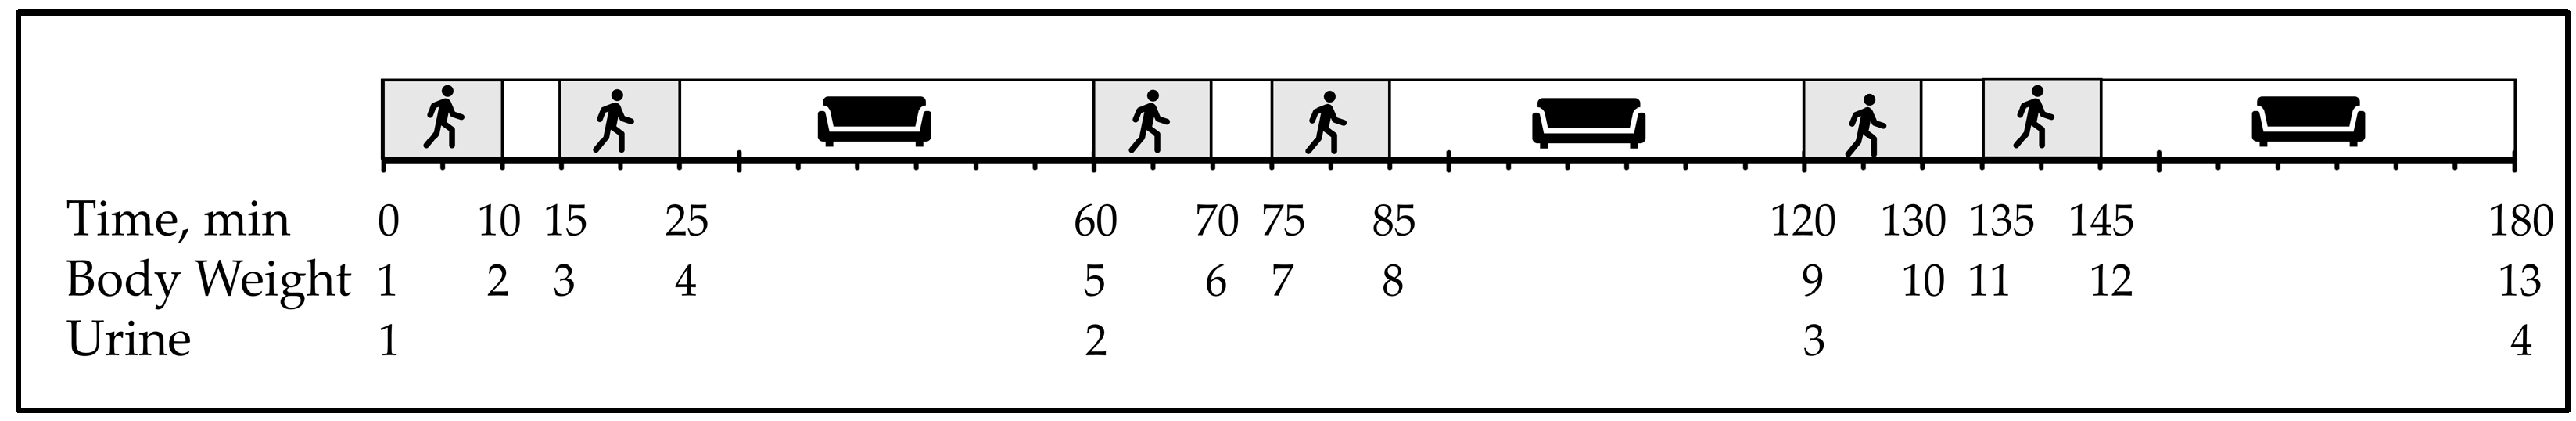
2.5. Study Protocol
2.6. Statistical Analysis
3. Results
3.1. Fluid Intake
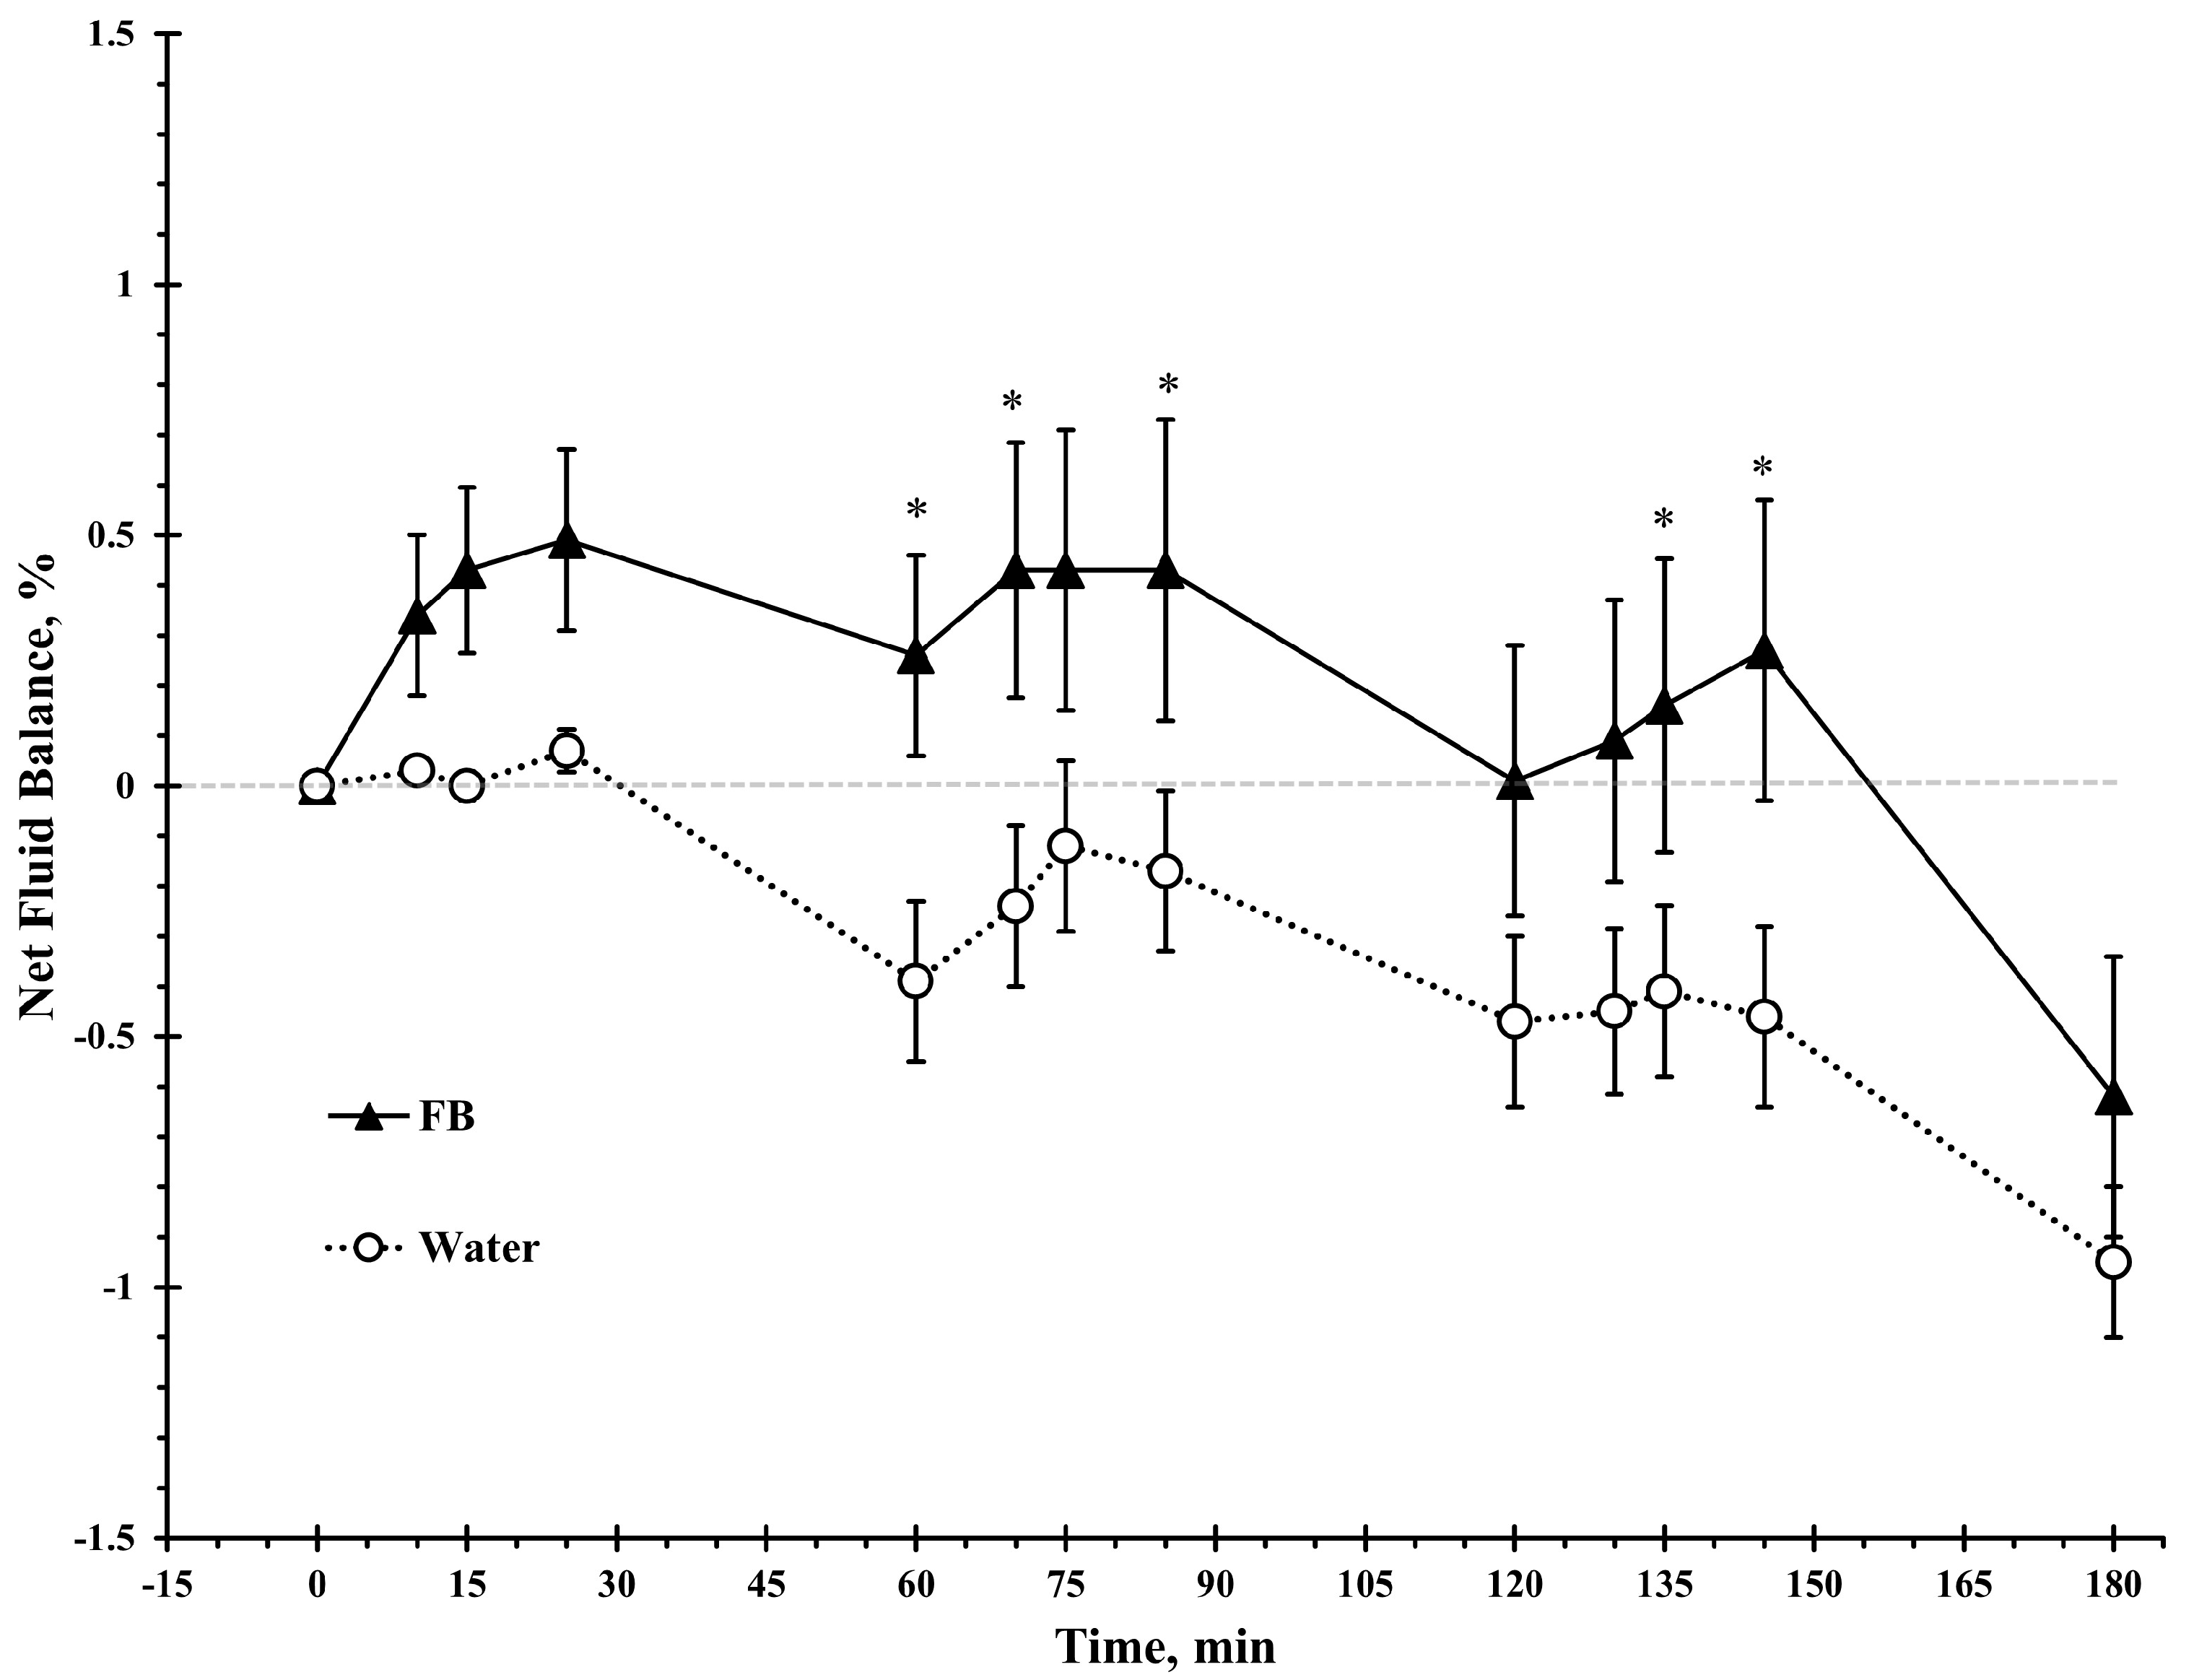
3.2. Net Fluid Balance
3.3. Urine Output
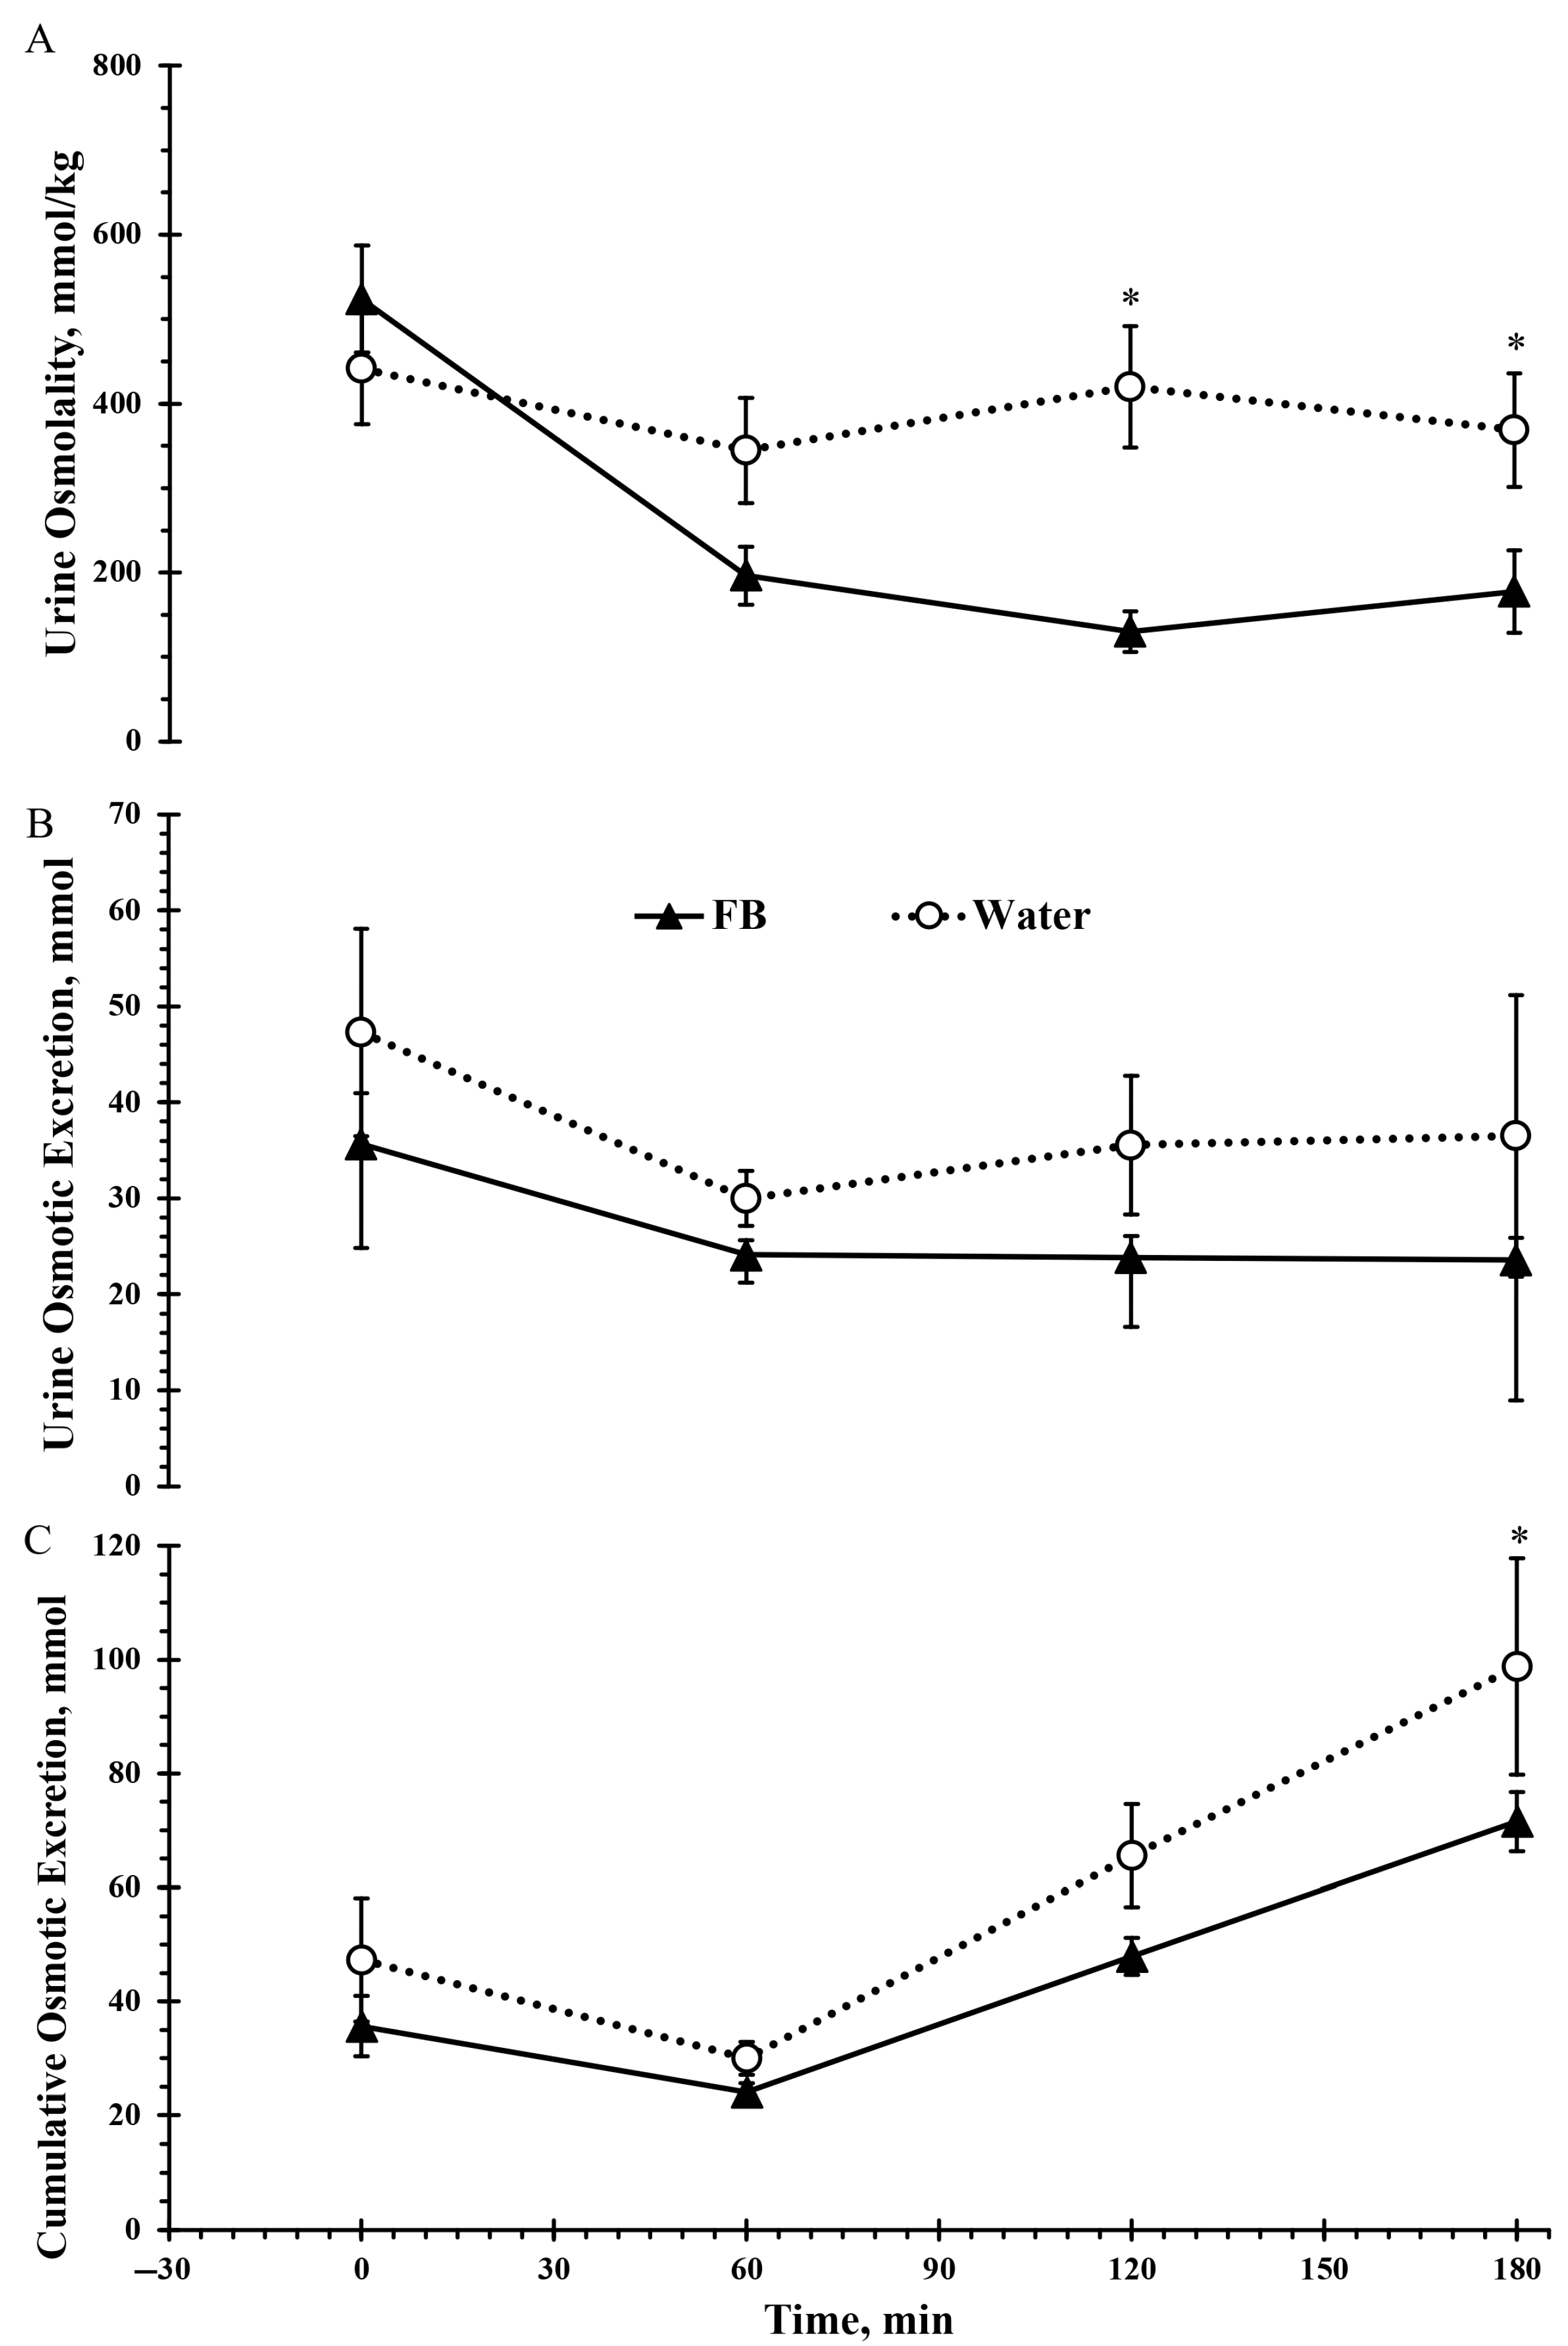
3.4. Urine Osmolality
3.5. Urine Specific Gravity and Color
3.6. Perceptual Ratings
4. Discussion
5. Conclusions
Supplementary Materials
Author Contributions
Funding
Institutional Review Board Statement
Informed Consent Statement
Data Availability Statement
Acknowledgments
Conflicts of Interest
Abbreviations
| NHANES | National Health and Nutrition Examination Survey |
| USG | urine specific gravity |
| SSBs | sugar-sweetened beverages |
| NNSs | non-nutritive sweeteners |
| FDA | US Food and Drug Administration |
References
- Drewnowski, A.; Rehm, C.D.; Constant, F. Water and beverage consumption among children age 4–13y in the United States: Analyses of 2005–2010 NHANES data. Nutr. J. 2013, 12, 85. [Google Scholar] [CrossRef] [PubMed]
- Kenney, E.L.; Long, M.W.; Cradock, A.L.; Gortmaker, S.L. Prevalence of Inadequate Hydration Among US Children and Disparities by Gender and Race/Ethnicity: National Health and Nutrition Examination Survey, 2009–2012. Am. J. Public Health 2015, 105, e113–e118. [Google Scholar] [CrossRef] [PubMed]
- Suh, H.; Kavouras, S.A. Water intake and hydration state in children. Eur. J. Nutr. 2019, 58, 475–496. [Google Scholar] [CrossRef] [PubMed]
- Bar-David, Y.; Urkin, J.; Kozminsky, E. The effect of voluntary dehydration on cognitive functions of elementary school children. Acta Paediatr. 2005, 94, 1667–1673. [Google Scholar] [CrossRef] [PubMed]
- Edmonds, C.J.; Jeffes, B. Does having a drink help you think? 6–7-Year-old children show improvements in cognitive performance from baseline to test after having a drink of water. Appetite 2009, 53, 469–472. [Google Scholar] [CrossRef] [PubMed]
- Fadda, R.; Rapinett, G.; Grathwohl, D.; Parisi, M.; Fanari, R.; Calò, C.M.; Schmitt, J. Effects of drinking supplementary water at school on cognitive performance in children. Appetite 2012, 59, 730–737. [Google Scholar] [CrossRef] [PubMed]
- Kavouras, S.A.; Arnaoutis, G.; Makrillos, M.; Garagouni, C.; Nikolaou, E.; Chira, O.; Ellinikaki, E.; Sidossis, L.S. Educational intervention on water intake improves hydration status and enhances exercise performance in athletic youth. Scand J. Med. Sci. Sports 2012, 22, 684–689. [Google Scholar] [CrossRef] [PubMed]
- Szymanski, M.R.; Giersch, G.E.W.; Morrissey, M.C.; Benjamin, C.L.; Sekiguchi, Y.; Manning, C.N.; Stearns, R.L.; Casa, D.J. Availability of a Flavored Beverage and Impact on Children’s Hydration Status, Sleep, and Mood. Nutrients 2021, 13, 1757. [Google Scholar] [CrossRef] [PubMed]
- Khan, N.A.; Westfall, D.R.; Jones, A.R.; Sinn, M.A.; Bottin, J.H.; Perrier, E.T.; Hillman, C.H. A 4-d Water Intake Intervention Increases Hydration and Cognitive Flexibility among Preadolescent Children. J. Nutr. 2019, 149, 2255–2264. [Google Scholar] [CrossRef] [PubMed]
- Galloway, S.D.R.; Maughan, R.J. Effects of ambient temperature on the capacity to perform prolonged cycle exercise in man. Med. Sci. Sports Exerc. 1997, 29, 1240–1249. [Google Scholar] [CrossRef] [PubMed]
- Meyer, F.; Bar-Or, O. Fluid and electrolyte loss during exercise. The paediatric angle. Sports Med. 1994, 18, 4–9. [Google Scholar] [CrossRef] [PubMed]
- Falk, B. Effects of thermal stress during rest and exercise in the paediatric population. Sports Med. 1998, 25, 221–240. [Google Scholar] [CrossRef] [PubMed]
- Lindower, J.B. Water balance in the fetus and neonate. Semin. Fetal Neonatal Med. 2017, 22, 71–75. [Google Scholar] [CrossRef] [PubMed]
- Manz, F. Hydration in children. J. Am. Coll. Nutr. 2007, 26, 562s–569s. [Google Scholar] [CrossRef] [PubMed]
- Ebner, A.; Manz, F. Sex difference of urinary osmolality in German children. Am. J. Nephrol. 2002, 22, 352–355. [Google Scholar] [CrossRef] [PubMed]
- Epstein, Y.; Shapiro, Y.; Brill, S. Role of surface area-to-mass ratio and work efficiency in heat intolerance. J. Appl. Physiol. 1983, 54, 831–836. [Google Scholar] [CrossRef] [PubMed]
- Falk, B.; Bar-Or, O.; Calvert, R.; MacDougall, J.D. Sweat gland response to exercise in the heat among pre-, mid-, and late-pubertal boys. Med. Sci. Sports Exerc. 1992, 24, 313–319. [Google Scholar] [CrossRef] [PubMed]
- Marino, F.E.; Mbambo, Z.; Kortekaas, E.; Wilson, G.; Lambert, M.I.; Noakes, T.D.; Dennis, S.C. Advantages of smaller body mass during distance running in warm, humid environments. Pflug. Arch 2000, 441, 359–367. [Google Scholar] [CrossRef] [PubMed]
- Meyer, F.; Bar-Or, O.; MacDougall, D.; Heigenhauser, G.J. Sweat electrolyte loss during exercise in the heat: Effects of gender and maturation. Med. Sci. Sports Exerc. 1992, 24, 776–781. [Google Scholar] [CrossRef] [PubMed]
- Bergeron, M.F.; DiLaura Devore, C.; Rice, S.G.; Council on Sports, M.; Fitness; Council on School, H. Climatic Heat Stress and Exercising Children and Adolescents. Pediatrics 2011, 128, e741–e747. [Google Scholar] [CrossRef] [PubMed]
- Bar-Or, O.; Dotan, R.; Inbar, O.; Rotshtein, A.; Zonder, H. Voluntary hypohydration in 10- to 12-year-old boys. J. Appl. Physiol. Respir. Environ. Exerc. Physiol. 1980, 48, 104–108. [Google Scholar] [CrossRef] [PubMed]
- Rivera-Brown, A.M.; Gutiérrez, R.; Gutiérrez, J.C.; Frontera, W.R.; Bar-Or, O. Drink composition, voluntary drinking, and fluid balance in exercising, trained, heat-acclimatized boys. J. Appl. Physiol. 1999, 86, 78–84. [Google Scholar] [CrossRef] [PubMed]
- Santana, J.R.R.; Rivera-Brown, A.M.; Frontera, W.R.; Rivera, M.A.; Mayol, P.M.; Bar-Or, O. Effect of drink pattern and solar radiation on thermoregulation and fluid balance during exercise in chronically heat acclimatized children. Am. J. Hum. Biol. 1995, 7, 643–650. [Google Scholar] [CrossRef] [PubMed]
- Wilk, B.; Bar-Or, O. Effect of drink flavor and NaCL on voluntary drinking and hydration in boys exercising in the heat. J. Appl. Physiol. 1996, 80, 1112–1117. [Google Scholar] [CrossRef] [PubMed]
- Rivera-Brown, A.M.; Ramírez-Marrero, F.A.; Wilk, B.; Bar-Or, O. Voluntary drinking and hydration in trained, heat-acclimatized girls exercising in a hot and humid climate. Eur. J. Appl. Physiol. 2008, 103, 109–116. [Google Scholar] [CrossRef] [PubMed]
- Wilk, B.; Rivera-Brown, A.M.; Bar-Or, O. Voluntary drinking and hydration in non-acclimatized girls exercising in the heat. Eur. J. Appl. Physiol. 2007, 101, 727–734. [Google Scholar] [CrossRef] [PubMed]
- Arnaoutis, G.; Kavouras, S.A.; Angelopoulou, A.; Skoulariki, C.; Bismpikou, S.; Mourtakos, S.; Sidossis, L.S. Fluid Balance During Training in Elite Young Athletes of Different Sports. J. Strength Cond. Res. 2015, 29, 3447–3452. [Google Scholar] [CrossRef] [PubMed]
- Meyer, F.; Bar-Or, O.; Salsberg, A.; Passe, D. Hypohydration during exercise in children: Effect on thirst, drink preferences, and rehydration. Int. J. Sport Nutr. 1994, 4, 22–35. [Google Scholar] [CrossRef] [PubMed]
- Stachenfeld, N.S. Acute effects of sodium ingestion on thirst and cardiovascular function. Curr. Sports Med. Rep. 2008, 7, S7–S13. [Google Scholar] [CrossRef] [PubMed]
- Muth, N.D.; Dietz, W.H.; Magge, S.N.; Johnson, R.K. Public Policies to Reduce Sugary Drink Consumption in Children and Adolescents. Pediatrics 2019, 143, e20190282. [Google Scholar] [CrossRef] [PubMed]
- Bleich, S.N.; Vercammen, K.A. The negative impact of sugar-sweetened beverages on children’s health: An update of the literature. BMC Obes. 2018, 5, 6. [Google Scholar] [CrossRef] [PubMed]
- Schneider, M.B.; Benjamin, H.J.; Committee on Nutrition and the Council on Sports Medicine and Fitness. Sports Drinks and Energy Drinks for Children and Adolescents: Are They Appropriate? Pediatrics 2011, 127, 1182–1189. [Google Scholar] [CrossRef] [PubMed]
- Cohen, J. Eta-Squared and Partial Eta-Squared in Fixed Factor Anova Designs. Educ. Psychol. Meas. 1973, 33, 107–112. [Google Scholar] [CrossRef]
- Wong, S.H.; Sun, F.H. Effect of beverage flavor on body hydration in Hong Kong Chinese children exercising in a hot environment. Pediatr. Exerc. Sci. 2014, 26, 177–186. [Google Scholar] [CrossRef] [PubMed]
- Yeomans, M.R. Taste, palatability and the control of appetite. Proc. Nutr. Soc. 1998, 57, 609–615. [Google Scholar] [CrossRef] [PubMed]
- Baker-Smith, C.M.; de Ferranti, S.D.; Cochran, W.J. The Use of Nonnutritive Sweeteners in Children. Pediatrics 2019, 144, e20192765. [Google Scholar] [CrossRef] [PubMed]
- Patel, A.I.; Hecht, C.E.; Cradock, A.; Edwards, M.A.; Ritchie, L.D. Drinking Water in the United States: Implications of Water Safety, Access, and Consumption. Annu. Rev. Nutr. 2020, 40, 345–373. [Google Scholar] [CrossRef] [PubMed]
- Patel, A.I.; Hampton, K.E. Encouraging Consumption of Water in School and Child Care Settings: Access, Challenges, and Strategies for Improvement. Am. J. Public Health 2011, 101, 1370–1379. [Google Scholar] [CrossRef] [PubMed]
- Committee, D.G.A.; HHS; Prevention, O.o.D.; Promotion, H.; Promotion, C.f.N.P. Dietary Guidelines for Americans 2015–2020; Government Printing Office: Hong Kong, China, 2015. [Google Scholar]
- Purkayastha, S.; Kwok, D. Metabolic fate in adult and pediatric population of steviol glycosides produced from stevia leaf extract by different production technologies. Regul. Toxicol. Pharmacol. 2020, 116, 104727. [Google Scholar] [CrossRef] [PubMed]
- Sylvetsky, A.; Rother, K.I.; Brown, R. Artificial sweetener use among children: Epidemiology, recommendations, metabolic outcomes, and future directions. Pediatr. Clin. N. Am. 2011, 58, 1467–1480. [Google Scholar] [CrossRef] [PubMed]


| Drink | Sodium mmol/L | Potassium mg/L | Carbohydrates g/L | Energy kJ/L | Osmolality mmol/kg H2O |
|---|---|---|---|---|---|
| FB | 3.45 | 0 | 5.7 | 121 | 56 |
| Water | 0 | 0 | 0 | 0 | 0 |
| Boys | Girls | Total | |
|---|---|---|---|
| Sample Size, n | 10 | 11 | 21 |
| Age, y | 9.4 ± 0.8 | 8.8 ± 0.9 | 9.1 ± 0.9 |
| Height, m | 1.37 ± 0.01 | 1.33 ± 0.07 | 1.35 ± 0.09 |
| Weight, kg | 30.3 ± 5.5 | 29.1 ± 5.5 | 29.6 ± 5.4 |
| BMI, kg/m2 | 15.9 ± 1.1 | 16.3 ± 2.2 | 16.1 ± 1.7 |
| Body fat, % | 23.9 ± 5.4 | 29.4 ± 11.4 | 28.8 ± 10.3 |
| Fat-free mass, kg | 22.4 ± 4.7 | 21.7 ± 6.6 | 22.6 ± 6.3 |
| Total body water, L | 16.8 ± 3.4 | 15.9 ± 4.0 | 16.3 ± 3.6 |
| Extracellular fluid, L | 8.4 ± 1.2 | 7.4 ± 1.8 | 7.9 ± 1.6 |
| Intracellular Fluid, L | 8.4 ± 2.5 | 8.6 ± 2.4 | 8.5 ± 2.5 |
| Time, Min | 0 | 60 | 120 | 180 |
|---|---|---|---|---|
| Urine Specific Gravity | ||||
| FB | 1.010 ± 0.007 | 1.004 ± 0.004 | 1.003 ± 0.003 * | 1.004 ± 0.007 * |
| Water | 1.010 ± 0.007 | 1.008 ± 0.007 | 1.010 ± 0.008 | 1.009 ± 0.009 |
| Urine Color | ||||
| FB | 3 ± 2 | 2 ± 1 | 1 ± 1 * | 2 ± 1 * |
| Water | 3 ± 2 | 2 ± 2 | 3 ± 2 | 3 ± 2 |
| Time, Min | 0 | 25 | 60 | 85 | 120 | 145 | 180 |
|---|---|---|---|---|---|---|---|
| Thirst, mm | |||||||
| FB | 36 ± 32 | 50 ± 51 | 44 ± 35 | 49 ± 37 | 59 ± 47 | 31 ± 38 | 36 ± 37 |
| W | 48 ± 52 | 59 ± 41 | 46 ± 36 | 59 ± 41 | 46.0 ± 36 | 60 ± 52 | 37 ± 39 |
| Stomach Fullness, mm | |||||||
| FB | 60 ± 37 | 60 ± 44 | 42 ± 32 | 27 ± 27 | 28 ± 29 | 21 ± 29 | 16 ± 20 |
| Water | 54 ± 37 | 53 ± 40 | 47 ± 35 | 25 ± 27 | 18 ± 21 | 12 ± 23 | 14 ± 23 |
| Mouth Dryness, mm | |||||||
| FB | 36 ± 36 | 46 ± 49 | 32 ± 33 | 29 ± 31 | 40 ± 39 | 37 ± 42 | 32 ± 37 |
| Water | 34 ± 34 | 51 ± 50 | 37 ± 36 | 50 ± 52 | 24 ± 41 | 51 ± 48 | 44 ± 36 |
Disclaimer/Publisher’s Note: The statements, opinions and data contained in all publications are solely those of the individual author(s) and contributor(s) and not of MDPI and/or the editor(s). MDPI and/or the editor(s) disclaim responsibility for any injury to people or property resulting from any ideas, methods, instructions or products referred to in the content. |
© 2025 by the authors. Licensee MDPI, Basel, Switzerland. This article is an open access article distributed under the terms and conditions of the Creative Commons Attribution (CC BY) license (https://creativecommons.org/licenses/by/4.0/).
Share and Cite
Rezaei, S.; Guerrero, R.I.; Kooima, P.; Kavoura, I.E.; Gopalakrishnan, S.T.; Long, C.E.; Wardenaar, F.C.; Siegler, J.C.; Muñoz, C.X.; Kavouras, S.A. A Low-Sugar Flavored Beverage Improves Fluid Intake in Children During Exercise in the Heat. Nutrients 2025, 17, 2418. https://doi.org/10.3390/nu17152418
Rezaei S, Guerrero RI, Kooima P, Kavoura IE, Gopalakrishnan ST, Long CE, Wardenaar FC, Siegler JC, Muñoz CX, Kavouras SA. A Low-Sugar Flavored Beverage Improves Fluid Intake in Children During Exercise in the Heat. Nutrients. 2025; 17(15):2418. https://doi.org/10.3390/nu17152418
Chicago/Turabian StyleRezaei, Sajjad, Rocio I. Guerrero, Parker Kooima, Isabela E. Kavoura, Sai Tejaswari Gopalakrishnan, Clarissa E. Long, Floris C. Wardenaar, Jason C. Siegler, Colleen X. Muñoz, and Stavros A. Kavouras. 2025. "A Low-Sugar Flavored Beverage Improves Fluid Intake in Children During Exercise in the Heat" Nutrients 17, no. 15: 2418. https://doi.org/10.3390/nu17152418
APA StyleRezaei, S., Guerrero, R. I., Kooima, P., Kavoura, I. E., Gopalakrishnan, S. T., Long, C. E., Wardenaar, F. C., Siegler, J. C., Muñoz, C. X., & Kavouras, S. A. (2025). A Low-Sugar Flavored Beverage Improves Fluid Intake in Children During Exercise in the Heat. Nutrients, 17(15), 2418. https://doi.org/10.3390/nu17152418