
Evaluation of the Postprandial-Hyperglycemia-Suppressing Effects and Safety of Short-Term Intake of Mulberry Leaf and Water Chestnut Tea: A Randomized Double-Blind Placebo-Controlled Crossover Trial

 ,
,  , ,
, ,
Abstract
1. Introduction
2. Materials and Methods
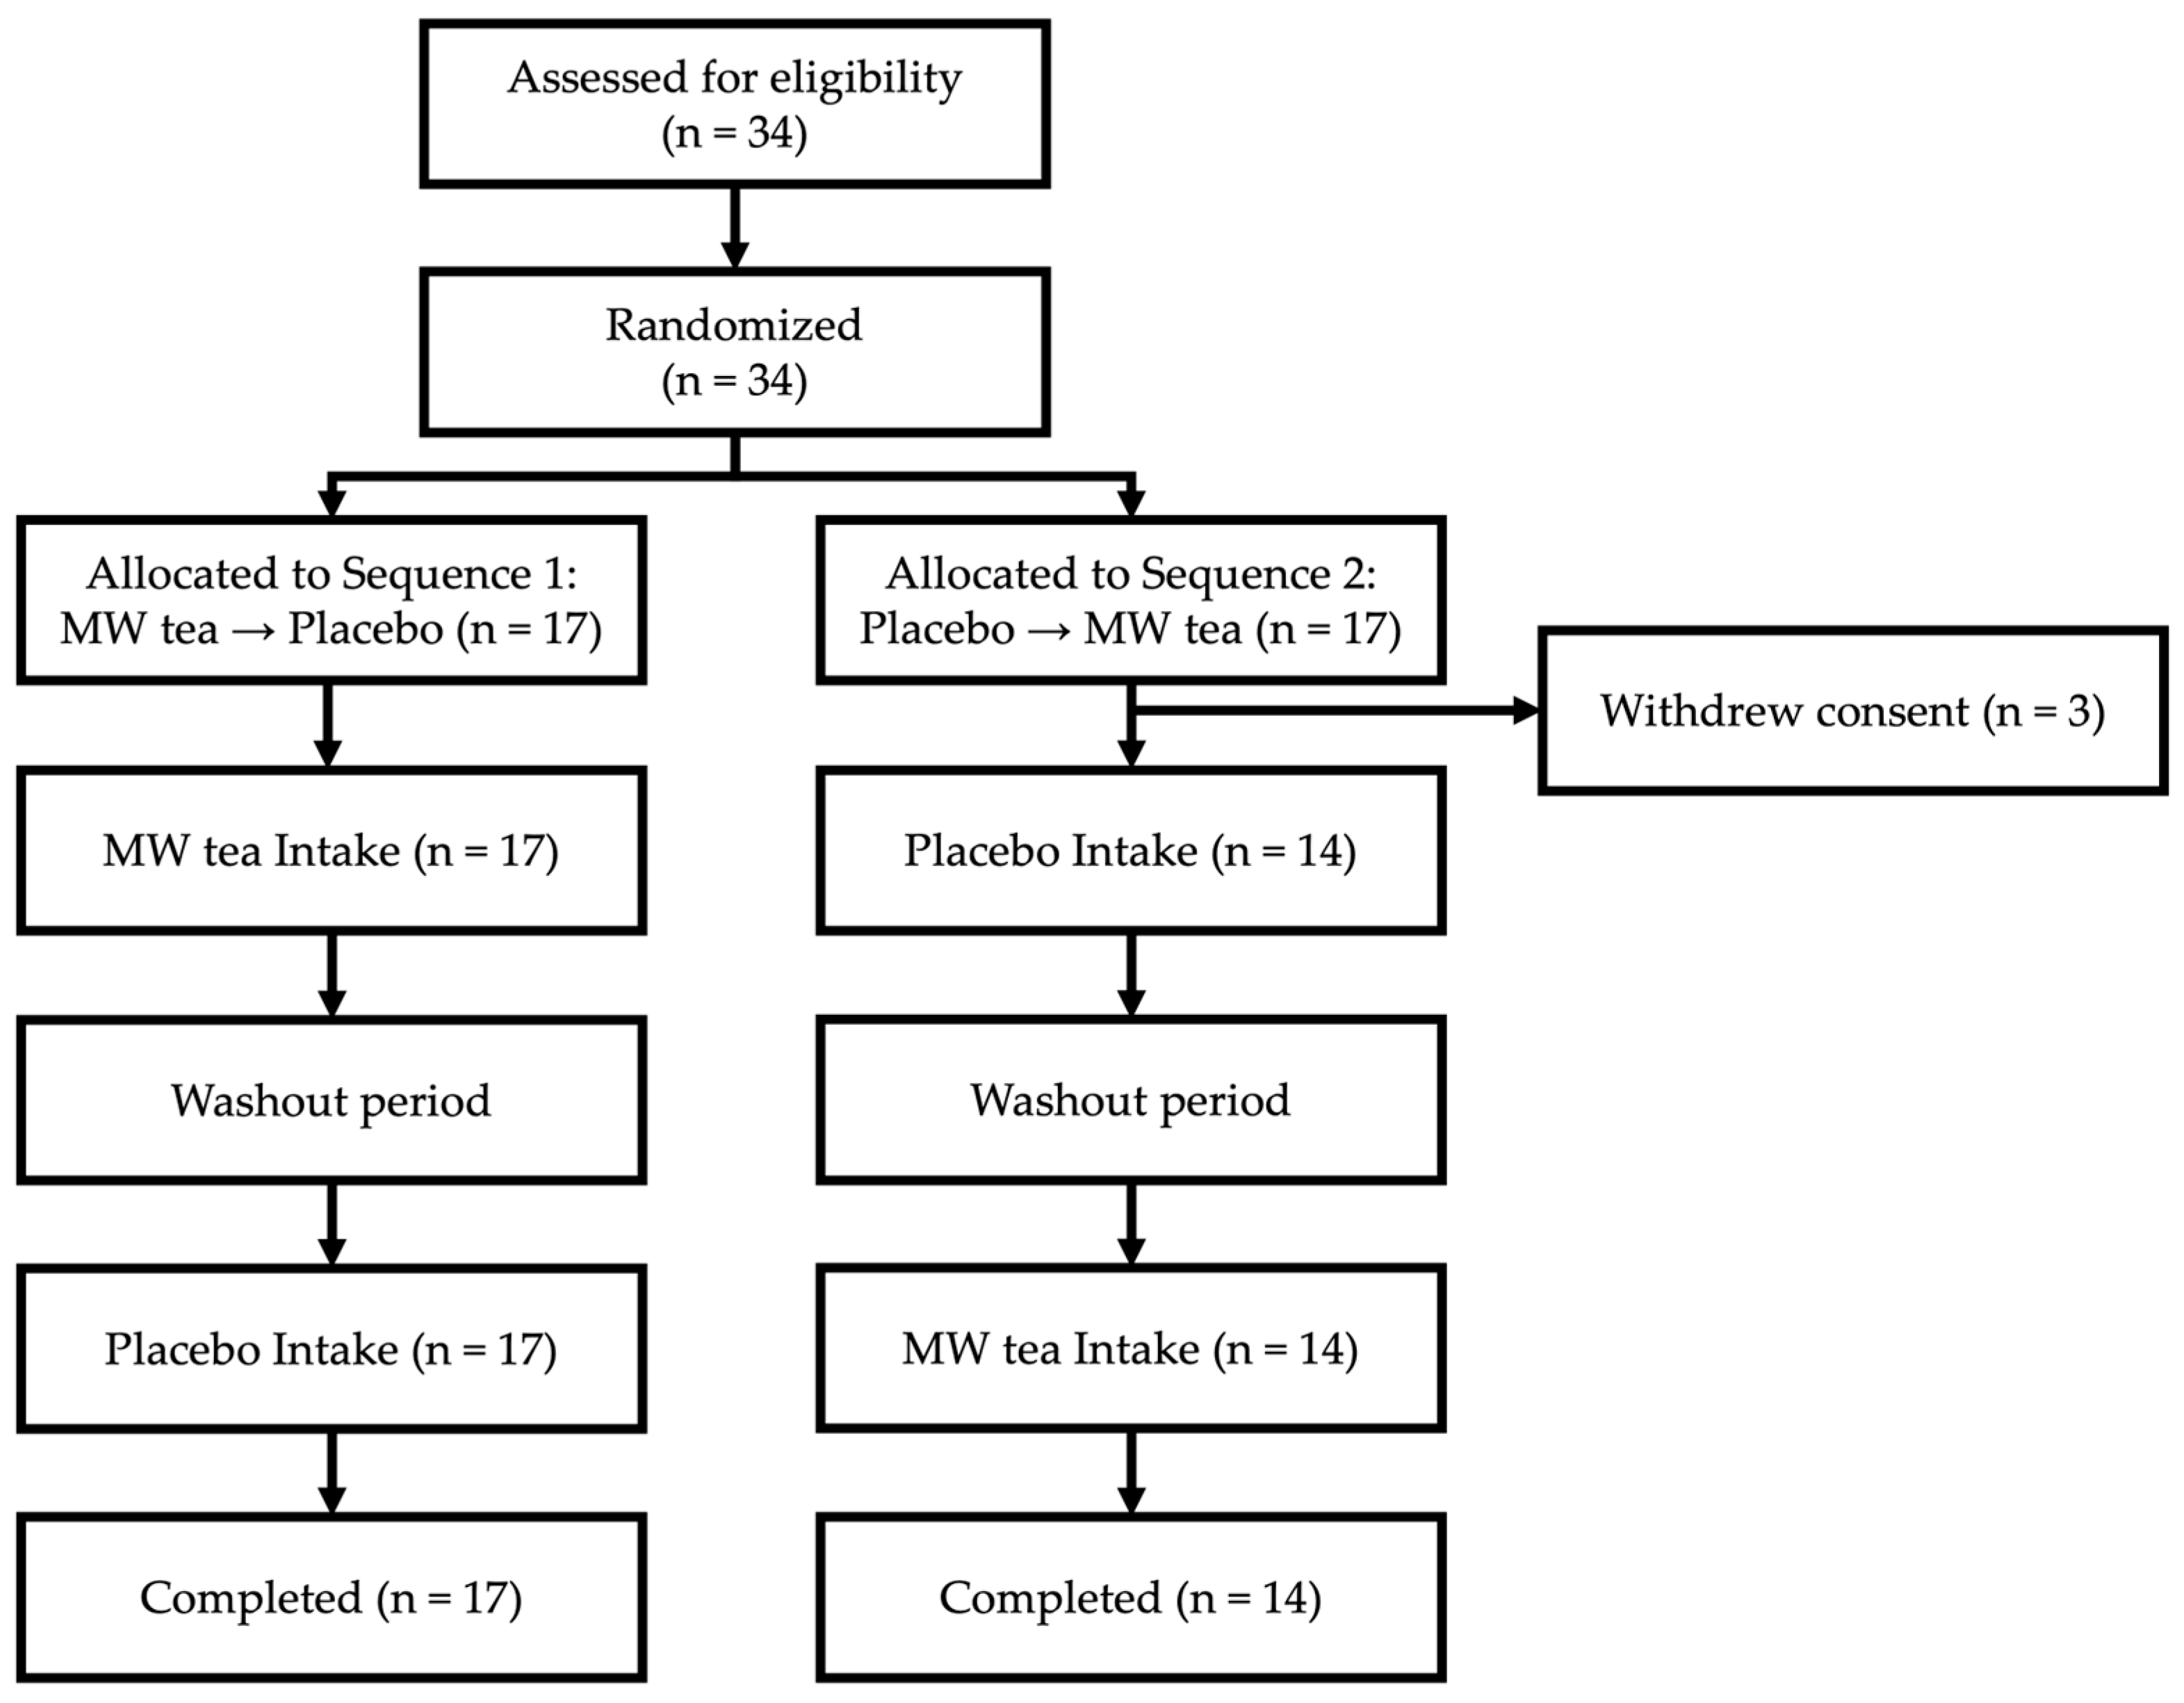
2.1. Participants
2.2. Study Design
2.3. Outcome Measures
2.3.1. Primary Outcome
2.3.2. Secondary Outcomes
2.3.3. Additional Variables
2.4. Statistical Analysis
3. Results
4. Discussion
5. Conclusions
Author Contributions
Funding
Institutional Review Board Statement
Informed Consent Statement
Data Availability Statement
Acknowledgments
Conflicts of Interest
Abbreviations
| 1,5-AG | 1,5-Anhydroglucitol |
| ACCEL | Accelerometer algorithm (specific algorithm name, not a broader abbreviation) |
| ALT (GPT) | Alanine aminotransferase (glutamate pyruvate transaminase) |
| AMPK | AMP-activated protein kinase |
| AST (GOT) | Aspartate aminotransferase (glutamate oxaloacetate transaminase) |
| AUC | Area under the curve |
| BDHQ | Brief Diet History Questionnaire |
| BMI | Body mass index |
| CGM | Continuous glucose monitoring |
| CI | Confidence interval |
| CRP | C-Reactive protein |
| CV | Coefficient of variation |
| DNJ | 1-Deoxynojirimycin |
| GPT | Glutamate pyruvate transaminase (see ALT) |
| GOT | Glutamate oxaloacetate transaminase (see AST) |
| HbA1c | Glycated hemoglobin |
| HOMA-IR | Homeostasis model assessment of insulin resistance |
| LDL | Low-density lipoprotein |
| METs | Metabolic equivalents |
| MW tea | Mulberry leaf and water chestnut tea |
| UMIN | University Hospital Medical Information Network |
References
- Glucose tolerance and mortality: Comparison of WHO and American Diabetes Association diagnostic criteria. The DECODE study group. European Diabetes Epidemiology Group. Diabetes Epidemiology: Collaborative analysis Of Diagnostic criteria in Europe. Lancet 1999, 354, 617–621. [Google Scholar] [CrossRef]
- Schnack, C.; Prager, R.J.; Winkler, J.; Klauser, R.M.; Schneider, B.G.; Schernthaner, G. Effects of 8-wk alpha-glucosidase inhibition on metabolic control, C-peptide secretion, hepatic glucose output, and peripheral insulin sensitivity in poorly controlled type II diabetic patients. Diabetes Care 1989, 12, 537–543. [Google Scholar] [CrossRef]
- Yasuda, M.; Yasutake, K.; Hino, M.; Ohwatari, H.; Ohmagari, N.; Takedomi, K.; Tanaka, T.; Nonaka, G.I. Inhibitory effects of polyphenols from water chestnut (Trapa japonica) husk on glycolytic enzymes and postprandial blood glucose elevation in mice. Food Chem. 2014, 165, 42–49. [Google Scholar] [CrossRef]
- Yasuda, M.; Yasutake, K.; Ohmagari, N.; Saiki, M.; Kojima, Y. Properties of polyphenols in hot water extract of water chestnut husk and suppressive effect on postprandial blood glucose elevation in humans. Food Preserv. Sci. 2018, 44, 179–187. [Google Scholar] [CrossRef]
- Yasuda, M.; Yasutake, K.; Yoshinaga, I.; Nakashima, K.; Saiki, M.; Takeyama-Mitsuta, A.; Doi, T. Mulberry leaves and water chestnut tea reduces postprandial blood glucose in borderline diabetic Japanese: A randomized, double-blind, placebo-controlled crossover study. Asia Pac. J. Clin. Nutr. 2025, 34, 174–182. [Google Scholar] [CrossRef] [PubMed]
- Nakano, T.; Kondo, H.; Ken’o, I.; Nozaki, T.; Matsui, Y. Effects of dietary intake of mulberry leaves on postprandial blood glucose in humans-A randomized, placebo controlled, double-blind, crossover study. J. Glob. 2016, 44, 391–397. [Google Scholar]
- Kojima, Y.; Tomonaga, A. Effect of the mulberry leaf powder on the postprandial elevation of blood glucose level-A randomized, double-blind, placebo-controlled, crossover study. Jpn. J. Pharmacol. Ther. 2020, 48, 2153–2159. [Google Scholar]
- Watson, A.A.; Fleet, G.W.J.; Asano, N.; Molyneux, R.J.; Nash, R.J. Polyhydroxylated alkaloids—Natural occurrence and therapeutic applications. Phytochemistry 2001, 56, 265–295. [Google Scholar] [CrossRef]
- Parida, I.S.; Takasu, S.; Nakagawa, K. A comprehensive review on the production, pharmacokinetics and health benefits of mulberry leaf iminosugars: Main focus on 1-deoxynojirimycin, d-fagomine, and 2-O-α-d-galactopyranosy l-DNJ. Crit. Rev. Food Sci. Nutr. 2023, 63, 3468–3496. [Google Scholar] [CrossRef]
- Nash, R.J.; Kato, A.; Yu, C.Y.; Fleet, G.W.J. Iminosugars as herapeutic agents: Recent advances and promising trends. Future Med. Chem. 2011, 3, 1513–1521. [Google Scholar] [CrossRef]
- Bailey, T.; Bode, B.W.; Christiansen, M.P.; Klaff, L.J.; Alva, S. The performance and usability of a factory-calibrated flash glucose monitoring system. Diabetes Technol. Ther. 2015, 17, 787–794. [Google Scholar] [CrossRef]
- Ode, K.L.; Shi, S.; Katori, M.; Mitsui, K.; Takanashi, S.; Oguchi, R.; Aoki, D.; Ueda, H.R. A jerk-based algorithm ACCEL for the accurate classification of sleep–wake states from arm acceleration. Iscience 2022, 25, 103727. [Google Scholar] [CrossRef] [PubMed]
- Sasaki, S.; Yanagibori, R.; Amano, K. Self-administered diet history questionnaire developed for health education: A relative validation of the test-version by comparison with 3-day diet record in women. J. Epidemiol. 1998, 8, 203–215. [Google Scholar] [CrossRef]
- Kobayashi, S.; Murakami, K.; Sasaki, S.; Okubo, H.; Hirota, N.; Notsu, A.; Fukui, M.; Date, C. Comparison of relative validity of food group intakes estimated by comprehensive and brief-type self-administered diet history questionnaires against 16 d dietary records in Japanese adults. Public Health Nutr. 2011, 14, 1200–1211. [Google Scholar] [CrossRef] [PubMed]
- Danne, T.; Nimri, R.; Battelino, T.; Bergenstal, R.M.; Close, K.L.; DeVries, J.H.; Garg, S.; Heinemann, L.; Hirsch, I.; Amiel, S.A.; et al. International consensus on use of continuous glucose monitoring. Diabetes Care 2017, 40, 1631–1640. [Google Scholar] [CrossRef]
- Bergenstal, R.M. Glycemic variability and diabetes complications: Does it matter? Simply put, there are better glycemic markers! Diabetes Care 2015, 38, 1615–1621. [Google Scholar] [CrossRef]
- Buse, J.B.; Freeman, J.L.R.; Edelman, S.V.; Jovanovic, L.; McGill, J.B. Serum 1,5-anhydroglucitol (GlycoMark): A short-term glycemic marker. Diabetes Technol. Ther. 2003, 5, 355–363. [Google Scholar] [CrossRef] [PubMed]
- Naz, R.; Saqib, F.; Awadallah, S.; Wahid, M.; Latif, M.F.; Iqbal, I.; Mubarak, M.S. Food polyphenols and type II diabetes mellitus: Pharmacology and mechanisms. Molecules 2023, 28, 3996. [Google Scholar] [CrossRef]
- Shahidi, F.; Danielski, R. Review on the role of polyphenols in preventing and treating type 2 diabetes: Evidence from in vitro and in vivo studies. Nutrients 2024, 16, 3159. [Google Scholar] [CrossRef]
- Hanhineva, K.; Törrönen, R.; Bondia-Pons, I.; Pekkinen, J.; Kolehmainen, M.; Mykkänen, H.; Poutanen, K. Impact of dietary polyphenols on carbohydrate metabolism. Int. J. Mol. Sci. 2010, 11, 1365–1402. [Google Scholar] [CrossRef]
- Lown, M.; Fuller, R.; Lightowler, H.; Fraser, A.; Gallagher, A.; Stuart, B.; Byrne, C.; Lewith, G. Mulberry-extract improves glucose tolerance and decreases insulin concentrations in normoglycaemic adults: Results of a randomised double-blind placebo-controlled study. PLoS ONE 2017, 12, e0172239. [Google Scholar] [CrossRef] [PubMed]
- Kobayashi, S. The effect of polyphenols on hypercholesterolemia through inhibiting the transport and expression of Niemann–pick C1-like 1. Int. J. Mol. Sci. 2019, 20, 4939. [Google Scholar] [CrossRef] [PubMed]
- Nekohashi, M.; Ogawa, M.; Ogihara, T.; Nakazawa, K.; Kato, H.; Misaka, T.; Abe, K.; Kobayashi, S. Luteolin and quercetin affect the cholesterol absorption mediated by epithelial cholesterol transporter Niemann–Pick C1-Like 1 in caco-2 cells and rats. PLoS ONE 2014, 9, e97901. [Google Scholar] [CrossRef] [PubMed]
- Baldelli, S.; Aiello, G.; Mansilla Di Martino, E.; Campaci, D.; Muthanna, F.M.S.; Lombardo, M. The role of adipose tissue and nutrition in the regulation of adiponectin. Nutrients 2024, 16, 2436. [Google Scholar] [CrossRef]


| Overall (n = 31) | Sequence 1 (n = 17) | Sequence 2 (n = 14) | |
|---|---|---|---|
| Age | 56 (48.5–65.5) | 57 (48.0–66.0) | 54.5 (49.2–64.8) |
| Gender | |||
| Male | 13 (23%) | 7 (12%) | 6 (11%) |
| Female | 18 (32%) | 10 (18%) | 8 (15%) |
| Body Measurements | |||
| Height [cm] | 161.6 (155.9–170.0) | 161.6 (156.6–170.5) | 162.1 (155.3–168.7) |
| Weight [kg] | 63 (51.6–70.2) | 66 (53.8–75.2) | 55.2 (49.5–66.3) |
| Body Fat [%] | 26 (23.2–31.7) | 27.8 (24.3–33.3) | 24.7 (21.2–28.0) |
| BMI | 23.3 (20.2–25.0) | 24.2 (21.4–27.6) | 21.4 (19.9–24.0) |
| Blood Test Data | (n = 30) | (n = 17) | (n = 13) |
| Glucose [mg/dL] | 101 (95.2–113.2) | 104 (97.0–107.0) | 97 (92.0–115.0) |
| Insulin [μIU/mL] | 6.2 (3.8–8.8) | 7.3 (5.2–8.6) | 5.5 (3.7–8.9) |
| HOMA-IR [mg/dL·μIU/mL] | 1.6 (0.9–2.4) | 1.7 (1.2–2.3) | 1.3 (0.8–2.5) |
| C-Peptide [ng/mL] | 1.5 (1.0–2.0) | 1.5 (1.4–1.9) | 1.2 (0.9–2.0) |
| Glycoalbumin [%] | 14.1 (13.2–14.8) | 13.8 (13.0–14.6) | 14.2 (13.5–15.1) |
| HbA1c (NGSP) [%] | 5.5 (5.3–5.7) | 5.5 (5.4–5.7) | 5.4 (5.3–5.6) |
| 1,5-AG [μg/mL] | 19.4 (14.1–24.3) | 20.3 (15.1–27.9) | 18.4 (13.9–24.1) |
| T-Cholesterol [mg/dL] | 227.5 (196.0–247.0) | 226 (195.0–266.0) | 229 (199.0–243.0) |
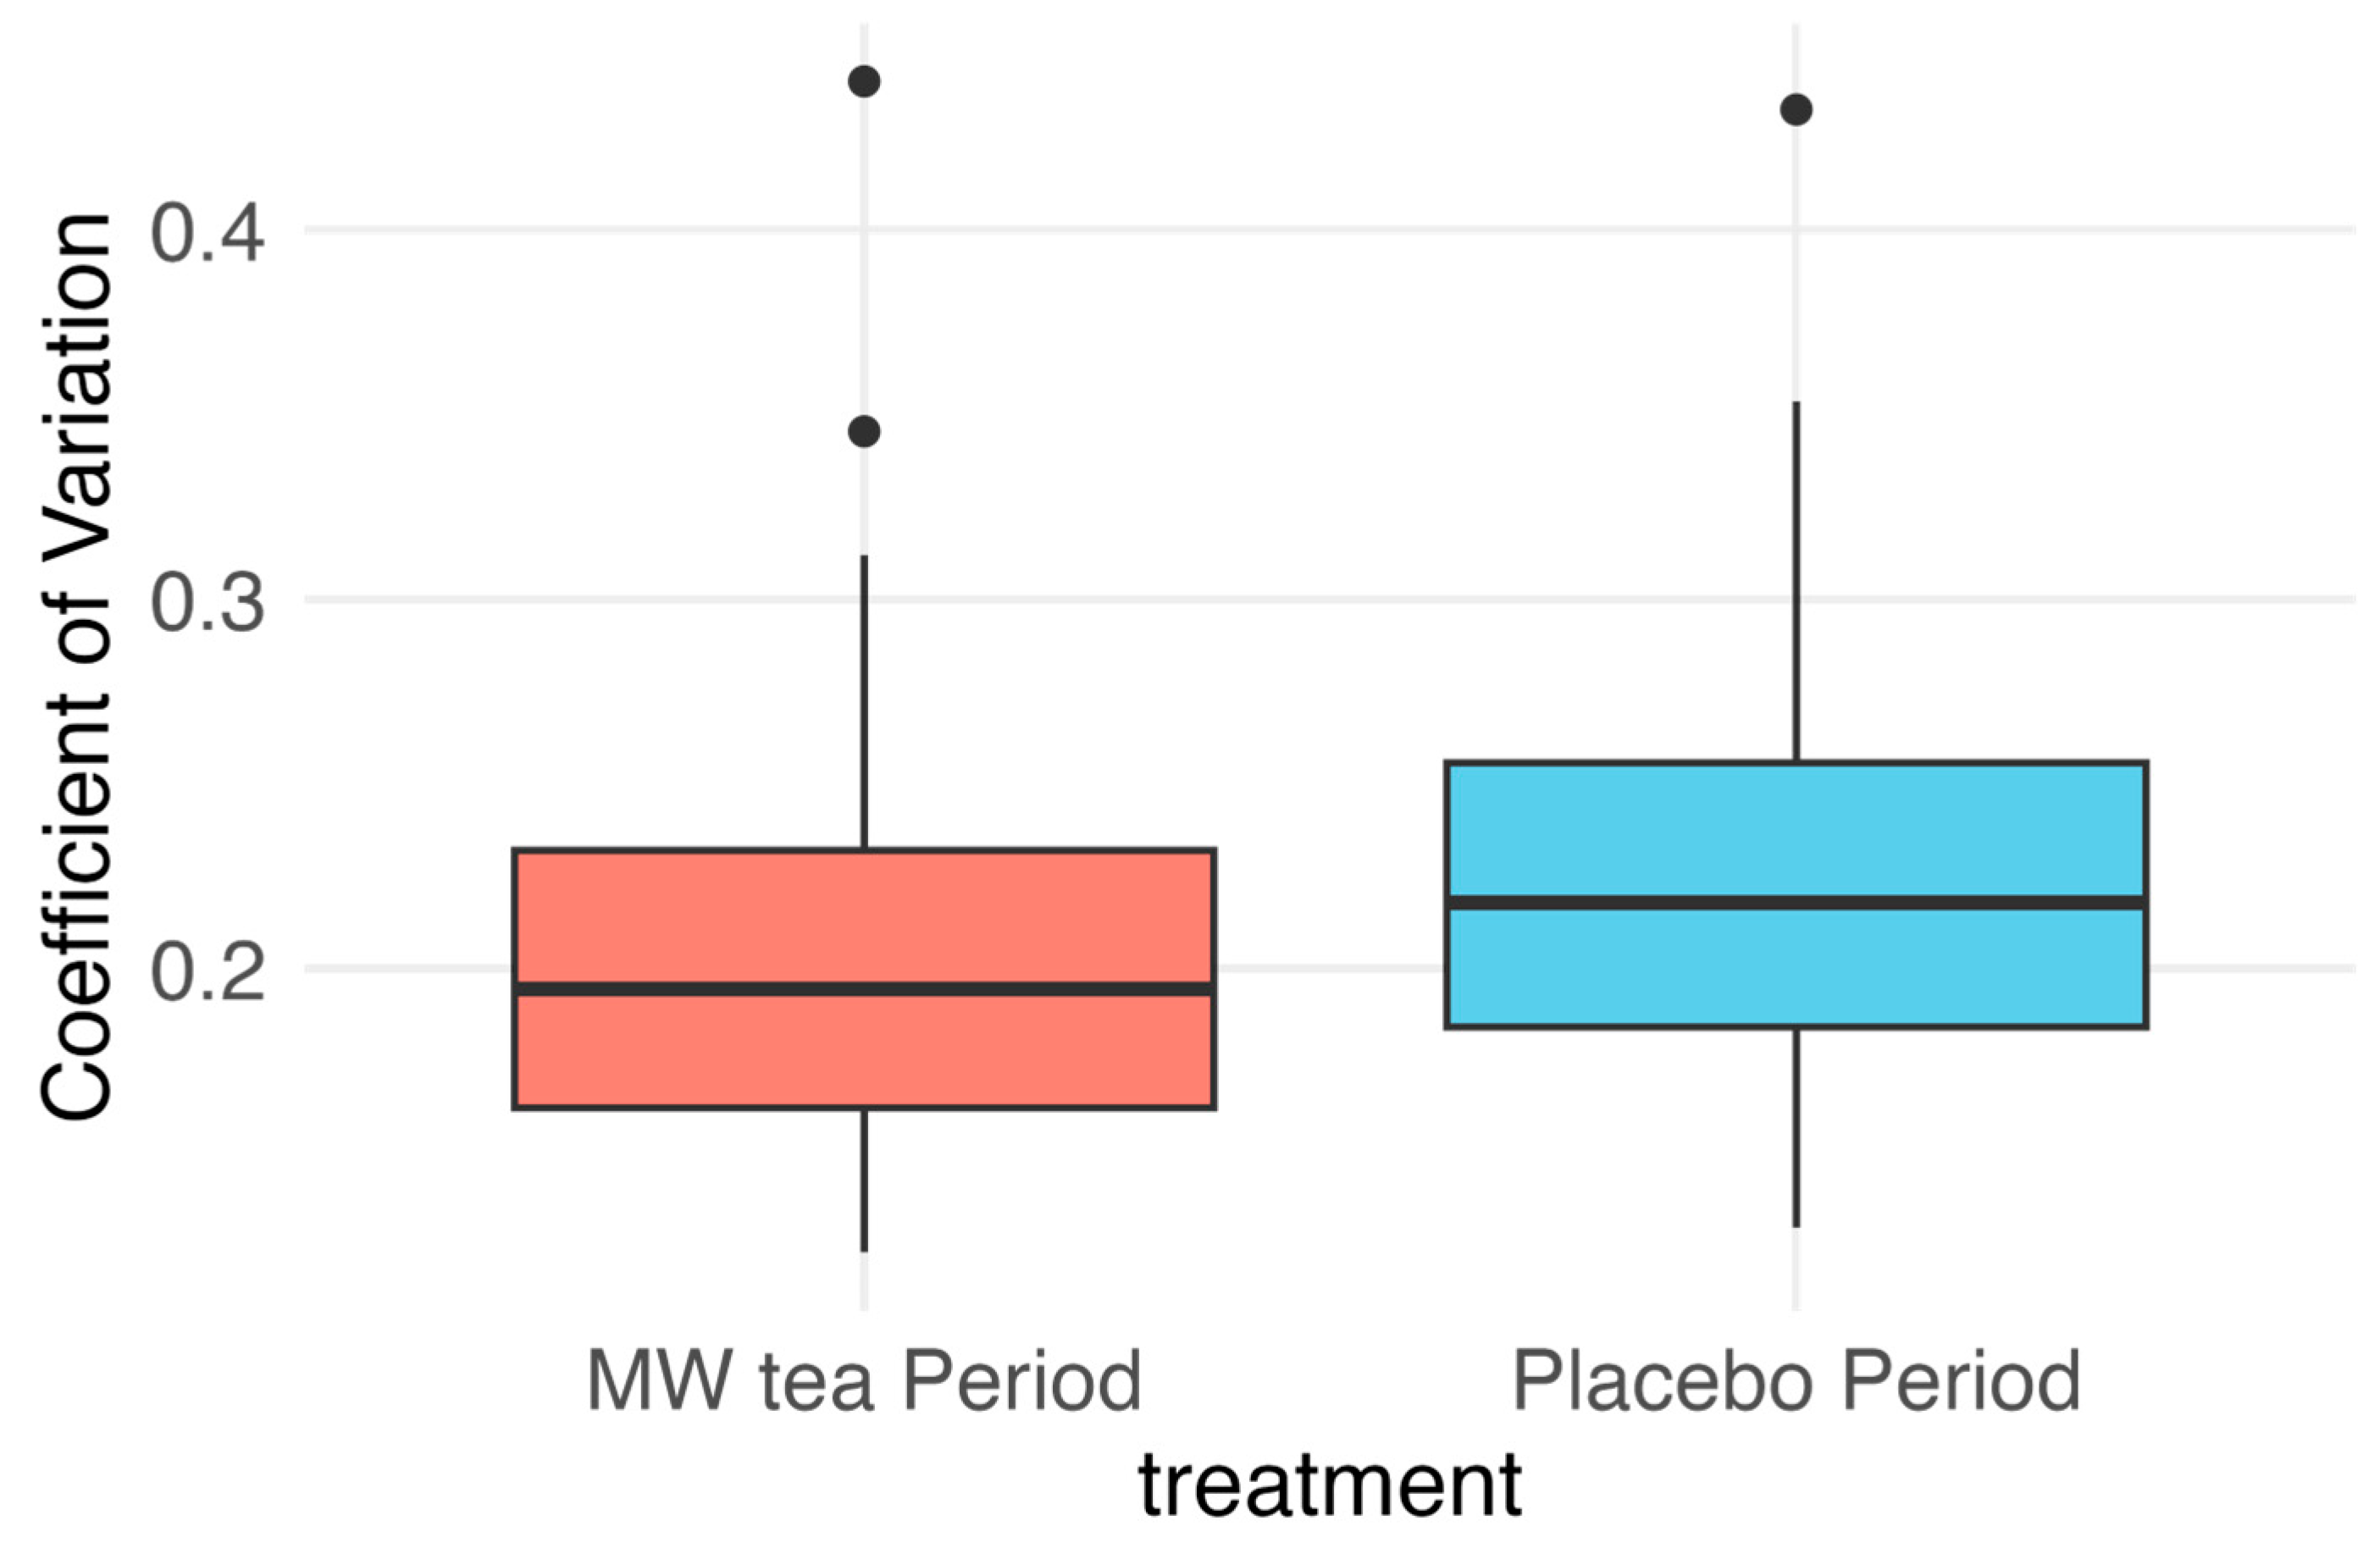
| Period 1 | Period 2 | Within Subject Difference (MW Tea—Placebo) | |
|---|---|---|---|
| Sequence 1: MW tea → Placebo | |||
| Mean (SD) | 0.21 (0.07) | 0.24 (0.07) | −0.025 (0.03) |
| n | 17 | 17 | 17 |
| Sequence 2: Placebo → MW tea | |||
| Mean (SD) | 0.22 (0.05) | 0.20 (0.07) | −0.016 (0.03) |
| n | 14 | 14 | 14 |
| Treatment effect | |||
| LSMean (95% CI) | −0.0203 (−0.031 to −0.010) | ||
| n | 31 | ||
| Paired Analysis | p = 0.0006 |
| Test Item | MW Tea | Placebo Tea | p-Value |
|---|---|---|---|
| Glucose Levels After Test Meal Consumption (Mean) | |||
| AUC 1 h | 1704 (1145) | 2263 (1289) | 0.020 * |
| AUC 2 h | 4262 (2502) | 4853 (3524) | 0.267 |
| AUC 3 h | 5658 (3280) | 6190 (4679) | 0.484 |
| Blood Test Data (Mean Change †) | |||
| Peripheral Blood General Test | |||
| White Blood Cell [μL] | 183.333 (925.532) | 30.000 (740.992) | 0.462 |
| Red Blood Cell [×104/μL] | 2.067 (17.767) | 7.833 (17.313) | 0.245 |
| Hemoglobin [g/dL] | 0.030 (0.565) | 0.247 (0.483) | 0.164 |
| Hematocrit [%] | 0.190 (1.791) | 0.710 (1.452) | 0.231 |
| MCV [fL] | −0.010 (1.196) | −0.047 (1.124) | 0.913 |
| MCH [pg] | −0.057 (0.409) | 0.010 (0.330) | 0.494 |
| MCHC [%] | −0.080 (0.506) | 0.040 (0.425) | 0.361 |
| Platelet Count [×104/μL] | 0.113 (1.954) | 0.227 (2.132) | 0.864 |
| Liver Function | |||
| AST (GOT) [U/L] | −0.067 (3.571) | 0.133 (3.785) | 0.827 |
| ALT (GPT) [U/L] | 0.733 (6.125) | −0.667 (4.671) | 0.228 |
| Total Bilirubin [mg/dL] | 0.017 (0.207) | 0.003 (0.154) | 0.791 |
| Renal Function | |||
| Creatinine [mg/dL] | −0.004 (0.044) | −0.005 (0.048) | 0.958 |
| Uric Acid (UA) [mg/dL] | 0.000 (0.538) | −0.013 (0.452) | 0.919 |
| Lipid Metabolism | |||
| HDL Cholesterol [mg/dL] | −3.267 (5.723) | −0.100 (4.950) | 0.053 |
| LDL Cholesterol [mg/dL] | −7.400 (18.350) | 0.633 (11.987) | 0.076 |
| Total Cholesterol [mg/dL] | −7.767 (19.224) | 6.167 (18.424) | 0.021 * |
| Triglycerides [mg/dL] | 7.167 (71.705) | 28.133 (64.959) | 0.325 |
| Glucose Metabolism | |||
| Glucose [mg/dL] | −1.233 (7.632) | 0.200 (7.073) | 0.523 |
| HbA1c (NGSP) [%] | −0.030 (0.134) | −0.020 (0.103) | 0.794 |
| Insulin [μIU/mL] | 0.843 (3.545) | 0.308 (3.609) | 0.580 |
| Glycoalbumin [%] | 0.143 (0.673) | 0.217 (0.703) | 0.635 |
| 1,5-AG [μg/mL] | 0.937 (1.234) | 0.037 (1.100) | 0.005 * |
| Glucose Metabolism | |||
| Albumin (Alb) [g/dL] | 0.043 (0.267) | 0.167 (0.199) | 0.070 |
| C-Peptide (CPR) [ng/mL] | 0.078 (0.558) | 0.063 (0.410) | 0.914 |
| C-Reactive Protein (CRP) [mg/dL] | 0.016 (0.225) | 0.018 (0.177) | 0.958 |
| Other Markers | |||
| Albumin (Alb) [g/dL] | 0.043 (0.267) | 0.167 (0.199) | 0.070 |
| C-Peptide (CPR) [ng/mL] | 0.078 (0.558) | 0.063 (0.410) | 0.914 |
| C-Reactive Protein (CRP) [mg/dL] | 0.016 (0.225) | 0.018 (0.177) | 0.958 |
| Body Measurements (Mean Change †) | |||
| Weight [kg] | −0.223 (0.67) | −0.253 (0.40) | 0.834 |
| Body Fat Percentage [%] | 0.293 (1.03) | 0.210 (1.18) | 0.772 |
| BMI [kg/m2] | −0.083 (0.26) | −0.097 (0.15) | 0.810 |
| Activity and Sleep Monitors (Mean) | |||
| Caloric Expenditure [kcal/h] | 12.16 (6.23) | 13.13 (6.33) | 0.184 |
| Physical Activity Intensity [1/h] | 1.74 (0.18) | 1.76 (0.19) | 0.341 |
| Daily Sleep Duration [h] | 5.72 (1.13) | 5.78 (1.04) | 0.605 |
| Nocturnal Awakenings [h] | 0.74 (0.48) | 0.77 (0.46) | 0.619 |
| Self-Reported Symptoms (Count) | |||
| Hypoglycemic Symptoms | 1 | 2 | 0.56 |
| Gastrointestinal Symptoms | 6 | 1 | 0.10 |
| Dermatological Symptoms | 1 | 1 | 1.0 |
| Item | Precrossover Period Mean (SD) | During-Crossover Period Mean (SD) | p-Value |
|---|---|---|---|
| Estimated Energy Requirement [kcal/day] | 2189.3 (307.0) | 2188.6 (307.3) | 0.160 |
| Energy [kcal/day] | 1839.1 (530.1) | 1696.1 (466.7) | 0.015 * |
| Weight [g/day] | 2139.5 (683.0) | 1974.8 (621.0) | 0.040 * |
| Water [g/day] | 1743.8 (597.7) | 1611.6 (536.0) | 0.061 |
| Protein [g/day] | 65.6 (17.9) | 63.7 (18.7) | 0.411 |
| Fat [g/day] | 54.0 (15.3) | 53.0 (15.3) | 0.657 |
| Carbohydrates [g/day] | 246.5 (97.0) | 220.3 (78.6) | 0.067 |
Disclaimer/Publisher’s Note: The statements, opinions and data contained in all publications are solely those of the individual author(s) and contributor(s) and not of MDPI and/or the editor(s). MDPI and/or the editor(s) disclaim responsibility for any injury to people or property resulting from any ideas, methods, instructions or products referred to in the content. |
© 2025 by the authors. Licensee MDPI, Basel, Switzerland. This article is an open access article distributed under the terms and conditions of the Creative Commons Attribution (CC BY) license (https://creativecommons.org/licenses/by/4.0/).
Share and Cite
Shinkawa, Y.; Yasuda, M.; Nishida, Y.; Tokiya, M.; Takagi, Y.; Matsumoto, A.; Kawaguchi, A.; Hara, M. Evaluation of the Postprandial-Hyperglycemia-Suppressing Effects and Safety of Short-Term Intake of Mulberry Leaf and Water Chestnut Tea: A Randomized Double-Blind Placebo-Controlled Crossover Trial. Nutrients 2025, 17, 2308. https://doi.org/10.3390/nu17142308
Shinkawa Y, Yasuda M, Nishida Y, Tokiya M, Takagi Y, Matsumoto A, Kawaguchi A, Hara M. Evaluation of the Postprandial-Hyperglycemia-Suppressing Effects and Safety of Short-Term Intake of Mulberry Leaf and Water Chestnut Tea: A Randomized Double-Blind Placebo-Controlled Crossover Trial. Nutrients. 2025; 17(14):2308. https://doi.org/10.3390/nu17142308
Chicago/Turabian StyleShinkawa, Yuya, Midori Yasuda, Yuichiro Nishida, Mikiko Tokiya, Yusuke Takagi, Akiko Matsumoto, Atsushi Kawaguchi, and Megumi Hara. 2025. "Evaluation of the Postprandial-Hyperglycemia-Suppressing Effects and Safety of Short-Term Intake of Mulberry Leaf and Water Chestnut Tea: A Randomized Double-Blind Placebo-Controlled Crossover Trial" Nutrients 17, no. 14: 2308. https://doi.org/10.3390/nu17142308
APA StyleShinkawa, Y., Yasuda, M., Nishida, Y., Tokiya, M., Takagi, Y., Matsumoto, A., Kawaguchi, A., & Hara, M. (2025). Evaluation of the Postprandial-Hyperglycemia-Suppressing Effects and Safety of Short-Term Intake of Mulberry Leaf and Water Chestnut Tea: A Randomized Double-Blind Placebo-Controlled Crossover Trial. Nutrients, 17(14), 2308. https://doi.org/10.3390/nu17142308