Abstract
Background/Objectives: Trimethylamine (TMA), produced by gut microbiota, and its derivative trimethylamine N-oxide (TMAO) are both associated with cardiometabolic diseases. While the effects of high-fat diets (HFDs) and high-disaccharide diets (HDDs) on gut microbiota in the context of obesity have been well studied, their impact on TMA/TMAO production, particularly alongside physiological caloric intake, remains obscure. This study investigates how standard HFDs and HDDs alongside physiological caloric intake influence gut microbiota composition and TMA/TMAO production in rats. Methods: Sprague Dawley rats were fed one of three diets a standard diet, an HFD, or an HDD for 12 weeks, with chow availability adjusted by age to maintain physiological caloric intake. Gut bacterial diversity was analyzed using 16S rRNA gene sequencing, and metabolites were quantified via High-Performance Liquid Chromatography-Mass Spectrometry (HPLC-MS) in urine and plasma. Results: The HFD group had significantly higher urinary levels of TMA and TMAO compared to the control and HDD groups. Gut bacterial diversity in the HFD group was markedly reduced, displaying the lowest species richness and phylogenetic diversity among all the groups. Notably, Pasteurellaceae (within the order Pasteurellales) and S24-7 (within the order Bacteroidales) were positively correlated with TMAO levels. The demonstrated HDD group increased microbial diversity compared to both the control and HFD groups. Conclusions: A high-fat diet during controlled and physiological caloric intake increases TMA/TMAO production and reduces gut microbial diversity. This underscores the role of diet composition, beyond caloric excess, in shaping gut microbiota and the related cardiometabolic biomarkers.
1. Introduction
Trimethylamine (TMA) and its oxidized derivative, trimethylamine N-oxide (TMAO), are derived from the gut microbiota metabolism of dietary carnitine and choline [1]. These metabolites have garnered significant attention due to their association with cardiometabolic dysfunction, where they are recognized as both biomarkers and potential mediators of cardiovascular disease [2,3,4].
Recent research suggests that specific bacterial taxa including Clostridium, Escherichia, and Desulfovibrio are involved in TMA production; yet, the extent to which these findings can be generalized across various dietary and metabolic contexts remains unclear [5,6].
Dietary composition is known to be a significant determinant of TMA and TMAO production, with evidence showing that high-fat and high-choline diets promote the abundance of TMA-producing bacteria and elevate plasma TMAO [3,7]. However, studies to date have employed ad libitum feeding models, which lead to obesity complicating the interpretation of findings. In contrast, the aim of this study was to investigate the effects of HFD and HDD with physiological caloric intake on TMA and TMAO production, a model free from the confounding influence of obesity.
2. Materials and Methods
2.1. Animals and Experimental Design
The experiments adhered to Directive 2010/63 EU, which focuses on safeguarding animals used for scientific purposes. These experiments were also approved by the Local Bioethical Committee (no: WAW2/107/2021). The rats were housed in groups of 4 animals in polypropylene cages with environmental enrichment, following a 12 h light and 12 h dark cycle. The temperature was maintained at 22–23 °C, with a humidity level of 45–55%.
The samples for the present study were obtained from our previous study [8] on male and female Sprague Dawley rats (n = 44) divided into three groups. The control group (n = 16) received a standard laboratory diet, while the high-disaccharides diet group (n = 14) (HDD) and the high-fat diet (HFD) group (n = 14) received diets rich in fats during the 3 months. The animals were allocated into groups based on their initial body weight, ensuring that average body weight did not differ significantly between the groups at the beginning of the experiment.
The composition and nutritional value of the diets are shown in Table 1. Throughout the experiment, all animals, regardless of the supplementation procedure, received the same caloric intake daily. All experimental groups received an equivalent caloric intake, adjusted according to body weight gain as the rats matured. The rats were weighed weekly, and their energy needs were calculated based on their current weights using guidelines from the Nutrient Requirements of Laboratory [9]. Each day they were provided with a specific amount of feed (in grams) corresponding to their calculated caloric requirement. The rats were housed in cages with a fixed amount of food tailored to their body weight. Any uneaten food was collected and weighed daily, with the leftover amount converted into caloric values. The actual energy intake for each rat over the course of the experiment was determined by subtracting the caloric value of the uneaten food from the total calories initially provided. Supplementary Table S1 provides details of the total calorie intakes. Supplementary Table S2 presents the initial and final body weight of the rats.

Table 1.
Nutritive value, crude nutrients, and metabolized energy of diets.
The rats were initially anesthetized via an intraperitoneal (IP) injection of a ketamine-xylazine mixture (70 mg/kg ketamine and 10 mg/kg xylazine). Once fully anesthetized, blood was collected directly from the heart using a syringe. Blood samples were collected using chilled EDTA tubes and centrifuged at 5000 rpm for 5 min at 4 °C. The resulting plasma was transferred into Eppendorf tubes and stored at −20 °C. Following blood collection, the rats were euthanized by dislocation, and stool samples (0.5 mL) were obtained from the midsection of the colon. The animals were fasted for 6 h before sacrifice.
The rats were maintained for 2 days in metabolic cages to evaluate their 24 h fluid and energy balance prior to and after the main section of this study. Body mass, energy and water intake, and urine output were measured at the start and at the end of the experiment [8].
2.2. 16 rRNA Library Preparation and Sequencing
DNA was isolated from 180 to 220 mg of stool with the use of a Nucleospin DNA Stool Kit (Macherey-Nagel; Düren, Germany), following the manufacturer’s protocol. Final elution was performed in 100 μL of water. DNA was quantified using a Qubit High Sensitivity Kit (ThermoFisher, Waltham, MA, USA). The V3 and V4 regions of the 16S rRNA gene were amplified (550 bp product) with the use of 12 ng of extracted DNA, a set of V3–V4 primers [10], and 0.5 U of polymerase from a KAPA HiFi HotStart ReadyMix PCR Kit (Roche Molecular Diagnostics, Basel, Switzerland). The amplified products were purified using a 0.8 ratio of AMPure XP beads (Beckman Coulter Life Sciences, Indianapolis, IN, USA) and their size was evaluated with a Bioanalyzer and DNA 1000 kit (Agilent Technologies, Santa Clara, CA, USA). Sequencing libraries were dual-indexed using the Nextera XT Index kit (Illumina, San Diego, CA, USA) and sequenced (300 nt, paired-end reads) using a MiSeq Reagent Kit v3 (600-cycle) on the Illumina MiSeq platform.
2.3. Bioinformatic and Statistics
FastQC software (v0.11.7) was used to evaluate the quality of the sequencing reads [11], which were further trimmed by trimmomatic [12] and filtered based on their size by BBTools [13]. The remaining reads were subjected to an analysis with QIIME (version 1.9.1); [14]. In short, the forward and reverse reads were merged using fastq-join command [14]. Operational taxonomic units (OTUs) were determined by an open-reference OTU picking process and the Greengenes database (threshold value of 97% sequence similarity). Unmapped sequences were clustered de novo and aligned once again. Chimera detection was performed with the use of ChimeraSlayer [15]. Normalization was achieved using metagenomeSeq’s CSS (cumulative sum scaling) transformation [16].
A Linear discriminant analysis (LDA) effect size (LEfSe) analysis was performed to detect differentially abundant bacterial taxa [17]. The identified taxa with an LDA score higher than two were considered to be enriched in the respective group as compared to the other groups.
A statistical analysis was performed based on alpha- and beta-diversity metrics. Principal Coordinates Analysis (PCoA) plots (unweighted and weighted UniFrac data) for beta diversity were generated using QIIME output data in PhyloToAST [18]. Abundance plots were generated using the phyloseq package in R (v1.38.0) [19]. The Mann–Whitney U test was used for alpha diversity statistics, whereas a taxonomical comparison between the different groups was performed using a nonparametric t-test. Additionally, a categorical variable analysis of similarities (ANOSIM) was performed.
2.4. Biochemicals and Metabolites Panel Analysis
Plasma and urine concentrations of bacterial metabolites were measured using Waters Acquity Ultra Performance Liquid Chromatograph (Waters Corporation, Milford, MA, USA) coupled with a Waters TQ-S triple-quadrupole mass spectrometer (Waters, Manchester, UK). The mass spectrometer was operated in the multiple reaction monitoring (MRM)-positive electrospray ionization (ESI) mode, as previously described [20].
2.5. Statistical Analysis
The Shapiro–Wilk test was used to test the normality of the distribution. The results were statistically analyzed with ANOVA followed by Tukey’s post hoc test for normally distributed data or a Mann–Whitney test for nonnormal distributed data using GraphPad Prism version 8.0.1 for Windows, (GraphPad Software, La Jolla, CA, USA). p ≤ 0.05 or lower, was considered significant.
3. Results
3.1. Gut Microbiota Composition in Rats Receiving Normal Chow vs. An HFD for 12 Weeks
3.1.1. Start of the Experiment
There were no significant differences in the composition of gut microbiota between the given groups at the start of the experiment (Figure 1a).
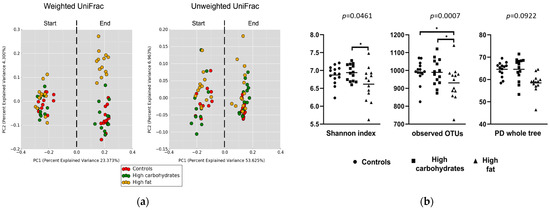
Figure 1.
Changes in gut microbiota composition in Sprague Dawley rats maintained on a control or a high-fat diet (HFD) for 12 weeks. (a) Beta diversity plot showing the shift in gut microbiota using a weighted UniFrac and an unweighted UniFrac at the start and the end of experiment. Both metrics are used to compute the distances between samples and then visualize them using a Principal Coordinates Analysis (PCoA). Unweighted UniFrac measures beta diversity based on the presence or absence of taxa, focusing on community membership and giving weight to rare organisms. In contrast, weighted UniFrac incorporates both presence and relative abundance, highlighting the differences in community structure and emphasizing dominant taxa. (b) Alfa diversity metrics showing community richness in the studied groups: Shannon index (accounts for both the richness and evenness of species in a sample), observed OTUs (number of detected species), and PD whole tree (reflecting not just the number of species, but also their evolutionary relationships, giving more diversity weight to the samples that include taxa from distinct branches of the tree). * p < 0.05.
3.1.2. Dietary Interventions Altered the Microbiomes
Differences in gut bacteria composition between the start and the end of the experiment were found in all the presented groups. A beta diversity analysis (weighted and unweighted) showed significant differences (p < 0.001) between the groups (Figure 1a).
3.1.3. The HDD Enhanced Microbial Diversity, Whereas the HFD Resulted in Its Decline
The beta diversity analysis (weighted and unweighted) showed significant differences (p < 0.001) between the groups (Figure 1a). A comparison of alpha diversity (within-sample microbial diversity) showed that the HDD group has a higher average number of species and higher phylogenetic diversity than the controls and HFD, while the HFD group has a significantly lower average number of species and phylogenetic diversity compared to the controls (Figure 1a). Significant differences in the Shannon parameters and observed OTUs between the HFD group and the controls were found (Figure 1b).
Using the pair abundancy statistic (FDR P), the abundance of bacteria was unchanged while the unpaired statistic revealed significant differences in family and genus levels (Figure 2a).
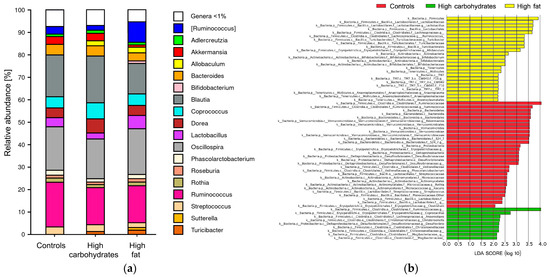
Figure 2.
Relative abundance and LDA score of gut bacteria in Sprague Dawley rats maintained on a control or high-fat diet (HFD) for 12 weeks: (a) Comparison of abundances of bacterial groups at the genus level; n = 44; (b) LDA score. A score higher than 2 means differences exist in a given group in terms of Taxonomic rank compared to the other groups; n = 44.
3.1.4. LDA Score
The enrichment or depletion of taxa across various taxonomic levels, from phylum to genus, was identified through an LEfSe analysis (Figure 2b).
The taxa that were enriched in the controls were as follows: at the phylum level, Bacteroidetes, Verrucomicrobia, and Proteobacteria; at the class level, Bacteroidia, and Deltaproteobacteria; at the order level, Bacteroidales, Verrucomicrobiales, Desulfovibrionales Actinomycetales, and Lactobacillales; at the family level, Ruminococcaceae, Verrucomicrobiaceae Desulfovibrionaceae, and Streptococcaceae Micrococcaceae; and at the genus level, Ruminococcus, Phascolarctobacterium, Rothia, Kocuria, and Clostridium.
The enriched taxa in the HFD rats were as follows: at the phylum level, Firmicutes, and Tenericutes; at the class level, Actinobacteria, Mollicutes, and unidentified TM7_3; at the order level, Lactobacillales, Turicibacterales Bifidobacteriales, and unidentified CW040; at the family level, lactobacillaceae, Lachnospiraceae, Turicibacteraceae, Bifidobacteriaceae, and unidentified F16; and at the genus level, Lactobacillus, Ruminococcus, Turicibacter, Allobaculum, Bifidobacterium, and Anaeroplasma.
The enriched taxa in the HDD rats were as follows: at the family level, Ruminococcaceae, Christensenellaceae, and Mogibacteriaceae; and at the genus level, Coprobacillus, Anaerostipes, Christensenella, and Desulfovibrio.
3.2. The HFD Increased Urine Metabolite Levels
There were significant differences between the groups in terms of various urine metabolite levels. The HFD rats had significantly higher levels of TMA, (p < 0.001 vs. control; p < 0.05 vs. HDD), TMAO (p < 0.001 vs. control; p < 0.05 vs. HDD), betaine (p < 0.001 vs. control; p < 0.05 vs. HDD) (Table 2), and carnitine (p < 0.001 vs. control; p < 0.001 vs. HDD).
Table 2.
Metabolites panel in urine in Sprague Dawley rats maintained on control diet, HDD, or HFD for 12 weeks.
3.3. Daily Urinary Excretion
The HDD rats showed significantly lower TMAO excretion than the controls (p < 0.01) and the HFD rats (p < 0.001). The HFD rats had significantly higher TMA (p < 0.05 vs. control; p < 0.01 vs. HDD), betaine (p < 0.01 vs. control; p < 0.001 vs. HDD), and carnitine (p < 0.05 vs. control; p < 0.001 vs. HDD) excretions than the control and HDD rats, respectively (Table 3).
Table 3.
Daily urinary excretion of metabolites in Sprague Dawley rats maintained on a control diet, HDD, or HFD for 12 weeks.
3.4. HDD Increased Plasma Betaine Levels
Plasma betaine level was significantly higher (p < 0.01) in the HDD rats compared to the controls. No differences were found between the control and HFD rats. There were no significant differences between the groups in terms of plasma TMA and TMAO levels (Table 4).
Table 4.
Metabolites panel in plasma in Sprague Dawley rats maintained on a control, high-disaccharides diet (HDD), or high-fat diet (HFD) for 12 weeks.
3.5. Correlation Analysis Between Bacterial Taxonomic Groups (Based on LDA Scores) and the Concentrations of Various Metabolites in Urine
At the phylum level, only one statistically significant correlation was observed. Tenericutes were negatively correlated with TMA under HFD conditions (r = −0.7235, p = 0.0457).
At the order level, under HFD conditions, Pasteurellales showed a strong positive correlation with choline (r = 0.8105, p = 0.0137), GPC (r = 0.7746, p = 0.0420), and TMAO (r = 0.7746, p = 0.0420). Additionally, under HDD conditions, Bifidobacteriales demonstrated a significant positive correlation with TMA (r = 0.8122, p = 0.0129).
At the family level, Pasteurellaceae, a member of the Pasteurellales order, was positively correlated with GPC (r = 0.8105, p = 0.0273) and TMAO (r = 0.7746, p = 0.0420) under HFD conditions. Furthermore, the S24-7 family within the Bacteroidales order was positively correlated with TMAO (r = 0.7813, p = 0.0420) under HFD conditions. Under HDD conditions, Bifidobacteriaceae exhibited a strong positive correlation with TMA (r = 0.8122, p = 0.0257).
At the genus level, Bifidobacterium, within the Bifidobacteriaceae family, was specifically associated with TMA under HDD conditions, showing a positive correlation (r = 0.8122, p = 0.0484) (Table 5).
Table 5.
Correlation between bacteria and metabolites in HDD and HFD groups.
4. Discussion
In this study, we found that an HFD and an HDD, administered during physiological caloric intake, significantly altered both the gut bacterial composition and the urinary excretion of bacterial metabolites. Specifically, we observed considerable disparities in both the alpha and beta diversity of bacteria, as well as notable differences in the specific bacterial genera and families among the experimental groups. Notably, the high-fat diet group demonstrated the most substantial variability across all the aforementioned parameters, while displaying the lowest bacterial diversity compared to the control groups. Previous research suggests that dietary components can affect gut bacteria composition [21,22]. Both carbohydrates and fats could alter gut microbiota diversity [23,24,25]. Additionally, the LDA score analysis showed specific differences on various taxonomic levels in bacterial abundance between the groups. Our findings reinforce the body of evidence that dietary fat can influence gut microbiota composition [23,24]. Furthermore, a novel finding of our study is the demonstration that excessive caloric intake is not a prerequisite for such alterations.
A metabolomic analysis revealed significantly higher levels of TMA and TMAO, betaine, and carnitine in the urine of the HFD-fed rats relative to the HDD and control groups. Furthermore, TMA and TMAO are known to be linked with increased cardiovascular and renal disease risks, hypertension, and atherogenesis, highlighting the potential metabolic pathways through which HFD exacerbates CV risk [1,2,3,26,27]. Since the levels of those metabolites were significantly lower in the HDD group, which was comparable to the control group, it suggests that the HDD does not affect the TMA/TMAO bacterial metabolic pathways. Under HFD conditions, we observed positive correlations between the order Pasteurellales and metabolites such as choline, GPC, and TMAO, suggesting their potential involvement in TMA and TMAO formation pathways in this dietary context. Similarly, the family S24-7 showed a correlation with TMAO production.
In the HDD group, a positive correlation was identified between Bifidobacteriales and TMA levels, highlighting diet-specific microbial contributions to TMA metabolism. However, overall TMA production was higher in the HFD group than in the HDD.
It is important to note that despite significant differences in the daily urine excretions of TMA and TMAO between the control and HFD rats, plasma levels remained comparable. This suggests that despite the markedly higher production and turnover of TMA and TMAO in the HFD rats, plasma concentrations are tightly regulated, at least as long as kidney function remains normal. However, it has been observed that in chronic kidney disease, there is an accumulation of TMA and TMAO due to impaired renal elimination [28]. Thus, urinary concentrations—particularly 24 h excretion levels—should be considered more reliable indicators of TMA and TMAO production than blood levels.
Study Limitations
Although we observed correlations between urine TMA/TMAO levels and the relative abundance of Pasteurellaceae and S24-7, it is important to note that taxonomic associations alone do not confirm functional involvement in TMA production.
While these findings emphasize the influence of diet on microbiota composition and TMA/TMAO production, there is currently no conclusive evidence in the literature that Pasteurellaceae, S24-7, Tenericutes, or Bifidobacteriales directly produce TMA from precursors such as choline or L-carnitine. The enzymes essential for this process, such as cutC, have not been confirmed in their genomes. Further metagenomic or transcriptomic analyses are needed to elucidate the potential role of these microbial groups in TMA/TMAO metabolism.
5. Conclusions
In conclusion, our study underscores the pivotal role of diet composition, beyond mere caloric intake, in shaping gut microbiota and their metabolite production. The findings provide evidence that a high-fat diet, even with normal caloric intake, promotes a gut environment conducive to the production of TMA, a compound implicated in cardiovascular pathology. In contrast, disaccharide-rich diets do not appear to have the same effect. These results suggest that microbiota-derived metabolites may play an important role in the cardiovascular pathology associated with high-fat diets.
Supplementary Materials
The following supporting information can be downloaded at https://www.mdpi.com/article/10.3390/nu17132230/s1.
Author Contributions
The authors’ responsibilities were as follows: conceptualization, M.U. and M.S.; formal analysis, M.U. and M.S.; investigation, M.U., M.S., M.Z., M.R., K.P. and E.S.; data curation, M.S., M.R. and K.P.; funding acquisition M.U.; writing original draft preparation, M.U. and M.S.; writing—review and editing, M.S., M.U., M.R., K.P. and M.Z. All authors have read and agreed to the published version of the manuscript.
Funding
This research was funded by the National Science Center Poland, grant no: 2020/37/B/NZ5/00366 and the APC was funded by the Medical University of Warsaw.
Institutional Review Board Statement
The animal study protocol was approved by the Local Bioethical Committee (no: WAW2/107/2021/ date: 28 July 2021).
Informed Consent Statement
Not applicable.
Data Availability Statement
The original contributions presented in this study are included in the article/Supplementary Materials. Further inquiries can be directed at the corresponding authors.
Acknowledgments
The graphical abstract was created using BioRender. Konop, M. (2025), https://BioRender.com/2s58r2v (accessed on 1 July 2025).
Conflicts of Interest
The authors declare no conflicts of interest. The funders had no role in the design of this study; in the collection, analyses, or interpretation of data; in the writing of the manuscript; or in the decision to publish the results.
Abbreviations
The following abbreviations are used in this manuscript:
| ALT | alanine transaminase |
| AST | aspartate aminotransferase |
| CVD | cardiovascular diseases |
| HFD | high-fat diet |
| HDD | high-disaccharides diet |
| LDA | Linear discriminant analysis |
| OTUs | Operational taxonomic units |
| SD | Sprague Dawley rats |
| TMA | trimethylamine |
| TMAO | trimethylamine-N-oxide |
References
- Koeth, R.A.; Wang, Z.; Levison, B.S.; Buffa, J.A.; Org, E.; Sheehy, B.T.; Britt, E.B.; Fu, X.; Wu, Y.; Li, L.; et al. Intestinal microbiota metabolism of L-carnitine, a nutrient in red meat, promotes atherosclerosis. Nat. Med. 2013, 19, 576–585. [Google Scholar] [CrossRef] [PubMed]
- Wang, Z.; Klipfell, E.; Bennett, B.J.; Koeth, R.; Levison, B.S.; Dugar, B.; Feldstein, A.E.; Britt, E.B.; Fu, X.; Chung, Y.M.; et al. Gut flora metabolism of phosphatidylcholine promotes cardiovascular disease. Nature 2011, 472, 57–63. [Google Scholar] [CrossRef] [PubMed]
- Tang, W.H.; Wang, Z.; Levison, B.S.; Koeth, R.A.; Britt, E.B.; Fu, X.; Wu, Y.; Hazen, S.L. Intestinal microbial metabolism of phosphatidylcholine and cardiovascular risk. N. Engl. J. Med. 2013, 368, 1575–1584. [Google Scholar] [CrossRef] [PubMed]
- Khan, Q.A.; Asad, M.; Ali, A.H.; Farrukh, A.M.; Naseem, U.; Semakieh, B.; Levin Carrion, Y.; Afzal, M. Gut microbiota metabolites and risk of major adverse cardiovascular events and death: A systematic review and meta-analysis. Medicine 2024, 103, e37825. [Google Scholar] [CrossRef]
- Chen, Y.R.; Zhou, L.Z.; Fang, S.T.; Long, H.Y.; Chen, J.Y.; Zhang, G.X. Isolation of Desulfovibrio spp. from human gut microbiota using a next-generation sequencing directed culture method. Lett. Appl. Microbiol. 2019, 68, 553–561. [Google Scholar] [CrossRef]
- Rath, S.; Heidrich, B.; Pieper, D.H.; Vital, M. Uncovering the trimethylamine-producing bacteria of the human gut microbiota. Microbiome 2017, 5, 54. [Google Scholar] [CrossRef]
- Yoo, W.; Zieba, J.K.; Foegeding, N.J.; Torres, T.P.; Shelton, C.D.; Shealy, N.G.; Byndloss, A.J.; Cevallos, S.A.; Gertz, E.; Tiffany, C.R.; et al. High-fat diet-induced colonocyte dysfunction escalates microbiota-derived trimethylamine N-oxide. Science 2021, 373, 813–818. [Google Scholar] [CrossRef]
- Szudzik, M.; Hutsch, T.; Chabowski, D.; Zajdel, M.; Ufnal, M. Normal caloric intake with high-fat diet induces metabolic dysfunction-associated steatotic liver disease and dyslipidemia without obesity in rats. Sci. Rep. 2024, 14, 22796. [Google Scholar] [CrossRef]
- National Research Council (US) Subcommittee on Laboratory Animal Nutrition. Nutrient Requirements of Laboratory Animals: Fourth Revised Edition, 1995; National Academies Press: Washington, DC, USA, 1995. [Google Scholar] [CrossRef]
- Klindworth, A.; Pruesse, E.; Schweer, T.; Peplies, J.; Quast, C.; Horn, M.; Glöckner, F.O. Evaluation of general 16S ribosomal RNA gene PCR primers for classical and next-generation sequencing-based diversity studies. Nucleic Acids Res. 2013, 41, e1. [Google Scholar] [CrossRef]
- Andrews, S. FastQC: A Quality Control Tool for High Throughput Sequence Data. 2010. Available online: https://www.bioinformatics.babraham.ac.uk/projects/fastqc/ (accessed on 1 July 2025).
- Bolger, A.M.; Lohse, M.; Usadel, B. Trimmomatic: A flexible trimmer for Illumina sequence data. Bioinformatics 2014, 30, 2114–2120. [Google Scholar] [CrossRef]
- Bushnell, B.; Rood, J.; Singer, E. BBMerge—Accurate paired shotgun read merging via overlap. PLoS ONE 2017, 12, e0185056. [Google Scholar] [CrossRef] [PubMed]
- Caporaso, J.G.; Kuczynski, J.; Stombaugh, J.; Bittinger, K.; Bushman, F.D.; Costello, E.K.; Fierer, N.; Peña, A.G.; Goodrich, J.K.; Gordon, J.I.; et al. QIIME allows analysis of high-throughput community sequencing data. Nat. Methods 2010, 7, 335–336. [Google Scholar] [CrossRef]
- Haas, B.J.; Gevers, D.; Earl, A.M.; Feldgarden, M.; Ward, D.V.; Giannoukos, G.; Ciulla, D.; Tabbaa, D.; Highlander, S.K.; Sodergren, E.; et al. Chimeric 16S rRNA sequence formation and detection in Sanger and 454-pyrosequenced PCR amplicons. Genome Res. 2011, 21, 494–504. [Google Scholar] [CrossRef] [PubMed]
- Paulson, J.N.; Stine, O.C.; Bravo, H.C.; Pop, M. Differential abundance analysis for microbial marker-gene surveys. Nat. Methods 2013, 10, 1200–1202. [Google Scholar] [CrossRef]
- Segata, N.; Izard, J.; Waldron, L.; Gevers, D.; Miropolsky, L.; Garrett, W.S.; Huttenhower, C. Metagenomic biomarker discovery and explanation. Genome Biol. 2011, 12, R60. [Google Scholar] [CrossRef] [PubMed]
- Dabdoub, S.M.; Fellows, M.L.; Paropkari, A.D.; Mason, M.R.; Huja, S.S.; Tsigarida, A.A.; Kumar, P.S. PhyloToAST: Bioinformatics tools for species-level analysis and visualization of complex microbial datasets. Sci. Rep. 2016, 6, 29123. [Google Scholar] [CrossRef]
- McMurdie, P.J.; Holmes, S. phyloseq: An R package for reproducible interactive analysis and graphics of microbiome census data. PLoS ONE 2013, 8, e61217. [Google Scholar] [CrossRef]
- Jaworska, K.; Huc, T.; Samborowska, E.; Dobrowolski, L.; Bielinska, K.; Gawlak, M.; Ufnal, M. Hypertension in rats is associated with an increased permeability of the colon to TMA, a gut bacteria metabolite. PLoS ONE 2017, 12, e0189310. [Google Scholar] [CrossRef]
- Rinninella, E.; Cintoni, M.; Raoul, P.; Lopetuso, L.R.; Scaldaferri, F.; Pulcini, G.; Miggiano, G.A.D.; Gasbarrini, A.; Mele, M.C. Food Components and Dietary Habits: Keys for a Healthy Gut Microbiota Composition. Nutrients 2019, 11, 2393. [Google Scholar] [CrossRef]
- Ruiz-Ojeda, F.J.; Plaza-Díaz, J.; Sáez-Lara, M.J.; Gil, A. Effects of Sweeteners on the Gut Microbiota: A Review of Experimental Studies and Clinical Trials. Adv. Nutr. 2019, 10, S31–S48. [Google Scholar] [CrossRef]
- Zhang, C.; Zhang, M.; Pang, X.; Zhao, Y.; Wang, L.; Zhao, L. Structural resilience of the gut microbiota in adult mice under high-fat dietary perturbations. ISME J. 2012, 6, 1848–1857. [Google Scholar] [CrossRef] [PubMed]
- Cândido, F.G.; Valente, F.X.; Grześkowiak, Ł.M.; Moreira, A.P.B.; Rocha, D.; Alfenas, R.C.G. Impact of dietary fat on gut microbiota and low-grade systemic inflammation: Mechanisms and clinical implications on obesity. Int. J. Food Sci. Nutr. 2018, 69, 125–143. [Google Scholar] [CrossRef] [PubMed]
- Do, M.H.; Lee, E.; Oh, M.J.; Kim, Y.; Park, H.Y. High-Glucose or -Fructose Diet Cause Changes of the Gut Microbiota and Metabolic Disorders in Mice without Body Weight Change. Nutrients 2018, 10, 761. [Google Scholar] [CrossRef] [PubMed]
- Missailidis, C.; Hällqvist, J.; Qureshi, A.R.; Barany, P.; Heimbürger, O.; Lindholm, B.; Stenvinkel, P.; Bergman, P. Serum Trimethylamine-N-Oxide Is Strongly Related to Renal Function and Predicts Outcome in Chronic Kidney Disease. PLoS ONE 2016, 11, e0141738. [Google Scholar] [CrossRef]
- Kim, R.B.; Morse, B.L.; Djurdjev, O.; Tang, M.; Muirhead, N.; Barrett, B.; Holmes, D.T.; Madore, F.; Clase, C.M.; Rigatto, C.; et al. Advanced chronic kidney disease populations have elevated trimethylamine N-oxide levels associated with increased cardiovascular events. Kidney Int. 2016, 89, 1144–1152. [Google Scholar] [CrossRef]
- Pelletier, C.C.; Croyal, M.; Ene, L.; Aguesse, A.; Billon-Crossouard, S.; Krempf, M.; Lemoine, S.; Guebre-Egziabher, F.; Juillard, L.; Soulage, C.O. Elevation of Trimethylamine-N-Oxide in Chronic Kidney Disease: Contribution of Decreased Glomerular Filtration Rate. Toxins 2019, 11, 635. [Google Scholar] [CrossRef]
Disclaimer/Publisher’s Note: The statements, opinions and data contained in all publications are solely those of the individual author(s) and contributor(s) and not of MDPI and/or the editor(s). MDPI and/or the editor(s) disclaim responsibility for any injury to people or property resulting from any ideas, methods, instructions or products referred to in the content. |
© 2025 by the authors. Licensee MDPI, Basel, Switzerland. This article is an open access article distributed under the terms and conditions of the Creative Commons Attribution (CC BY) license (https://creativecommons.org/licenses/by/4.0/).