Article

Integrated Multi-Omics Analysis Reveals the Regulatory Mechanism of Peanut Skin Procyanidins on Lipid Metabolism in High-Fat-Diet-Induced Obese Mice

by
Jinxin Shen
1,
Yi Zhou
1,
Daijun Yang
1,
Ruonan Liu
1,
Xiaoling Zhu
2 and
Rui Liu
1,*
1
College of Food Science and Technology, Huazhong Agricultural University, Wuhan 430070, China
2
Hubei Provincial Institute for Food Supervision and Test, Wuhan 430075, China
*
Author to whom correspondence should be addressed.
Nutrients 2025, 17(13), 2228; https://doi.org/10.3390/nu17132228
Submission received: 28 May 2025 / Revised: 2 July 2025 / Accepted: 2 July 2025 / Published: 5 July 2025
(This article belongs to the Section Nutrition and Metabolism)

Abstract

Background: Obesity-associated metabolic disorders represent a critical global health challenge, which necessitates innovative strategies targeting lipid metabolism. Peanut skin procyanidins (PSPs), abundant bioactive compounds derived from agricultural by-products, show potential in lipid regulation, but molecular mechanisms remain unclear. Methods: This study integrated hepatic metabolomics, network pharmacology, and gut microbiota analysis to systematically decipher the mechanisms for PSP to ameliorate high-fat diet (HFD)-induced lipid metabolism disorders. Results: PSP intervention significantly attenuated HFD-induced increases in LDL-C, TG, and TC levels and effectively mitigated hepatic lipid accumulation. Metabolomics revealed that PSP reshaped hepatic lipid dynamics by modulating glycerophospholipid, linoleic acid, arachidonic acid, tryptophan, and nitrogen metabolism. Subsequent network pharmacology identified PLA2G10, PLA2G5, PLA2G2A, and CYP1B1 as the core targets, and PSP could markedly suppress their HFD-induced overexpression. Furthermore, PSP selectively reshaped the gut microbiota, enriching beneficial genera such as Akkermansia and Bacteroides while reducing the abundance of harmful bacteria within Firmicutes. PICRUSt-based functional prediction indicated that PSP alters gut microbial glutamine synthetase activity. Conclusions: Mechanistically, PSP regulates lipid metabolism by downregulating PLA2G10, PLA2G5, PLA2G2A, and CYP1B1 expression, remodeling gut microbiota structure, and increasing hepatic glutamine level. These findings provide novel insights into value-added utilization of agricultural byproducts and development of targeted intervention strategies for metabolic diseases.

1. Introduction

Obesity and the associated metabolic syndrome have emerged as a global public health crisis. Epidemiological data have revealed that the obesity rate has reached about 20% among Chinese children and adolescents, which is strongly correlated with chronic conditions such as diabetes and cardiovascular diseases [1,2]. Dysregulated lipid metabolism, which is characterized by impaired lipid absorption, transport, and oxidative balance, is a central mechanism in obesity pathogenesis [1,3]. Recent research has identified critical regulatory targets in lipid metabolism, including the AMP-activated protein kinase (AMPK) signaling pathway (modulating energy homeostasis), peroxisome proliferator-activated receptor gamma (PPARγ) (mediating adipocyte differentiation), and sterol regulatory element-binding protein 1c (SREBP-1c) (promoting fatty acid synthesis) [4,5]. Although dietary intervention is widely recognized as an effective strategy, it remains challenging to precisely target the metabolic pathways through functional components in natural products.
Dietary polyphenols, particularly procyanidins, have attracted significant attention for their excellent bioactive properties. Procyanidins are abundant in fruits and nuts [6], exhibiting the potential to regulate energy homeostasis and suppress adipogenesis [7,8,9,10]. Notably, peanut (Arachis hypogaea L.) is an agricultural crop with an annual yield exceeding 19 million tons in China [11], and approximately 500,000 tons of peanut skins are generated as by-products each year. Peanut skins are extremely rich in procyanidins, which account for up to 15% of their dry weight [12], underscoring its potential for value-added utilization. It has been demonstrated that peanut-skin-derived procyanidins (PSPs) can alleviate lipid metabolic disorders through mechanisms such as gut microbiota modulation and AKT signaling inhibition [13,14,15]. However, the regulatory mechanisms of PSP on obesity-associated lipid metabolism remain incompletely elucidated.
The liver is the central hub for lipid metabolism, orchestrating the metabolism of lipids, glucose, and amino acids [16]. Metabolomics allows for the systematic profiling of dynamic lipid metabolite reprogramming and pinpointing the key metabolic nodes under pathological conditions [17]. For example, Laia et al. [18] identified significant differences in the lipid metabolites among obese individuals through lipidomics. Network pharmacology constructs “compound–target–pathway” networks to predict the targets of bioactive components and the associated pathways [19,20]. For instance, Tai et al. [19] revealed which Chinese traditional medicines exert anti-obesity effects by network pharmacology. Network pharmacology on the basis of metabolomics can identify disease-specific targets and signaling pathways, enabling a systematic research workflow from phenotypic metabolic alterations to molecular mechanisms. It establishes a hierarchical framework of “metabolic phenotype → pathway perturbation → target prediction → mechanistic validation.” For instance, in a study exploring the mechanism for quercetin to treat inflammatory lung injury, metabolomics was used to identify the dysregulated metabolic pathways, network pharmacology was employed to further pinpoint key target genes, and molecular docking was used to validate their binding affinity to quercetin, achieving a multi-layered elucidation of its therapeutic action [21].
There is a bidirectional relationship between lipid metabolism and the gut microbiota. The gut microbiota profoundly regulates lipid metabolism through the “gut–liver axis”. Some specific taxa such as Akkermansia muciniphila enhance the intestinal barrier integrity and glucagon-like peptide-1 (GLP-1) secretion to improve insulin sensitivity [22], whereas an elevated Firmicutes/Bacteroidetes ratio exacerbates lipid accumulation through fermentation of excessive short-chain fatty acids (SCFAs) [23]. Dietary polyphenols can remodel this interaction via “microbiota–host” co-metabolism. For instance, tea polyphenols alleviate high-fat-diet-induced metabolic endotoxemia by enriching Akkermansia muciniphila and upregulating intestinal tight junction protein expression [24]. Similarly, blueberry procyanidins promote the growth of Bacteroides spp., enhance SCFA production, and suppress hepatic de novo lipogenesis via activation of the AMPK pathway [25,26]. Notably, procyanidins can be metabolized by specific gut microbes (such as Clostridium saccharogumia) into phenylpropionic acid derivatives. These metabolites not only directly inhibit hepatic FASN expression but also restructure the microbial community, establishing a positive feedback loop [27]. While multi-omics studies have preliminarily revealed the regulatory networks of procyanidins in obesity-related glucose–lipid metabolism and atherosclerosis, previous research has predominantly relied on single- or dual-omics analyses such as metabolomics–network pharmacology or metabolomics–gut microbiota [14,15,28,29]. There has been no research that integrates metabolomics, network pharmacology, and gut microbiota analysis to dissect the mechanism by which procyanidins, particularly PSPs, synergistically resolve lipid dysregulation.
Therefore, this study employed a high-fat-diet-induced obesity mouse model and combined metabolomics, network pharmacology, and microbiota profiling analysis to decipher the lipid regulatory mechanisms of PSP. Specifically, the study aims to (1) reveal the metabolic pathways modulated by PSP in lipid metabolism disorders by hepatic metabolomics; (2) construct a “PSP–target–obesity” interaction network to identify the core regulatory genes and further validate them by qPCR; and (3) analyze the impact of PSP on obesity-associated gut microbiota composition and function. The findings are expected to provide a theoretical basis for the clinical application of PSP and development of strategies for repurposing agricultural waste into therapeutic agents for metabolic diseases.

2. Materials and Methods

2.1. Materials

2.1.1. Chemicals and Reagents

Procyanidins from peanut skin (PSPs, oligomeric procyanidins ≥ 95%) were provided by Xi’an Fenghe Biotechnology Co., Ltd. (Xi’an, China). Orlistat (purity ≥ 98%, CAS 96829-58-2) and sodium carboxymethyl cellulose (CMC-Na, food-grade, CAS 9004-32-4) were purchased from Shanghai Yuanye Bio-Technology Co., Ltd. (Shanghai, China) and Sinopharm Chemical Reagent Co., Ltd. (Shanghai, China), respectively. Lipid profile assay kits (TC-A111, TG-A110, HDL/LDL-A112/A113) and liver function kits (ALT-C009, AST-C010) were obtained from Nanjing Jiancheng Bioengineering Institute (Nanjing, China). Ammonium formate (≥99.0%) and methyl tert-butyl ether (HPLC-grade) were sourced from Sigma-Aldrich (Shanghai, China) and Tedia (Shanghai, China), respectively.

2.1.2. Instruments and Equipment

The following instruments were used: constant-temperature water bath (HH-4, Guohua Electric Co., Ltd., Wuhan, China), rotary evaporator (RE52-99, Shanghai Yarong Biochemical Instrument Factory, Shanghai, China), circulating water vacuum pump (SHB-IV, Guohua Electric Co., Ltd., Wuhan, China), magnetic stirrer (DF-101S, Wuhan Cole Instrument Co., Ltd., Wuhan, China), autoclave (YXQ-LS-50G, Shanghai Boxun Industrial Co., Ltd., Shanghai, China), full-wavelength microplate reader (Multiskan GO, Thermo Fisher Scientific, Shanghai, China), analytical balance (AL204, Mettler-Toledo Instruments, Guangzhou, China), Hypersil GOLD C18 column (100 × 2.1 mm, 5 µm; Thermo Fisher Scientific, Shanghai, China), UPLC system (UltiMate 3000, Thermo Fisher Scientific, Shanghai, China), high-speed centrifuge (CF1524R, Sartorius, Beijing, China), inverted microscope (Eclipse TS100, Nikon, Shanghai, China), and LC-MS system (AB SCIEX Triple TOF 5600, Shanghai, China; ACQUITY UHPLC, Waters, Shanghai, China).

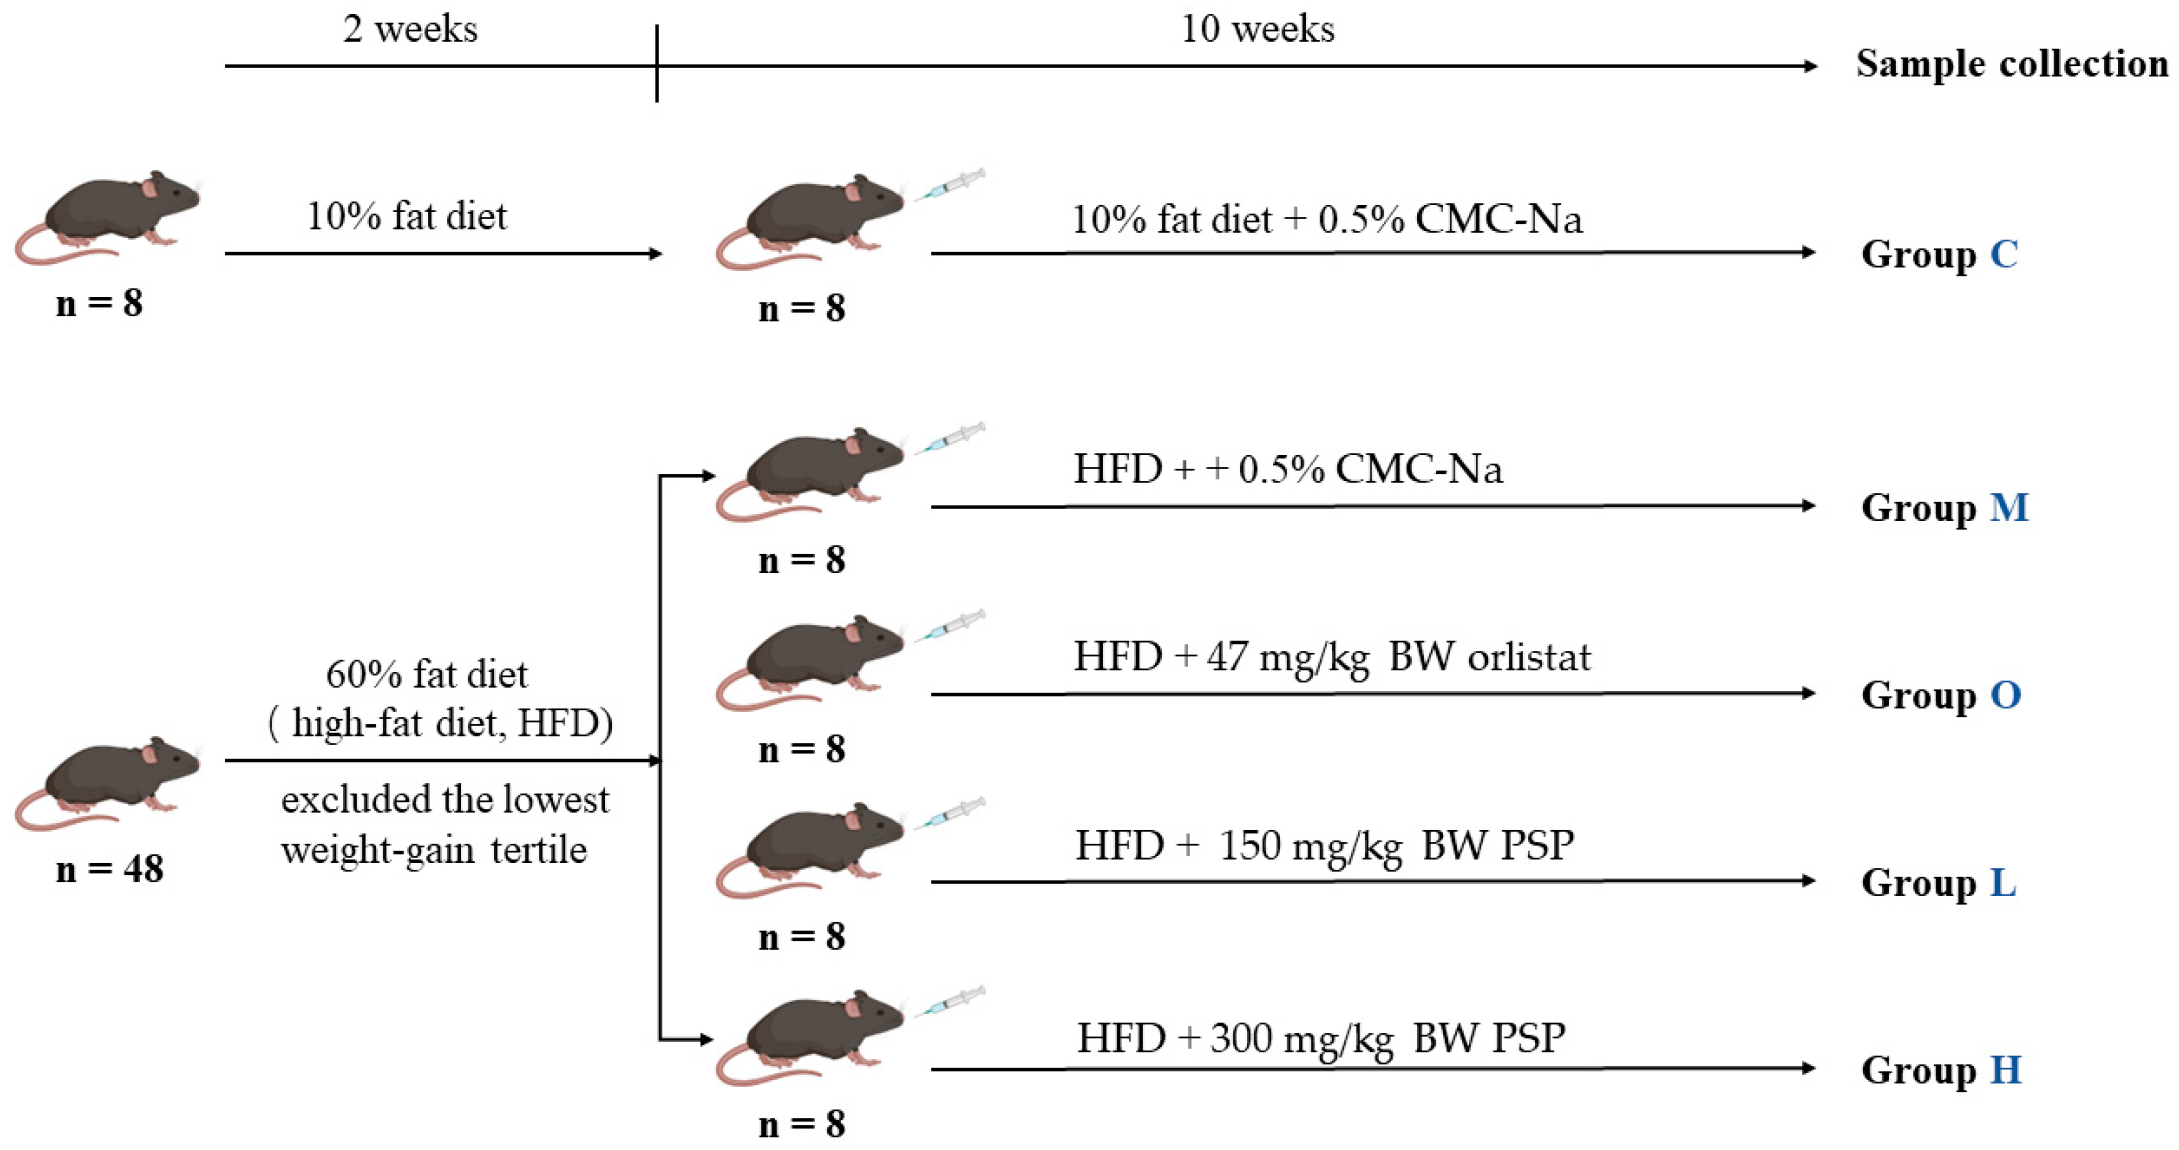
2.2. Animal Experimental Design

Fifty-six SPF-grade male C57BL/6J mice (6 weeks old, 18–20 g) were purchased from Henan Suke Beisi Biotechnology Co., Ltd. (SYXK 2020-0084, Zhengzhou, China). Mice were maintained under controlled environmental conditions (20 ± 2°C, 40–60%, 12 h light/dark cycle) in individually ventilated polycarbonate cages (290 × 178 × 160 mm; four mice/cage). Bedding consisted of high-temperature-sterilized aspen wood shavings (~2 cm depth), replaced every 48 h. Throughout the study, mice had ad libitum access to diet and water. As shown in Figure 1, mice were divided into a low-fat control group (Group C, n = 8) fed with a 10% fat diet (TP23302, Nantong Trophic, Nantong, China) and a high-fat diet (HFD) group (n = 48) fed with a 60% fat diet (TP23300, Nantong Trophic). After two weeks of HFD feeding, the lowest weight-gain tertile was excluded. The remaining 32 mice were randomly divided into four groups (n = 8/group), including the HFD model (Group M), high-dose PSP (Group H, 300 mg/kg BW), low-dose PSP (Group L, 150 mg/kg BW), and orlistat (Group O, 47 mg/kg BW). All test substances were suspended in 0.5% (w/v) CMC-Na solution and administered daily via oral gavage for 10 weeks [14,15,30,31]. The body weight and energy intake were recorded weekly. All procedures were approved by the Laboratory Animal Centre of Huazhong Agricultural University (HZAUMO-2024-0087).

2.3. Biochemical Analysis

Following retro-orbital blood collection, blood samples were centrifuged at 3000× g for 10 min at 4 °C to collect the serum. The serum levels of TC, TG, HDL-C, LDL-C, ALT, and AST were measured using commercial assay kits according to the manufacturer’s protocols.
For histological analysis, liver tissues fixed in 4% paraformaldehyde were dehydrated in graded ethanol, embedded in paraffin, and sectioned into 4 µm thick slices. Sections were deparaffinized, rehydrated, and stained with hematoxylin and eosin (H&E) for morphological evaluation. Additionally, fixed liver tissues were embedded in optimal cutting temperature compound, rapidly frozen, sectioned at an 8 µm thickness, and stained with Oil Red O after isopropanol incubation. Finally, observation and photography were performed under a 200× optical microscope.

2.4. Hepatic Metabolomics Analysis

2.4.1. Sample Preparation

Following the description of Wen [32], the liver tissue (40 mg) was homogenized in 800 µL of ultrapure water. Methanol (600 µL) and methyl tert-butyl ether (2000 µL) were added, vortexed for 1 min, and centrifuged (2400× g, 15 min). The upper phase was lyophilized and reconstituted in 200 µL of methanol/dichloromethane (50:50, v/v) containing 5 mM ammonium acetate for lipidomics. The lower phase was stored at −20 °C overnight and centrifuged (3000× g, 10 min), and the supernatant was collected for metabolomics. Pooled quality control (QC) samples (10 µL aliquots per individual sample) and solvent-processed blanks accompanied each analysis batch.

2.4.2. Lipidomics

Following the description of Wen [32], chromatographic separation was performed using a Hypersil GOLD C18 column with mobile phases: (A) 0.1% formic acid and 5 mM ammonium formate in acetonitrile/water (3:2, v/v); and (B) 0.1% formic acid and 5 mM ammonium formate in isopropanol/acetonitrile (9:1, v/v). The gradient elution was 80% A (0–0.5 min), 60% A (1 min), 40% A (3 min), 2% A (16 min), and 80% A (17–20 min). The flow rate was 0.3 mL/min, and the injection volume was 5 µL. For both lipidomics and metabolomics, the conditions were set as follows. The column temperature was maintained at 40 °C; the autosampler temperature was set at 5 °C; samples were analyzed in a randomized injection order within each experimental group, with a single injection per sample; one QC sample and one blank sample were injected after every eight experimental sample injections; and mass spectrometry was performed using electrospray ionization (ESI) in both positive and negative ion modes, with an m/z scan range of 100–1500.

2.4.3. Metabolomics

Following the conditions described by Wen [32], the positive ion mode was mobile phase A (0.1% formic acid in water) and B (acetonitrile). The negative ion mode was A (5 mM ammonium acetate in water) and B (acetonitrile). The gradient was 95% A (0–1.5 min), 75% A (2.5 min), 50% A (5 min), 30% A (8 min), 20% A (10 min), 5% A (13–17 min), and 95% A (18–20 min). The flow rate was 0.3 mL/min, and the injection volume was 2 µL.

2.4.4. Data Processing

Raw UPLC-Q-TOF-MS data were processed using Progenesis QI (Waters, Milford, MA, USA) for peak alignment, deconvolution, and log transformation. Metabolite identification required meeting the following criteria: exact mass error < 5 ppm, MS/MS spectral matches to HMDB (https://hmdb.ca/) and LIPID MAPS (https://lipidmaps.org/) databases, and intensity CV < 30%. Multivariate analysis and pathway mapping were performed on MetaboAnalyst 5.0 (https://www.metaboanalyst.ca/). Differential metabolites were screened via oPLS-DA with VIP >1, ANOVA p < 0.05, and fold change (FC) >1.5 or <0.67.

2.5. Network Pharmacology Analysis

The potential bioactive components of PSP were identified by Zhao et al. [33] and Chen [30]. Targets were predicted using TCMSP (https://www.tcmsp-e.com/), SwissTargetPrediction (http://swisstargetprediction.ch/), and PharmMapper (https://lilab-ecust.cn/pharmmapper/, accessed on 27 May 2025). Disease targets (“obesity”, “overweight”) were retrieved from GeneCards (https://www.genecards.org/), DisGeNET (https://disgenet.com/), and OMIM (https://www.omim.org/). Venn (https://jvenn.toulouse.inra.fr/app/example.html, accessed on 27 May 2025) analysis was used to identify the shared targets, and STRING/Cytoscape 3.6.0 was used to construct the interaction networks. KEGG and GO enrichment analyses were performed via DAVID (https://davidbioinformatics.nih.gov/tools.jsp, accessed on 27 May 2025).

2.6. Integrated Analysis of Metabolomics and Network Pharmacology

Following the conditions described by Sun et al. [21], a compound–reaction–enzyme–gene (CREG) network was built using MetScape (Cytoscape 3.6.0). The overlapping targets from network pharmacology and metabolomics were validated by qPCR.

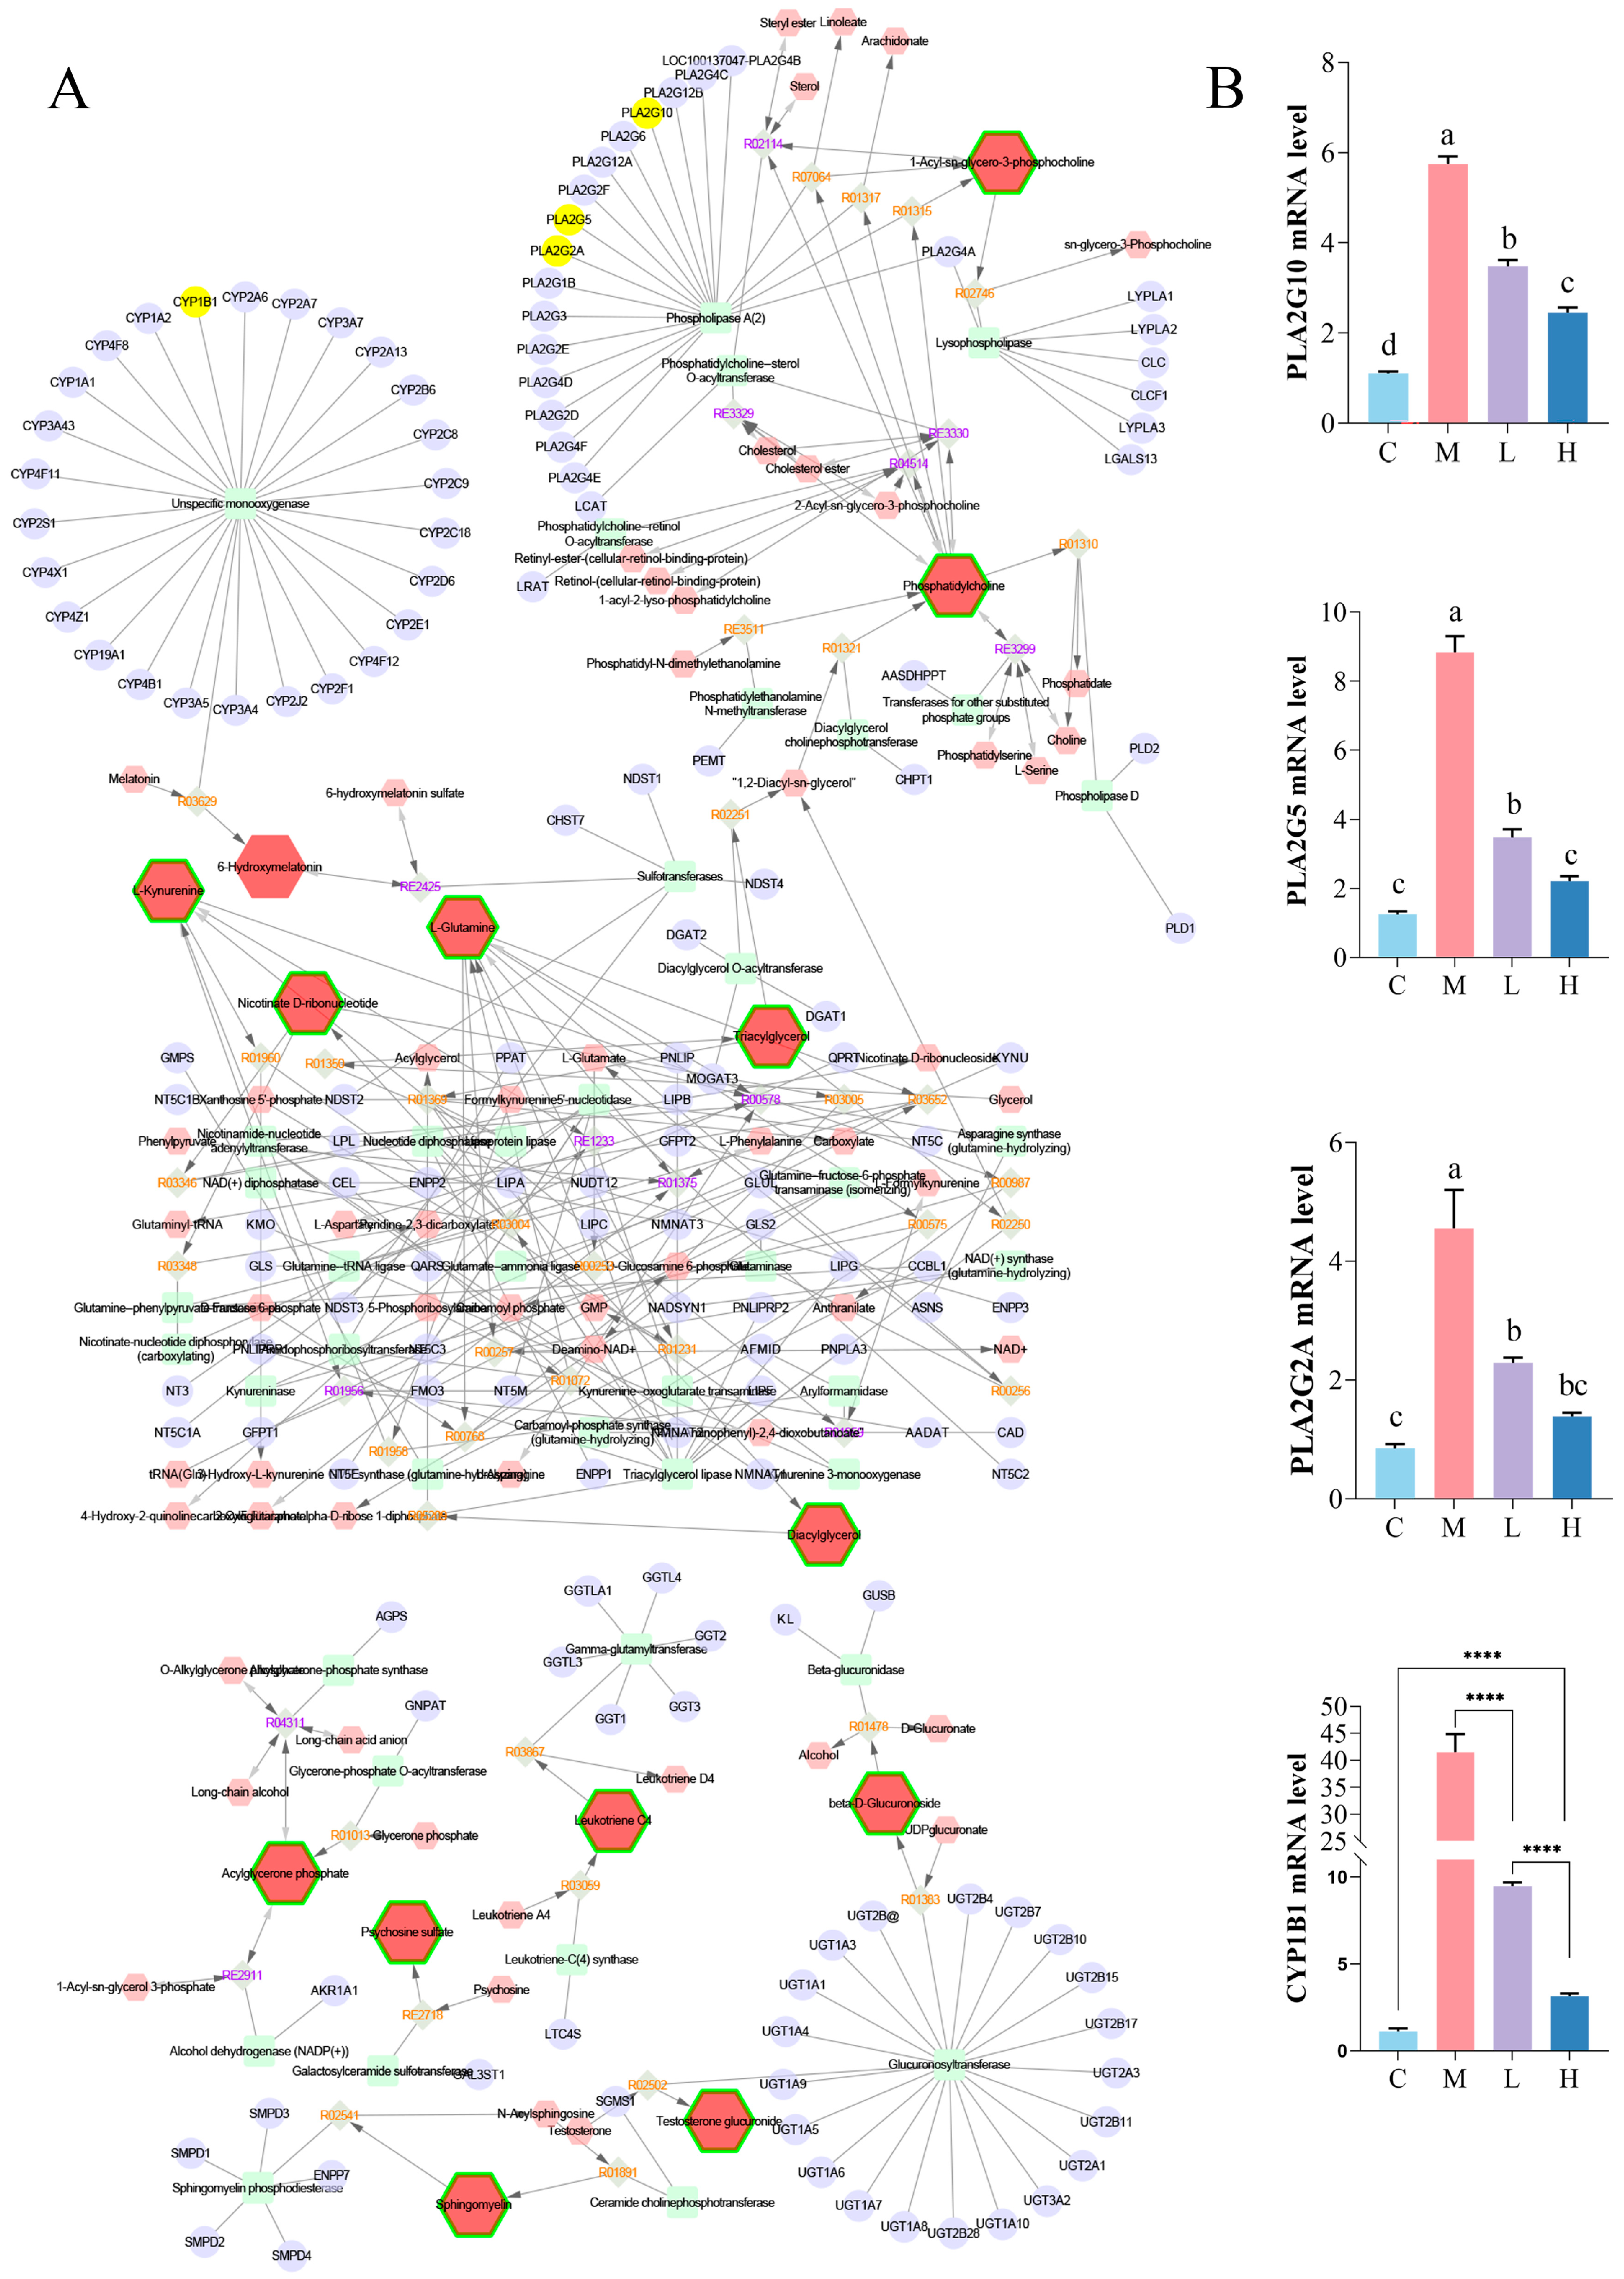
2.7. Quantitative Real-Time PCR

RNA-specific primers were designed using PrimerBank (https://pga.mgh.harvard.edu/primerbank/, accessed on 27 May 2025) with the following parameters: melting temperature (Tm) = 60 ± 3 °C, GC content = 40–60%, amplicon length = 80–150 bp, and primer length = 15–25 nt. All primer pairs were designed to span exon–exon junctions to eliminate genomic DNA amplification. The primers were rigorously validated against the reference genome using the Basic Local Alignment Search Tool (BLAST) to minimize off-target amplification risks. Validated primer sequences (Table A2) were chemically synthesized and purified via polyacrylamide gel electrophoresis (PAGE) by Tsingke Biotechnology Co., Ltd. (Beijing, China). RNA extraction, reverse transcription, and qPCR were performed using AFTSpin, ABScript III, and SYBR Green kits, respectively.

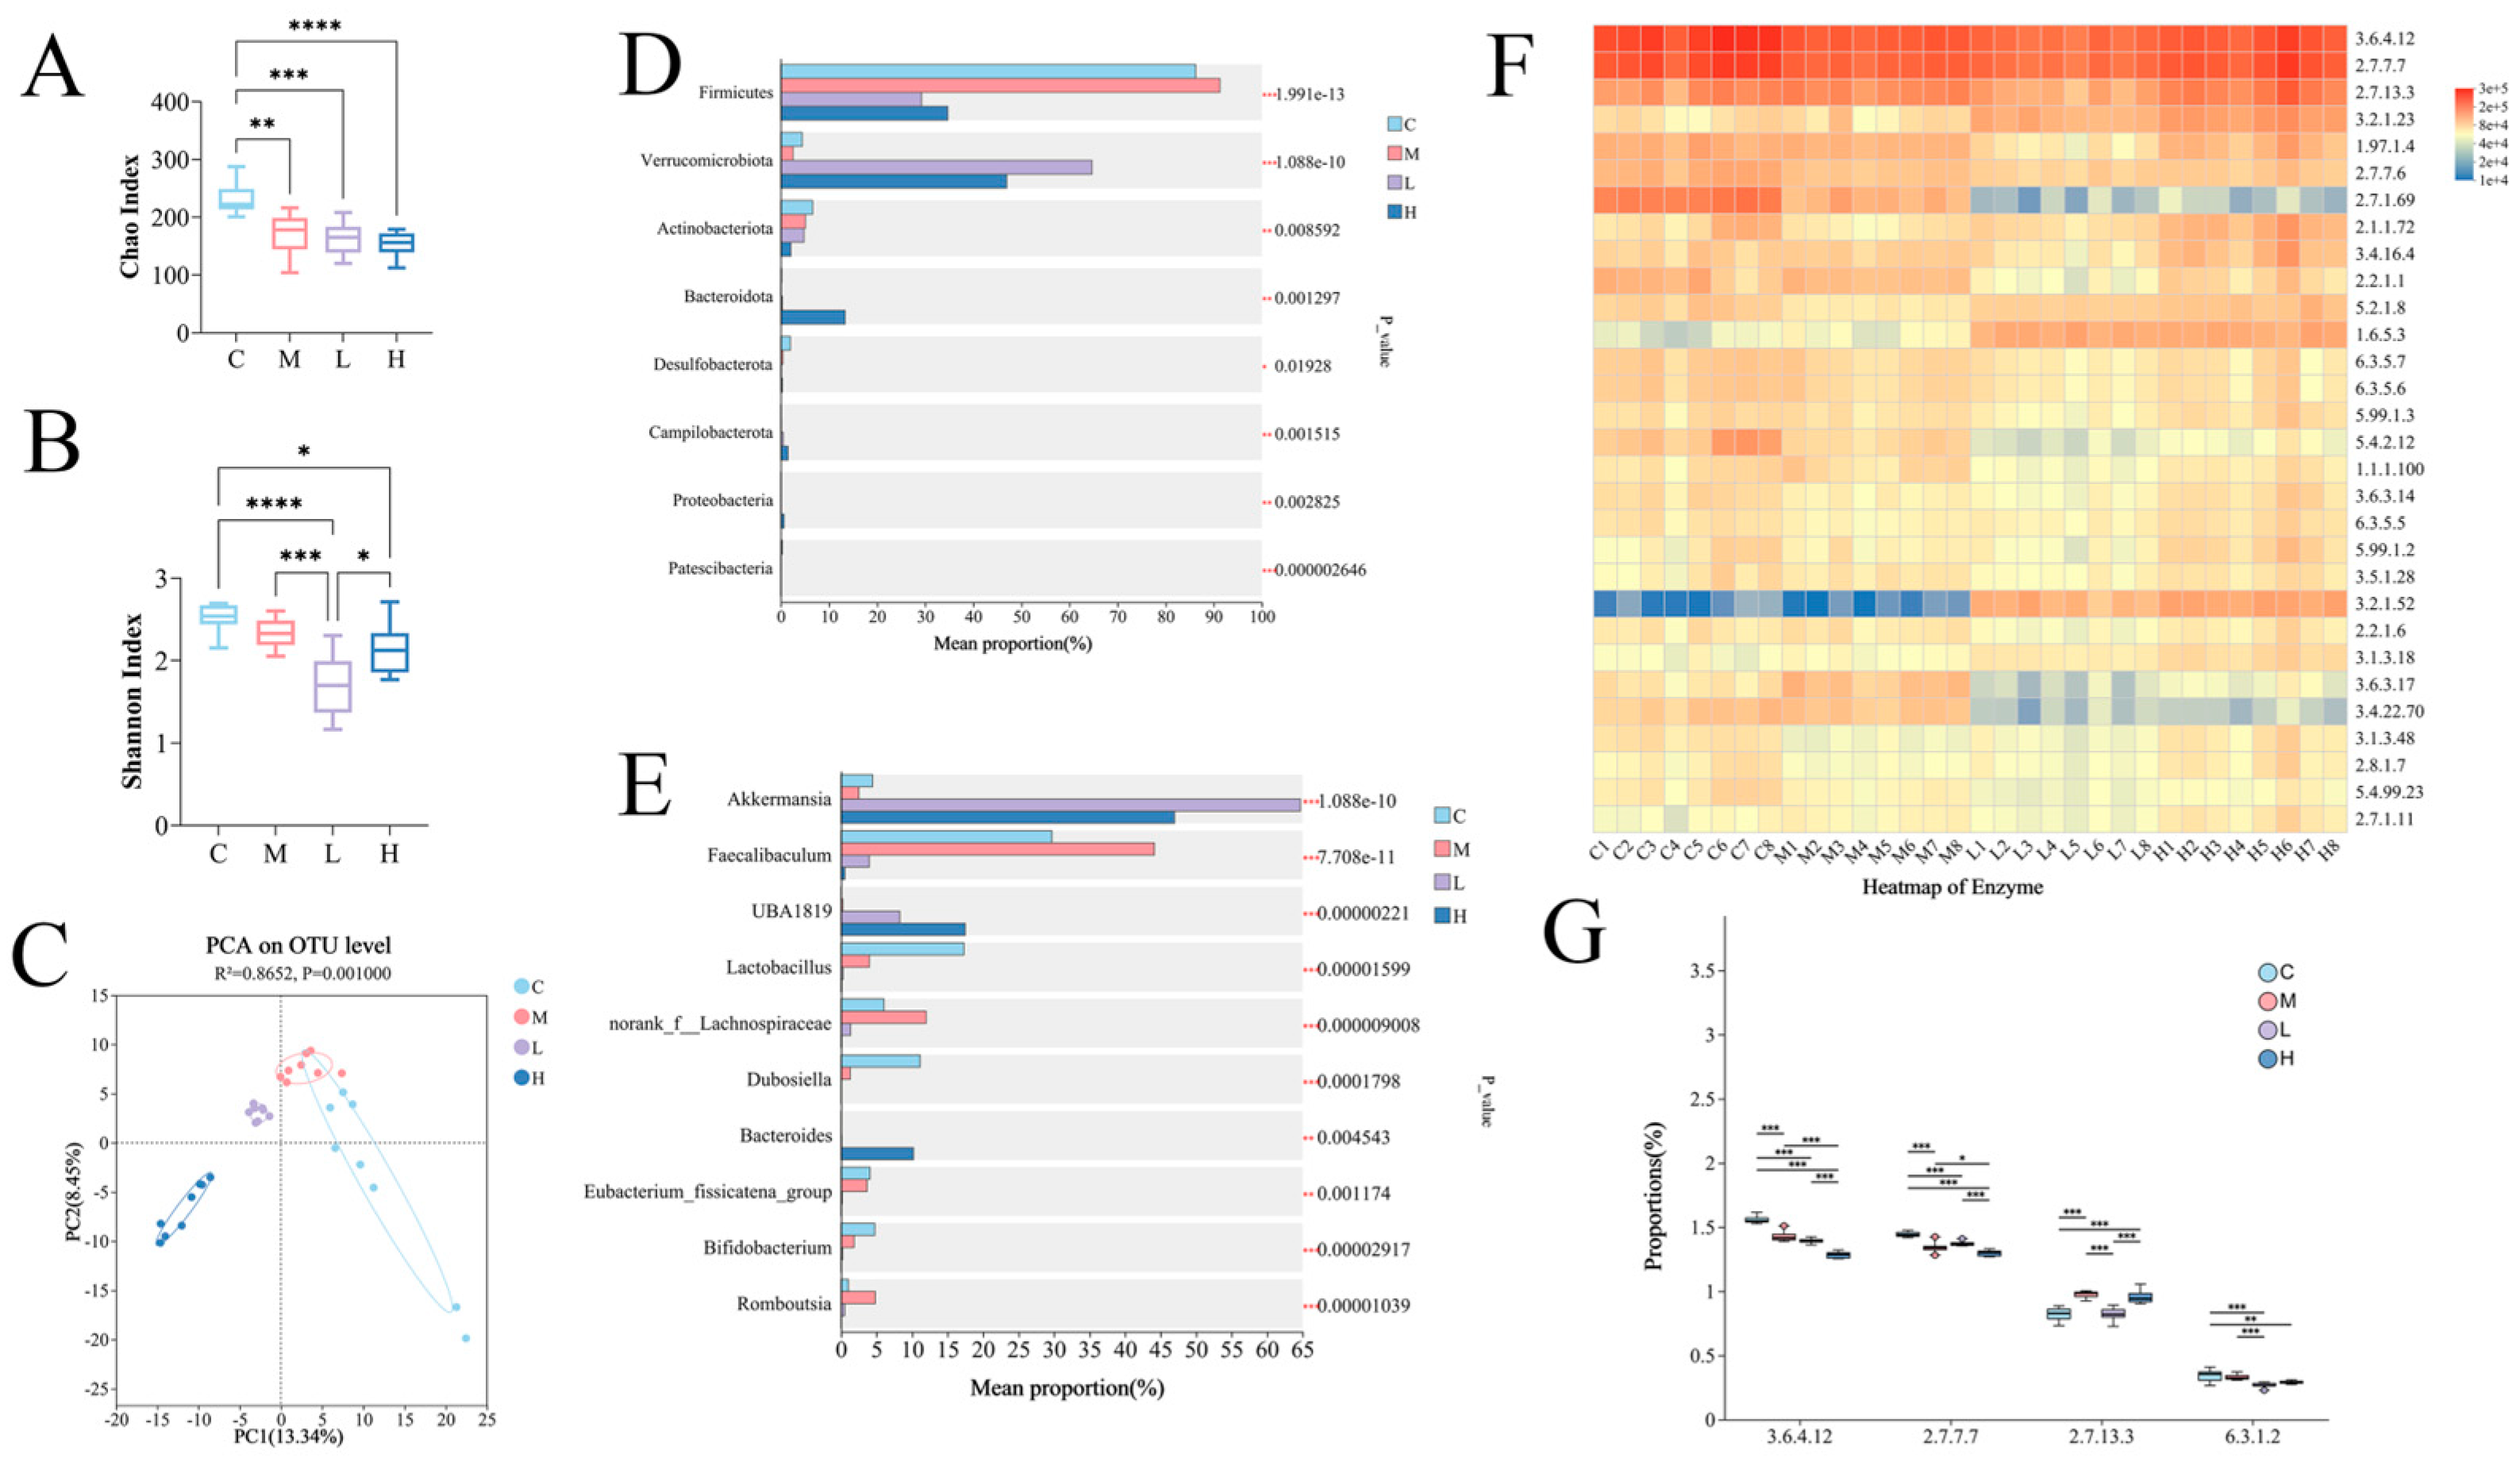
2.8. Gut Microbiota Analysis

The cecum contents were aseptically collected from mice, immediately frozen in liquid nitrogen, and stored at −80 °C. Following the extraction of genomic DNA from the cecal contents, the DNA was analyzed by agarose gel electrophoresis. PCR amplification was performed using primers 338F (5′-ACTCCTACGGGAGGCAGCAG-3′) and 806R (5′-GGACTACHVGGGTWTCTAAT-3′), along with TransGen AP221-02 reagents, TransStart Fastpfu DNA Polymerase, and an ABI GeneAmp® 9700 PCR system (Shanghai, China). The PCR products were subsequently analyzed by agarose gel electrophoresis. Target DNA fragments were excised and purified using an AxyPrep DNA Gel Extraction Kit (Axygen Biosciences, Shanghai, China), followed by elution with Tris-HCl buffer. The purified products were re-examined via 2% agarose gel electrophoresis. Based on preliminary electrophoretic quantification, PCR products were quantified using the QuantiFluor™-ST Blue Fluorescence Quantification System (Promega, Beijing, China). Subsequently, the products were pooled in appropriate ratios according to sequencing requirements. Libraries were constructed using a TruSeq™ DNA Sample Prep Kit (Shanghai, China) and subjected to sequencing. Paired-end (PE) reads obtained from sequencing were first assembled based on the overlapping regions, followed by quality control, filtering, and demultiplexing by sample. Operational taxonomic unit (OTU) clustering and taxonomic analyses were performed. All experimental procedures, including DNA extraction and sequencing, were conducted by Majorbio Bio-pharm Technology Co., Ltd. (Shanghai, China). For further statistical and visualization analyses, the obtained data were processed using the Majorbio Cloud Platform (https://cloud.majorbio.com).

2.9. Statistical Analysis

Data were expressed as mean ± SEM. ANOVA and Tukey’s test (GraphPad Prism 9.0) were used for group comparisons (p < 0.05). Network enrichment employed hypergeometric testing with FDR correction.

3. Results

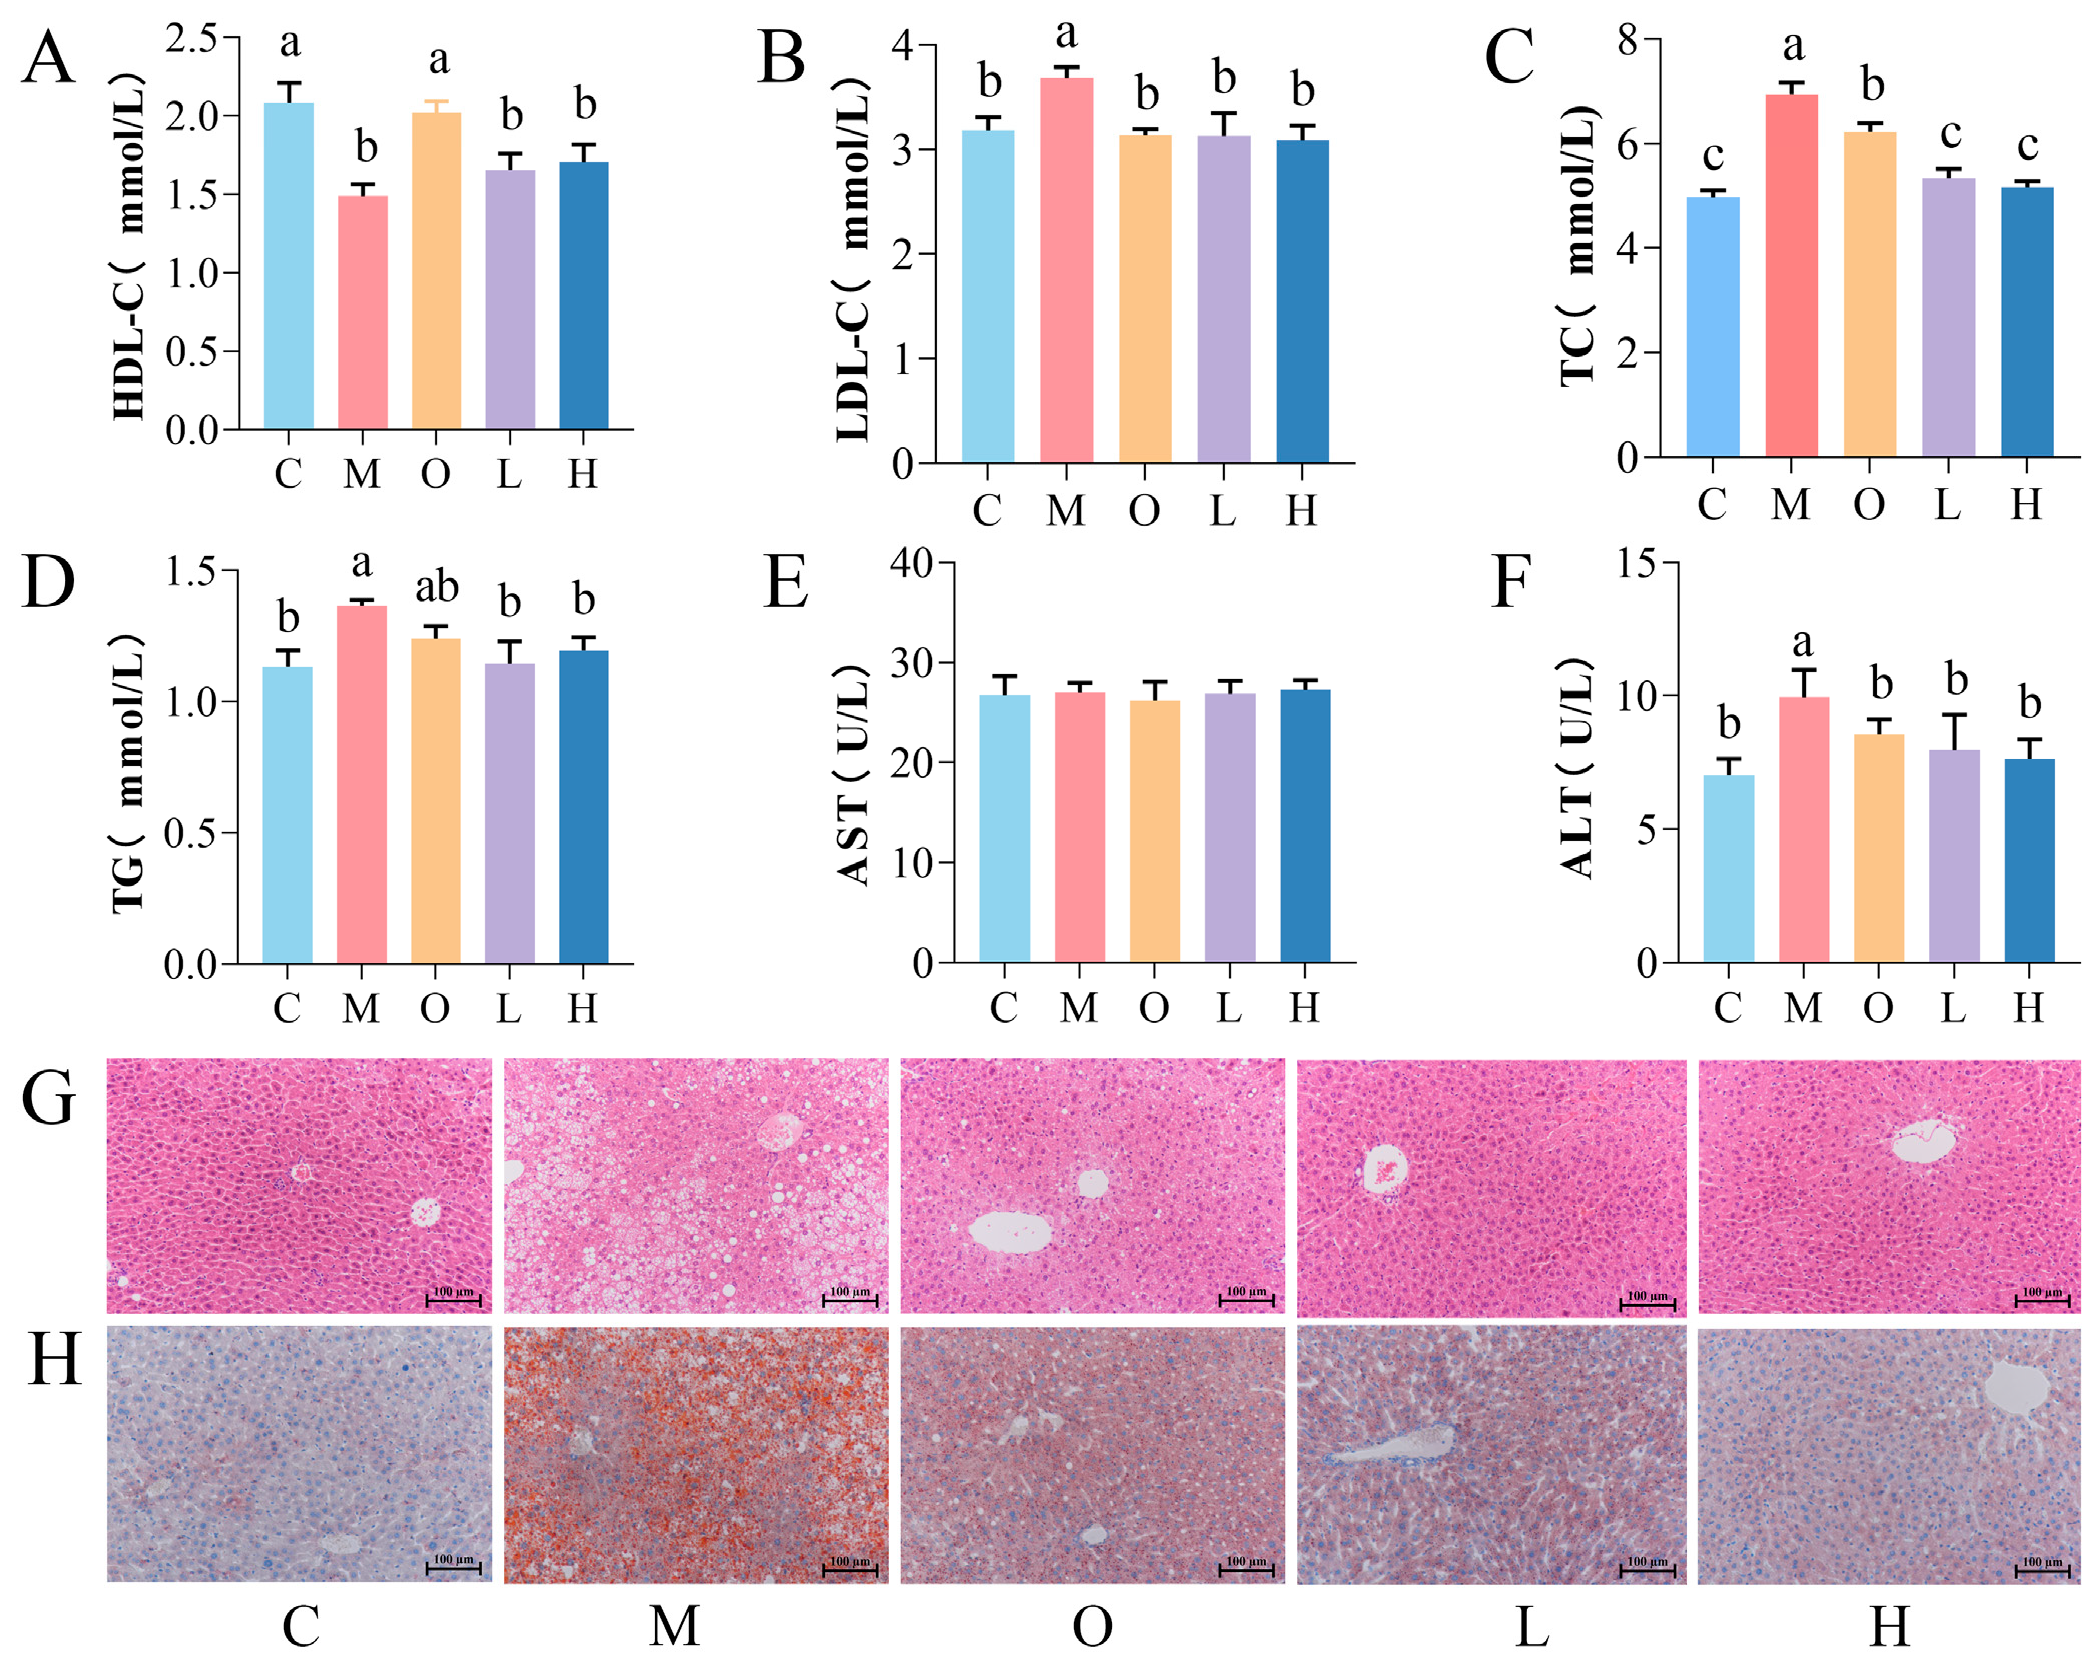
3.1. Effects of PSP on Body Weight, Lipid Profile, and Liver Function

As shown in Table 1, mice in Group M exhibited rapid weight gain, whereas PSP and orlistat intervention significantly attenuated the HFD-induced weight gain (p < 0.05). After 12 weeks, Group O mice showed significantly lower body weight than Group M mice (p < 0.05) while showing a comparable body weight to Group C, despite their higher energy intake than Group M and C (p < 0.05). Both Group L and H displayed significantly lower body weight than Group M (p < 0.05), and their energy intake was similar to that of Group M but higher than that of Group C (p < 0.05).
Serum analysis revealed that Group M had significantly lower HDL-C and higher LDL-C, TG, and TC levels compared with Group C (p < 0.05; Figure 2A–D). PSP intervention (Group L and H) restored the LDL-C, TG, and TC to normal levels comparable to those of Group C (p > 0.05; Figure 2A–D), indicating the efficacy of PSP in ameliorating HFD-induced dyslipidemia.
While AST activity showed no significant differences among groups (Figure 2E), Group M showed higher ALT activity than Group C (p < 0.05), which was reversed by PSP intervention (Group L and H; Figure 2F). Histopathological analysis via H&E staining revealed a phenomenon of vacuolation and loose organization of hepatic architecture in Group M, whereas PSP and orlistat intervention restored the tissue integrity (Figure 2G). Oil Red O staining further confirmed reduced lipid droplet accumulation in the PSP-treated groups (Figure 2H), demonstrating the protective effects of PSP against HFD-induced hepatic steatosis.

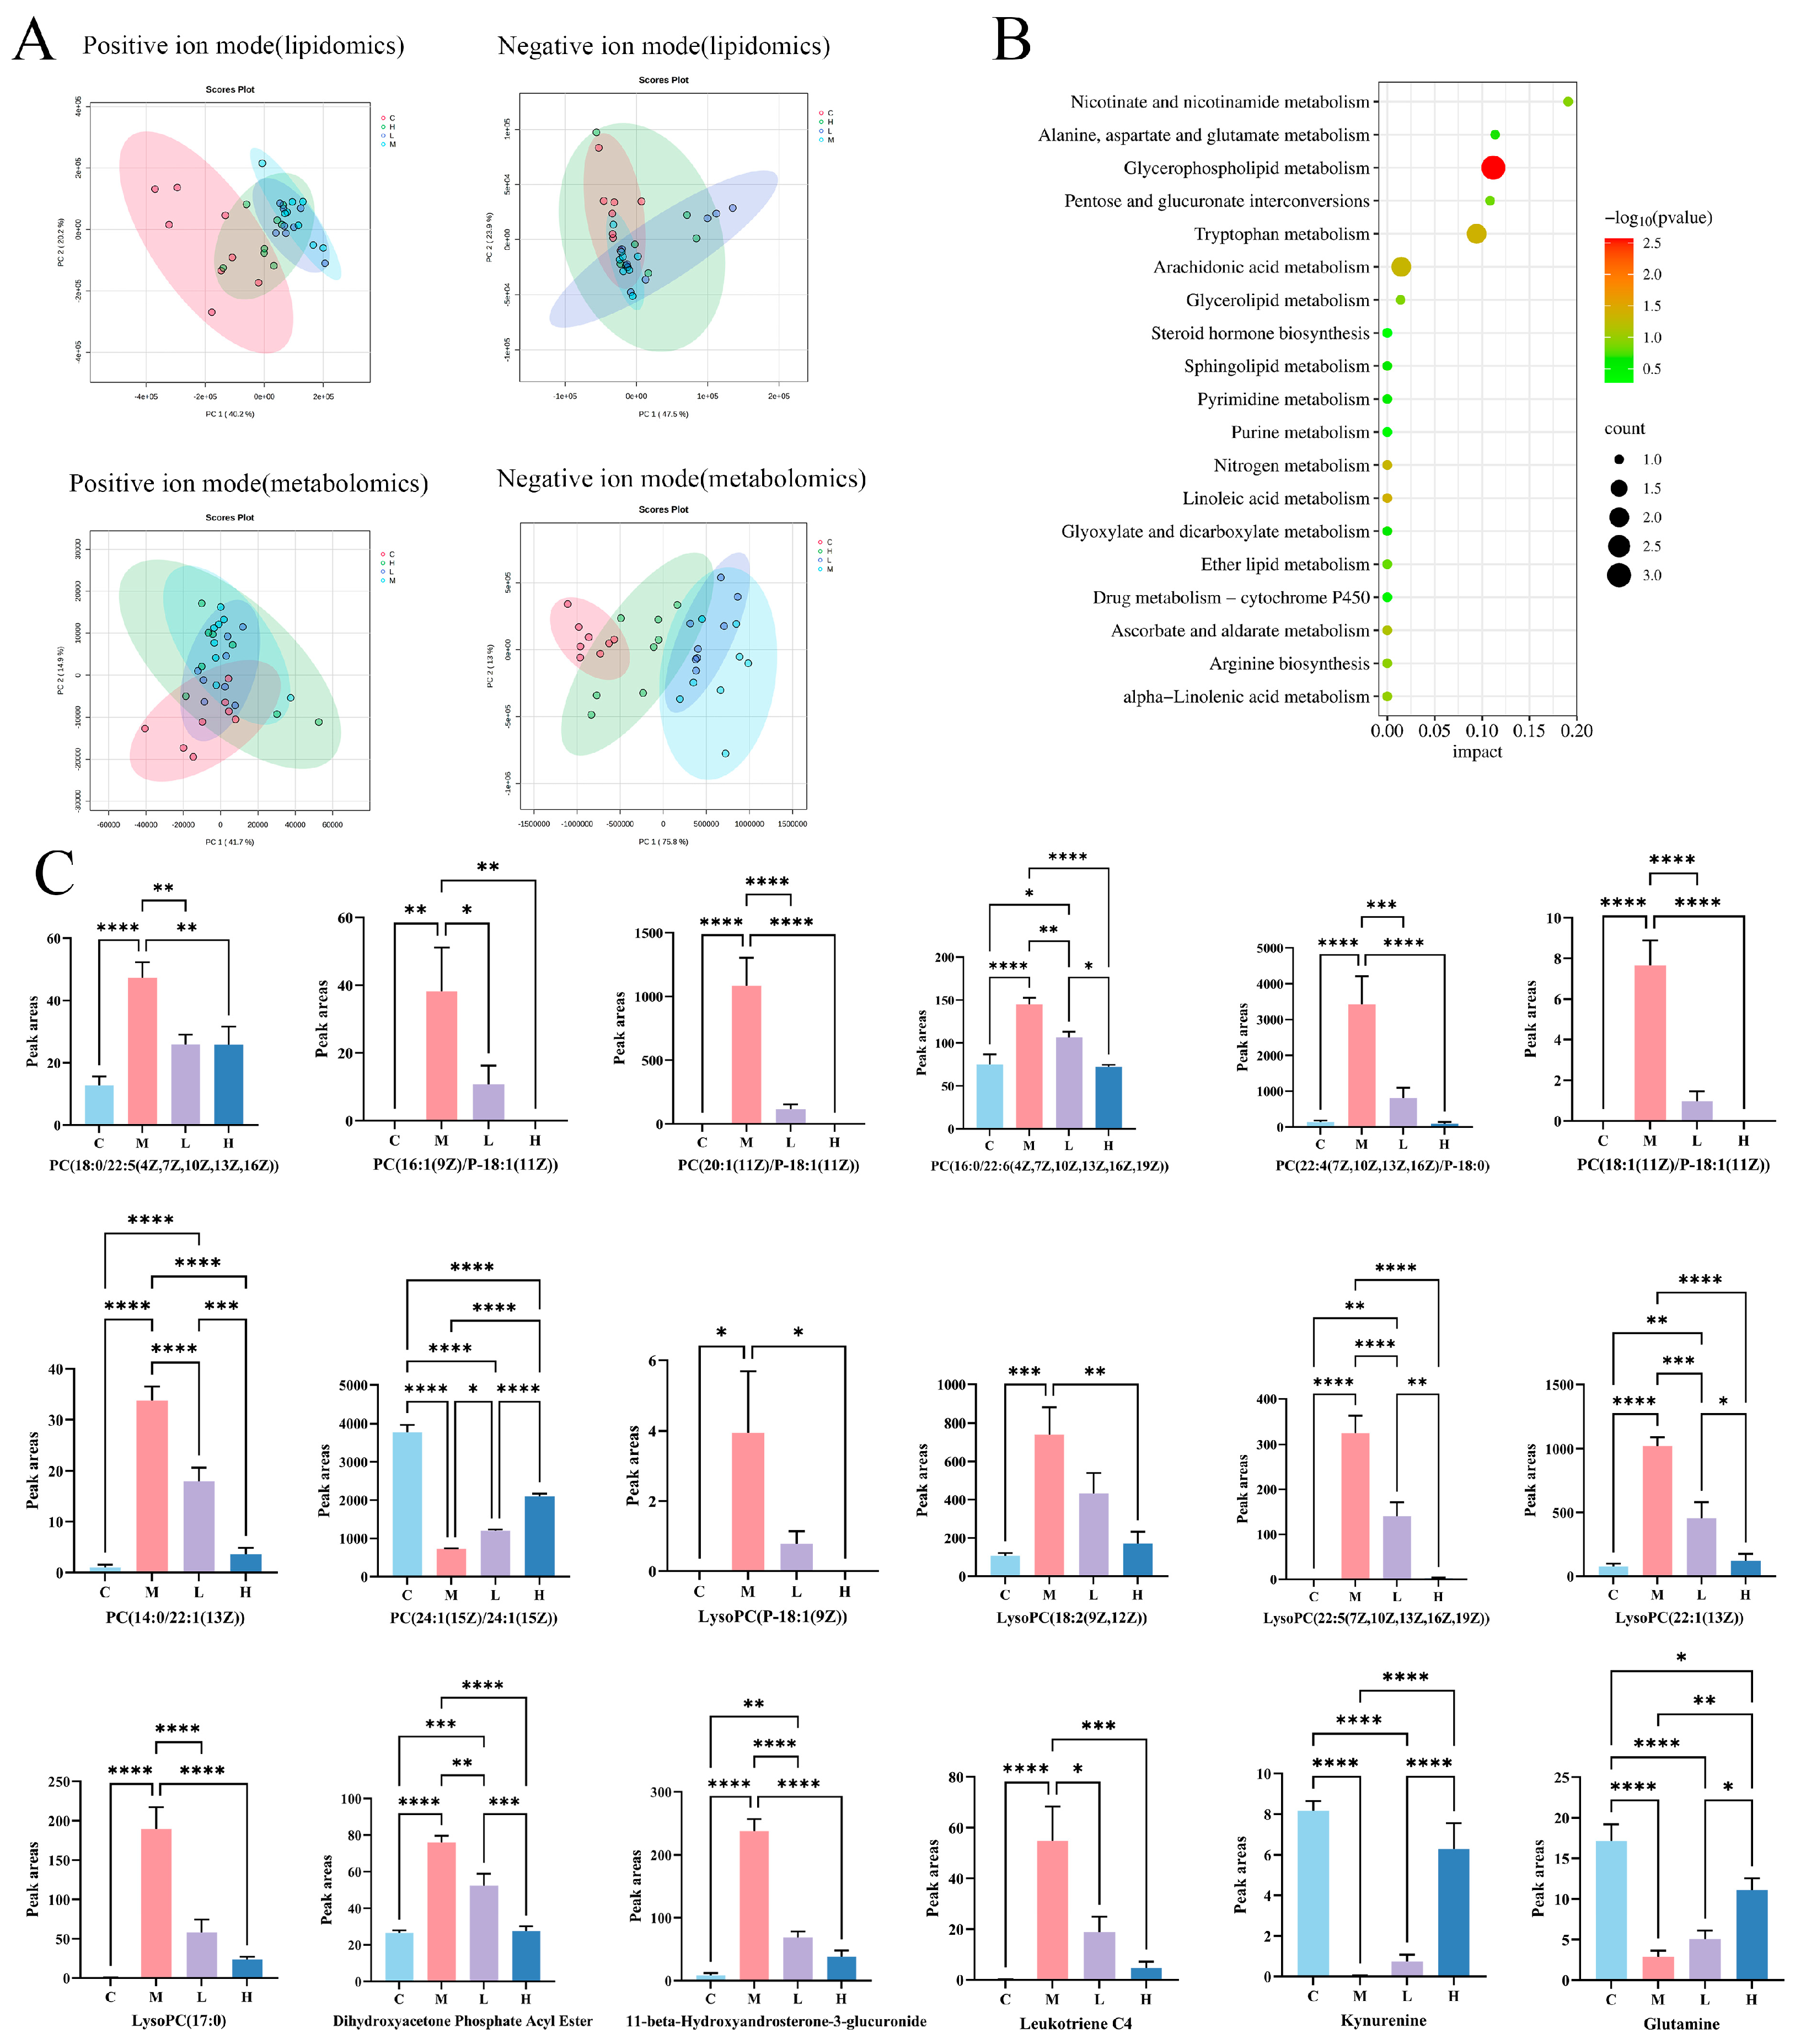
3.2. Hepatic Metabolomics Analysis

PCA showed a clear separation between Group C and M, reflecting that HFD induced metabolic perturbations in the mice (Figure 3A). PSP intervention partially reversed these perturbations. A total of 61 differential metabolites were identified (Table A3). Pathway analysis highlighted five key pathways, including glycerophospholipid, linoleic acid, tryptophan, nitrogen, and arachidonic acid metabolism (Figure 3B). The associated metabolites included phosphatidylcholine, 1-acyl-sn-glycero-3-phosphocholine, dihydroxyacetone phosphate acyl ester, leukotriene C4, kynurenine, and glutamine. In contrast to its effects on PC(24:1(15Z)/24:1(15Z)), kynurenine, and glutamine, PSP intervention significantly attenuated the HFD-induced increases in other metabolites (Figure 3C).

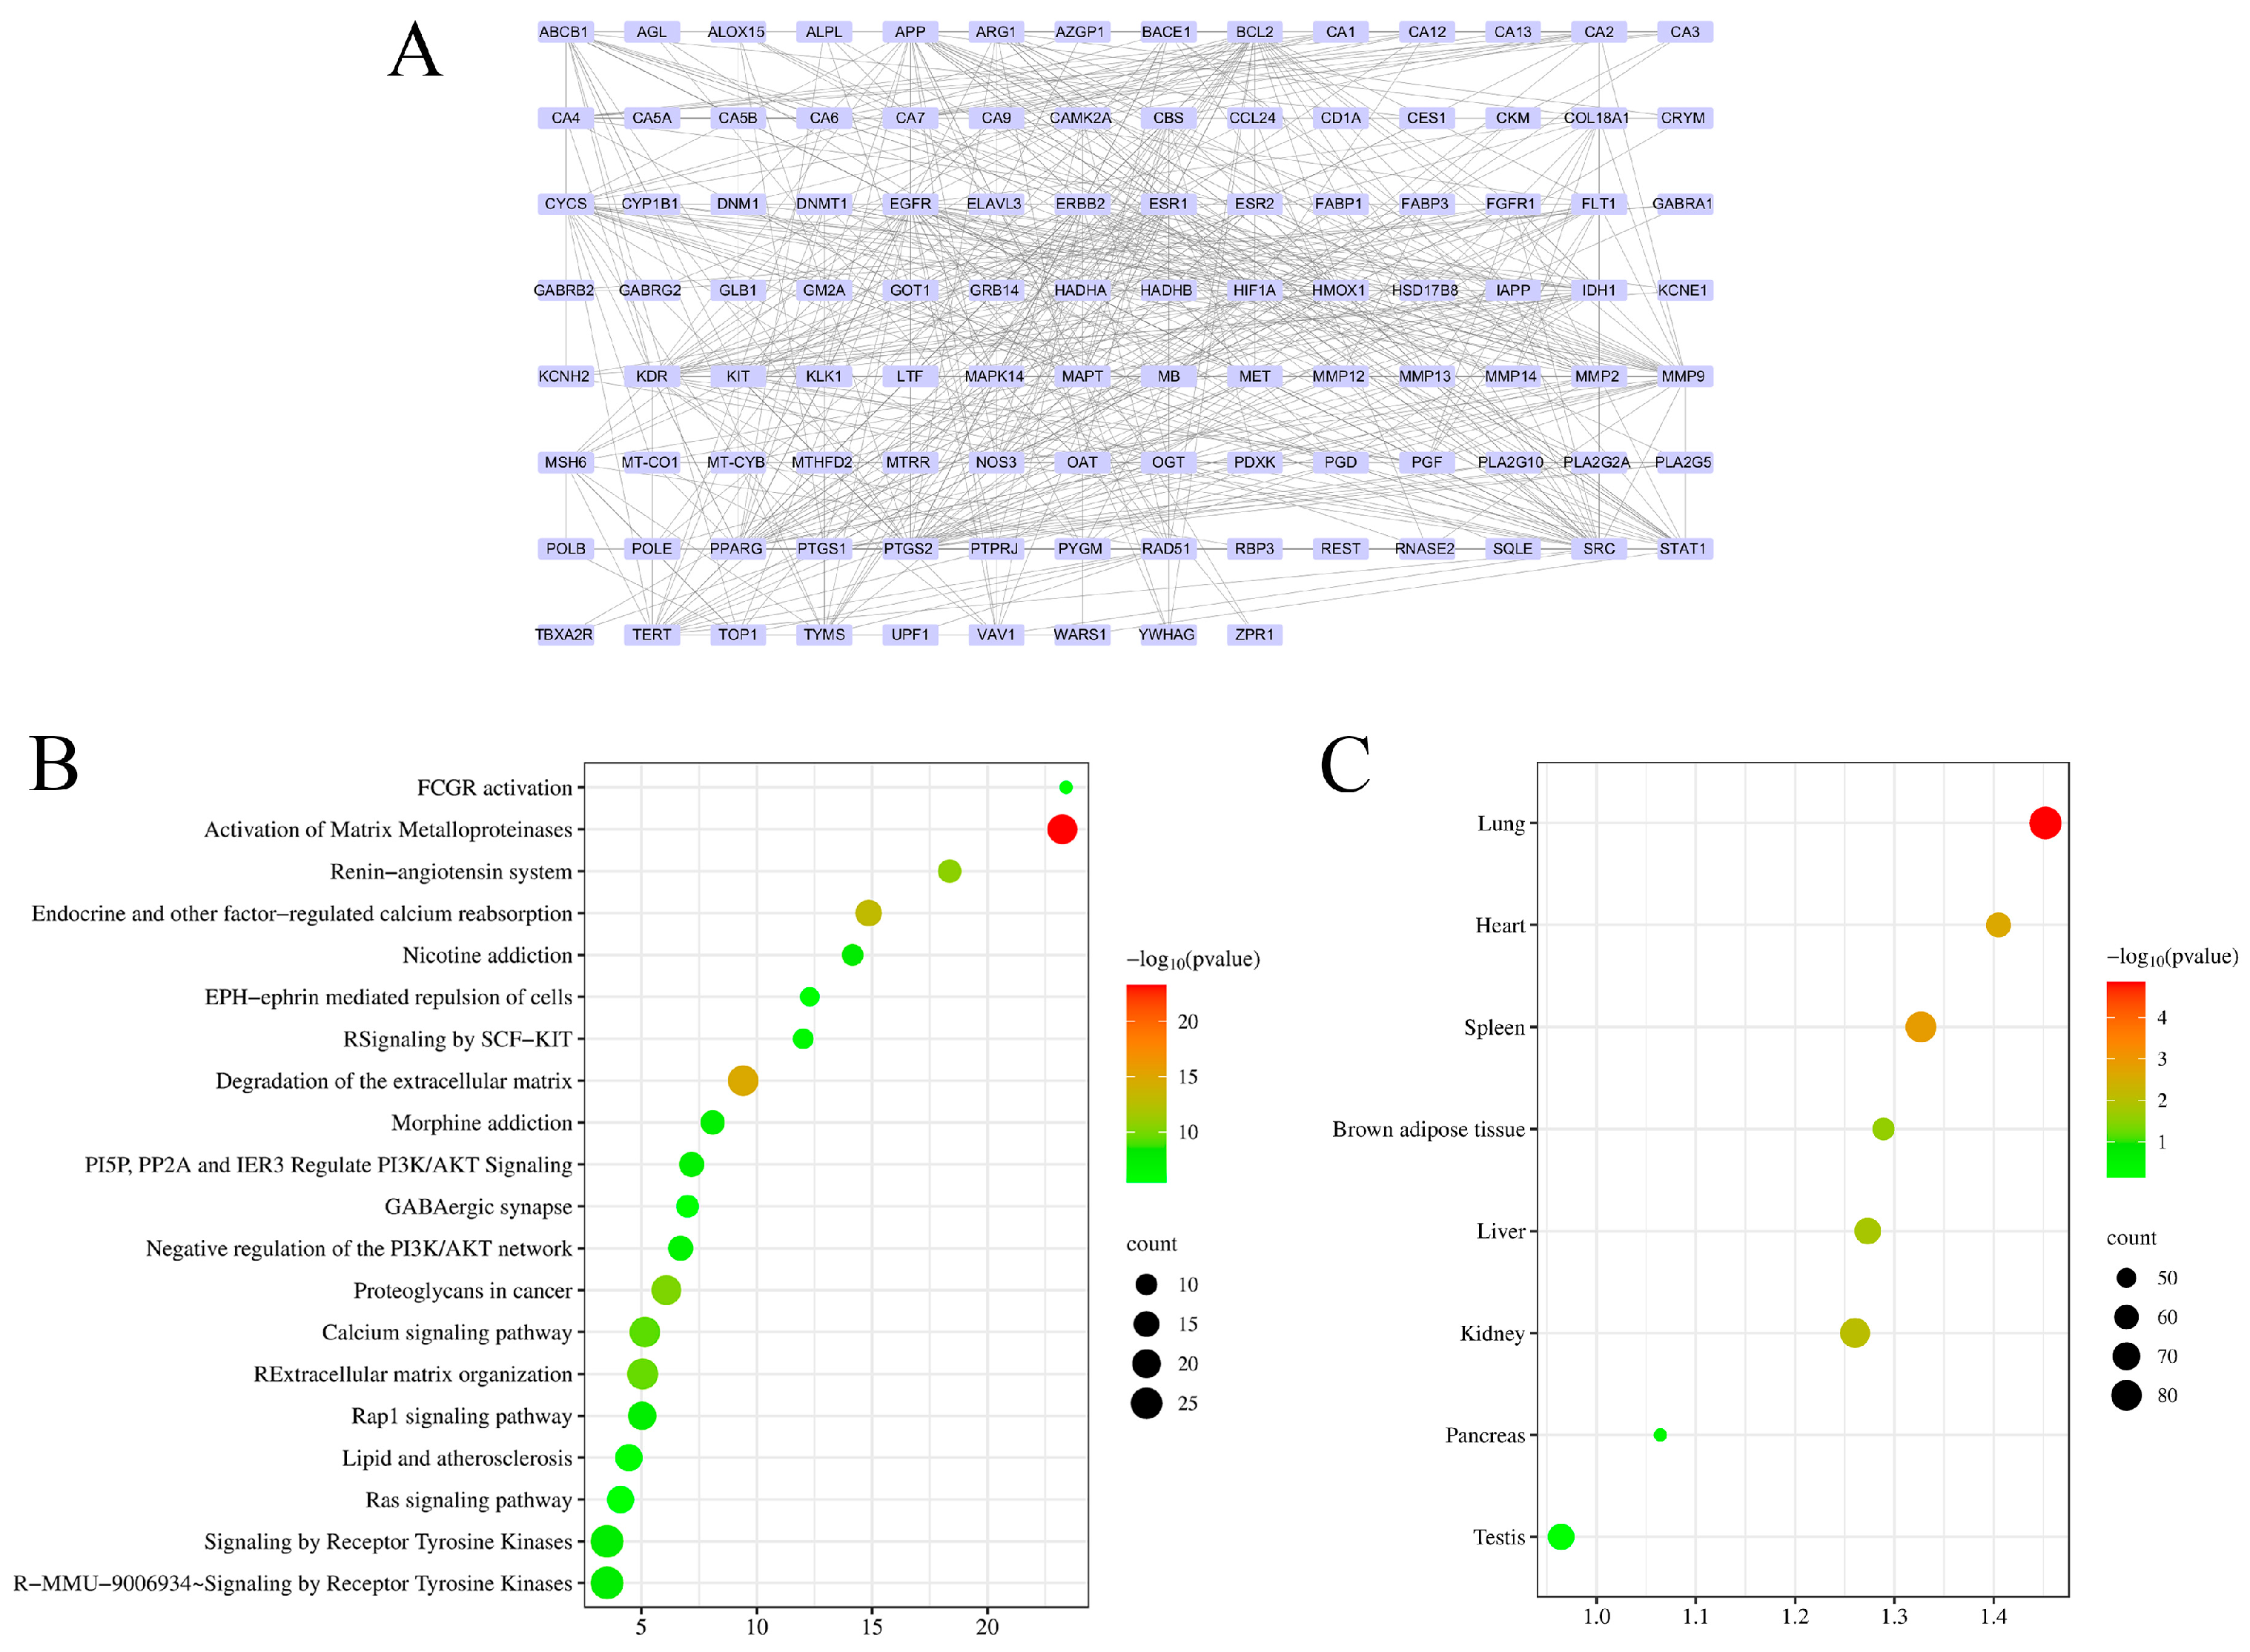
3.3. Network Pharmacology Analysis

An integrative analysis of PSP-derived bioactive compounds and obesity-related targets identified 114 key genes (Table A4). STRING and Cytoscape analyses revealed a gene interaction network (Figure 4A), with KEGG enrichment highlighting the activation of matrix metalloproteinases (Figure 4B). Tissue-specific expression analysis indicated that these genes were predominantly related to liver and brown adipose tissue (Figure 4C).

3.4. Integrated Analysis of Metabolomics– and Network Pharmacology

A compound–reaction–enzyme–gene (CREG) network (Figure 5A) was constructed by integrating the 61 differential metabolites and network pharmacology-predicted targets. Intersection analysis identified Pla2g10, Pla2g5, Pla2g2a, and Cyp1b1 as the four core targets. qPCR confirmed that PSP suppressed the HFD-induced upregulation of these genes (Figure 5B), which validated the results of the integrated metabolomics and network pharmacology analyses.

3.5. Effect of PSP on Gut Microbiota Composition

HFD significantly decreased the Chao and Shannon indices (p < 0.05 vs. Group C; Figure 6A,B), indicating that it diminishes microbial richness and diversity. PSP failed to restore α-diversity but altered β-diversity (Figure 6C). In addition, PSP intervention significantly altered gut microbiota composition by increasing the relative abundance of Akkermansia within Verrucomicrobia while reducing that of Faecalibaculum, norank_f__Lachnospiraceae, and Romboutsia within Firmicutes. High-dose PSP resulted in a significant enrichment of Bacteroides within Bacteroidota (Figure 6D,E). Functional prediction via PICRUSt2 revealed that the enzyme activity profile was predominated by DNA helicase (EC 3.6.4.12), DNA polymerase (EC 2.7.7.7), and histidine kinase (EC 2.7.13.3) (Figure 6F). Metabolomics analysis revealed that glutamine synthetase (EC 6.3.1.2) was a pivotal enzyme driving the metabolic divergence between Group M and the PSP-treated groups, and thus, it is necessary to further investigate the effect of PSP on this enzyme (Figure 6F). PSP altered the proportions of these enzymes (p < 0.05) (Figure 6G).

4. Discussion

Although previous studies have revealed the regulatory networks of procyanidins on lipid metabolism through multi-omics approaches, there has been a lack of in-depth research on PSP. Previous studies have been predominantly focused on single or dual omics analyses (such as metabolomics–network pharmacology, metabolomics–gut microbiota) [14,15,28,29], failing to systematically elucidate the integrative mechanism by which procyanidins, particularly PSP, ameliorate lipid dysregulation by integrating metabolomics, network pharmacology, and gut microbiota analysis. In this study, we integrated these approaches to systematically uncover the molecular network through which PSP alleviates lipid metabolism disorders. The results not only validated its therapeutic potential but also provided novel insights into the synergistic regulation of gut microbiota and metabolic pathways.
Metabolomic analysis revealed that PSP significantly modulates hepatic lipid dynamics via affecting the glycerophospholipid, linoleic acid, tryptophan, nitrogen, and arachidonic acid metabolism. Pharmacology screening indicated that PSP targets PLA2G10, PLA2G5, PLA2G2A, and CYP1B1 to regulate glycerophospholipid, linoleic acid, arachidonic acid, and tryptophan metabolism. In contrast, grape seed procyanidins primarily target PLA2G4A [34], while hawthorn procyanidins act via the AMPK pathway [35]. The phospholipase A2 (PLA2) family, which comprises critical enzymes in phospholipid hydrolysis, converts phospholipids into absorbable free fatty acids, and their activity is positively correlated with the serum level of free fatty acids [36,37]. Here, PSP intervention was found to significantly reduce the levels of phosphatidylcholine and 1-acyl-sn-glycero-3-phosphocholine, indicating that PSP lowers systemic lipid content, probably by inhibiting lipid absorption and then downregulating PLA2G10, PLA2G5, and PLA2G2A expression, ultimately modulating glycerophospholipid, linoleic acid, and arachidonic acid metabolism. CYP1B1 exacerbates hepatic lipid accumulation by inducing lipid phagocytosis [38], while enhanced aryl hydrocarbon receptor (AhR) activation suppresses CYP1B1 expression [39]. Tryptophan degradation metabolites (such as kynurenine) can activate AhR [40,41], indicating that PSP inhibits CYP1B1 expression by elevating the kynurenine level, thereby mitigating hepatic lipid accumulation.
Similar to tea polyphenols and grape seed procyanidin extracts [32,42], PSP also failed to reverse the HFD-induced decline in microbial α-diversity. However, it could selectively remodel the gut microbiota by enriching beneficial bacteria such as Akkermansia and Bacteroides while suppressing harmful bacteria within Firmicutes. Previous studies have demonstrated that Akkermansia enhances energy expenditure and reduces visceral adiposity by secreting the P9 protein to activate brown adipose tissue (BAT) thermogenesis [43]. Bacteroides enhances host metabolism via polysaccharide digestion and SCFA production [44,45]. Bacteroides uniformis converts host primary bile acids into the secondary bile acid 3-succinylated cholic acid, which promotes the growth of Akkermansia muciniphila and subsequently modulates lipid metabolism [46]. Conversely, a reduction in Firmicutes abundance may attenuate excessive SCFA fermentation and lipid synthesis [47,48]. Notably, PSP selectively altered β-diversity rather than restoring α-diversity [42,49], highlighting its targeted modulatory effects.
Hepatic metabolomic analysis revealed that PSP intervention increased the glutamine level. Glutamine participates in α-ketoglutarate synthesis, thereby enhancing mitochondrial TCA cycle efficiency and promoting fatty acid oxidation [50,51,52,53]. PICRUSt-based functional prediction of the gut microbiota further indicated that PSP may modulate glutamine-associated nitrogen and lipid metabolism by downregulating gut microbial glutamine synthetase activity. Similar to the mechanism of inulin fiber, which reverses microbiota-derived free bile acid agonism via the BA-MCY axis to promote bile acid synthesis gene expression and regulate hepatobiliary metabolism in vivo [54], PSP appears to exert its effects through gut-microbiota-mediated glutamine regulation. When gut microbiota perturbation reduces intestinal glutamine synthetase activity, the liver compensatorily elevates the hepatic glutamine level [50,55,56,57]. These findings suggest that PSP may indirectly enhance hepatic glutamine by reducing its intestinal availability, thereby attenuating lipid accumulation and stimulating energy expenditure, which offers novel insights into the gut–liver axis in lipid metabolic regulation.
Given the established role of dysregulated lipid metabolism in pathologies such as non-alcoholic fatty liver disease (NAFLD) and atherosclerosis [58,59], the therapeutic potential of PSP extends beyond basic lipid reduction. Its modulation of lipid homeostasis may deliver positive therapeutic effects for these conditions. NAFLD—a chronic liver disorder characterized by hepatocellular lipid accumulation [60]—can be ameliorated by PSP through suppression of CYP1B1-mediated lipid phagocytosis and enhanced hepatic α-ketoglutarate synthesis via glutamine metabolism, indicating its utility in NAFLD management. Xu et al. confirmed PSP’s capacity to reduce atherosclerotic plaques [15]. Integrated with our data, this benefit likely originates from PSP’s systemic lipid-lowering effects, which inhibit lipid-deposition-driven plaque formation, thereby attenuating atherosclerosis. Since cancer progression is profoundly modulated by lipid metabolism [61], PSP may influence oncogenesis through lipid metabolic regulation. Notably, PICRUSt-based functional analysis revealed that PSP intervention suppresses DNA-synthesis-related enzymatic activity, potentially underpinning its anti-carcinogenic mechanisms.

5. Conclusions

This study systematically deciphered the molecular mechanisms by which PSP ameliorates lipid metabolism disorders by integrating multi-omics approaches. Comprehensive analysis revealed that PSP reduces hepatic lipid content, elevates the hepatic kynurenine level, and downregulates the expression of PLA2G10, PLA2G5, PLA2G2A, and CYP1B1, thereby modulating lipid-metabolism-related pathways, including glycerophospholipid, linoleic acid, arachidonic acid, and tryptophan metabolism. PSP primarily influences lipid metabolism by restructuring the composition of Akkermansia, Bacteroidota, and Firmicutes while concurrently affecting glutamine synthetase activity. In summary, PSP downregulates PLA2G10, PLA2G5, PLA2G2A, and CYP1B1 expression, enhances the hepatic glutamine level via gut-microbiota-mediated modulation, and enriches SCFA-producing and energy-expenditure-stimulating bacterial communities, which collectively regulate lipid absorption, accumulation, and catabolism. This study provides a theoretical basis for the regulation of lipid metabolism by PSP, establishing a “metabolome–target–microbiota” research paradigm. It not only offers conceptual guidance and theoretical support for research on PSP’s improvement of lipid-metabolism-related diseases but also provides methodological approaches for studying bioactive compounds such as procyanidins.

Author Contributions

Conceptualization, J.S. and R.L. (Rui Liu); methodology, J.S.; investigation, J.S., Y.Z., and D.Y.; resources, X.Z.; data curation, J.S.; writing—original draft preparation, J.S.; writing—review and editing, R.L. (Rui Liu) and R.L. (Ruonan Liu); supervision, R.L. (Rui Liu). All authors have read and agreed to the published version of the manuscript.

Funding

This research was funded by the National Natural Science Foundation of China, grant number 32272331.

Institutional Review Board Statement

The animal study procedure was agreed to by the Laboratory Animal Centre of Huazhong Agricultural University (approval no. HZAUMO-2024-0087, approval date 23 March 2024).

Informed Consent Statement

Not applicable.

Data Availability Statement

All other data that support the findings of this study are available from the first author upon reasonable request.

Acknowledgments

The authors thank Zuoxiong Liu for the linguistic modification of this article.

Conflicts of Interest

The authors declare no conflicts of interest.

Abbreviations

The following abbreviations are used in this manuscript:
AhRAryl hydrocarbon receptor
AMPKAdenosine-monophosphate-activated protein kinase
BATBrown adipose tissue
CREGChemical–reaction–enzyme–gene
GLP-1Glucagon-like peptide-1
HFDHigh-fat diet
PPARγPeroxisome proliferator-activated receptor gamma
PSPPeanut-skin-derived procyanidins
SCFAShort-chain fatty acids

Appendix A

Table A1. Composition of experimental diets for animal study.
Feed CodeTP23300TP23302
Protein (casein, L-cystine)/g276194
Carbohydrate (dextrin, sucrose)/g250
Carbohydrate (dextrin, sucrose, corn starch)/g 673
Fat (soybean oil, lard)/g34140
Fiber (cellulose)/g6848
Mineral and vitamin mixture/g6545
Antioxidant (TBHQ)/g0.070.01
Total/g10001000
Table A2. Primer sequence.
Gene NameForward Primer (5′-3′)Reverse Primer (5′-3′)
Pla2g10GTGCAGGTGTGACGAGGAGCACTTGGGAGAGTCCTTCTCA
Pla2g5CCAGGGGGCTTGCTAGAACAGCACCAATCAGTGCCATCC
Pla2g2aTGGCTCAATACAGGACCAAGGGTGGCATCCATAGAAGGCATAG
Cyp1b1CACCAGCCTTAGTGCAGACAGGAGGACCACGGTTTCCGTTG
Table A3. C vs. M and PSP vs. M share analyzable differential metabolites.
NumberHMDBKEGG IDMetabolitesRetention Time (s)
1HMDB0000305C17276Vitamin A4.40_269.2272m/z
2HMDB0000445C06768Alpha-tetrasaccharide8.59_672.2381m/z
3HMDB0000641C00064Glutamine1.05_181.0387m/z
4HMDB0000684C00328Kynurenine1.34_231.0733m/z
5HMDB0000933C16308Traumatic acid1.95_246.1700m/z
6HMDB0001045C16041Enkephalin L9.39_578.2563m/z
7HMDB0001132C01185Nicotinic acid mononucleotide0.89_731.1126m/z
8HMDB0001140C01545Octanal3.09_111.1175m/z
9HMDB0001198C02166Leukotriene C48.76_606.2831m/z
10HMDB0002937C10188Tamarixetin1.29_317.0681m/z
11HMDB0003193C11134Testosterone glucuronide5.73_499.2103m/z
12HMDB0004159C05793L-Urobilin4.12_617.3291m/z
13HMDB0005398C00422TG(18:0/18:0/20:4(5Z,8Z,11Z,14Z))18.72_893.7915m/z
14HMDB0006061C055954-Hydroxyphenylacetylglutamic acid1.07_262.0725m/z
15HMDB0006575C06372Lacto-N-biose I18.61_366.1412m/z
16HMDB0007112C00165DG(16:0/20:4(5Z,8Z,11Z,14Z)/0:0)18.57_616.5089n
17HMDB0007224C00165DG(18:1(9Z)/20:1(11Z)/0:0)12.44_683.5355m/z
18HMDB0007228C00165DG(18:1(9Z)/20:4(5Z,8Z,11Z,14Z)/0:0)10.49_625.5188m/z
19HMDB0007887C00157PC(14:0/22:1(13Z))8.03_826.5726m/z
20HMDB0007991C00157PC(16:0/22:6(4Z,7Z,10Z,13Z,16Z,19Z))8.25_806.5698m/z
21HMDB0008029C00157PC(16:1(9Z)/P-18:1(11Z))9.76_722.5494m/z
22HMDB0008055C00157PC(18:0/22:5(4Z,7Z,10Z,13Z,16Z))7.09_818.6075m/z
23HMDB0008095C00157PC(18:1(11Z)/P-18:1(11Z))4.34_787.6343m/z
24HMDB0008326C00157PC(20:1(11Z)/P-18:1(11Z))11.53_778.6136m/z
25HMDB0008653C00157PC(22:4(7Z,10Z,13Z,16Z)/P-18:0)10.84_802.6133m/z
26HMDB0008816C00157PC(24:1(15Z)/24:1(15Z))4.35_992.7452m/z
27HMDB0010328C03033Tyramine glucuronide8.67_685.2440m/z
28HMDB0010347C03033Octanoylglucuronide18.97_357.0953m/z
29HMDB0010351C0564311-beta-Hydroxyandrosterone-3-glucuronide8.86_481.2455m/z
30HMDB0010386C04230LysoPC(18:2(9Z,12Z))8.76_556.2811m/z
31HMDB0010399C04230LysoPC(22:1(13Z))10.86_577.4089n
32HMDB0010403C04230LysoPC(22:5(7Z,10Z,13Z,16Z,19Z))9.81_568.3387m/z
33HMDB0010408C04230LysoPC(P-18:1(9Z))9.08_542.3018m/z
34HMDB0011750C03372Dihydroxyacetone phosphate acyl ester0.92_178.9747m/z
35HMDB0012107C00550SM (d18:1/24:1(15Z))18.61_813.6849m/z
36HMDB0012108C04230LysoPC (17:0)8.90_509.3504n
37HMDB0013046C02744Psychosine sulfate6.86_540.2838m/z
38HMDB0014363C07663Moxifloxacin7.86_436.1453m/z
39HMDB0014383C07263Nevirapine1.24_303.0645m/z
40HMDB0014498C07777Buclizine5.34_467.2012m/z
41HMDB0014700C12012Tigecycline7.66_566.2610m/z
42HMDB0014878C07937Riluzole18.77_254.9817m/z
43HMDB0014965C08052Cinoxacin1.07_283.0336m/z
44HMDB0015090C07657Netilmicin8.19_475.3029n
45HMDB0015107C07768Azelastine8.86_380.1543m/z
46HMDB0015150C07315Sulfamethoxazole8.12_565.1193m/z
47HMDB0015228C07341Oxamniquine9.45_617.3309m/z
48HMDB0015232C07566Pimozide13.54_981.4670m/z
49HMDB0015383C07543Ergonovine7.36_370.1516m/z
50HMDB0029215C19157Thorium7.50_523.0885m/z
51HMDB0029706C191802-Amino-3-methylimidazo [4,5-f]quinoline18.38_179.0734m/z
52HMDB0030358C09041Aspidospermatine10.98_359.1728m/z
53HMDB0032287C01913Ferrocyanide salts18.66_232.9280m/z
54HMDB0033122C10688Glycosminine0.88_273.0425m/z
55HMDB0035041C11865Gibberellin A519.41_297.1492m/z
56HMDB0035798C09711Piperdial1.38_231.1381m/z
57HMDB0037790C15588Polyethylene glycol4.32_210.1106m/z
58HMDB0040851C08964Calenduloside E10.86_613.3715m/z
59HMDB0040867C103735-O-Methylembelin19.02_309.2065m/z
60HMDB0060669C16584p-Hydroxyfelbamate7.85_567.1954m/z
61HMDB0060676C0749310-Hydroxycarbazepine0.91_291.0529m/z
Table A4. Common targets of PSP bioactive components across disease.
NumberGeneNumberGeneNumberGeneNumberGeneNumberGene
1PPARG24MTRR47CA170POLE93ITPK1
2MT-CYB25MGAT148CA5B71CA394RAD51
3KCNH226TERT49CA1372PLA2G2A95OAT
4NOS327STAT150CA773KLK196PDXK
5MMP928AZGP151MMP1274PTGS197REST
6VEGFA29PGF52MAPT75GABRA198CD1A
7ESR130COL18A153KDR76CAMK2A99ELAVL3
8IAPP31IDH154ALOX1577HSD17B8100MT-CO1
9FLT132ARG155MMP1478KCNE1101TOP1
10FGFR133DNMT156MSH679SQLE102DNM1
11HIF1A34ZPR157YWHAG80CYP1B1103POLB
12PTGS235GOT158CKM81OGT104MTHFD2
13HMOX136ABCB159CA982GABRB2105PCMT1
14FABP137APP60KIT83CRYM106DGKZ
15EGFR38ALPL61BACE184PYGM107MS4A1
16BCL239MET62CA1285MB108GRK6
17ERBB240MMP1363RBP386TYMS109VAV1
18MMP241MAPK1464PGD87GABRG2110AGL
19SRC42CES165CCL2488UPF1111GLB1
20CBS43GRB1466HADHB89PLA2G10112PLA2G5
21HADHA44CA267CYCS90PTPRJ113RNASE2
22ESR245LTF68CA691WARS1114TBXA2R
23FABP346CA469CA5A92GM2A

References

  1. Li, R.; Huang, X.; Liang, X.; Su, M.; Lai, K.P.; Chen, J. Integrated omics analysis reveals the alteration of gut microbe–metabolites in obese adults. Brief. Bioinform. 2021, 22, bbaa165. [Google Scholar] [CrossRef] [PubMed]
  2. People’s Medical Publishing House Co., Ltd. Report on Nutrition and Chronic Disease Status of Chinese Residents (2020); People’s Medical Publishing House Co., Ltd.: Beijing, China, 2020. [Google Scholar]
  3. Berná, G.; López-Bermudo, L.; Escudero-López, B.; Martín, F. Chapter four—We are what we eat: The role of lipids in metabolic diseases. Adv. Food Nutr. Res 2023, 105, 173–219. [Google Scholar]
  4. Townsend, L.K.; Steinberg, G.R. AMPK and the Endocrine Control of Metabolism. Endocr. Rev. 2023, 44, 910–933. [Google Scholar] [CrossRef]
  5. Yesian, A.R.; Chalom, M.M.; Knudsen, N.H.; Hyde, A.L.; Personnaz, J.; Cho, H.; Liou, Y.-H.; Starost, K.A.; Lee, C.-W.; Tsai, D.-Y. Preadipocyte IL-13/IL-13Rα1 signaling regulates beige adipogenesis through modulation of PPARγ activity. J. Clin. Investig. 2025, 135, e169152. [Google Scholar] [CrossRef]
  6. Rue, E.A.; Rush, M.D.; van Breemen, R.B. Procyanidins: A comprehensive review encompassing structure elucidation via mass spectrometry. Phytochem. Rev. 2018, 17, 1–16. [Google Scholar] [CrossRef]
  7. Liu, M.; Yun, P.; Hu, Y.; Yang, J.; Khadka, R.B.; Peng, X. Effects of grape seed proanthocyanidin extract on obesity. Obes. Facts. 2020, 13, 279–291. [Google Scholar] [CrossRef] [PubMed]
  8. Zheng, S.J.; Huang, K.L.; Zhao, C.H.; Xu, W.T.; Sheng, Y.; Luo, Y.B.; He, X.Y. Procyanidin attenuates weight gain and modifies the gut microbiota in high fat diet induced obese mice. J. Funct. Foods 2018, 49, 362–368. [Google Scholar] [CrossRef]
  9. Zhu, W.; Oteiza, P.I. Proanthocyanidins at the gastrointestinal tract: Mechanisms involved in their capacity to mitigate obesity-associated metabolic disorders. Crit. Rev. Food Sci. Nutr. 2024, 64, 220–240. [Google Scholar] [CrossRef] [PubMed]
  10. Zineb, O.Y.; Rashwan, A.K.; Karim, N.; Lu, Y.; Tangpong, J.; Chen, W. Recent developments in procyanidins on metabolic diseases, their possible sources, pharmacokinetic profile, and clinical outcomes. Food Res. Int. 2023, 39, 5255–5278. [Google Scholar] [CrossRef]
  11. National data, National Bureau of Statistics. Available online: https://data.stats.gov.cn/easyquery.htm?cn=C01 (accessed on 7 March 2025).
  12. Zhang, C.; Yang, Q.; Yu, S.; Yu, L.; Bi, J.; Zhu, F. Purification Methods of Proanthocy Anidins from Peanut Skins. Chinese Patent CN101665482B, 5 October 2011. [Google Scholar]
  13. Liu, G.; Shi, A.; Wang, N.; Li, M.; He, X.; Yin, C.; Tu, Q.; Shen, X.; Tao, Y.; Wang, Q.; et al. Polyphenolic proanthocyanidin-B2 suppresses proliferation of liver cancer cells and hepatocellular carcinogenesis through directly binding and inhibiting AKT activity. Redox Biol. 2020, 37, 101701. [Google Scholar] [CrossRef]
  14. Liu, M.; Shen, J.X.; Zhu, X.L.; Ju, T.T.; Willing, B.P.; Wu, X.; Lu, Q.; Liu, R. Peanut skin procyanidins reduce intestinal glucose transport protein expression, regulate serum metabolites and ameliorate hyperglycemia in diabetic mice. Food Res. Int. 2023, 173, 113471. [Google Scholar] [CrossRef] [PubMed]
  15. Xu, M.; Lv, C.; Wang, H.; Lu, Q.; Ye, M.; Zhu, X.; Liu, R. Peanut skin extract ameliorates high-fat diet-induced atherosclerosis by regulating lipid metabolism, inflammation reaction and gut microbiota in ApoE−/− mice. Food Res. Int. 2022, 154, 111014. [Google Scholar] [CrossRef]
  16. Rui, L. Energy metabolism in the liver. Compr Physiol. 2014, 4, 177–197. [Google Scholar] [CrossRef]
  17. Huang, Y.; Sulek, K.; Stinson, S.E.; Holm, L.A.; Kim, M.; Trost, K.; Hooshmand, K.; Lund, M.A.V.; Fonvig, C.E.; Juel, H.B.; et al. Lipid profiling identifies modifiable signatures of cardiometabolic risk in children and adolescents with obesity. Nat. Med. 2025, 31, 294–305. [Google Scholar] [CrossRef]
  18. Bertran, L.; Capellades, J.; Abelló, S.; Richart, C. Untargeted lipidomic analysis of metabolic dysfunction-associated steatohepatitis in women with morbid obesity. PLoS ONE 2025, 20, e0318557. [Google Scholar] [CrossRef] [PubMed]
  19. Tai, Y.; Tian, H.; Yang, X.; Feng, S.; Chen, S.; Zhong, C.; Gao, T.; Gang, X.; Liu, M. Identification of hub genes and candidate herbal treatment in obesity through integrated bioinformatic analysis and reverse network pharmacology. Sci. Rep. 2022, 12, 17113. [Google Scholar] [CrossRef] [PubMed]
  20. Xiao, G.; Zeng, Z.; Jiang, J.; Xu, A.; Li, S.; Li, Y.; Chen, Z.; Chen, W.; Zhang, J.; Bi, X. Network pharmacology analysis and experimental validation to explore the mechanism of Bushao Tiaozhi capsule (BSTZC) on hyperlipidemia. Sci. Rep. 2022, 12, 6992. [Google Scholar] [CrossRef]
  21. Sun, Y.-L.; Zhao, P.-P.; Zhu, C.-B.; Jiang, M.-C.; Li, X.-M.; Tao, J.-L.; Hu, C.-C.; Yuan, B. Integrating metabolomics and network pharmacology to assess the effects of quercetin on lung inflammatory injury induced by human respiratory syncytial virus. Sci. Rep. 2023, 13, 8051. [Google Scholar] [CrossRef]
  22. Plovier, H.; Everard, A.; Druart, C.; Depommier, C.; Van Hul, M.; Geurts, L.; Chilloux, J.; Ottman, N.; Duparc, T.; Lichtenstein, L. A purified membrane protein from Akkermansia muciniphila or the pasteurized bacterium improves metabolism in obese and diabetic mice. Nat. Med. 2017, 23, 107–113. [Google Scholar] [CrossRef]
  23. Kapoor, P.; Tiwari, A.; Sharma, S.; Tiwari, V.; Sheoran, B.; Ali, U.; Garg, M. Effect of anthocyanins on gut health markers, Firmicutes-Bacteroidetes ratio and short-chain fatty acids: A systematic review via meta-analysis. Sci. Rep. 2023, 13, 1729. [Google Scholar] [CrossRef]
  24. Ouyang, J.; Li, X.; Liu, C.; Lu, D.; Ouyang, J.; Zhou, F.; Liu, Q.; Huang, J.; Liu, Z. Junshanyinzhen tea extract prevents obesity by regulating gut microbiota and metabolic endotoxemia in high-fat diet fed rats. Food Sci. Hum. Well 2024, 13, 2036–2047. [Google Scholar] [CrossRef]
  25. Herrera-Balandrano, D.D.; Chai, Z.; Hutabarat, R.P.; Beta, T.; Feng, J.; Ma, K.; Li, D.; Huang, W. Hypoglycemic and hypolipidemic effects of blueberry anthocyanins by AMPK activation: In vitro and in vivo studies. Redox Biol. 2021, 46, 102100. [Google Scholar] [CrossRef] [PubMed]
  26. Xu, L.; Tang, Z.; Herrera-Balandrano, D.D.; Qiu, Z.; Li, B.; Yang, Y.; Huang, W. In vitro fermentation characteristics of blueberry anthocyanins and their impacts on gut microbiota from obese human. Food Res. Int. 2024, 176, 113761. [Google Scholar] [CrossRef] [PubMed]
  27. Tao, W.; Zhang, Y.; Shen, X.; Cao, Y.; Shi, J.; Ye, X.; Chen, S. Rethinking the mechanism of the health benefits of proanthocyanidins: Absorption, metabolism, and interaction with gut microbiota. Compr. Rev. Food Sci. Food Saf. 2019, 18, 971–985. [Google Scholar] [CrossRef]
  28. Liu, M.; Huang, B.J.; Wang, L.; Lu, Q.; Liu, R. Peanut skin procyanidins ameliorate insulin resistance via modulation of gut microbiota and gut barrier in type 2 diabetic mice. J. Sci. Food Agric. 2022, 102, 5935–5947. [Google Scholar] [CrossRef]
  29. Liu-Qing, S.; Yu-Xuan, Y.; Zheng-Yi, L.; Xi-Meng, Z.; En-Lian, M.; Meng-Fei, Z.; Ying-Ying, X. Bioinformatics analysis of key pharmacological pathways of proanthocyanidins combined with allicin against atherosclerosis. In Proceedings of the Second International Conference on Biomedical and Intelligent Systems (IC-BIS2023), Xiamen, China, 28 August 2023; p. 127240N. [Google Scholar]
  30. Chen, W. Gut Microbial Metabolism of Peanut Skin Flavan-3-ols and the Effect of Metabolite on Glucose and Lipid Metabolism of Obese Mice. Ph.D. Thesis, Huazhong Agricultural University, Wuhan, China, 2021. [Google Scholar]
  31. Huang, B.; Wang, L.; Liu, M.; Wu, X.; Lu, Q.; Liu, R. The underlying mechanism of A-type procyanidins from peanut skin on DSS-induced ulcerative colitis mice by regulating gut microbiota and metabolism. J. Food Biochem. 2022, 46, e14103. [Google Scholar] [CrossRef]
  32. Wen, J.-J.; Li, M.-Z.; Chen, C.-H.; Hong, T.; Yang, J.-R.; Huang, X.-J.; Geng, F.; Hu, J.-L.; Nie, S.-P. Tea polyphenol and epigallocatechin gallate ameliorate hyperlipidemia via regulating liver metabolism and remodeling gut microbiota. Food Chem. 2023, 404, 134591. [Google Scholar] [CrossRef]
  33. Zhao, L.; Yan, F.F.; Lu, Q.; Tang, C.E.; Wang, X.H.; Liu, R. UPLC-Q-TOF-MS and NMR identification of structurally different A-type procyanidins from peanut skin and their inhibitory effect on acrylamide. J. Sci. Food Agric. 2022, 102, 7062–7071. [Google Scholar] [CrossRef]
  34. Iqbal, J.; Hussain, M.M. Intestinal lipid absorption. Am. J. Physiol. Endocrinol. Metab. 2009, 296, E1183–E1194. [Google Scholar] [CrossRef]
  35. Han, X.; Zhao, W.; Zhou, Q.; Chen, H.; Yuan, J.; Xiaofu, Z.; Zhang, Z. Procyanidins from hawthorn (Crataegus pinnatifida) alleviate lipid metabolism disorder via inhibiting insulin resistance and oxidative stress, normalizing the gut microbiota structure and intestinal barrier, and further suppressing hepatic inflammation and lipid accumulation. Food Funct. 2022, 13, 7901–7917. [Google Scholar] [CrossRef]
  36. Homan, R.; Hamelehle, K.L. Phospholipase A2 relieves phosphatidylcholine inhibition of micellar cholesterol absorption and transport by human intestinal cell line Caco-21. J. Lipid Res. 1998, 39, 1197–1209. [Google Scholar] [CrossRef]
  37. Engelking, L.R. Chapter 60—Lipid Digestion. In Textbook of Veterinary Physiological Chemistry, 3rd ed.; Engelking, L.R., Ed.; Academic Press: Boston, MA, USA, 2015; pp. 384–389. [Google Scholar]
  38. Bu, K.-B.; Kim, M.; Shin, M.K.; Lee, S.-H.; Sung, J.-S. Regulation of benzo[a]pyrene-induced hepatic lipid accumulation through CYP1B1-induced mTOR-mediated lipophagy. Int. J. Mol. Sci. 2024, 25, 1324. [Google Scholar] [CrossRef] [PubMed]
  39. Alexander, D.L.; Zhang, L.; Foroozesh, M.; Alworth, W.L.; Jefcoate, C.R. Metabolism-based polycyclic aromatic acetylene inhibition of CYP1B1 in 10T1/2 cells potentiates aryl hydrocarbon receptor activity. Toxicol. Appl. Pharmacol. 1999, 161, 123–139. [Google Scholar] [CrossRef]
  40. Dong, F.; Annalora, A.J.; Murray, I.A.; Tian, Y.; Marcus, C.B.; Patterson, A.D.; Perdew, G.H. Endogenous tryptophan-derived Ah receptor ligands are dissociated from CYP1A1/1B1-dependent negative-feedback. Int. J. Tryptophan Res. 2023, 16, 11786469231182508. [Google Scholar] [CrossRef]
  41. Opitz, C.A.; Litzenburger, U.M.; Sahm, F.; Ott, M.; Tritschler, I.; Trump, S.; Schumacher, T.; Jestaedt, L.; Schrenk, D.; Weller, M.; et al. An endogenous tumour-promoting ligand of the human aryl hydrocarbon receptor. Nature 2011, 478, 197–203. [Google Scholar] [CrossRef] [PubMed]
  42. Liu, W.; Zhao, S.; Wang, J.; Shi, J.; Sun, Y.; Wang, W.; Ning, G.; Hong, J.; Liu, R. Grape seed proanthocyanidin extract ameliorates inflammation and adiposity by modulating gut microbiota in high-fat diet mice. Mol. Nutr. Food Res. 2017, 61, 1601082. [Google Scholar] [CrossRef] [PubMed]
  43. Yoon, H.S.; Cho, C.H.; Yun, M.S.; Jang, S.J.; You, H.J.; Kim, J.-h.; Han, D.; Cha, K.H.; Moon, S.H.; Lee, K.; et al. Akkermansia muciniphila secretes a glucagon-like peptide-1-inducing protein that improves glucose homeostasis and ameliorates metabolic disease in mice. Nat. Microbiol. 2021, 6, 563–573. [Google Scholar] [CrossRef]
  44. Louis, P.; Flint, H.J. Formation of propionate and butyrate by the human colonic microbiota. Environ. Microbiol. 2017, 19, 29–41. [Google Scholar] [CrossRef]
  45. Lloyd-Price, J.; Abu-Ali, G.; Huttenhower, C. The healthy human microbiome. Genome Med. 2016, 8, 51. [Google Scholar] [CrossRef]
  46. Nie, Q.; Luo, X.; Wang, K.; Ding, Y.; Jia, S.; Zhao, Q.; Li, M.; Zhang, J.; Zhuo, Y.; Lin, J.; et al. Gut symbionts alleviate MASH through a secondary bile acid biosynthetic pathway. Cell 2024, 187, 2717–2734.e2733. [Google Scholar] [CrossRef]
  47. Lukovac, S.; Belzer, C.; Pellis, L.; Keijser Bart, J.; de Vos Willem, M.; Montijn Roy, C.; Roeselers, G. Differential modulation by Akkermansia muciniphila and Faecalibacterium prausnitzii of host peripheral Lipid metabolism and histone acetylation in mouse gut organoids. mBio 2014, 5. [Google Scholar] [CrossRef] [PubMed]
  48. Perez, V.M.; Gabell, J.; Behrens, M.; Wase, N.; DiRusso, C.C.; Black, P.N. Deletion of fatty acid transport protein 2 (FATP2) in the mouse liver changes the metabolic landscape by increasing the expression of PPARα-regulated genes. J. Biol. Chem. 2020, 295, 5737–5750. [Google Scholar] [CrossRef]
  49. Redondo-Castillejo, R.; Garcimartín, A.; Hernández-Martín, M.; López-Oliva, M.E.; Bocanegra, A.; Macho-González, A.; Bastida, S.; Benedí, J.; Sánchez-Muniz, F.J. Proanthocyanidins: Impact on gut microbiota and intestinal action mechanisms in theprevention and treatment of metabolic syndrome. Int. J. Mol. Sci. 2023, 24, 5369. [Google Scholar] [CrossRef]
  50. Delgado, T.C.; de las Heras, J.; Martínez-Chantar, M.L. Understanding gut-liver axis nitrogen metabolism in Fatty Liver Disease. Front. Endocrinol. 2022, 13, 1058101. [Google Scholar] [CrossRef]
  51. Pierzynowski, S.; Pierzynowska, K. Alpha-ketoglutarate, a key molecule involved in nitrogen circulation in both animals and plants, in the context of human gut microbiota and protein metabolism. Adv. Med. Sci. 2022, 67, 142–147. [Google Scholar] [CrossRef] [PubMed]
  52. Martin, F.; Sprenger, N.; Yap, I.; Wang, Y.; Bibiloni, R.; Rochat, F.; Rezzi, S.; Cherbut, C.; Kochhar, S.; Lindon, J.; et al. Panorganismal gut microbiome-host metabolic crosstalk. J. Proteome Res. 2009, 8, 2090–2105. [Google Scholar] [CrossRef]
  53. Gong, S.; Ma, J.; Li, F.; Li, T.; Liu, G.; Tan, B.; Huang, X.; Yin, J.; Yin, Y. Recent advances in the interaction between gut microbiota/metabolites and host lipid metabolism. Sci. Sin. Vitae 2021, 51, 375–383. [Google Scholar] [CrossRef]
  54. Won, T.H.; Arifuzzaman, M.; Parkhurst, C.N.; Miranda, I.C.; Zhang, B.; Hu, E.; Kashyap, S.; Letourneau, J.; Jin, W.-B.; Fu, Y.; et al. Host metabolism balances microbial regulation of bile acid signalling. Nature 2025, 638, 216–224. [Google Scholar] [CrossRef]
  55. Wang, P.; Wu, P.-F.; Wang, H.-J.; Liao, F.; Wang, F.; Chen, J.-G. Gut microbiome-derived ammonia modulates stress vulnerability in the host. Nat. Metab. 2023, 5, 1986–2001. [Google Scholar] [CrossRef]
  56. Yang, H.; Wang, T.; Qian, C.; Wang, H.; Yu, D.; Shi, M.; Fu, M.; Liu, X.; Pan, M.; Rong, X.; et al. Gut microbial-derived phenylacetylglutamine accelerates host cellular senescence. Nat. Aging 2025, 5, 401–418. [Google Scholar] [CrossRef]
  57. Xiao, L.; Tang, R.; Wang, J.; Wan, D.; Yin, Y.; Xie, L. Gut microbiota bridges the iron homeostasis and host health. Sci. China Life Sci. 2023, 66, 1952–1975. [Google Scholar] [CrossRef] [PubMed]
  58. Mouskeftara, T.; Deda, O.; Papadopoulos, G.; Chatzigeorgiou, A.; Gika, H. Lipidomic analysis of liver and adipose tissue in a high-fat diet-induced non-alcoholic fatty liver disease mice model reveals alterations in lipid metabolism by weight loss and aerobic exercise. Molecules 2024, 29, 1494. [Google Scholar] [CrossRef] [PubMed]
  59. Xu, L.; Yang, Q.; Zhou, J. Mechanisms of abnormal lipid metabolism in the pathogenesis of disease. Int. J. Mol. Sci. 2024, 25, 8465. [Google Scholar] [CrossRef] [PubMed]
  60. Galatou, E.; Mourelatou, E.; Hatziantoniou, S.; Vizirianakis, I.S. Nonalcoholic steatohepatitis (NASH) and atherosclerosis: Explaining their pathophysiology, association and the role of incretin-based drugs. Antioxidants 2022, 11, 1060. [Google Scholar] [CrossRef]
  61. Dutta, A.; Sharma-Walia, N. Curbing Lipids: Impacts ON Cancer and Viral Infection. Int. J. Mol. Sci. 2019, 20, 644. [Google Scholar] [CrossRef]
Figure 1. Schematic diagram of animal experimental.
Nutrients 17 02228 g001
Figure 2. Effects of PSP intervention on the body weight, blood lipids, and hepatic function in HFD mice (n = 8). HDL-C (A), LDL-C (B), TC (C), TG (D), AST (E), ALT (F), H&E (G), and Oil Red O (H) staining of mice liver (200×). Groups: C (10% fat diet), M (60% HFD), L (HFD + 150 mg/kg PSP), H (HFD + 300 mg/kg PSP), O (HFD + 47 mg/kg orlistat). Different letters indicate significant differences between groups (p < 0.05).
Nutrients 17 02228 g002
Figure 3. Multivariate statistical analysis of hepatic lipidomics and metabolomics in mice (n = 8). PCA score plot (A), metabolomics pathway analysis (B), and peak areas of metabolites (C). Groups: C (10% fat diet), M (60% HFD), L (HFD + 150 mg/kg PSP), H (HFD + 300 mg/kg PSP). “*”, “**”, “***”, and “****” represent significance at the levels of p < 0.05, p < 0.01, p < 0.001, and p < 0.0001, respectively.
Nutrients 17 02228 g003
Figure 4. Network pharmacological analysis of PSP and obesity. Network of shared target genes (A), KEGG (B), and tissue expression enrichment (C).
Nutrients 17 02228 g004
Figure 5. Integrated Analysis of Metabolomics– and Network Pharmacology (n = 8). CREG network (A), mRNA Levels of Pla2g1, Pla2g5, Pla2g2a, and Cyp1b1 (B) in the liver tissue. Red hexagons, gray diamonds, green rectangles, purple circles, and yellow circles represent active compounds, reactions, enzymes, genes, and target genes, respectively. Groups: C (10% fat diet), M (60% HFD), L (HFD + 150 mg/kg PSP), H (HFD + 300 mg/kg PSP). Different letters indicate significant differences between groups (p < 0.05). “****” indicates t test p < 0.0001 is significant.
Nutrients 17 02228 g005
Figure 6. Effects of PSP intervention on intestinal microbiota in cecum contents (n = 8). Chao (A), Shannon (B), PCA (C), differences in the relative abundance of intestinal microbiota at the phylum level (D) and genus level (E) between different groups, enzyme heatmap (F), proportion analysis of EC 3.6.4.12, EC 2.7.7.7, EC 2.7.13.3, and EC 6.3.1.2 (G). Groups: C (10% fat diet), M (60% HFD), L (HFD + 150 mg/kg PSP), H (HFD + 300 mg/kg PSP). “*”, “**”, “***”, and “****” represent significance at the levels of p < 0.05, p < 0.01, p < 0.001, and p < 0.0001, respectively.
Nutrients 17 02228 g006
Table 1. Effects of PSP on the body weight, energy intake, and water intake of mice.
GroupCMOLH
Initial body weight/g21.51 ± 0.69 b24.36 ± 1.37 a23.94 ± 0.77 a24.03 ± 0.45 a24.21 ± 0.19 a
Final body weight/g25.94 ± 1.30 b32.94 ± 5.40 a28.74 ± 1.24 b28.08 ± 1.70 b27.53 ± 0.67 b
Body weight gain/g4.43 ± 0.71 b8.57 ± 4.19 a4.80 ± 0.89 b4.05 ± 1.68 b3.31 ± 0.72 b
Energy intake (kcal/d/g)9.37 ± 0.50 c11.10 ± 0.08 b12.63 ± 1.01 a10.53 ± 0.10 b10.91 ± 0.92 b
Note: Different letters in the same line indicate significant differences between groups (p < 0.05, n = 8). Groups: C (10% fat diet), M (60% HFD), L (HFD + 150 mg/kg PSP), H (HFD + 300 mg/kg PSP), O (HFD + 47 mg/kg orlistat).
Disclaimer/Publisher’s Note: The statements, opinions and data contained in all publications are solely those of the individual author(s) and contributor(s) and not of MDPI and/or the editor(s). MDPI and/or the editor(s) disclaim responsibility for any injury to people or property resulting from any ideas, methods, instructions or products referred to in the content.

