
Sustainability of Diets Consumed by UK Adolescents and Associations Between Diet Sustainability and Meeting Nutritional Requirements


Abstract
1. Introduction
2. Materials and Methods
2.1. Study Design and Setting
2.2. Study Population
2.3. Data Collection
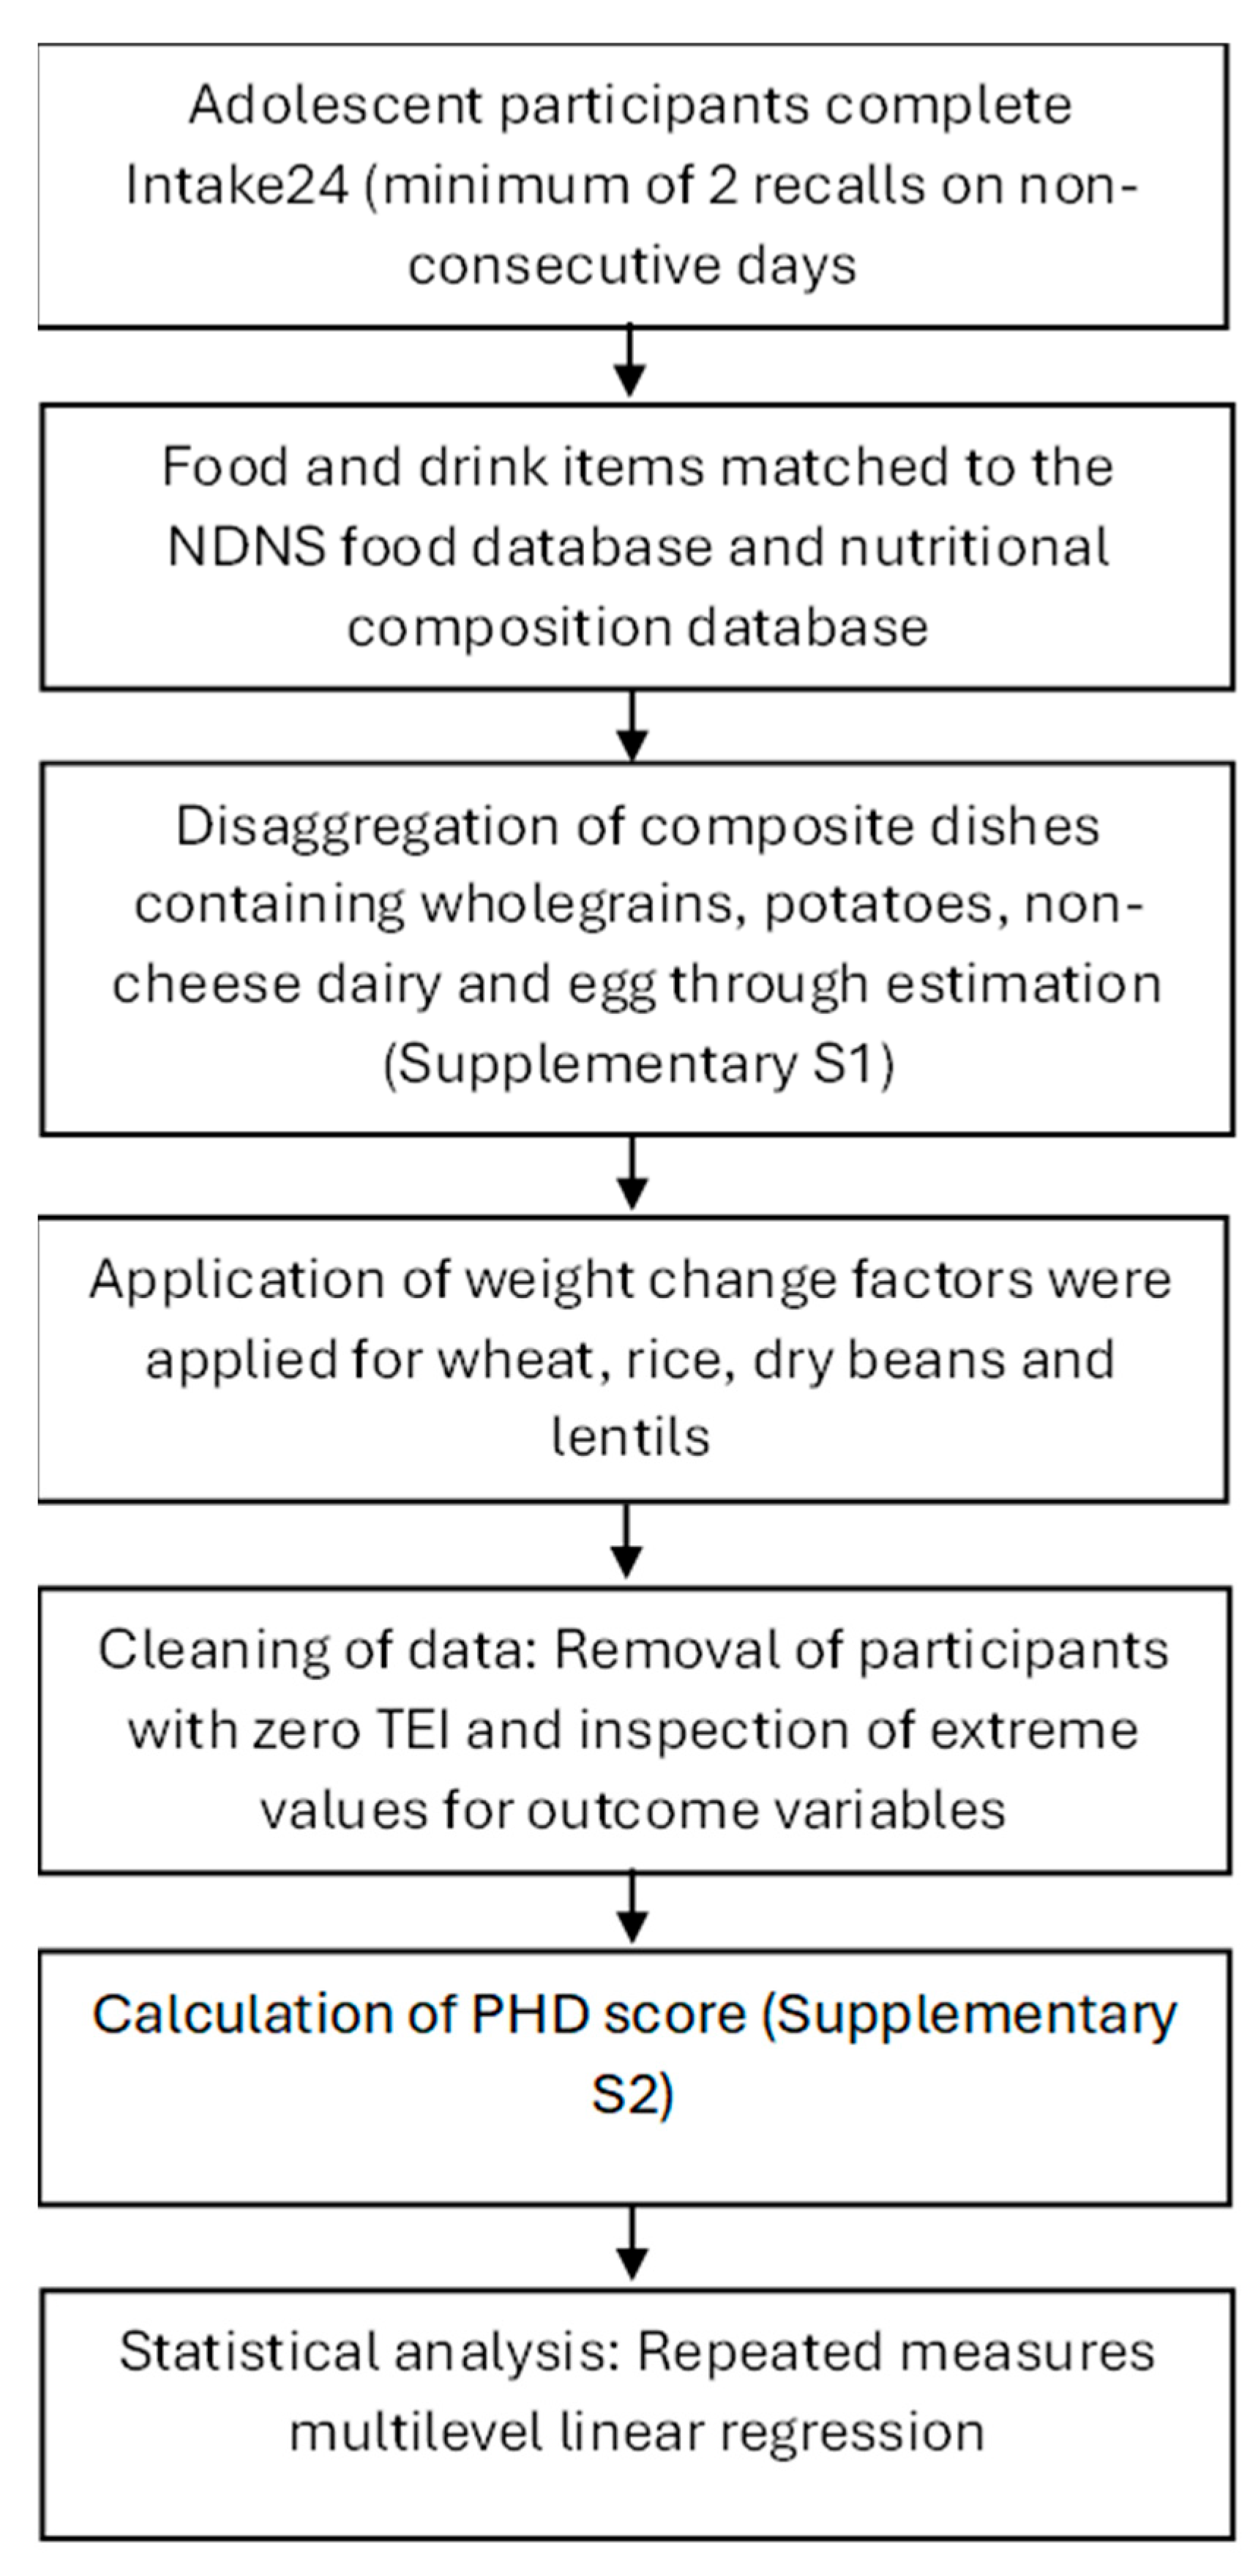
2.4. Data Cleaning
2.5. Disaggregation of Composite Dishes
2.6. Preliminary Stages and Processing of Extreme Values
2.7. Construction of a PHD Index Score
2.8. Statistical Analysis
3. Results
3.1. Participant Characteristics
3.2. Adherence to the PHD
3.3. Relationship Between PHD Index Score and Nutrient Adequacy
4. Discussion
4.1. Adherence to Sustainable Diets
4.2. Nutrient Adequacy of the PHD in Adolescent Populations
4.3. Implications
4.4. Strengths and Limitations
4.5. Implications for Future Research
5. Conclusions
Supplementary Materials
Author Contributions
Funding
Institutional Review Board Statement
Informed Consent Statement
Data Availability Statement
Acknowledgments
Conflicts of Interest
References
- Crippa, M.; Solazzo, E.; Guizzardi, D.; Monforti-Ferrario, F.; Tubiello, F.N.; Leip, A. Food systems are responsible for a third of global anthropogenic GHG emissions. Nat. Food 2021, 2, 198–209. [Google Scholar] [CrossRef] [PubMed]
- FAO. Emissions Due to Agriculture. Global, Regional and Country Trends 2000–2018. 2020. Available online: https://openknowledge.fao.org/server/api/core/bitstreams/cc09fbbc-eb1d-436b-a88a-bed42a1f12f3/content (accessed on 28 May 2025).
- Public Health England. National Diet and Nutrition Survey: Diet, Nutrition and Physical Activity in 2020—A Follow-Up Study During COVID-19. 2020. Available online: https://assets.publishing.service.gov.uk/government/uploads/system/uploads/attachment_data/file/1019663/Follow_up_stud_2020_main_report.pdf (accessed on 28 May 2025).
- Moreno, L.A.; Gottrand, F.; Huybrechts, I.; Ruiz, J.R.; González-Gross, M.; DeHenauw, S. Nutrition and lifestyle in European adolescents: The HELENA (healthy lifestyle in Europe by nutrition in adolescence) study. Adv. Nutr. 2014, 5, 615S–623S. [Google Scholar] [CrossRef] [PubMed]
- Liu, J.; Rehm, C.D.; Onopa, J.; Mozaffarian, D. Trends in diet quality among youth in the United States, 1999–2016. JAMA 2020, 323, 1161–1174. [Google Scholar] [CrossRef]
- Department for Digital, Culture, Media and Sport. Healthy Eating Among Adults. 2024. Available online: https://www.ethnicity-facts-figures.service.gov.uk/health/diet-and-exercise/healthy-eating-of-5-a-day-among-adults/latest/#data-sources (accessed on 28 May 2025).
- Willett, W.; Rockström, J.; Loken, B.; Springmann, M.; Lang, T.; Vermeulen, S.; Garnett, T.; Tilman, D.; DeClerck, F.; Wood, A.; et al. Food in the Anthropocene: The EAT-Lancet Commission on healthy diets from sustainable food systems. Lancet 2019, 393, 447–492. [Google Scholar] [CrossRef]
- Abrams, S.A. Bone Health and Calcium Requirements in Adolescents. 2023. Available online: https://www.uptodate.com/contents/bone-health-and-calcium-requirements-in-adolescents (accessed on 21 August 2023).
- Powers, J.M. Iron Requirements and Iron Deficiency in Adolescents. 2023. Available online: https://www.uptodate.com/contents/iron-requirements-and-iron-deficiency-in-adolescents (accessed on 21 August 2023).
- Neufingerl, N.; Eilander, A. Nutrient Intake and Status in Adults Consuming Plant-Based Diets Compared to Meat-Eaters: A Systematic Review. Nutrients 2021, 14, 29. [Google Scholar] [CrossRef] [PubMed]
- Siri-Tarino, P.W.; Sun, Q.; Hu, F.B.; Krauss, R.M. Saturated fat, carbohydrate, and cardiovascular disease. Am. J. Clin. Nutr. 2010, 91, 502–509. [Google Scholar] [CrossRef]
- Farvid, M.S.; Sidahmed, E.; Spence, N.D.; Mante Angua, K.; Rosner, B.A.; Barnett, J.B. Consumption of red meat and processed meat and cancer incidence: A systematic review and meta-analysis of prospective studies. Eur. J. Epidemiol. 2021, 36, 937–951. [Google Scholar] [CrossRef]
- Day, L.; Cakebread, J.A.; Loveday, S.M. Food proteins from animals and plants: Differences in the nutritional and functional properties. Trends Food Sci. Technol. 2022, 119, 428–442. [Google Scholar] [CrossRef]
- Hurrell, R.; Egli, I. Iron bioavailability and dietary reference values. Am. J. Clin. Nutr. 2010, 91, 1461S–1467S. [Google Scholar] [CrossRef]
- British Nutrition Foundation. Nutrition Requirements. 2021. Available online: https://www.nutrition.org.uk/media/nmmewdug/nutrition-requirements.pdf (accessed on 21 August 2023).
- Ludwig-Borycz, E.; Neumark-Sztainer, D.; Larson, N.; Baylin, A.; Jones, A.D.; Webster, A.; Bauer, K.W. Personal, behavioural and socio-environmental correlates of emerging adults’ sustainable food consumption in a cross-sectional analysis. Public. Health Nutr. 2023, 26, 1306–1316. [Google Scholar] [CrossRef]
- Montejano Vallejo, R.; Schulz, C.A.; van de Locht, K.; Oluwagbemigun, K.; Alexy, U.; Nöthlings, U. Associations of Adherence to a Dietary Index Based on the EAT-Lancet Reference Diet with Nutritional, Anthropometric, and Ecological Sustainability Parameters: Results from the German DONALD Cohort Study. J. Nutr. 2022, 152, 1763–1772. [Google Scholar] [CrossRef] [PubMed]
- Xu, C.; Cao, Z.; Yang, H.; Hou, Y.; Wang, X.; Wang, Y. Association Between the EAT-Lancet Diet Pattern and Risk of Type 2 Diabetes: A Prospective Cohort Study. Front. Nutr. 2021, 8, 784018. [Google Scholar] [CrossRef]
- Colizzi, C.; Harbers, M.C.; Vellinga, R.E.; Verschuren, W.M.M.; Boer, J.M.A.; Biesbroek, S.; Temme, E.H.M.; van der Schouw, Y.T. Adherence to the EAT-Lancet Healthy Reference Diet in Relation to Risk of Cardiovascular Events and Environmental Impact: Results From the EPIC-NL Cohort. J. Am. Heart Assoc. 2023, 12, e026318. [Google Scholar] [CrossRef]
- Zhang, S.; Dukuzimana, J.; Stubbendorff, A.; Ericson, U.; Borné, Y.; Sonestedt, E. Adherence to the EAT-Lancet diet and risk of coronary events in the Malmö Diet and Cancer cohort study. Am. J. Clin. Nutr. 2023, 117, 903–909. [Google Scholar] [CrossRef] [PubMed]
- Langmann, F.; Ibsen, D.B.; Tjønneland, A.; Olsen, A.; Overvad, K.; Dahm, C.C. Adherence to the EAT-Lancet diet is associated with a lower risk of type 2 diabetes: The Danish Diet, Cancer and Health cohort. Eur. J. Nutr. 2023, 62, 1493–1502. [Google Scholar] [CrossRef] [PubMed]
- Berthy, F.; Brunin, J.; Allès, B.; Reuzé, A.; Touvier, M.; Hercberg, S.; Lairon, D.; Pointereau, P.; Mariotti, F.; Baudry, J.; et al. Higher adherence to the EAT-Lancet reference diet is associated with higher nutrient adequacy in the NutriNet-Santé cohort: A cross-sectional study. Am. J. Clin. Nutr. 2023, 117, 1174–1185. [Google Scholar] [CrossRef]
- Pallan, M.; Murphy, M.; Morrison, B.; Sitch, A.; Adamson, A.; Bartington, S.; Dobell, A.; Duff, R.; Frew, E.; Griffin, T.; et al. National school food standards in England: A cross-sectional study to explore compliance in secondary schools and impact on pupil nutritional intake. Int. J. Behav. Nutr. Phys. Act. 2024, 21, 123. [Google Scholar] [CrossRef]
- Amoutzopoulos, B.; Steer, T.; Roberts, C.; Collins, D.; Trigg, K.; Barratt, R.; Abraham, S.; Cole, D.J.; Mulligan, A.; Foreman, J.; et al. Rationalisation of the UK Nutrient Databank for Incorporation in a Web-Based Dietary Recall for Implementation in the UK National Diet and Nutrition Survey Rolling Programme. Nutrients 2022, 14, 4551. [Google Scholar] [CrossRef]
- Public Health England. McCance and Widdowson’s The Composition of Foods Integrated Dataset 2021. 2021. Available online: https://www.gov.uk/government/publications/composition-of-foods-integrated-dataset-cofid (accessed on 21 August 2023).
- Murphy, M.; Pallan, M.; Lancashire, E.; Duff, R.; Adamson, A.J.; Bartington, S.; Frew, E.; Griffin, T.; Hurley, K.L.; Parry, J.; et al. The Food provision, cUlture and Environment in secondary schooLs (FUEL) study: Protocol of a mixed methods evaluation of national School Food Standards implementation in secondary schools and their impact on pupils’ dietary intake and dental health. BMJ Open 2020, 10, e042931. [Google Scholar] [CrossRef]
- Ministry of Housing, Communities & Local Government. English Indices of Deprivation 2019. 2019. Available online: https://www.gov.uk/government/statistics/english-indices-of-deprivation-2019 (accessed on 28 May 2025).
- National Institute for Public Health and the Environment. Dutch Food Composition Database (NEVO). 2021. Available online: https://www.rivm.nl/en/dutch-food-composition-database (accessed on 21 August 2023).
- Fitt, E.; Mak, T.N.; Stephen, A.M.; Prynne, C.; Roberts, C.; Swan, G.; Farron-Wilson, M. Disaggregating composite food codes in the UK National Diet and Nutrition Survey food composition databank. Eur. J. Clin. Nutr. 2010, 64 (Suppl. 3), S32–S36. [Google Scholar] [CrossRef]
- Cosgrove, M.; Flynn, A.; Kiely, M. Impact of disaggregation of composite foods on estimates of intakes of meat and meat products in Irish adults. Public. Health Nutr. 2005, 8, 327–337. [Google Scholar] [CrossRef]
- Food Standards Australia New Zealand. Weight Change Factors. 2020. Available online: https://www.foodstandards.gov.au/business/labelling/nutrition-panel-calculator/weight-change-factors (accessed on 24 June 2025).
- Stubbendorff, A.; Sonestedt, E.; Ramne, S.; Drake, I.; Hallström, E.; Ericson, U. Development of an EAT-Lancet index and its relation to mortality in a Swedish population. Am. J. Clin. Nutr. 2022, 115, 705–716. [Google Scholar] [CrossRef]
- Cacau, L.T.; Benseñor, I.M.; Goulart, A.C.; Cardoso, L.O.; Santos, I.S.; Lotufo, P.A.; Moreno, L.A.; Marchioni, D.M. Adherence to the EAT-Lancet sustainable reference diet and cardiometabolic risk profile: Cross-sectional results from the ELSA-Brasil cohort study. Eur. J. Nutr. 2023, 62, 807–817. [Google Scholar] [CrossRef]
- InterClimate Network. Youth Climate Action Research Report 2021. 2021. Available online: https://interclimate.org/wp-content/uploads/2021/11/ICN-Youth-Climate-Action-Research-Report-2021.pdf (accessed on 28 May 2025).
- Lanham, A.R.; van der Pols, J.C. Toward Sustainable Diets-Interventions and Perceptions Among Adolescents: A Scoping Review. Nutr. Rev. 2024, 83, E35. [Google Scholar] [CrossRef] [PubMed]
- Raghoebar, S.; Mesch, A.; Gulikers, J.; Winkens, L.H.H.; Wesselink, R.; Haveman-Nies, A. Experts’ perceptions on motivators and barriers of healthy and sustainable dietary behaviors among adolescents: The SWITCH project. Appetite 2024, 194, 107196. [Google Scholar] [CrossRef] [PubMed]
- Niklewicz, A.; Smith, A.D.; Smith, A.; Holzer, A.; Klein, A.; McCaddon, A.; Molloy, A.M.; Wolffenbuttel, B.H.R.; Nexo, E.; McNulty, H.; et al. The importance of vitamin B. Eur. J. Nutr. 2023, 62, 1551–1559. [Google Scholar] [CrossRef] [PubMed]
- Office for National Statistics. Population Estimates by Ethnic Group, England and Wales. 2021. Available online: https://www.ons.gov.uk/peoplepopulationandcommunity/culturalidentity/ethnicity/datasets/populationestimatesbyethnicgroupenglandandwales (accessed on 15 December 2023).
- Office for National Statistics. Mapping Income Deprivation at a Local Authority Level. 2021. Available online: https://www.ons.gov.uk/peoplepopulationandcommunity/personalandhouseholdfinances/incomeandwealth/datasets/mappingincomedeprivationatalocalauthoritylevel (accessed on 15 December 2023).
- Burrows, T.L.; Martin, R.J.; Collins, C.E. A systematic review of the validity of dietary assessment methods in children when compared with the method of doubly labeled water. J. Am. Diet. Assoc. 2010, 110, 1501–1510. [Google Scholar] [CrossRef]
- Ravelli, M.N.; Schoeller, D.A. Traditional self-reported dietary instruments are prone to inaccuracies and new approaches are needed. Front. Nutr. 2020, 7, 90. [Google Scholar] [CrossRef]


| EAT-Lancet Recommendations (g/day) | 3 Points | 2 Points | 1 Point | 0 Points | |
|---|---|---|---|---|---|
| Wholegrains * | 232 (0–60% of energy) | >232 | 116–232 | 58–116 | <58 |
| Potatoes and cassava | 50 (0–100) | <50 | 50–100 | 100–150 | >150 |
| All vegetables * | 300 (200–600) | >300 | 200–300 | 100–200 | <100 |
| All fruit * | 200 (100–300) | >200 | 100–200 | 50–100 | <50 |
| Dairy foods | 250 (0–500) | <250 | 250–500 | 500–750 | >750 |
| Beef, lamb, and pork | 14 (0–28) | <14 | 14–28 | 28–42 | >42 |
| Chicken and other poultry | 29 (0–58) | <29 | 29–58 | 58–87 | >87 |
| Eggs | 13 (0–25) | <13 | 13–25 | 25–37.5 | >37.5 |
| Fish * | 28 (0–100) | >28 | 14–28 | 7–14 | <7 |
| Dry beans, lentils, and peas *,† | 50 (0–100) | >75 | 37.5–75 | 18.75–37.5 | <18.75 |
| Soy foods *,† | 25 (0–50) | ||||
| Peanuts *,‡ | 25 (0–75) | >50 | 25–50 | 12.5–25 | <12.5 |
| Tree nuts *,‡ | 25 | ||||
| Unsaturated oils | 40 (20–80) | >40 | 20–40 | 10–20 | <10 |
| All sweeteners | 31 (0–31) | <15.5 | 15.5–31 | 31–46.5 | >46.5 |
| Mean (SD) | Number (%) | PHD Score, Mean (SD) | |
|---|---|---|---|
| Total | 2273 (100) | 14.2 (3.3) | |
| Age, years | 13.7 | ||
| Sex | |||
| Female | 1269 (55.8) | 14.6 (3.3) | |
| Male | 928 (40.8) | 13.6 (3.2) | |
| Other * | 76 (3.3) | 14.8 (3.3) | |
| Ethnic group | |||
| White | 1576 (69.3) | 14.1 (3.3) | |
| Asian or Asian British | 359 (15.8) | 14.6 (3.3) | |
| Black, African, Caribbean, or Black British | 123 (5.4) | 13.9 (3.4) | |
| Mixed or multiple | 128 (5.6) | 14.4 (3.3) | |
| Other † | 87 (3.8) | 14.6 (3.9) | |
| IMD quintile | |||
| 1 (most deprived) | 578 (25.4) | 13.8 (3.2) | |
| 2 | 379 (16.7) | 14.1 (3.4) | |
| 3 | 457 (20.1) | 14.4 (3.2) | |
| 4 | 444 (19.5) | 14.3 (3.3) | |
| 5 (least deprived) | 415 (18.3) | 14.5 (3.5) | |
| Number of 24 h recalls | |||
| 1 | 1227 (54.0) | ||
| 2 | 1046 (46.0) |
| Number (%) Meeting PHD Recommendation | ||||
|---|---|---|---|---|
| Female | Male | Other | p-Value | |
| Wholegrains | 80 (6.3) | 75 (8.1) | 5 (6.6) | 0.27 |
| Potatoes and cassava | 945 (74.5) | 726 (78.2) | 64 (84.2) | 0.03 * |
| All vegetables | 100 (7.9) | 69 (7.4) | 5 (6.6) | 0.87 |
| All fruit | 385 (30.3) | 248 (26.7) | 16 (21.1) | 0.06 |
| Dairy foods | 1202 (94.7) | 815 (87.8) | 73 (96.1) | <0.001 * |
| Beef, lamb, and pork | 794 (62.6) | 439 (47.3) | 41 (54.0) | <0.001 * |
| Chicken and other poultry | 914 (72.0) | 649 (69.9) | 62 (81.6) | 0.08 |
| Eggs | 1207 (95.1) | 883 (95.2) | 74 (97.4) | 0.67 |
| Fish | 212 (16.7) | 114 (12.3) | 11 (14.5) | 0.02 * |
| Legumes | 77 (6.1) | 43 (4.6) | 5 (6.6) | 0.32 |
| Nuts | 13 (1.0) | 16 (1.7) | 0 (0.0) | 0.21 |
| Unsaturated oils | 3 (0.2) | 1 (0.1) | 0 (0.0) | 0.73 |
| All sweeteners | 333 (26.2) | 228 (24.6) | 28 (36.8) | 0.06 |
| Number (%) Meeting PHD Recommendation | ||||||
|---|---|---|---|---|---|---|
| White | Asian | Black | Mixed | Other | p-Value | |
| Wholegrains | 104 (6.6) | 31 (8.6) | 8 (6.5) | 13 (10.2) | 4 (4.6) | 0.33 |
| Potatoes and cassava | 1198 (76.0) | 269 (74.9) | 96 (78.1) | 102 (79.7) | 70 (80.5) | 0.68 |
| All vegetables | 114 (7.2) | 26 (7.2) | 15 (12.2) | 12 (9.4) | 7 (8.1) | 0.33 |
| All fruit | 472 (30.0) | 88 (24.5) | 27 (22.0) | 35 (27.3) | 27 (31.0) | 0.12 |
| Dairy foods | 1461 (92.7) | 315 (87.7) | 113 (91.9) | 121 (94.5) | 80 (92.0) | 0.03 * |
| Beef, lamb, and pork | 793 (50.3) | 259 (72.1) | 81 (65.9) | 77 (60.2) | 64 (73.6) | <0.001 * |
| Chicken and other poultry | 1157 (73.4) | 250 (69.6) | 77 (62.6) | 80 (62.5) | 61 (70.1) | 0.010 * |
| Eggs | 1510 (95.8) | 331 (92.2) | 115 (93.5) | 124 (96.9) | 84 (96.6) | 0.04 * |
| Fish | 240 (15.2) | 59 (16.4) | 11 (8.9) | 17 (13.3) | 10 (11.5) | 0.26 |
| Legumes | 89 (5.7) | 25 (7.0) | 2 (1.6) | 5 (3.9) | 4 (4.6) | 0.21 |
| Nuts | 17 (1.1) | 6 (1.7) | 2 (1.6) | 1 (0.8) | 3 (3.5) | 0.34 |
| Unsaturated oils | 2 (0.1) | 2 (0.6) | 0 (0.0) | 0 (0.0) | 0 (0.0) | 0.44 |
| All sweeteners | 396 (25.1) | 108 (30.1) | 27 (22.0) | 37 (28.9) | 21 (24.1) | 0.24 |
| Number (%) Meeting PHD Recommendation | ||||||
|---|---|---|---|---|---|---|
| IMD Quintile 1 (Most Deprived) | IMD Quintile 2 | IMD Quintile 3 | IMD Quintile 4 | IMD Quintile 5 (Least Deprived) | p-Value | |
| Wholegrains | 29 (5.0) | 31 (8.2) | 32 (7.0) | 35 (7.9) | 33 (8.0) | 0.25 |
| Potatoes and cassava | 404 (69.9) | 275 (72.6) | 367 (80.3) | 353 (79.5) | 336 (90.0) | <0.001 * |
| All vegetables | 33 (5.7) | 27 (7.1) | 31 (6.8) | 45 (10.1) | 38 (9.2) | 0.06 |
| All fruit | 129 (22.3) | 108 (28.5) | 148 (32.4) | 123 (27.7) | 141 (34.0) | <0.001 * |
| Dairy foods | 537 (92.9) | 353 (93.1) | 426 (93.2) | 406 (91.4) | 368 (88.7) | 0.072 |
| Beef, lamb, and pork | 357 (61.8) | 218 (57.5) | 268 (58.6) | 226 (50.9) | 205 (49.4) | <0.001 * |
| Chicken and other poultry | 388 (67.1) | 275 (72.6) | 321 (70.2) | 337 (75.9) | 304 (73.3) | 0.029 * |
| Eggs | 556 (96.2) | 364 (96.0) | 436 (95.4) | 419 (94.4) | 389 (93.7) | 0.34 |
| Fish | 82 (14.2) | 48 (12.7) | 60 (13.1) | 71 (16.0) | 76 (18.3) | 0.13 |
| Legumes | 32 (5.5) | 25 (6.6) | 21 (4.6) | 25 (5.6) | 22 (5.3) | 0.80 |
| Nuts | 3 (0.5) | 6 (1.6) | 5 (1.1) | 9 (2.0) | 6 (1.5) | 0.28 |
| Unsaturated oils | 1 (0.2) | 0 (0.0) | 1 (0.2) | 0 (0.0) | 2 (0.5) | 0.45 |
| All sweeteners | 144 (24.9) | 99 (26.1) | 130 (28.5) | 98 (22.1) | 118 (28.4) | 0.16 |
| Unadjusted | Adjusted † | ||||
|---|---|---|---|---|---|
| Regression Co-Efficient (CI) | p-Value | Regression Co-Efficient (CI) | p-Value | ||
| Micronutrients | |||||
| % RNI | Iron | −2.7 (−3.3, −2.1) | <0.001 | −2.1 (−2.7, −1.5) | <0.001 * |
| Calcium | −3.0 (−3.8, −2.1) | <0.001 | −3.2 (−4.1, −2.3) | <0.001 * | |
| Vitamin B12 | −13.8 (−17.2, −10.4) | <0.001 | −12.9 (−16.3, −9.4) | <0.001 * | |
| Vitamin D | −0.5 (−0.8, −0.2) | 0.001 | −0.4 (−0.7, −0.2) | 0.003 * | |
| Zinc | −3.3 (−3.8, −2.8) | <0.001 | −3.2 (−3.7, −2.7) | <0.001 * | |
| Iodine | −2.4 (−3.1, −1.6) | <0.001 | −2.2 (−2.9, −1.4) | <0.001 * | |
| Macronutrients | |||||
| % RI | Fibre | −0.1 (−0.5, 0.3) | 0.70 | 0.01 (−0.4, 0.4) | 0.97 |
| % TEI | Carbohydrates | 0.4 (0.3, 0.5) | <0.001 | 0.4 (0.3, 0.6) | <0.001 * |
| g | Omega−3 fats | −0.04 (−0.06, −0.03) | <0.001 | −0.04 (−0.06, −0.03) | <0.001 * |
| Protein | −2.9 (−3.3, −2.6) | <0.001 | −2.8 (−3.2, −2.4) | <0.001 * | |
Disclaimer/Publisher’s Note: The statements, opinions and data contained in all publications are solely those of the individual author(s) and contributor(s) and not of MDPI and/or the editor(s). MDPI and/or the editor(s) disclaim responsibility for any injury to people or property resulting from any ideas, methods, instructions or products referred to in the content. |
© 2025 by the authors. Licensee MDPI, Basel, Switzerland. This article is an open access article distributed under the terms and conditions of the Creative Commons Attribution (CC BY) license (https://creativecommons.org/licenses/by/4.0/).
Share and Cite
Ashraf, A.; Murphy, M.; Duff, R.; Adab, P.; Pallan, M. Sustainability of Diets Consumed by UK Adolescents and Associations Between Diet Sustainability and Meeting Nutritional Requirements. Nutrients 2025, 17, 2140. https://doi.org/10.3390/nu17132140
Ashraf A, Murphy M, Duff R, Adab P, Pallan M. Sustainability of Diets Consumed by UK Adolescents and Associations Between Diet Sustainability and Meeting Nutritional Requirements. Nutrients. 2025; 17(13):2140. https://doi.org/10.3390/nu17132140
Chicago/Turabian StyleAshraf, Ayesha, Marie Murphy, Rhona Duff, Peymane Adab, and Miranda Pallan. 2025. "Sustainability of Diets Consumed by UK Adolescents and Associations Between Diet Sustainability and Meeting Nutritional Requirements" Nutrients 17, no. 13: 2140. https://doi.org/10.3390/nu17132140
APA StyleAshraf, A., Murphy, M., Duff, R., Adab, P., & Pallan, M. (2025). Sustainability of Diets Consumed by UK Adolescents and Associations Between Diet Sustainability and Meeting Nutritional Requirements. Nutrients, 17(13), 2140. https://doi.org/10.3390/nu17132140